自己株式の取得状況および取得終了に関するお知らせ
Bull 3
Bear 0
Capital return
2802
Fiscal year ends March
Quarters are offset from the calendar — Q1 is Apr–Jun
|
Ajinomoto Co., Inc. is a diversified group comprising 105 consolidated subsidiaries and 15 equity-method affiliates. The company operates across several business segments, including seasonings, nutrition and processed foods, solutions and ingredients, frozen foods, pharmaceutical and food-grade amino acids, biopharma services (CDMO), and functional materials such as electronic materials. Key subsidiaries include Ajinomoto Foods, Ajinomoto AGF, Ajinomoto Frozen Foods, Ajinomoto Healthy Supply, Ajinomoto Omniche, Forge Biologics, and Ajinomoto Fine-Techno. The group also holds stakes in Yamaki, J-オイルミルズ, and EA Pharma. Its products and services are distributed globally, with specific operations in Thailand, Indonesia, Vietnam, the Philippines, Malaysia, Nigeria, Brazil, Peru, and Europe. The company provides contract development and manufacturing organizations (CDMO) services and supplies functional materials for electronic applications. Summarised from the annual report, fiscal year ended Mar 2026 |
Industry Packaged Foods | Homepage ajinomoto.co.jp |
| Sector Consumer Defensive | IR page ajinomoto.co.jp | |
|
Tags
seasonings, amino acids, frozen foods, biopharma services, cdmo, functional materials, electronic materials, processed foods, nutritional ingredients, Ajinomoto Foods, Ajinomoto AGF, Thai Ajinomoto, Thai Ajinomoto Sales, One Thai Foods, Indonesia Ajinomoto, Indonesia Ajinomoto Sales, Ajinex International, Vietnam Ajinomoto, Philippines Ajinomoto, Malaysia Ajinomoto, Nigeria Ajinomoto Foods, Brazil Ajinomoto, Peru Ajinomoto, Promasidor Holdings, Europe Ajinomoto Foods, Ajinomoto Bakery, Delica Ace, Yamaki, Ajinomoto Frozen Foods, Ajinomoto Foods North America, Ajinomoto Healthy Supply, Ajinomoto Health and Nutrition North America, Shanghai Ajinomoto Amino Acid, Ajinomoto Omniche, Forge Biologics, Ajinomoto Fine-Techno, Ajinomoto Direct, EA Pharma, F-LINE, Ajinomoto Engineering, Ajinomoto Communications, NRI System Techno
|
Press page — |
Metrics
| Valuation | |
|---|---|
| Market cap | ¥ 4.867T |
| Market cap (USD) | $ 30.42B |
| P/E | 30.55 |
| PEG | 2.40 |
| P/BV | 5.82 |
| P/S | 2.90 |
| P/OCF | 22.11 |
| P/FCF | 43.72 |
| Dividend yield | 0.96% |
| Turnover / mcap | — |
| Returns | |
|---|---|
| ROE | 16.2% |
| ROI | 12.7% |
| ROIC | 14.0% |
| Profit margin | 8.5% |
| Growth | |
|---|---|
| Revenue growing | Yes |
| Profits growing | Yes |
| Revenue up 3y | Yes |
| Revenue up 5y | Yes |
| Earnings growth 3y (net profit CAGR) | 12.7% |
| Quality | |
|---|---|
| Profitable | Yes |
| Margin expanding | Yes |
| Buying back stock | No |
| Diluting (TTM) | No |
| Debt/Equity | — |
| Podcast bulls (TTM) | Sign up |
| Podcast bears (TTM) | Sign up |
| Podcast sentiment (TTM) | Sign up |
| Podcast sentiment % (TTM) | Sign up |
| News sentiment (TTM) | 0 |
| Quality score | 36.8% |
| Insiders | |
|---|---|
| Buys, 1w | Sign up |
| Buys, 1m | Sign up |
| Buys, 1y | Sign up |
| Sells, 1w | Sign up |
| Sells, 1m | Sign up |
| Sells, 1y | Sign up |
Sign up to see this company's insider trades
| Figure | FY 2026 | FY 2025 | FY 2024 | FY 2023 | FY 2022 | FY 2021 | FY 2020 | FY 2019 | FY 2018 | FY 2017 | FY 2016 | FY 2015 | FY 2014 | FY 2013 |
|---|---|---|---|---|---|---|---|---|---|---|---|---|---|---|
| Revenue | 1.584T | 1.531T | 1.439T | 1.359T | 1.149T | 1.071T | 1.1T | 1.127T | 1.15T | 1.091T | 1.184T | 1.007T | 951.359B | 984.967B |
| Net profit | 134.675B | 70.272B | 87.121B | 94.065B | 75.725B | 59.416B | 18.837B | 29.698B | 60.741B | 52.595B | 63.427B | 46.495B | 42.159B | 48.373B |
| Free cash flow | 134.801B | 114.808B | 96.052B | 44.594B | 71.734B | 79.613B | 32.815B | 43.249B | — | — | — | — | — | — |
| Figure | FY 2026 | FY 2025 | FY 2024 | FY 2023 | FY 2022 | FY 2021 | FY 2020 | FY 2019 | FY 2018 | FY 2017 | FY 2016 | FY 2015 | FY 2014 | FY 2013 |
|---|---|---|---|---|---|---|---|---|---|---|---|---|---|---|
| Share price | 4.401K | 2.959K | 5.663K | 4.613K | 3.476K | 2.264K | 2.011K | 1.77K | 1.924K | 2.197K | 2.538K | 2.633K | 1.456K | 1.415K |
| Price performance 12m | 0.49 | -0.48 | 0.23 | 0.33 | 0.54 | 0.13 | 0.14 | -0.08 | -0.12 | -0.13 | -0.04 | 0.81 | 0.03 | — |
Filed figures
Lines the statements and their notes report beside the headline figures, read from the filings' XBRL as filed (no restatement applied), with figures computed from one filing's own lines. Cash-flow lines carry their cash direction: an outflow is negative. Each period links to its filing; a figure's period, report date and tag are in its tooltip.
| Figure | Mar 2017 | Mar 2018 | Mar 2019 | Mar 2020 | Mar 2021 | Mar 2022 | Mar 2023 | Mar 2024 | Mar 2025 | Mar 2026 |
|---|---|---|---|---|---|---|---|---|---|---|
| Balance sheet detail | ||||||||||
| Borrowings, current (JPY) | — | 15.3B | 11B | 8.04B | 10.8B | 8.22B | 12.6B | 97.6B | 5.92B | 6.35B |
| Borrowings, non-current (JPY) | — | 140B | 137B | 124B | 142B | 132B | 120B | 105B | 212B | 206B |
| Cash and deposits (JPY) | 181B | 188B | 154B | 142B | 182B | 151B | 133B | 172B | 165B | 107B |
| Intangible assets (JPY) | — | 66.1B | 66.1B | 69.2B | 72.2B | 68.3B | 65.9B | 97.8B | 92.2B | 92.2B |
| Net debt (borrowings + leases - cash) (JPY) | — | -32.3B | -5.58B | -9.52B | -28.9B | -11.6B | -630M | 30.6B | 52.9B | 106B |
| Cash flow detail | ||||||||||
| Operating cash flow (JPY) | 108B | 127B | 123B | 115B | 166B | 146B | 118B | 168B | 210B | 239B |
| Purchases of property, plant and equipment (JPY) | — | -70.7B | -70.2B | -73.7B | -76.9B | -73.8B | -68.4B | -65.8B | -88.1B | -96.4B |
| Purchases of intangible assets (JPY) | — | -7.24B | -9.82B | -8.34B | -9.15B | -6.88B | -4.66B | -6.24B | -6.99B | -8.1B |
| Change in inventories (cash effect) (JPY) | — | -11.3B | -3.88B | -2.09B | -8.09B | -17.9B | -41.6B | 4.35B | -9.55B | -12.4B |
| Dividends paid (cash effect) (JPY) | — | -17.1B | -18.5B | -17.6B | -17.5B | -27.3B | -31.6B | -38.4B | -39.1B | -43.2B |
| Share buybacks (cash effect) (JPY) | — | -2.69B | -40.1B | -6M | -7M | -40B | -30B | -91.3B | -90.7B | -130B |
| Interest paid (cash effect) (JPY) | — | -2.92B | -3.24B | -3.52B | -3.37B | -3.23B | -3.75B | -4.83B | -7.13B | -7.31B |
| Free cash flow (OCF - PPE - intangibles) (JPY) | — | 48.7B | 43.2B | 32.8B | 79.6B | 64.9B | 44.6B | 96.1B | 115B | 135B |
| Income detail | ||||||||||
| Research and development expense (JPY) | — | 27.8B | 27.8B | 27.6B | 25.9B | 24.8B | 25.9B | 28.8B | 30.9B | 32.1B |
| ↳ 5y CAGR | -1.5% | +0.7% | +2.3% | +4.4% | ||||||
| Total comprehensive income (JPY) | 62B | 57.5B | 36.3B | -17.6B | 118B | 143B | 149B | 200B | 72.5B | 214B |
| Comprehensive income to owners (JPY) | — | 47.1B | 25.5B | -23.6B | 107B | 135B | 141B | 180B | 61.1B | 197B |
| Reported | Jun 27, 2017 | Jun 25, 2019 | Jun 25, 2019 | Jun 24, 2020 | Jun 23, 2021 | Jun 23, 2022 | Jun 27, 2023 | Jun 25, 2024 | Jun 18, 2025 | Jun 12, 2026 |
Sign up to see institutional holdings
Sign UpPodcast Mentions
Sign up to see podcast mentions and sentiment
Sign UpTimely disclosures published on TDnet, newest first, titles as filed in Japanese. The link opens the disclosure on TDnet. Filings with EDINET (periodic reports, extraordinary reports, offerings, holding and buy-back reports), newest first, titles as filed in Japanese. The link opens the filing on EDINET. Press releases from the company's own website, newest first.
自己株券買付状況報告書(法24条の6第1項に基づくもの)
Bull 0
Bear 0
Routine
通期連結業績予想の修正及び剰余金の配当(中間配当)並びに配当予想の修正に関するお知らせ
Bull 3
Bear 0
Guidance


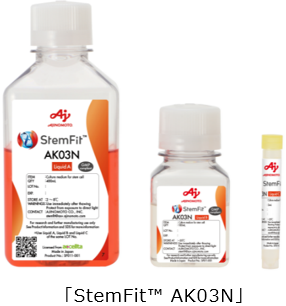 味の素株式会社(社長:中村 茂雄 本社:東京都中央区)は、2015年より再生医療用培地「StemFit™」の供給を通じて、iPS細胞を用いた再生医療・細胞治療の研究および実用化を支援してきました。
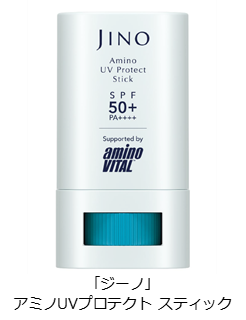 味の素株式会社(社長:中村 茂雄 本社:東京都中央区)は、アミノ酸スキンケアブランド「ジーノ」より、アミノUVプロテクト スティック(1品種)を、2026年9月24日(木)より通販サイト限定で販売開始します。本製品は、「アミノバイタル®」を通じて蓄積してきたスポーツを楽しむ方のニーズに関する知見と、「ジーノ」が培ってきたアミノ酸スキンケア技術を組み合わせて開発した日やけ止めです。スポーツを楽しむ方が、紫外線だけでなく、肌の乾燥にも悩みを抱えていることに着目し、アミノ酸系セラミド類似成分「エルデュウ®」※1を配合しました。肌のうるおいを保ちながら、紫外線から肌を守ります。また、透明なスティック形状とすることで、スポーツ時や外出先でも手軽に塗り直すことができます。
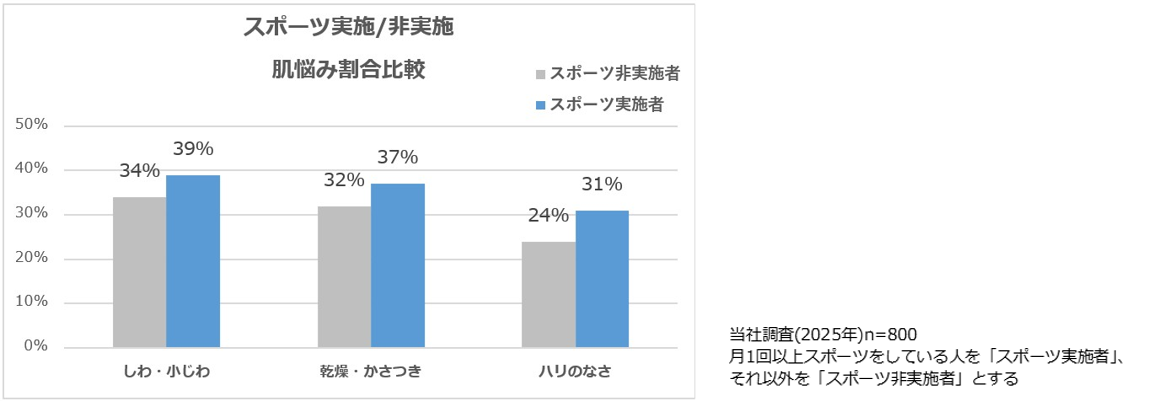 ジーノ アミノUVプロテクト スティックは、スポーツ時の乾燥対策と使いやすさの両立を目指した日やけ止めです。保湿成分として、「ジーノ」ブランドでも採用しているアミノ酸系セラミド類似成分である「エルデュウ®」を配合し、肌のうるおいを保ちます。また、「ジーノ」のスキンケア製品として初めて、当社独自開発のアミノ酸系ゲル化剤「GP-1」※2を配合しました。これにより透明なスティックを実現し、鏡がない環境でも塗布しやすく、スポーツ時や外出先でも手軽に塗り直すことができます。メイクの上からも使用できるため、日常生活を含めたさまざまなシーンでご使用いただけます。
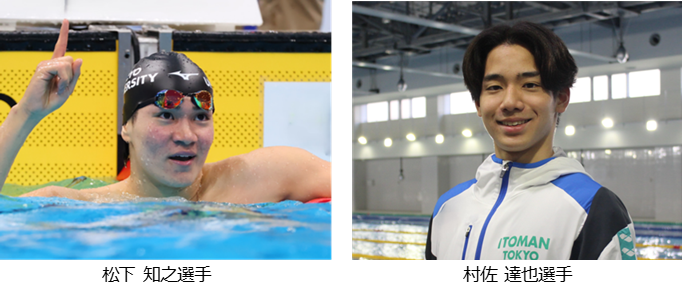 当社は、「アミノサイエンス®で人・社会・地球のWell-beingに貢献する」という味の素グループの志(パーパス)の実現に向けて、スポーツ栄養支援を通して様々なアスリートを応援しています。


Prompts
Click prompts to add them under the company line, click again to take one out, then copy the result into your AI chat. Shared by Asian Century Stocks and Uncovered Thai Stocks. Thank you.
Ajinomoto Co., Inc. (ticker 2802), listed in Japan.
Copied
ETFs Holding Ajinomoto Co., Inc.
Exchange-traded funds whose newest published daily portfolio holds one of the company's listings, largest weight first.
| ETF | Weight in ETF | Shares | Market value | As of |
|---|---|---|---|---|
| JPAN | 1.95% | 5,400 | $ 195.134K | Jun 30, 2026 |
| AIS | 0.31% | 86,426 | $ 2.231M | Nov 17, 2026 |
| DIHP | 0.19% | 480,000 | $ 12.788M | Nov 12, 2026 |
| NTSI | 0.19% | 26,000 | $ 939.535K | Jun 30, 2026 |
| CGIC | 0.18% | 182,000 | $ 4.701M | Nov 16, 2026 |
| DFAI | 0.08% | 524,400 | $ 13.971M | Nov 12, 2026 |
| AVDE | 0.05% | 372,100 | $ 9.555M | Nov 16, 2026 |
| DXIV | 0.05% | 4,100 | $ 109.231K | Nov 12, 2026 |
| DFAX | 0.04% | 198,500 | $ 5.288M | Nov 12, 2026 |
| DFIC | 0.04% | 249,400 | $ 6.644M | Nov 12, 2026 |
| AVSD | 0.03% | 4,800 | $ 123.261K | Nov 16, 2026 |