|
Sojitz Corporation is a Japanese general trading company that operates globally across diverse sectors. Its business segments include automotive, aviation and social infrastructure, energy and healthcare, metals and resources, chemicals, agribusiness, and retail and consumer services. Key activities involve trading finished vehicles, managing business jets and rail infrastructure, investing in renewable energy and LNG, trading coal and iron ore, handling organic and inorganic chemicals, and distributing food and consumer goods. The company serves markets in Asia, the Americas, Europe, and Australia through a network of subsidiaries and equity-method affiliates. Notable subsidiaries include Sojitz Aerospace, Sojitz Machinery, Sojitz Planet, and Sojitz Food. The group also engages in logistics, insurance, and professional services to support its core trading and manufacturing operations. Summarised from the annual report, fiscal year ended Mar 2026 |
Industry Conglomerates | Homepage sojitz.com |
| Sector Industrials | IR page sojitz.com/jp | |
|
Tags
general trading, automotive trading, aviation services, renewable energy, lng, metals trading, chemicals, agribusiness, food distribution, logistics, infrastructure investment, Sojitz Auto Group Japan, Albert Automotive Holdings, Sojitz de Puerto Rico Corporation, SILABA MOTORS, Petroautos, Sojitz Aerospace, Japcon, Phenix Jet International, Long Duc Investment, SOMEC, PT. Puradelta Lestari, UGL Transport Holdings, Sojitz Machinery, Sojitz Mirai Power, Starwind Offshore, Sojitz Global Investment, Ellis Air Group, CLIMATECH GROUP HOLDINGS, Sojitz Hospital PPP Investment, SOJITZ HEALTHCARE AUSTRALIA, NEXT GREEN GROUP, Royal Healthcare, McClure Company, Freestate Electric, Capella Capital, LNG Japan, Qualitas Medical, Sojitz Ject, Sojitz Development, Sojitz Resources (Australia), Metal One, Japan Alumina Associates, Sojitz Planet, Plamaters, Japan A&L, PT. Kaltim Methanol Industri, Sojitz SOLVADIS, Sojitz Building Materials, Thai Central Chemical, Saigon Paper Corporation, Atlas Fertilizer Corporation, Japan Vietnam Fertilizer Company, Sojitz Food, Marine Foods, Try Industry, Sojitz Fashion, Sojitz Infinity, Sojitz Life One, Sojitz Royal Inflight Catering, DaiTanViet, Royal Holdings, JALUX, Fuji Nippon, Sojitz Kyushu, Sojitz Tech Innovation, Sojitz Logistics, Sojitz Insurance, Sojitz Tourist, Sojitz Shared Services, Sojitz General Research Institute
|
Press page sojitz.com/jp/ir/news |
Metrics
| Valuation | |
|---|---|
| Market cap | ¥ 1.168T |
| Market cap (USD) | $ 7.298B |
| P/E | 9.54 |
| PEG | — |
| P/BV | 0.96 |
| P/S | 0.37 |
| P/OCF | -204.66 |
| P/FCF | -26.40 |
| Dividend yield | 3.0% |
| Turnover / mcap | — |
| Returns | |
|---|---|
| ROE | 9.6% |
| ROI | 4.2% |
| ROIC | 4.2% |
| Profit margin | 3.8% |
| Growth | |
|---|---|
| Revenue growing | Yes |
| Profits growing | No |
| Revenue up 3y | No |
| Revenue up 5y | No |
| Earnings growth 3y (net profit CAGR) | -2.3% |
| Quality | |
|---|---|
| Profitable | Yes |
| Margin expanding | No |
| Buying back stock | Yes |
| Diluting (TTM) | No |
| Debt/Equity | — |
| Podcast bulls (TTM) | Sign up |
| Podcast bears (TTM) | Sign up |
| Podcast sentiment (TTM) | Sign up |
| Podcast sentiment % (TTM) | Sign up |
| News sentiment (TTM) | 0 |
| Quality score | -11.1% |
| Insiders | |
|---|---|
| Buys, 1w | Sign up |
| Buys, 1m | Sign up |
| Buys, 1y | Sign up |
| Sells, 1w | Sign up |
| Sells, 1m | Sign up |
| Sells, 1y | Sign up |
Sign up to see this company's insider trades
| Figure | FY 2026 | FY 2025 | FY 2024 | FY 2023 | FY 2022 | FY 2021 | FY 2020 | FY 2019 | FY 2018 | FY 2017 | FY 2016 | FY 2015 | FY 2014 | FY 2013 |
|---|---|---|---|---|---|---|---|---|---|---|---|---|---|---|
| Revenue | 2.757T | 2.51T | 2.415T | 2.48T | 2.101T | 1.602T | 1.755T | 1.856T | 1.816T | 1.555T | 1.658T | 1.81T | 1.803T | 1.748T |
| Net profit | 103.611B | 110.636B | 100.765B | 111.247B | 82.332B | 27.001B | 60.821B | 70.419B | 56.842B | 40.76B | 36.526B | 33.075B | 27.25B | 13.448B |
| Free cash flow | -28.976B | -63.592B | 85.094B | 133.376B | 38.014B | 61.083B | 8.942B | 58.531B | — | — | — | — | — | — |
| Figure | FY 2026 | FY 2025 | FY 2024 | FY 2023 | FY 2022 | FY 2021 | FY 2020 | FY 2019 | FY 2018 | FY 2017 | FY 2016 | FY 2015 | FY 2014 | FY 2013 |
|---|---|---|---|---|---|---|---|---|---|---|---|---|---|---|
| Share price | 6.122K | 3.288K | 3.975K | 2.758K | 2.009K | 312.67 | 253.68 | 389.14 | 341.05 | 279.63 | 230.77 | 200.94 | 176.12 | 145.13 |
| Price performance 12m | 0.86 | -0.17 | 0.44 | 0.37 | 5.42 | 0.23 | -0.35 | 0.14 | 0.22 | 0.21 | 0.15 | 0.14 | 0.21 | — |
Filed figures
Lines the statements and their notes report beside the headline figures, read from the filings' XBRL as filed (no restatement applied), with figures computed from one filing's own lines. Cash-flow lines carry their cash direction: an outflow is negative. Each period links to its filing; a figure's period, report date and tag are in its tooltip.
| Figure | Mar 2017 | Mar 2018 | Mar 2019 | Mar 2020 | Mar 2021 | Mar 2022 | Mar 2023 | Mar 2024 | Mar 2025 | Mar 2026 |
|---|---|---|---|---|---|---|---|---|---|---|
| Balance sheet detail | ||||||||||
| Trade receivables (JPY) | — | 550B | 691B | 638B | 636B | 791B | 795B | 827B | 900B | 1.09T |
| ↳ YoY growth | +25.6% | -7.6% | -0.3% | +24.4% | +0.4% | +4.0% | +8.8% | +21.4% | ||
| ↳ 5y CAGR | +7.7% | +3.7% | +7.1% | +11.4% | ||||||
| Borrowings, current (JPY) | — | 113B | 150B | 187B | 159B | 231B | 168B | 164B | 200B | 299B |
| Borrowings, non-current (JPY) | — | 798B | 724B | 706B | 750B | 822B | 716B | 743B | 887B | 996B |
| Lease liabilities (JPY) | — | — | — | 79B | 77.2B | 75.3B | 71.4B | 105B | 103B | 106B |
| Cash and deposits (JPY) | 309B | 305B | 286B | 273B | 288B | 272B | 247B | 196B | 192B | 245B |
| Intangible assets (JPY) | — | 44.1B | 49.1B | 43.4B | 61.5B | 85B | 70.8B | 92.2B | 114B | 145B |
| Right-of-use assets (JPY) | — | — | — | 74.1B | 72.8B | 69.7B | 65.6B | 97.5B | 90.7B | 93.5B |
| Net debt (borrowings + leases - cash) (JPY) | — | 606B | 588B | 700B | 698B | 856B | 708B | 816B | 997B | 1.16T |
| Cash flow detail | ||||||||||
| Operating cash flow (JPY) | 857M | 98.8B | 96.5B | 40.5B | 85B | 65.1B | 172B | 112B | -16.7B | 16.8B |
| Purchases of property, plant and equipment (JPY) | — | -29.6B | -30.8B | -24.7B | -23.9B | -18.4B | -25.7B | -27.1B | -43.4B | -40.1B |
| Purchases of intangible assets (JPY) | — | -2.31B | -7.11B | -6.9B | -6.77B | -8.7B | -12.6B | -4.12B | -3.54B | -5.68B |
| Change in receivables (cash effect) (JPY) | — | 7.98B | 77.1B | 66.7B | 1.16B | -96.1B | 22.1B | -57.5B | -55.8B | -123B |
| Change in inventories (cash effect) (JPY) | — | -118B | -40B | 901M | 29.9B | -26B | -41.7B | 48B | 12B | -26.3B |
| Change in payables (cash effect) (JPY) | — | 166B | -74.7B | -95B | -14.9B | 52B | 26.2B | 36B | -65.3B | 78.6B |
| Dividends paid (cash effect) (JPY) | — | -11.3B | -16.9B | -22.5B | -16.4B | -16.4B | -29.2B | -29.5B | -31.7B | -33.2B |
| Share buybacks (cash effect) (JPY) | — | -4M | -691M | -10.1B | -5B | -15.2B | -139M | -42.7B | -24B | -9.98B |
| Interest paid (cash effect) (JPY) | — | -14.8B | -15.1B | -14.4B | -12.2B | -12B | -18.5B | -26.1B | -26.2B | -30.3B |
| Income taxes paid (cash effect) (JPY) | — | -15.9B | -24.2B | -13.5B | -9.41B | -11.2B | -48.1B | -41B | -12B | -19.7B |
| Operating cash flow before change in receivables (JPY) | — | 90.8B | 19.4B | -26.2B | 83.8B | 161B | 150B | 170B | 39.1B | 140B |
| Free cash flow (OCF - PPE - intangibles) (JPY) | — | 66.9B | 58.5B | 8.94B | 54.3B | 38B | 133B | 81B | -63.6B | -29B |
| Income detail | ||||||||||
| Total comprehensive income (JPY) | — | 51.3B | 54.9B | -2.36B | 63B | 149B | 146B | 173B | 106B | 193B |
| Comprehensive income to owners (JPY) | 40.3B | 47.4B | 50.9B | -4.22B | 59.1B | 142B | 138B | 168B | 103B | 188B |
| Reported | Jun 20, 2017 | Jun 20, 2019 | Jun 20, 2019 | Jun 18, 2020 | Jun 18, 2021 | Jun 17, 2022 | Jun 20, 2023 | Jun 18, 2024 | Jun 16, 2025 | Jun 9, 2026 |
Sign up to see institutional holdings
Sign UpPodcast Mentions
Sign up to see podcast mentions and sentiment
Sign UpTimely disclosures published on TDnet, newest first, titles as filed in Japanese. The link opens the disclosure on TDnet. Filings with EDINET (periodic reports, extraordinary reports, offerings, holding and buy-back reports), newest first, titles as filed in Japanese. The link opens the filing on EDINET. Press releases from the company's own website, newest first.


 双日公式Instagram

 New way, New value by Sojitz Person
 プロジェクト紹介
 社員インタビュー
 New way, New value by Sojitz Person
 プロジェクト紹介
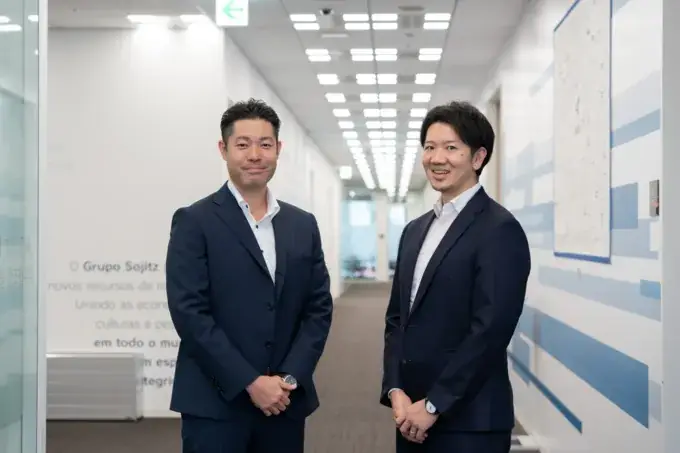 社員インタビュー
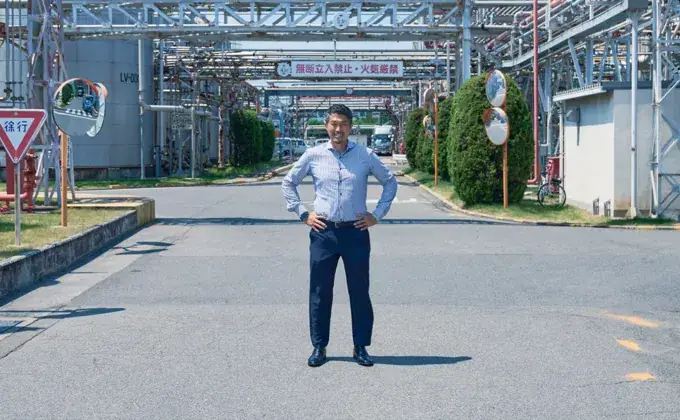 New way, New value by Sojitz Person
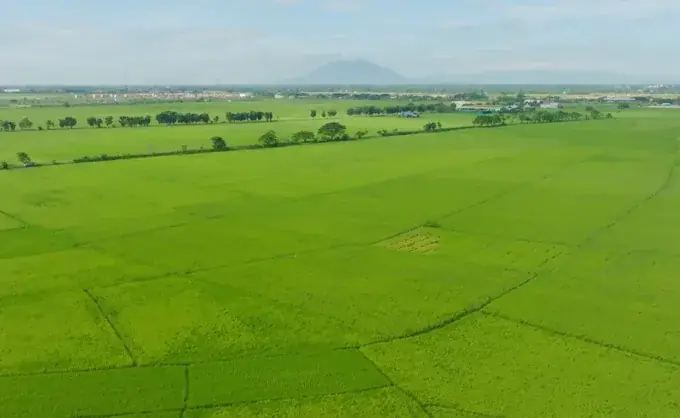 プロジェクト紹介
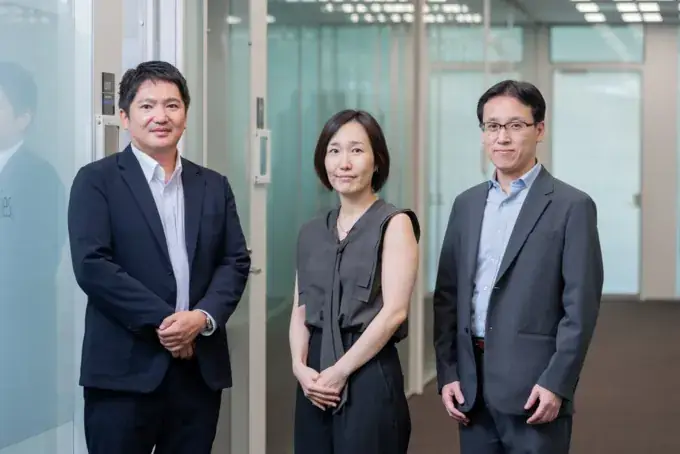 社員インタビュー
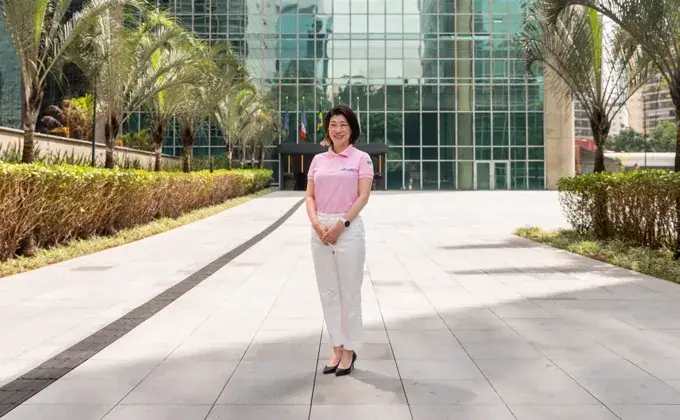 New way, New value by Sojitz Person
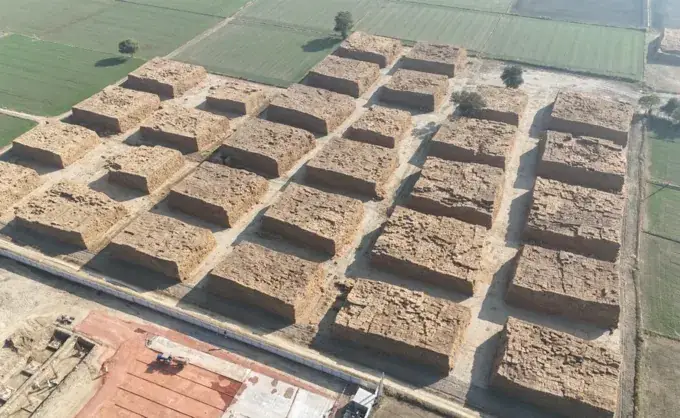 プロジェクト紹介
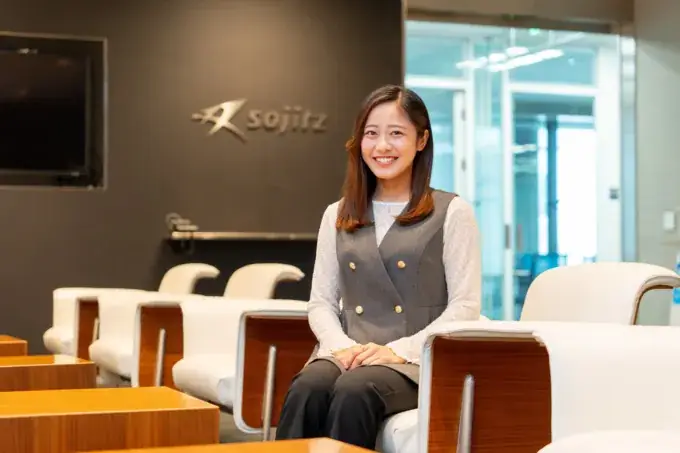 社員インタビュー
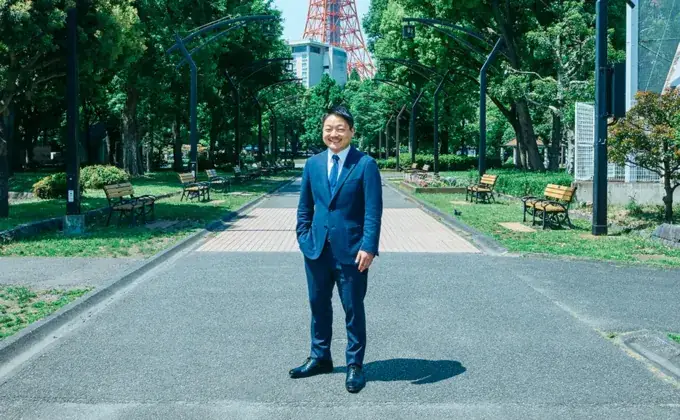 New way, New value by Sojitz Person
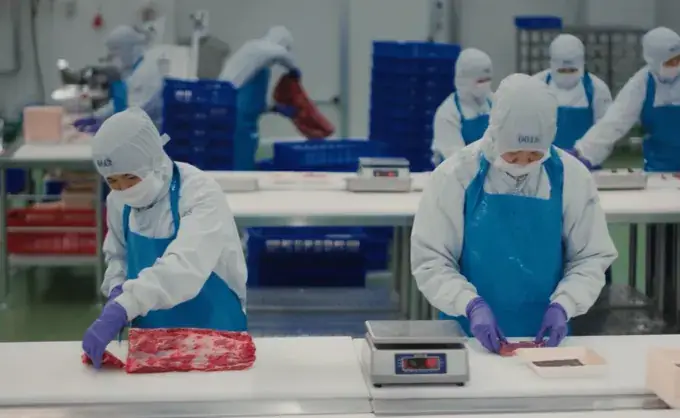 プロジェクト紹介
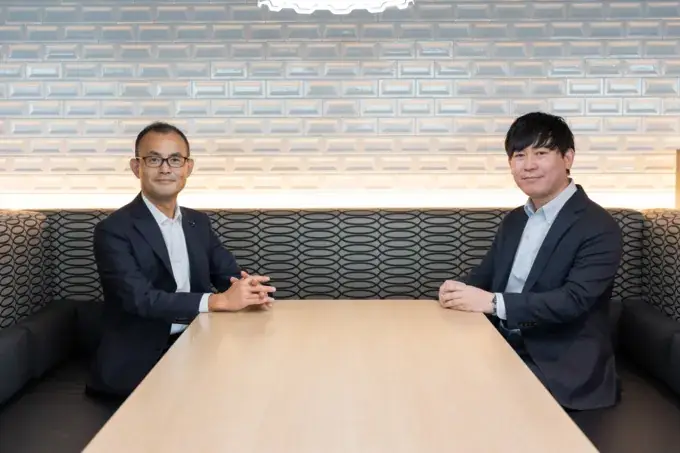 社員インタビュー



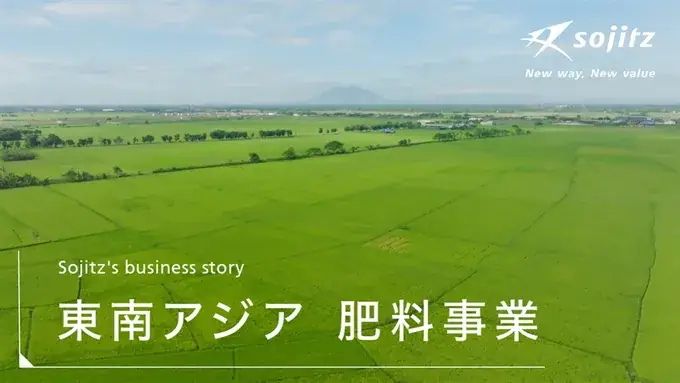
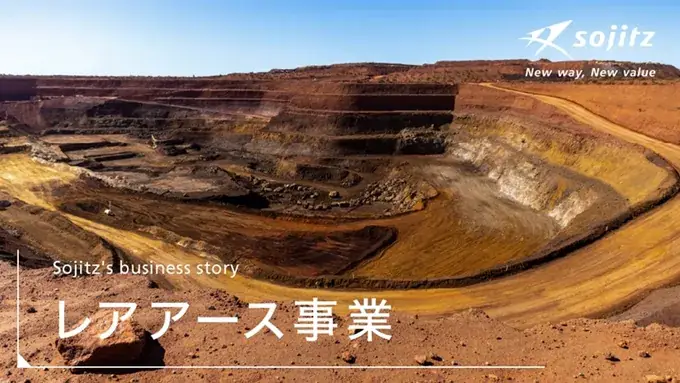






 双日公式 X


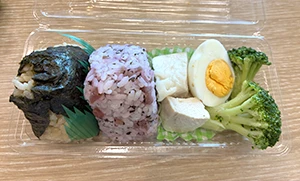 本年度の双日おにぎり弁当


Prompts
Click prompts to add them under the company line, click again to take one out, then copy the result into your AI chat. Shared by Asian Century Stocks and Uncovered Thai Stocks. Thank you.
ETFs Holding Sojitz Corporation
Exchange-traded funds whose newest published daily portfolio holds one of the company's listings, largest weight first.
| ETF | Weight in ETF | Shares | Market value | As of |
|---|---|---|---|---|
| ORR | 0.96% | 109,343 | $ 3.49M | Nov 18, 2026 |
| DFIV | 0.10% | 645,760 | $ 21.352M | Nov 12, 2026 |
| AVDE | 0.06% | 340,080 | $ 10.986M | Nov 16, 2026 |
| DFIC | 0.05% | 221,400 | $ 7.32M | Nov 12, 2026 |
| DFAI | 0.03% | 184,020 | $ 6.085M | Nov 12, 2026 |
| DFAX | 0.03% | 110,600 | $ 3.657M | Nov 12, 2026 |
| DXIV | 0.02% | 1,500 | $ 49.597K | Nov 12, 2026 |
| AVIV | 0.00% | 600 | $ 19.382K | Nov 16, 2026 |