2027年3月期 第2四半期 決算説明資料
Bull 4
Bear 0
Results
Fiscal year ends March
Quarters are offset from the calendar — Q1 is Apr–Jun
|
Geo Holdings Corporation operates a retail network focused on the buy-sell of second-hand goods and the rental of media. The company manages two primary business segments: the Second Street business, which handles the acquisition and sale of used clothing, accessories, and home appliances, and the Geo business, which specializes in the buy-sell of games, smartphones, and electronics, the sale of new games, and the rental of DVDs, CDs, and comics. The group also engages in wholesale distribution of these goods and operates online services and e-commerce platforms. Key subsidiaries include Gao Second Street, Gao Store, World Mobile, and OKURA, which manages the luxury segment. The company serves customers in Japan and international markets through entities such as 2nd STREET USA, 2nd STREET TRADING MALAYSIA, and 2nd STREET TAIWAN. Summarised from the annual report, fiscal year ended Mar 2026 |
Industry Specialty Retail | Homepage geonet.co.jp |
| Sector Consumer Cyclical | IR page geonet.co.jp/ir/library | |
|
Tags
second-hand retail, used clothing, used electronics, media rental, video games, smartphones, e-commerce, wholesale distribution, luxury goods, Gao Second Street, Gao Store, World Mobile, OKURA, Ookura Investments Limited, BANK OKURA, viviON, Aisis, 2nd STREET USA Inc., 2nd STREET TRADING MALAYSIA Sdn. Bhd., 2nd STREET TAIWAN Co. Ltd., 2nd STREET (THAILAND) Company Limited
|
Press page geonet.co.jp/news |
Metrics
| Valuation | |
|---|---|
| Market cap | ¥ 91.661B |
| Market cap (USD) | $ 572.89M |
| P/E | 8.89 |
| PEG | 0.58 |
| P/BV | 0.90 |
| P/S | 0.18 |
| P/OCF | 5.04 |
| P/FCF | 31.12 |
| Dividend yield | 1.5% |
| Turnover / mcap | — |
| Returns | |
|---|---|
| ROE | 9.3% |
| ROI | 4.6% |
| ROIC | 5.3% |
| Profit margin | 1.8% |
| Growth | |
|---|---|
| Revenue growing | Yes |
| Profits growing | No |
| Revenue up 3y | No |
| Revenue up 5y | No |
| Earnings growth 3y (net profit CAGR) | 15.4% |
| Quality | |
|---|---|
| Profitable | Yes |
| Margin expanding | No |
| Buying back stock | No |
| Diluting (TTM) | No |
| Debt/Equity | — |
| Podcast bulls (TTM) | Sign up |
| Podcast bears (TTM) | Sign up |
| Podcast sentiment (TTM) | Sign up |
| Podcast sentiment % (TTM) | Sign up |
| News sentiment (TTM) | 5 |
| Quality score | -5.6% |
| Insiders | |
|---|---|
| Buys, 1w | Sign up |
| Buys, 1m | Sign up |
| Buys, 1y | Sign up |
| Sells, 1w | Sign up |
| Sells, 1m | Sign up |
| Sells, 1y | Sign up |
Sign up to see this company's insider trades
| Figure | FY 2026 | FY 2025 | FY 2024 | FY 2023 | FY 2022 | FY 2021 | FY 2020 | FY 2019 | FY 2018 | FY 2017 | FY 2016 | FY 2015 | FY 2014 | FY 2013 |
|---|---|---|---|---|---|---|---|---|---|---|---|---|---|---|
| Revenue | 481.249B | 427.669B | 433.848B | 377.3B | 334.788B | 328.358B | 305.057B | 292.56B | 299.262B | 268.079B | 267.91B | 270.308B | 262.324B | 259.288B |
| Net profit | 8.738B | 4.537B | 10.902B | 5.681B | 5.985B | -752M | 3.844B | 10.301B | 6.614B | 4.223B | 10.563B | 7.337B | 3.808B | 8.38B |
| Free cash flow | 3.603B | -5.348B | 151M | -2.204B | -12.253B | 5.254B | -2.676B | 3.719B | 12.292B | 2.403B | 12.934B | — | — | — |
| Figure | FY 2026 | FY 2025 | FY 2024 | FY 2023 | FY 2022 | FY 2021 | FY 2020 | FY 2019 | FY 2018 | FY 2017 | FY 2016 | FY 2015 | FY 2014 | FY 2013 |
|---|---|---|---|---|---|---|---|---|---|---|---|---|---|---|
| Share price | 1.686K | 1.817K | 1.926K | 1.604K | 1.254K | 1.191K | 1.311K | 1.538K | 1.711K | 1.223K | 1.872K | 1.269K | 909.97 | 1.19K |
| Price performance 12m | -0.07 | -0.06 | 0.2 | 0.28 | 0.05 | -0.09 | -0.15 | -0.1 | 0.4 | -0.35 | 0.48 | 0.39 | -0.24 | — |
Filed figures
Lines the statements and their notes report beside the headline figures, read from the filings' XBRL as filed (no restatement applied), with figures computed from one filing's own lines. Cash-flow lines carry their cash direction: an outflow is negative. Each period links to its filing; a figure's period, report date and tag are in its tooltip.
| Figure | Mar 2017 | Mar 2018 | Mar 2019 | Mar 2020 | Mar 2021 | Mar 2022 | Mar 2023 | Mar 2024 | Mar 2025 | Mar 2026 |
|---|---|---|---|---|---|---|---|---|---|---|
| Balance sheet detail | ||||||||||
| Trade receivables (JPY) | 4.6B | 5.56B | 6.25B | 10.1B | 10.9B | 9.96B | 11.7B | 15.2B | 15.9B | 18.8B |
| ↳ YoY growth | +12.1% | +21.0% | +12.4% | +61.3% | +7.9% | -8.4% | +17.6% | +30.0% | +4.6% | +18.0% |
| ↳ 5y CAGR | +21.5% | +16.7% | +16.1% | +19.5% | +9.6% | +11.6% | ||||
| Borrowings, current (JPY) | 6.12B | 5.6B | 4.2B | 8.74B | 5.01B | 5.89B | 13.5B | 10.7B | 10.8B | 13.4B |
| Borrowings, non-current (JPY) | 20.5B | 19.9B | 21.2B | 26B | 45.9B | 52.1B | 54.5B | 70.9B | 83.7B | 105B |
| Bonds payable (JPY) | 105M | 56M | — | — | — | — | — | 6.6B | 12.2B | 12.2B |
| Lease liabilities (JPY) | 1.51B | 1.41B | 1.3B | 1.25B | 1.18B | 1.12B | 12.3B | 17.1B | 23.5B | 26.6B |
| Cash and deposits (JPY) | 34.1B | 42.7B | 35.8B | 32.6B | 51.9B | 45.6B | 44.3B | 55B | 60.1B | 86.7B |
| Intangible assets (JPY) | 2.05B | 1.44B | 1.52B | 1.89B | 2.35B | 2.82B | 3.26B | 4.34B | 5.03B | 5.45B |
| Net debt (borrowings + leases - cash) (JPY) | -5.96B | -15.8B | -9.09B | 3.35B | 269M | 13.5B | 35.9B | 43.8B | 58B | 58.6B |
| Cash flow detail | ||||||||||
| Operating cash flow (JPY) | 8.79B | 16.3B | 7.9B | 5.11B | 12.4B | -5.73B | 4.28B | 9.3B | 8.01B | 19.5B |
| Purchases of property, plant and equipment (JPY) | -5.41B | -3.25B | -4.18B | -7.01B | -5.78B | -5B | -6.49B | -7.15B | -11.1B | -13.1B |
| Purchases of intangible assets (JPY) | -971M | -805M | -655M | -770M | -1.39B | -1.52B | -1.18B | -1.99B | -2.24B | -2.74B |
| Change in receivables (cash effect) (JPY) | — | 41M | -647M | -1.69B | -787M | 968M | -1.7B | -2.76B | -746M | -2.33B |
| Change in inventories (cash effect) (JPY) | -700M | -2.87B | -4.92B | -438M | -3.99B | -8.99B | -12.6B | -6.46B | -2.95B | -2.46B |
| Change in payables (cash effect) (JPY) | 3.69B | -4.52B | -866M | -1.71B | 4.07B | -1.28B | 2.09B | -2.57B | -1.62B | -647M |
| Dividends paid (cash effect) (JPY) | -1.64B | -1.63B | -1.57B | -1.47B | -1.44B | -1.23B | -1.02B | -948M | -1.35B | -1.35B |
| Share buybacks (cash effect) (JPY) | — | -525M | -6.31B | -2B | — | — | -4.8B | 0.00 | — | — |
| Interest paid (cash effect) (JPY) | -201M | -176M | -154M | -153M | -230M | -214M | -238M | -265M | -559M | -1.01B |
| Income taxes paid (cash effect) (JPY) | -8.21B | -1.55B | -7.56B | -6.03B | -1.86B | -5.47B | -1.93B | -4.52B | -5.42B | -4.76B |
| Operating cash flow before change in receivables (JPY) | — | 16.3B | 8.55B | 6.79B | 13.2B | -6.7B | 5.98B | 12.1B | 8.76B | 21.8B |
| Free cash flow (OCF - PPE - intangibles) (JPY) | 2.4B | 12.3B | 3.06B | -2.68B | 5.25B | -12.3B | -3.38B | 151M | -5.35B | 3.6B |
| Income detail | ||||||||||
| Total comprehensive income (JPY) | 4.3B | 6.64B | 10.2B | 3.81B | -676M | 5.75B | 5.67B | 10.9B | 4.54B | 9.12B |
| Comprehensive income to owners (JPY) | 4.3B | 6.64B | 10.2B | 3.81B | -676M | 5.75B | 5.67B | 10.8B | 4.44B | 9.02B |
| Provision for credit losses (JPY) | 51M | 263M | 65M | 96M | — | — | — | — | — | — |
| Credit cost ratio (credit losses / average receivables) (%) | 1.2% | 5.2% | 1.1% | 1.2% | — | — | — | — | — | — |
| Reported | Jun 28, 2018 | Jun 26, 2019 | Jun 26, 2020 | Jun 26, 2020 | Jun 30, 2021 | Jun 30, 2022 | Jun 30, 2023 | Jun 28, 2024 | Jun 27, 2025 | Jun 25, 2026 |
Sign up to see institutional holdings
Sign UpPodcast Mentions
Sign up to see podcast mentions and sentiment
Sign UpTimely disclosures published on TDnet, newest first, titles as filed in Japanese. The link opens the disclosure on TDnet. Filings with EDINET (periodic reports, extraordinary reports, offerings, holding and buy-back reports), newest first, titles as filed in Japanese. The link opens the filing on EDINET. Press releases from the company's own website, newest first.


 企業情報TOP




 企業情報TOP

















 <シルバー賞・審査員特別賞の賞状と記念パネルを手にする制作チーム>

 <シルバー賞・審査員特別賞を受賞した「【連載】海外事業のいまとこれから」。Vol.1の台湾をはじめ、これまでに配信された各記事のサムネイル>
 <「出勤コーデ」や「現地トレンド」など、親しみやすさを伝えた実際の掲載内容>
 <「セカンドリテイリング」の新たな船出となる記念すべき日。オンライン登壇した遠藤社長から力強いエールが送られました。>
 <配信拠点となった都内のスタジオの裏側>
 <内定者へ歓迎の辞を述べた先輩社員(左からセカンドストリート戸祭店 加納さん、ゲオデジタルベース川口元郷店 佐藤さん、セカンドリテイリング・テクノロジーズ デザイン課 虎走さん)>
 <ワークショップで共有された新たな企業理念体系>
 <第二部の最後に温かいエールを送り、社会人への第一歩を踏み出す内定者の背中を押したリクルーター6名>
 <オンライン開催に込めた意図と、会社の成長をけん引する次世代への期待を語る、新卒採用ユニットリーダーの武藤さん>
 <グループ会社、おお蔵ホールディングスの内定式にて登壇する古賀社長>


 <新社名ロゴ「2nd RETAILING」を手にする一戸さん>


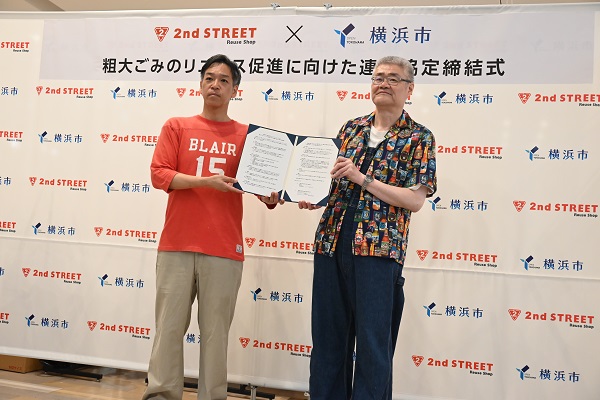 <協定締結式にて古着コーデで締結書を掲げる両代表(左からセカンドストリート店舗運営部の高井ゼネラルマネジャー(以下、GM)と横浜市資源循環局の吉川局長)>
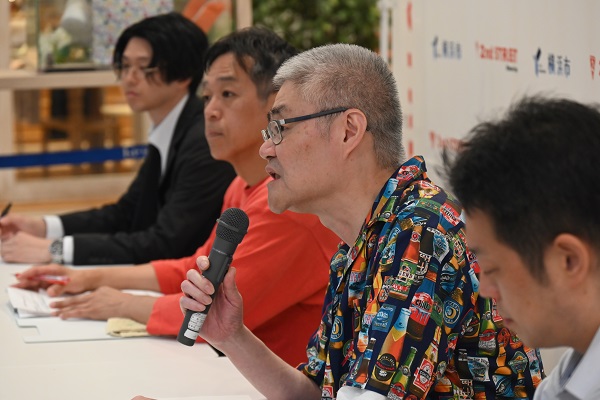 <古着コーデで報道陣からの質問に回答する吉川局長と高井GM>
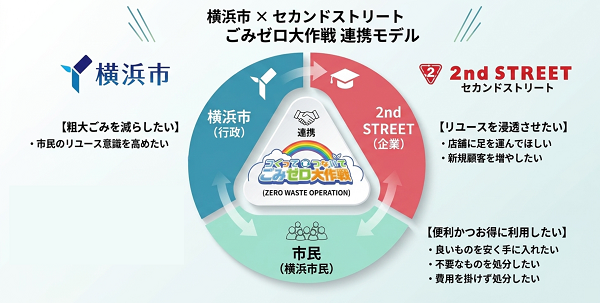 <横浜市の【粗大ごみを減らしたい】、セカンドストリートの【リユースを身近に浸透させたい】、市民の【便利でお得に利用したい】という3者の想いが重なり合う三角形の循環図>
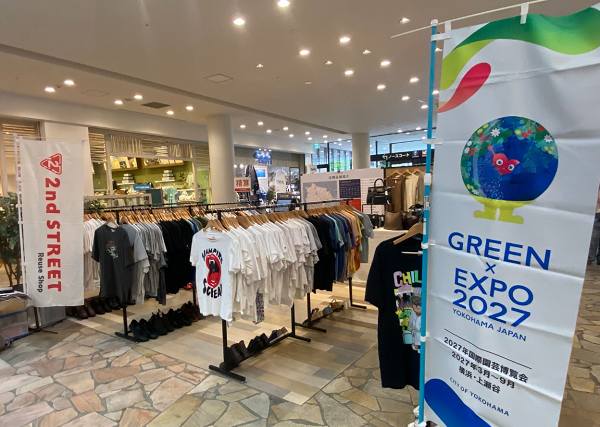 <ららぽーと横浜のイベント風景、約300点の厳選リユースアイテムを販売しました>
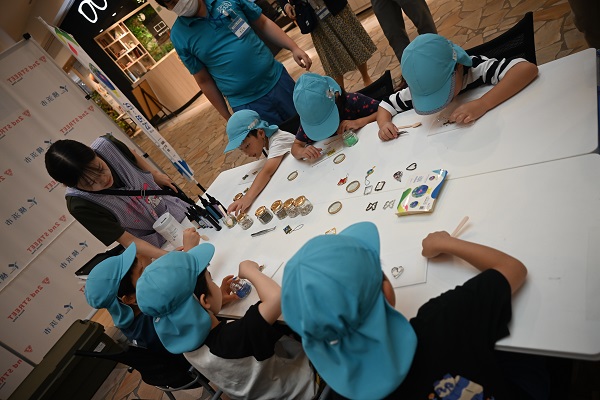 <ワークショップを楽しむ地元保育園の園児たち>
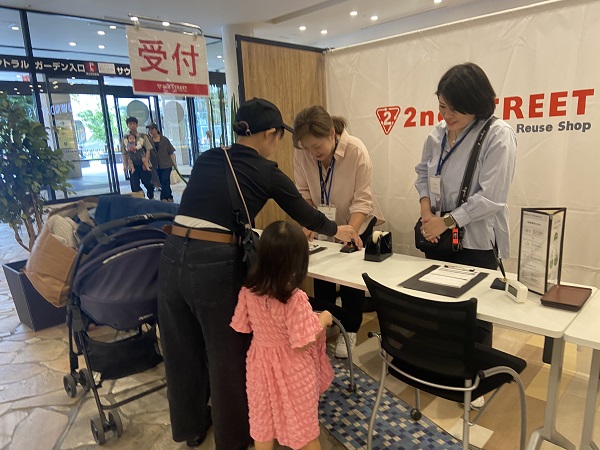 <特設の買取受付カウンターでは、お子さま連れのお客さまが査定へ立ち寄る姿が見られました>
Prompts
Click prompts to add them under the company line, click again to take one out, then copy the result into your AI chat. Shared by Asian Century Stocks and Uncovered Thai Stocks. Thank you.
Geo Holdings Corporation (ticker 2681), listed in Japan.
Copied
ETFs Holding Geo Holdings Corporation
Exchange-traded funds whose newest published daily portfolio holds one of the company's listings, largest weight first.
| ETF | Weight in ETF | Shares | Market value | As of |
|---|---|---|---|---|
| DISV | 0.09% | 323,400 | $ 4.545M | Nov 12, 2026 |
| AVDV | 0.05% | 715,000 | $ 10.175M | Nov 16, 2026 |
| DFIS | 0.03% | 123,000 | $ 1.728M | Nov 12, 2026 |
| DXIV | 0.01% | 2,400 | $ 33.726K | Nov 12, 2026 |
| AVSD | 0.01% | 2,600 | $ 36.999K | Nov 16, 2026 |
| AVDS | 0.01% | 3,400 | $ 48.383K | Nov 16, 2026 |
| DFIC | 0.00% | 52,200 | $ 733.542K | Nov 12, 2026 |
| DFSI | 0.00% | 3,000 | $ 42.158K | Nov 12, 2026 |
| DFAX | 0.00% | 23,400 | $ 328.829K | Nov 12, 2026 |
| DFAI | 0.00% | 28,900 | $ 406.118K | Nov 12, 2026 |
| AVDE | 0.00% | 40,200 | $ 572.059K | Nov 16, 2026 |