EDINET提出書類 株式会社J−オイルミルズ(E00434) 半期報告書 【表紙】 【提出書類】 半期報告書 【根拠条文】 金融商品取引法第24条の5第1項の表の第1号 【提出先】 関東財務局長 【提出日】 2026年11月6日 【中間会計期間】 第25期中(自 【会社名】…
EDINET提出書類
株式会社J−オイルミルズ(E00434)
半期報告書
【表紙】
【提出書類】
半期報告書
【根拠条文】
金融商品取引法第24条の5第1項の表の第1号
【提出先】
関東財務局長
【提出日】
2026年11月6日
【中間会計期間】
第25期中(自
【会社名】
株式会社J−オイルミルズ
【英訳名】
J-OIL MILLS, INC.
【代表者の役職氏名】
代表取締役社長執行役員 CEO
【本店の所在の場所】
東京都中央区明石町8番1号
【電話番号】
(03)5148−7100
【事務連絡者氏名】
執行役員 CFO 財務・コーポレートコミュニケーション統括部長
【最寄りの連絡場所】
東京都中央区明石町8番1号
【電話番号】
(03)5148−7100
【事務連絡者氏名】
執行役員 CFO 財務・コーポレートコミュニケーション統括部長
【縦覧に供する場所】
株式会社東京証券取引所
2026年4月1日
至
2026年9月30日)
春
山
郎
内
田
敬
之
内
田
敬
之
聖路加タワー
大阪支社
(大阪市北区中之島六丁目2番57号)
株式会社J−オイルミルズ
一
聖路加タワー
(東京都中央区日本橋兜町2番1号)
株式会社J−オイルミルズ
裕
名古屋支社
(名古屋市中区錦二丁目18番19号)
1/28
EDINET提出書類
株式会社J−オイルミルズ(E00434)
半期報告書
第一部【企業情報】
第1 【企業の概況】
1 【主要な経営指標等の推移】
回次
会計期間
第24期
中間連結会計期間
自 2025年4月1日
至 2025年9月30日
第25期
中間連結会計期間
自 2026年4月1日
至 2026年9月30日
第24期
自
至
2025年4月1日
2026年3月31日
売上高
(百万円)
112,246
120,873
226,574
経常利益
(百万円)
2,782
2,494
5,781
親会社株主に帰属する
中間(当期)純利益
(百万円)
1,753
1,738
4,753
中間包括利益又は包括利益
(百万円)
2,671
930
7,282
純資産額
(百万円)
107,660
110,558
111,102
総資産額
(百万円)
170,545
177,572
166,316
1株当たり中間(当期)純利益
(円)
52.98
52.47
143.59
潜在株式調整後1株当たり
中間(当期)純利益
(円)
−
−
−
自己資本比率
(%)
62.9
62.2
66.5
営業活動によるキャッシュ・フロー
(百万円)
1,998
2,319
2,998
投資活動によるキャッシュ・フロー
(百万円)
△2,101
△3,410
△3,523
財務活動によるキャッシュ・フロー
(百万円)
△2,791
5,718
△8,208
現金及び現金同等物の
(百万円)
9,080
7,969
3,300
中間期末(期末)残高
(注) 1 当社は中間連結財務諸表を作成しておりますので、提出会社の主要な経営指標等の推移については記載し
ておりません。
2 潜在株式調整後1株当たり中間(当期)純利益については、潜在株式が存在しないため記載しておりませ
ん。
2 【事業の内容】
当中間連結会計期間において、当社グループ(当社及び当社の関係会社)において営まれている事業の内容につ
いて、重要な変更はありません。
また、主要な関係会社の異動は、次のとおりであります。
(スペシャリティフード事業)
2026年5月28日付けで当社の連結子会社でありましたPremium Fats Sdn Bhdの全株式を譲渡したことに伴い、
Premium Fats Sdn Bhdを連結の範囲から除外しております。
2/28
EDINET提出書類
株式会社J−オイルミルズ(E00434)
半期報告書
第2 【事業の状況】
1 【事業等のリスク】
当中間連結会計期間において、当半期報告書に記載した事業の状況、経理の状況等に関する事項のうち、経営者が
連結会社の財政状態、経営成績及びキャッシュ・フローの状況に重要な影響を与える可能性があると認識している主
要なリスクの発生又は前事業年度の有価証券報告書に記載した「事業等のリスク」についての重要な変更はありませ
ん。
2 【経営者による財政状態、経営成績及びキャッシュ・フローの状況の分析】
文中の将来に関する事項は、当中間連結会計期間の末日現在において当社グループが判断したものであります。
(1) 当中間期の経営成績の概況
当中間連結会計期間におけるわが国経済は、雇用・所得環境の改善などを背景に、緩やかな回復基調が継続いた
しました。一方、中東情勢を背景としたエネルギー価格の動向、米国の通商政策、金融資本市場の変動などによ
り、景気の先行きは不透明な状況が続いております。
このような事業環境のもと、当社は2030年の目指すべき姿を見据え、2026年度を最終年度とする第六期中期経営
計画「Transforming for Growth」を推進しております。策定時の想定を上回る事業環境の変化等により、計画達成
は厳しい状況にあるものの、既存事業の収益性改善、事業ポートフォリオの高度化および海外展開に向けた取組み
を着実に実行し、一定の成果を積み上げてまいりました。これまでの成果と課題を踏まえ、必要な施策を継続する
とともに、持続的な企業価値向上に取り組んでまいります。
当中間連結会計期間における業績については、売上高1,208億73百万円(前年同期比7.7%増)、営業利益25億20
百万円(前年同期比0.2%増)、経常利益24億94百万円(前年同期比10.4%減)、親会社株主に帰属する中間純利益
17億38百万円(前年同期比0.8%減)となりました。
(単位:百万円)
前中間
連結会計期間
当中間
連結会計期間
増減額
前年同期比
売上高
112,246
120,873
8,627
7.7%
営業利益
2,516
2,520
4
0.2%
経常利益
2,782
2,494
△288
△10.4%
親会社株主に帰属する
中間純利益
1,753
1,738
△14
△0.8%
セグメントの概況は、次のとおりであります。
(油脂事業)
(単位:百万円)
前中間
連結会計期間
売上高
セグメント利益
当中間
連結会計期間
増減額
前年同期比
102,612
111,243
8,630
8.4%
1,954
1,834
△119
△6.1%
油脂事業は、物価上昇などを背景とした消費者の節約志向の高まりにより、家庭用油脂の販売重量が前年同期を
わずかに下回りました。一方、業務用油脂では、外食・中食市場向け需要が堅調に推移し、販売重量は前年同期を
わずかに上回り、油脂事業全体では、主原料コストの上昇に伴う価格改定の浸透や高付加価値品の拡販により増収
となりました。利益面についても、価格改定等による収益性の改善が寄与しておりますが、中東情勢を背景とした
ユーティリティ費・資材費・物流費等の上昇の影響が継続したことにより、当中間連結会計期間においてはコスト
上昇分を吸収するには至らず、前年同期比で減益となりました。
3/28
EDINET提出書類
株式会社J−オイルミルズ(E00434)
半期報告書
<主原料・為替相場の動向>
主原料である大豆相場は、4月には1ブッシェル当たり11ドル台後半で推移いたしました。その後、米国におけ
る再生可能燃料向け需要拡大期待や堅調な輸出需要に加え、米国産地における高温・乾燥懸念などを背景に上昇基
調で推移いたしました。7月には12ドル台後半まで上昇し、さらに中東情勢の緊迫化に伴うエネルギー価格上昇や
植物油需給の引締まり観測を受けて、9月には13ドル台前半まで上昇いたしました。
菜種相場は、4月には1トン当たり700加ドル台前半で推移しておりましたが、カナダの主要産地における乾燥懸
念や再生可能燃料向け需要の拡大期待を受け、上昇基調となりました。その後も、中東情勢の緊迫化に伴う植物油
市況全体の上昇を背景に騰勢を強め、8月には800加ドル台に到達し、9月には800加ドル台前半から半ばの高値圏
で推移いたしました。
為替相場は、4月には1米ドル159円前後で推移しておりましたが、その後、日米金利差の拡大や米国景気の底堅
さを背景に円安ドル高が進行し、7月には一時164円近辺まで円安となりました。一方、米国の利下げ観測や為替市
場の過度な変動に対する各国当局の警戒感などを背景に円高ドル安へ転じ、9月には155円前後で推移いたしまし
た。
<油脂部門>
家庭用油脂は、物価上昇などを背景とした消費者の節約志向の高まりにより、販売重量は前年同期をわずかに下
回りました。売上高については、主原料である大豆や菜種のコスト上昇に伴う価格改定の効果はあったものの、オ
リーブオイルのコストの軟化に伴う販売価格下落が影響し、家庭用油脂全体では、前年同期をわずかに下回りまし
®
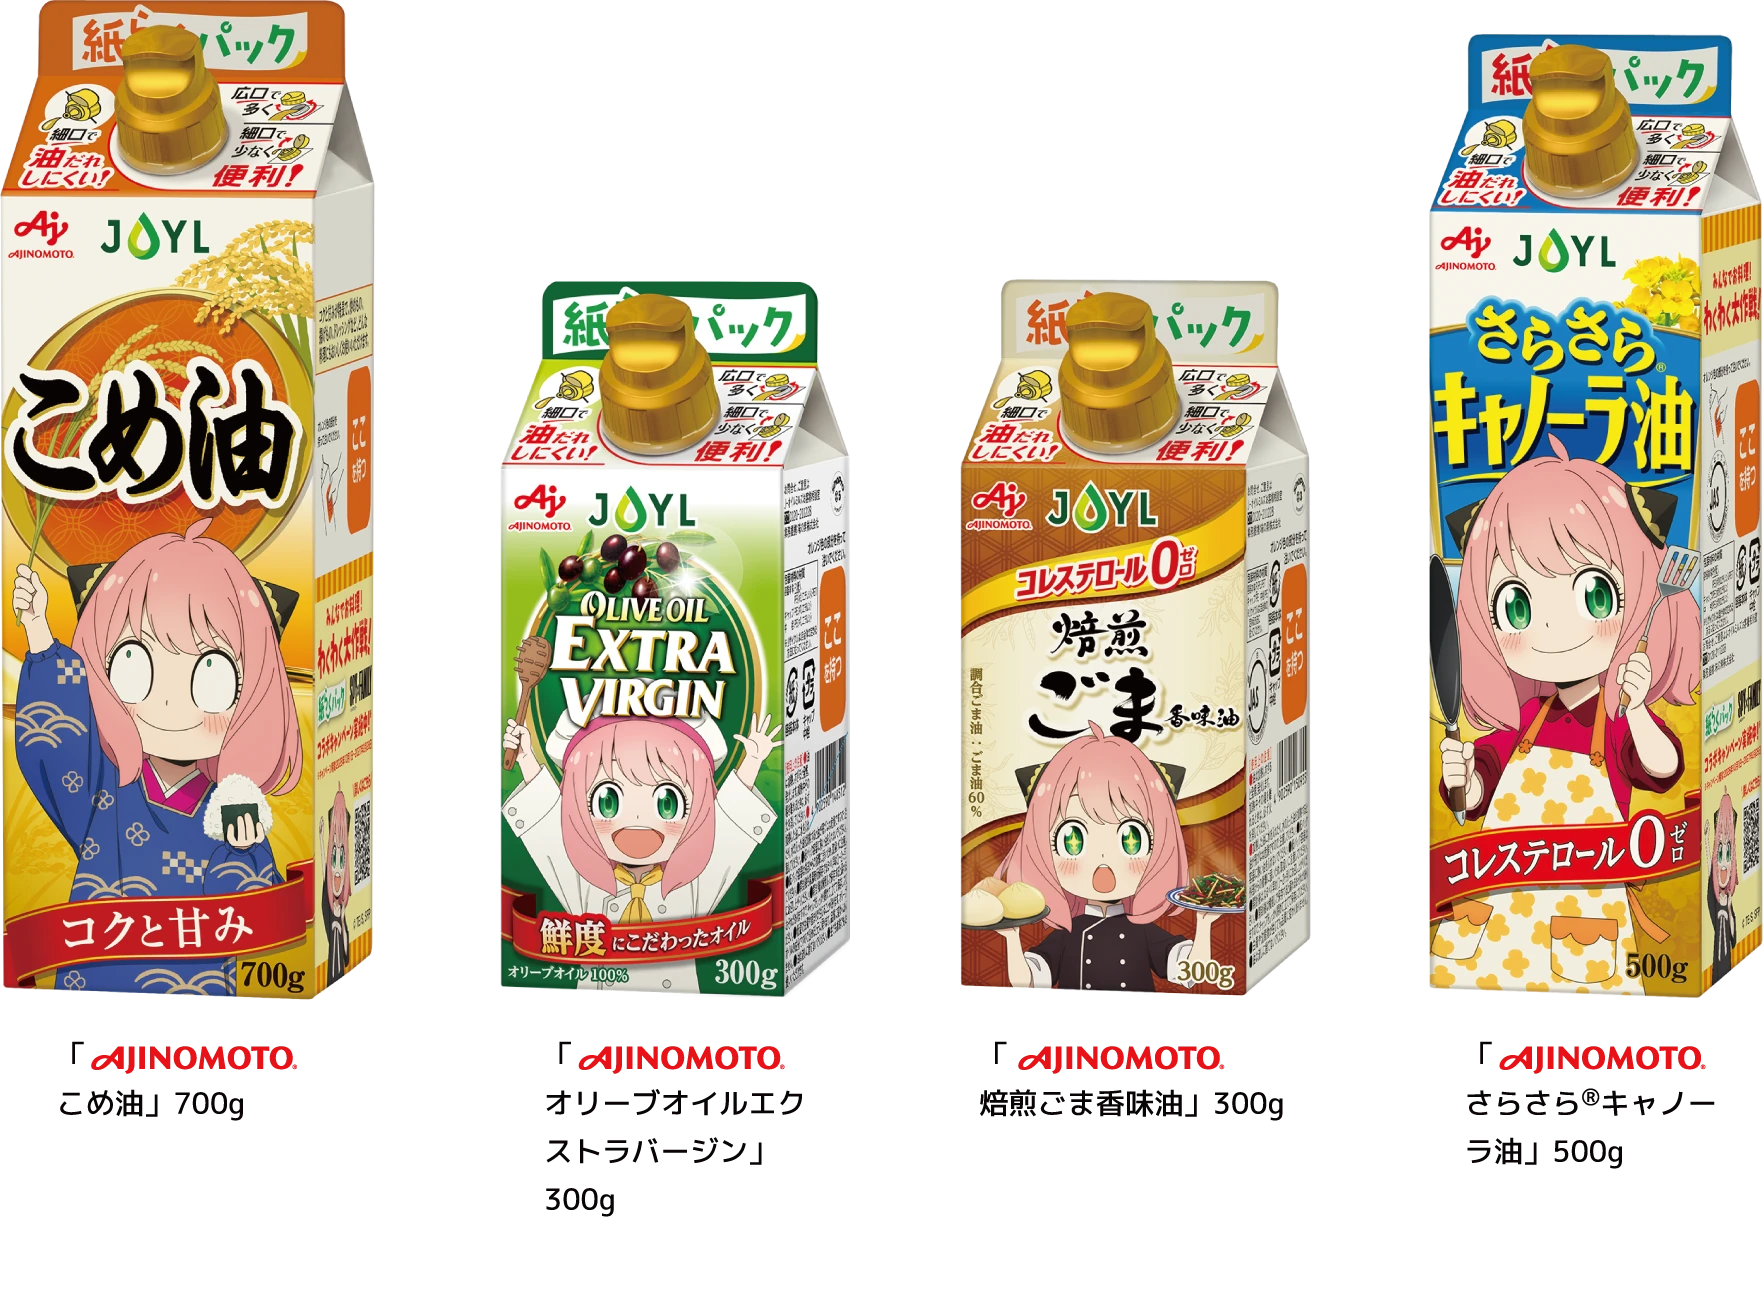
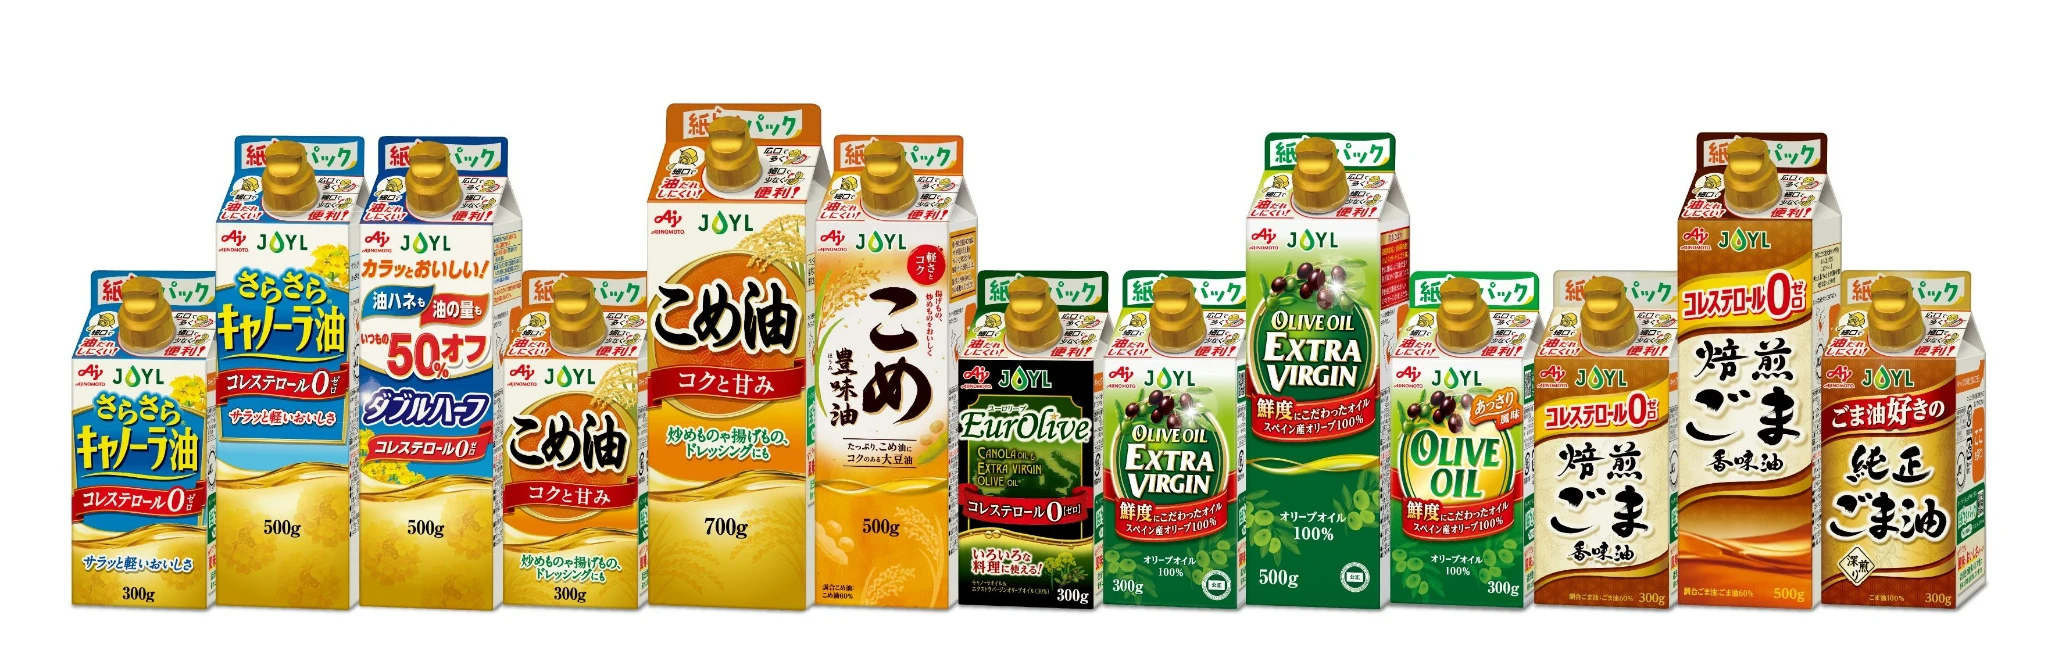
た。また、環境負荷の低減と使いやすさを両立した「紙らくパック 」においては、対象製品の売上の一部を環境保
全活動へ寄付しました。今後も環境負荷の低減に向けた取組みを推進し、循環型社会の実現に貢献してまいりま
す。
業務用油脂は、外食・中食市場向け需要が堅調に推移し、販売重量は前年同期をわずかに上回りました。売上高
は、価格改定の浸透を背景に、前年同期を上回りました。食材コストの上昇や深刻化する人手不足などの顧客課題
®
に対し、品質の劣化を抑えて長く使用できる「SUSTEC (サステック)」シリーズや、調理時間や調理負荷を軽減す
る「調味油」「調理油」など、機能性を強化した高付加価値品の拡販に取り組みました。
<油糧部門>
大豆ミールは、搾油量が前年同期をわずかに上回ったことにより、販売重量は堅調に推移しました。販売価格
は、シカゴ大豆ミール相場の上昇や為替相場が円安で推移したことにより、前年同期を上回りました。
菜種ミールは、搾油量が前年同期をやや下回ったことにより、販売重量は前年同期をわずかに下回りました。販
売価格は、大豆ミール相場に連動して上昇し、前年同期を上回りました。
以上の結果、当事業は売上高1,112億43百万円(前年同期比8.4%増)、セグメント利益18億34百万円(前年同期
比6.1%減)となりました。
4/28
EDINET提出書類
株式会社J−オイルミルズ(E00434)
半期報告書
(スペシャリティフード事業)
(単位:百万円)
前中間
連結会計期間
売上高
セグメント利益
当中間
連結会計期間
増減額
前年同期比
9,240
9,267
26
0.3%
467
564
96
20.6%
スペシャリティフード事業は、前年に実施した収益改善に向けた不採算品の終売の影響等があったものの、業務
用油脂加工品の販売価格改定の効果等により、売上高は前年同期をわずかに上回り、増益となりました。
<乳系PBF部門>
業務用油脂加工品は、大手製パン向けの需要が底堅く推移し、販売重量は前年同期と同程度となりました。一
方、売上高は、前年に実施した原材料コストの上昇に伴う販売価格改定の浸透により、前年同期を上回りました。
粉末油脂事業については、販売重量、売上高ともに前年同期を上回りました。
<食品素材部門>
®
テクスチャーデザイン事業は、食品用澱粉において、油脂事業との協働による「おいしさデザイン 」を活用した
ソリューション提案の推進や販売価格改定を実施したものの、段ボール用途などの汎用スターチ終売の影響によ
り、全体の販売重量、売上高ともに前年同期を大きく下回りました。
ファインは、全体の販売重量が前年同期を下回った一方、ビタミンK2の販売重量が大きく上回ったことによ
り、売上高は前年同期を大きく上回りました。
®
大豆たん白をベースとした大豆シート食品「まめのりさん 」は、主要販売先である北米向け出荷の伸長に加え、
欧州や中東向けの取組みを強化した結果、販売重量、売上高ともに前年同期を大きく上回りました。
以上の結果、当事業は売上高92億67百万円(前年同期比0.3%増)、セグメント利益5億64百万円(前年同期比
20.6%増)となりました。
(その他)
その他の事業につきましては、売上高3億63百万円(前年同期比7.5%減)、セグメント利益1億21百万円(前年
同期比29.4%増)となりました。
(2) 財政状態の状況
当中間連結会計期間末の総資産は、前連結会計年度末と比べ112億56百万円増加し、1,775億72百万円となりまし
た。主な増加は、棚卸資産が69億41百万円、有価証券が38億円、現金及び預金が8億68百万円であります。主な減
少は、投資有価証券が4億17百万円、無形固定資産が3億69百万円であります。
負債は、前連結会計年度末と比べ118億円増加し、670億14百万円となりました。主な増加は、支払手形及び買掛
金が71億44百万円、長期借入金が30億円、社債発行による50億円であります。主な減少は、流動負債その他が18億
39百万円、短期借入金が8億50百万円、未払法人税等が4億31百万円、賞与引当金が2億68百万円であります。
純資産は、前連結会計年度末と比べ5億44百万円減少し、1,105億58百万円となり、自己資本比率は62.2%となり
ました。
5/28
EDINET提出書類
株式会社J−オイルミルズ(E00434)
半期報告書
(3) キャッシュ・フローの状況
当中間連結会計期間末における現金及び現金同等物は、前連結会計年度末と比べ46億68百万円増加し、79億69百
万円となりました。なお、非連結子会社との合併に伴う現金及び現金同等物の増加額は51百万円であり、各キャッ
シュ・フローの状況は、以下のとおりであります。
営業活動によるキャッシュ・フローは、前年同期に比べ3億20百万円増加し、23億19百万円となりました。この
主な要因は、仕入債務が増加したことによります。
投資活動によるキャッシュ・フローは、前年同期に比べ13億9百万円減少し、△34億10百万円となりました。こ
の主な要因は、有形固定資産の取得による支出を計上したことによります。
財務活動によるキャッシュ・フローは、前年同期に比べ85億10百万円増加し、57億18百万円となりました。この
主な要因は、長期借入金および社債が増加したことによります。
(4) 研究開発活動
当中間連結会計期間の研究開発費の総額は7億22百万円であります。
なお、当中間連結会計期間において当社グループの研究開発活動の状況に重要な変更はありません。
3 【重要な契約等】
当中間連結会計期間において、重要な契約等の決定又は締結等はありません。
6/28
EDINET提出書類
株式会社J−オイルミルズ(E00434)
半期報告書
第3 【提出会社の状況】
1 【株式等の状況】
(1) 【株式の総数等】
① 【株式の総数】
種類
発行可能株式総数(株)
普通株式
54,000,000
計
54,000,000
② 【発行済株式】
種類
中間会計期間末
現在発行数(株)
(2026年9月30日)
上場金融商品取引所
提出日現在発行数(株)
名又は登録認可金融
(2026年11月6日)
商品取引業協会名
東京証券取引所
33,508,446
33,508,446
プライム市場
普通株式
計
33,508,446
33,508,446
内容
単元株式数
―
100株
―
(2) 【新株予約権等の状況】
① 【ストックオプション制度の内容】
該当事項はありません。
② 【その他の新株予約権等の状況】
該当事項はありません。
(3) 【行使価額修正条項付新株予約権付社債券等の行使状況等】
該当事項はありません。
(4) 【発行済株式総数、資本金等の推移】
年月日
2026年9月30日
発行済株式
総数増減数
(株)
発行済株式
総数残高
(株)
資本金増減額
(百万円)
資本金残高
(百万円)
資本準備金
増減額
(百万円)
資本準備金
残高
(百万円)
―
33,508,446
―
10,000
―
32,393
7/28
EDINET提出書類
株式会社J−オイルミルズ(E00434)
半期報告書
(5) 【大株主の状況】
氏名又は名称
住所
2026年9月30日現在
発行済株式
(自己株式を
所有株式数
除く。)の
(千株)
総数に対する
所有株式数
の割合(%)
味の素株式会社
東京都中央区京橋1−7−1
9,053
27.16
三井物産株式会社
東京都千代田区大手町1−2−1
4,175
12.53
日本マスタートラスト信託銀行株
式会社(その他信託口)
日本マスタートラスト信託銀行株
式会社(投資信託口)
東京都港区赤坂1−8−1 赤坂インター
シティAIR
東京都港区赤坂1−8−1 赤坂インター
シティAIR
1,589
4.77
1,227
3.68
J−オイルミルズ取引先持株会
東京都中央区明石町8−1
908
2.72
東京都中央区晴海1−8−12
504
1.51
東京都中央区晴海1−8−12
335
1.01
東京都中央区明石町8−1
306
0.92
251
0.75
249
0.75
18,602
55.80
株式会社日本カストディ銀行(投
資信託口)
株式会社日本カストディ銀行(そ
の他信託口)
J−オイルミルズ従業員持株会
DFA INTL SMALL C
AP VALUE PORTFOL
IO(常任代理人 シティバン
ク、エヌ・エイ東京支店)
25 BANK STREET, CANAR
Y WHARF, LONDON, E14
5JP, UNITED KINGDOM
(東京都港区港南2−15−1 品川イン
ターシティA棟)
PALISADES WEST 6300,B
EE CAVE ROAD BUILDIN
G ONE AUSTIN TX 78746 U
S(東京都新宿区新宿6−27−30)
計
―
JP MORGAN CHASE
BANK 385781(常任代
理人株式会社みずほ銀行決済営
業部)
(注)1 日本マスタートラスト信託銀行株式会社(信託口)の所有株式数のうち、1,589千株はその他信託、
1,227千株は投資信託、11千株は年金信託であり、その合計は2,828千株となっております。
2 株式会社日本カストディ銀行(信託口)の所有株式数のうち、504千株は投資信託、335千株はその他信
託、12千株は年金信託、1千株は課税であり、その合計は854千株となっております。
8/28
EDINET提出書類
株式会社J−オイルミルズ(E00434)
半期報告書
(6) 【議決権の状況】
① 【発行済株式】
2026年9月30日現在
区分
株式数(株)
議決権の数(個)
内容
無議決権株式
―
―
―
議決権制限株式(自己株式等)
―
―
―
議決権制限株式(その他)
―
―
―
―
―
―
―
完全議決権株式(自己株式等)
完全議決権株式(その他)
単元未満株式
(自己保有株式)
普通株式 174,100
(相互保有株式)
普通株式
3,700
普通株式
33,242,500
普通株式
88,146
発行済株式総数
33,508,446
総株主の議決権
―
332,425
―
―
1単元(100株)未満の株式
―
―
332,425
―
(注)1「完全議決権株式(その他)」欄の普通株式には、証券保管振替機構名義の株式が2,200株(議決権22個)、
株主名簿上は豊産商事株式会社(現株式会社J-NIKKAパートナーズ)名義となっていますが実質的
に所有していない株式が200株(議決権2個)、株式給付信託(BBT)の信託財産として株式会社日本カスト
ディ銀行(信託E口)が保有する株式が162,300株(議決権1,623個議決権不行使)が含まれておりま
す。
2「単元未満株式」欄の普通株式には、当社所有の自己株式34株、相互保有株式32株が含まれております。
② 【自己株式等】
所有者の氏名
又は名称
(自己保有株式)
株式会社J-オイルミルズ
(相互保有株式)
太田油脂株式会社
計
2026年9月30日現在
発行済株式
所有株式数
総数に対する
の合計
所有株式数
(株)
の割合(%)
自己名義
所有株式数
(株)
他人名義
所有株式数
(株)
東京都中央区明石町8−1
174,100
―
174,100
0.52
愛知県岡崎市福岡町字下荒
追28
3,700
―
3,700
0.01
―
177,800
―
177,800
0.53
所有者の住所
(注)株式給付信託が保有する当社株式は、上記自己保有株式には含まれておりません。
9/28
EDINET提出書類
株式会社J−オイルミルズ(E00434)
半期報告書
2 【役員の状況】
前事業年度の有価証券報告書の提出日後、当中間会計期間における役員の異動は、次のとおりであります。
(1)新任役員
役職名
氏名
生年月日
略歴
1985年4月
2013年5月
2015年4月
2016年4月
2019年4月
2020年6月
2021年4月
取締役
小川
英次
1962年
10月26日
2022年4月
2023年4月
2024年6月
2026年6月
2026年6月
当社社外取締役(現任)
1984年4月
麒麟麦酒株式会社
(現 キリンホールディングス
株式会社) 入社
同社執行役員生産本部生産部長
キリンホールディングス株式会社
グループ人事総務担当ディレクター
兼 キリン株式会社
執行役員人事総務部長
キリンホールディングス株式会社
常務執行役員
グループ経営戦略担当ディレクター
兼 キリン株式会社
取締役常務執行役員兼
協和発酵キリン株式会社
(現協和キリン株式会社)取締役
キリンホールディングス株式会社
取締役常務執行役員兼
キリン株式会社常務執行役員兼
キリンビジネスシステム株式会社
取締役
麒麟麦酒株式会社取締役
稲畑産業株式会社社外取締役
(監査等委員)(現任)
ニュートン・インベストメント
・パートナーズ株式会社
(現 ジャパン・アクティベーショ
ン・キャピタル株式会社)
シニア・アドバイザー(現任)
当社社外取締役(現任)
2014年3月
2015年4月
2017年3月
取締役
横田
乃里也
1961年
2月3日
帝人株式会社入社
同社財務・IR部長
同社樹脂事業本部企画管理部門長
同社帝人グループ執行役員
樹脂事業本部長
同社帝人グループ執行役員
経営企画管掌
同社取締役執行役員経営企画管掌
同社取締役常務執行役員
経営企画管掌
同社取締役常務執行役員
マテリアル事業統轄
同社代表取締役専務執行役員 CFO、
経理・財務管掌兼
調達・物流部門担当
同社帝人グループ専務執行役員
社長補佐(特命プロジェクト担当)
大末建設株式会社社外取締役
(監査等委員)(現任)
2018年3月
2022年3月
2023年6月
2024年1月
2026年6月
任期
所有株
式数
(うち
株式報
酬制度
に基づ
く交付
予定株
式の
数)
就任
年月日
(注)
−
2026年
6月25日
(注)
−
同上
(注)2026年6月25日開催の定時株主総会終結時から2027年3月期に係る定時株主総会終結時まででありま
す。
10/28
EDINET提出書類
株式会社J−オイルミルズ(E00434)
半期報告書
(2)退任役員
役職名
氏名
退任年月日
取締役会長
佐藤
達也
2026年6月25日
取締役
石田
友豪
同上
取締役
槙
美冬
同上
監査役
菅原
万里子
2026年7月31日
(3)異動後の役員の男女別人数及び女性の比率
男性9名、女性1名(役員のうち女性の比率10.0%)
11/28
EDINET提出書類
株式会社J−オイルミルズ(E00434)
半期報告書
第4 【経理の状況】
1.中間連結財務諸表の作成方法について
当社の中間連結財務諸表は、「連結財務諸表の用語、様式及び作成方法に関する規則」(昭和51年大蔵省令第28号。
以下「連結財務諸表規則」という。)に基づいて作成しております。
また、当社は、金融商品取引法第24条の5第1項の表の第1号の上欄に掲げる会社に該当し、連結財務諸表規則第
1編及び第3編の規定により第1種中間連結財務諸表を作成しております。
2.監査証明について
当社は、金融商品取引法第193条の2第1項の規定に基づき、中間連結会計期間(2026年4月1日から2026年9月30
日まで)に係る中間連結財務諸表について、EY新日本有限責任監査法人による期中レビューを受けております。
12/28
EDINET提出書類
株式会社J−オイルミルズ(E00434)
半期報告書
1 【中間連結財務諸表】
(1) 【中間連結貸借対照表】
(単位:百万円)
前連結会計年度
(2026年3月31日)
資産の部
流動資産
現金及び預金
受取手形、売掛金及び契約資産
電子記録債権
有価証券
商品及び製品
原材料及び貯蔵品
その他
流動資産合計
固定資産
有形固定資産
建物及び構築物(純額)
機械装置及び運搬具(純額)
土地
リース資産(純額)
建設仮勘定
その他(純額)
有形固定資産合計
無形固定資産
投資その他の資産
投資有価証券
退職給付に係る資産
繰延税金資産
その他
貸倒引当金
投資その他の資産合計
固定資産合計
繰延資産
資産合計
13/28
当中間連結会計期間
(2026年9月30日)
3,300
37,919
3,738
−
18,141
28,733
3,851
4,169
38,252
3,917
3,800
20,360
33,457
3,664
95,686
107,621
9,189
13,674
18,315
975
1,204
774
9,155
13,086
18,315
957
1,792
743
44,134
1,992
44,050
1,622
19,860
3,971
144
633
△114
19,442
4,120
133
651
△114
24,494
70,621
8
166,316
24,232
69,906
44
177,572
EDINET提出書類
株式会社J−オイルミルズ(E00434)
半期報告書
(単位:百万円)
前連結会計年度
(2026年3月31日)
負債の部
流動負債
支払手形及び買掛金
短期借入金
1年内返済予定の長期借入金
1年内償還予定の社債
未払法人税等
未払消費税等
賞与引当金
役員賞与引当金
役員株式給付引当金
その他
流動負債合計
固定負債
社債
長期借入金
リース債務
繰延税金負債
役員株式給付引当金
環境対策引当金
退職給付に係る負債
長期預り敷金保証金
その他
固定負債合計
負債合計
純資産の部
株主資本
資本金
資本剰余金
利益剰余金
自己株式
株主資本合計
その他の包括利益累計額
その他有価証券評価差額金
繰延ヘッジ損益
為替換算調整勘定
退職給付に係る調整累計額
その他の包括利益累計額合計
非支配株主持分
純資産合計
負債純資産合計
14/28
当中間連結会計期間
(2026年9月30日)
14,623
850
200
−
1,012
20
1,307
28
14
10,709
21,767
−
−
12,000
581
385
1,039
17
−
8,870
28,767
44,661
12,000
5,650
793
3,457
249
23
1,979
2,283
9
5,000
8,650
769
3,439
166
23
2,010
2,283
9
26,447
55,214
22,352
67,014
10,000
31,633
61,665
△726
10,000
31,634
62,237
△615
102,572
103,256
4,412
165
981
2,439
4,294
△179
761
2,306
7,999
530
111,102
166,316
7,182
119
110,558
177,572
EDINET提出書類
株式会社J−オイルミルズ(E00434)
半期報告書
(2) 【中間連結損益計算書及び中間連結包括利益計算書】
【中間連結損益計算書】
売上高
売上原価
売上総利益
販売費及び一般管理費
営業利益
営業外収益
受取利息
受取配当金
持分法による投資利益
受取賃貸料
デリバティブ評価益
雑収入
営業外収益合計
営業外費用
支払利息
支払手数料
支払精算金
デリバティブ評価損
雑支出
営業外費用合計
経常利益
特別利益
固定資産売却益
関係会社株式売却益
抱合せ株式消滅差益
特別利益合計
特別損失
固定資産除却損
投資有価証券売却損
リース解約損
災害による損失
特別損失合計
税金等調整前中間純利益
法人税、住民税及び事業税
法人税等調整額
法人税等合計
中間純利益
非支配株主に帰属する中間純利益
親会社株主に帰属する中間純利益
前中間連結会計期間
(自 2025年4月1日
至 2025年9月30日)
112,246
94,922
※
15/28
17,323
14,807
(単位:百万円)
当中間連結会計期間
(自 2026年4月1日
至 2026年9月30日)
120,873
103,455
※
17,418
14,897
2,516
2,520
19
107
86
14
73
45
7
83
134
14
−
34
346
273
56
16
1
−
5
94
12
13
153
26
79
2,782
300
2,494
104
−
−
7
75
52
104
136
135
0
2
149
160
−
0
−
287
2,599
161
2,469
640
191
396
320
831
1,767
13
1,753
716
1,753
14
1,738
EDINET提出書類
株式会社J−オイルミルズ(E00434)
半期報告書
【中間連結包括利益計算書】
中間純利益
その他の包括利益
その他有価証券評価差額金
繰延ヘッジ損益
為替換算調整勘定
退職給付に係る調整額
持分法適用会社に対する持分相当額
その他の包括利益合計
中間包括利益
(内訳)
親会社株主に係る中間包括利益
非支配株主に係る中間包括利益
前中間連結会計期間
(自 2025年4月1日
至 2025年9月30日)
1,767
(単位:百万円)
当中間連結会計期間
(自 2026年4月1日
至 2026年9月30日)
1,753
691
131
37
△33
76
△147
△345
△155
△133
△41
903
2,671
△822
930
2,638
32
921
8
16/28
EDINET提出書類
株式会社J−オイルミルズ(E00434)
半期報告書
(3) 【中間連結キャッシュ・フロー計算書】
前中間連結会計期間
(自 2025年4月1日
至 2025年9月30日)
営業活動によるキャッシュ・フロー
税金等調整前中間純利益
減価償却費
退職給付に係る負債の増減額(△は減少)
退職給付に係る資産の増減額(△は増加)
役員株式給付引当金の増減額(△は減少)
賞与引当金の増減額(△は減少)
役員賞与引当金の増減額(△は減少)
受取利息及び受取配当金
支払利息
持分法による投資損益(△は益)
固定資産売却損益(△は益)
投資有価証券売却損益(△は益)
抱合せ株式消滅差損益(△は益)
関係会社株式売却損益(△は益)
固定資産除却損
災害損失
売上債権の増減額(△は増加)
棚卸資産の増減額(△は増加)
仕入債務の増減額(△は減少)
未払金及び未払費用の増減額(△は減少)
返金負債の増減額(△は減少)
未払消費税等の増減額(△は減少)
その他
小計
利息及び配当金の受取額
利息の支払額
災害損失の支払額
法人税等の支払額又は還付額(△は支払)
営業活動によるキャッシュ・フロー
17/28
(単位:百万円)
当中間連結会計期間
(自 2026年4月1日
至 2026年9月30日)
2,599
2,019
△44
△83
△47
△457
△27
△127
56
△86
△104
0
−
−
135
149
△48
△2,835
2,819
△415
319
△254
△296
2,469
2,039
△44
△268
△97
△268
△11
△90
94
△134
△7
−
△52
△75
160
−
△556
△7,003
7,154
△231
△381
846
△439
3,272
3,100
145
△56
△86
△1,276
115
△58
−
△838
1,998
2,319
EDINET提出書類
株式会社J−オイルミルズ(E00434)
半期報告書
(単位:百万円)
当中間連結会計期間
(自 2026年4月1日
至 2026年9月30日)
前中間連結会計期間
(自 2025年4月1日
至 2025年9月30日)
投資活動によるキャッシュ・フロー
有形固定資産の取得による支出
有形固定資産の売却による収入
有形固定資産の除却による支出
無形固定資産の取得による支出
投資有価証券の取得による支出
投資有価証券の売却による収入
連結の範囲の変更を伴う子会社株式の売却によ
る支出
その他資本剰余金の処分による配当金の受取額
会員権の売却による収入
短期貸付金の増減額(△は増加)
長期貸付けによる支出
長期貸付金の回収による収入
投資活動によるキャッシュ・フロー
財務活動によるキャッシュ・フロー
短期借入金の純増減額(△は減少)
長期借入れによる収入
長期借入金の返済による支出
社債の発行による収入
リース債務の返済による支出
自己株式の純増減額(△は増加)
配当金の支払額
非支配株主への配当金の支払額
財務活動によるキャッシュ・フロー
現金及び現金同等物に係る換算差額
現金及び現金同等物の増減額(△は減少)
現金及び現金同等物の期首残高
合併に伴う現金及び現金同等物の増加額
現金及び現金同等物の中間期末残高
※
18/28
△2,598
295
△366
△226
△9
4
△2,996
16
△406
△144
△144
−
−
△135
800
0
0
△2
1
400
0
△0
△1
1
△2,101
△3,410
−
−
△1,390
−
△103
78
△1,331
△44
△850
3,000
△200
4,959
△97
111
△1,166
△38
△2,791
24
△2,869
5,718
△10
4,617
11,950
−
9,080
3,300
51
7,969
※
EDINET提出書類
株式会社J−オイルミルズ(E00434)
半期報告書
【注記事項】
(連結の範囲又は持分法適用の範囲の変更)
当中間連結会計期間において、当社の連結子会社でありましたPremium Fats Sdn Bhdの全株式を譲渡したこと
に伴い、Premium Fats Sdn Bhdを連結の範囲から除外しております。
(追加情報)
(業績連動型株式報酬制度)
当社は、取締役および執行役員(社外取締役を除きます。以下「取締役等」といいます。)を対象に信託を
通じて自社の株式を交付する取引を行っております。
① 取引の概要
取締役等の報酬と当社の業績および株式価値との連動性をより明確にし、中長期的な業績の向上と企業価
値の増大に貢献する意識を高めることを目的に、業績連動型株式報酬制度「株式給付信託(BBT)」を導入して
おります。当社が拠出する金銭を原資として当社株式が信託を通じて取得され、取締役等に対して当社が定
める役員株式給付規程に従って、当社株式および当社株式を時価で換算した金額相当の金銭が信託を通じて
給付されます。なお、信託内の当社株式については、経営への中立性を確保するため、信託期間を通じ議決
権を行使しないものとしております。
② 信託に残存する自社の株式
信託に残存する当社株式を、信託における帳簿価額(付随費用の金額を除きます。)により、純資産の部
に自己株式として計上しております。当該自己株式の帳簿価額および株式数は、前連結会計年度435百万円、
218,062株、当中間連結会計期間324百万円、162,362株であります。
(中間連結貸借対照表関係)
当社は運転資金の効率的な調達を行うため、取引金融機関とコミットメントライン契約を締結しております。
この契約に基づく当中間連結会計期間の借入未実行残高は次のとおりであります。
貸出コミットメントラインの総額
借入実行残高
差引額
前連結会計年度
(2026年3月31日)
15,000百万円
−
当中間連結会計期間
(2026年9月30日)
15,000百万円
−
15,000百万円
15,000百万円
(中間連結損益計算書関係)
※
販売費及び一般管理費のうち主要な費目及び金額は、次のとおりであります。
前中間連結会計期間
(自 2025年4月1日
至 2025年9月30日)
製品発送費
6,469百万円
販売促進費
501
広告費
467
給与手当
2,506
退職給付費用
101
役員株式給付引当金繰入額
63
賞与引当金繰入額
601
役員賞与引当金繰入額
13
19/28
当中間連結会計期間
(自 2026年4月1日
至 2026年9月30日)
6,733百万円
515
375
2,349
△32
37
623
17
EDINET提出書類
株式会社J−オイルミルズ(E00434)
半期報告書
(中間連結キャッシュ・フロー計算書関係)
※
現金及び現金同等物の中間期末残高と中間連結貸借対照表に掲記されている科目の金額との関係
前中間連結会計期間
当中間連結会計期間
(自 2025年4月1日
(自 2026年4月1日
至 2025年9月30日)
至 2026年9月30日)
現金及び預金
4,080百万円
4,169百万円
有価証券勘定に含まれる預入期間が
5,000
3,800
3ヶ月以内の譲渡性預金
現金及び現金同等物
9,080百万円
7,969百万円
(株主資本等関係)
前中間連結会計期間(自
2025年4月1日
至
2025年9月30日)
1.配当金支払額
決議
株式の種類
配当金の総額
(百万円)
1株当たり
配当額(円)
基準日
効力発生日
配当の原資
2025年5月8日
普通株式
1,333
40.00 2025年3月31日 2025年6月5日利益剰余金
取締役会
(注)1 2025年5月8日取締役会決議による配当金の総額には、信託が保有する自社の株式に対する配当金10百
万円が含まれております。
2 1株当たり配当額40円には、創立20周年記念配当10円が含まれております。
2.基準日が当中間連結会計期間に属する配当のうち、配当の効力発生日が当中間連結会計期間の末日後となるもの
配当金の総額
1株当たり
決議
株式の種類
基準日
効力発生日
配当の原資
(百万円)
配当額(円)
2025年11月5日
普通株式
1,166
35.00 2025年9月30日 2025年12月2日利益剰余金
取締役会
(注)2025年11月5日取締役会決議による配当金の総額には、信託が保有する自社の株式に対する配当金7百万円
が含まれております。
当中間連結会計期間(自
2026年4月1日
至
2026年9月30日)
1.配当金支払額
決議
株式の種類
配当金の総額
(百万円)
1株当たり
配当額(円)
基準日
効力発生日
配当の原資
2026年5月11日
普通株式
1,166
35.00 2026年3月31日 2026年6月5日利益剰余金
取締役会
(注)2026年5月11日取締役会決議による配当金の総額には、信託が保有する自社の株式に対する配当金7百万円
が含まれております。
2.基準日が当中間連結会計期間に属する配当のうち、配当の効力発生日が当中間連結会計期間の末日後となるもの
配当金の総額
1株当たり
決議
株式の種類
基準日
効力発生日
配当の原資
(百万円)
配当額(円)
2026年11月6日
普通株式
1,333
40.00 2026年9月30日 2026年12月2日利益剰余金
取締役会
(注)2026年11月6日取締役会決議による配当金の総額には、信託が保有する自社の株式に対する配当金6百万円
が含まれております。
20/28
EDINET提出書類
株式会社J−オイルミルズ(E00434)
半期報告書
(企業結合等関係)
事業分離
連結子会社株式の譲渡
当社は、2026年5月11日開催の取締役会決議に基づき、2026年5月28日付けで当社の連結子会社である
Premium Fats Sdn Bhd(以下、PF社)の全株式を、当社の関連会社であるPremium Vegetable Oils Sdn Bhd
(以下、PVO社)に対して譲渡いたしました。
(1) 事業分離の概要
①
分離先企業の名称
Premium Vegetable Oils Sdn Bhd
②
当該連結子会社の名称及びその事業内容
名称: Premium Fats Sdn Bhd
事業内容: マーガリン、ショートニングの製造販売
③
事業分離を行った主な理由
PF社は、2019年の当社出資以降、売上規模の拡大をはじめ、事業運営の安定化や収益性の改善に一定
の進捗が見られてきたものの、中長期的な成長の実現という観点では、より高い事業価値の創出に向け
た検討が必要な状況にありました。このような認識のもと、PF社の全株式をPVO社に譲渡し、PF社の事業
をPVO社の事業として継続させることが当社の企業価値向上に資する最善の選択であると判断いたしまし
た。今後はPVO社との連携を一層強化し、同社が保有する製品群や顧客基盤といった強みとのシナジーを
活かし、海外市場における油脂加工品事業の更なる成長を図ってまいります。
④
事業分離日
2026年5月28日(みなし譲渡日 2026年4月1日)
⑤
法的形式を含むその他取引の概要に関する事項
受取対価を現金とする株式譲渡
(2) 実施した会計処理の概要
①
移転損益の金額
関係会社株式売却益
②
③
75百万円
移転した事業に係る資産及び負債の適正な帳簿価額ならびにその主な内訳
流動資産
614百万円
固定資産
302百万円
資産合計
917百万円
流動負債
102百万円
固定負債
30百万円
負債合計
133百万円
会計処理
当該譲渡株式の連結上の帳簿価額と売却価額との差額を「関係会社株式売却益」として特別利益に計
上しております。
(3) 譲渡した子会社の事業が含まれていたセグメント区分
スペシャリティフード事業
(4) 中間連結会計期間に係る中間連結損益計算書に計上されている分離した事業に係る損益の概算額
該当事項はありません。
21/28
EDINET提出書類
株式会社J−オイルミルズ(E00434)
半期報告書
(セグメント情報等)
【セグメント情報】
Ⅰ
前中間連結会計期間(自
2025年4月1日
至
2025年9月30日)
1.報告セグメントごとの売上高及び利益又は損失の金額に関する情報並びに収益の分解情報
報告セグメント
スペシャリ
油脂事業 ティフード
事業
その他
(注1)
計
(単位:百万円)
中間連結
損益計算書
調整額
計上額
(注2)
合計
売上高
家庭用油脂
15,012
−
15,012
−
15,012
−
15,012
業務用油脂
56,833
−
56,833
−
56,833
−
56,833
ミール類
30,766
−
30,766
−
30,766
−
30,766
乳系PBF
−
5,396
5,396
−
5,396
−
5,396
食品素材
−
3,844
3,844
−
3,844
−
3,844
その他
−
−
−
350
350
−
350
102,612
9,240
111,853
350
112,203
−
112,203
−
−
−
42
42
−
42
102,612
9,240
111,853
392
112,246
−
112,246
492
71
564
−
564
△564
−
計
103,105
9,312
112,417
392
112,810
△564
112,246
セグメント利益
1,954
467
2,422
93
2,516
−
2,516
顧客との契約から生じる
収益
その他の収益
外部顧客への売上高
セグメント間の内部売上
高又は振替高
(注)1
2
「その他」の区分は、報告セグメントに含まれない事業セグメントであり、その他付帯業務および不動
産賃貸等が含まれております。
セグメント利益は、中間連結損益計算書の営業利益と一致しております。
22/28
EDINET提出書類
株式会社J−オイルミルズ(E00434)
半期報告書
Ⅱ
当中間連結会計期間(自
2026年4月1日
至
2026年9月30日)
1.報告セグメントごとの売上高及び利益又は損失の金額に関する情報並びに収益の分解情報
報告セグメント
スペシャリ
油脂事業 ティフード
事業
その他
(注1)
計
(単位:百万円)
中間連結
損益計算書
調整額
計上額
(注2)
合計
売上高
家庭用油脂
14,943
−
14,943
−
14,943
−
14,943
業務用油脂
61,514
−
61,514
−
61,514
−
61,514
ミール類
34,785
−
34,785
−
34,785
−
34,785
乳系PBF
−
5,558
5,558
−
5,558
−
5,558
食品素材
−
3,708
3,708
−
3,708
−
3,708
その他
−
−
−
324
324
−
324
111,243
9,267
120,510
324
120,834
−
120,834
−
−
−
39
39
−
39
111,243
9,267
120,510
363
120,873
−
120,873
392
23
416
−
416
△416
−
計
111,635
9,290
120,926
363
121,289
△416
120,873
セグメント利益
1,834
564
2,398
121
2,520
−
2,520
顧客との契約から生じる
収益
その他の収益
外部顧客への売上高
セグメント間の内部売上
高又は振替高
(注)1
2
「その他」の区分は、報告セグメントに含まれない事業セグメントであり、その他付帯業務および不動
産賃貸等が含まれております。
セグメント利益は、中間連結損益計算書の営業利益と一致しております。
(収益認識関係)
顧客との契約から生じる収益を分解した情報は、「注記事項(セグメント情報等)」に記載のとおりでありま
す。
23/28
EDINET提出書類
株式会社J−オイルミルズ(E00434)
半期報告書
(1株当たり情報)
1株当たり中間純利益の基礎は、以下のとおりであります。
項目
前中間連結会計期間
(自 2025年4月1日
至 2025年9月30日)
1株当たり中間純利益
当中間連結会計期間
(自 2026年4月1日
至 2026年9月30日)
52円98銭
52円47銭
1,753
1,738
−
−
1,753
1,738
33,095,047
33,138,929
(算定上の基礎)
親会社株主に帰属する中間純利益(百万円)
普通株主に帰属しない金額(百万円)
普通株式に係る親会社株主に帰属する
中間純利益(百万円)
普通株式の期中平均株式数(株)
(注)1
2
潜在株式調整後1株当たり中間純利益については、潜在株式が存在しないため記載しておりません。
株主資本において自己株式として計上されている株式給付信託に残存する自社の株式は、1株当たり中
間純利益の算定上、期中平均株式数の計算において控除する自己株式に含めております。当該信託が保
有する当社株式の期中平均株式数は、前中間連結会計期間239,566株、当中間連結会計期間194,191株で
あります。
(重要な後発事象)
該当事項はありません。
24/28
EDINET提出書類
株式会社J−オイルミルズ(E00434)
半期報告書
2 【その他】
配当決議
2026年5月11日開催の取締役会において、2026年3月31日最終の株主名簿に記録された株主に対し、次のとおり
期末配当を行うことを決議いたしました。
①
配当金の総額
②
1株当たりの金額
③
支払請求権の効力発生日及び支払開始日
1,166百万円
35円00銭
2026年6月5日
第25期(2026年4月1日から2027年3月31日まで)中間配当について、2026年11月6日開催の取締役会において、
2026年9月30日最終の株主名簿に記録された株主に対し、次のとおり中間配当を行うことを決議いたしました。
①
配当金の総額
②
1株当たりの金額
③
支払請求権の効力発生日及び支払開始日
1,333百万円
40円00銭
2026年12月2日
25/28
EDINET提出書類
株式会社J−オイルミルズ(E00434)
半期報告書
第二部【提出会社の保証会社等の情報】
該当事項はありません。
26/28
EDINET提出書類
株式会社J−オイルミルズ(E00434)
半期報告書
独立監査人の中間連結財務諸表に対する期中レビュー報告書
2026年11月6日
株式会社J-オイルミルズ
取締役会
御中
EY新日本有限責任監査法人
東京事務所
指定有限責任社員
業務執行社員
公認会計士
本多
茂幸
指定有限責任社員
業務執行社員
公認会計士
平岡
亜惟
監査人の結論
当監査法人は、金融商品取引法第193条の2第1項の規定に基づき、「経理の状況」に掲げられている株式会社J-オ
イルミルズの2026年4月1日から2027年3月31日までの連結会計年度の中間連結会計期間(2026年4月1日から2026年
9月30日まで)に係る中間連結財務諸表、すなわち、中間連結貸借対照表、中間連結損益計算書、中間連結包括利益計
算書、中間連結キャッシュ・フロー計算書及び注記について期中レビューを行った。
当監査法人が実施した期中レビューにおいて、上記の中間連結財務諸表が、期中連結財務諸表に係る我が国において
一般に公正妥当と認められる企業会計の基準に準拠して、株式会社J-オイルミルズ及び連結子会社の2026年9月30日現
在の財政状態並びに同日をもって終了する中間連結会計期間の経営成績及びキャッシュ・フローの状況を適正に表示し
ていないと信じさせる事項が全ての重要な点において認められなかった。
監査人の結論の根拠
当監査法人は、我が国において一般に公正妥当と認められる期中レビューの基準に準拠して期中レビューを行った。
期中レビューの基準における当監査法人の責任は、「中間連結財務諸表の期中レビューにおける監査人の責任」に記載
されている。当監査法人は、我が国における職業倫理に関する規定(社会的影響度の高い事業体の財務諸表監査に適用
される規定を含む。)に従って、会社及び連結子会社から独立しており、また、監査人としてのその他の倫理上の責任
を果たしている。当監査法人は、結論の表明の基礎となる証拠を入手したと判断している。
中間連結財務諸表に対する経営者並びに監査役及び監査役会の責任
経営者の責任は、期中連結財務諸表に係る我が国において一般に公正妥当と認められる企業会計の基準に準拠して中
間連結財務諸表を作成し適正に表示することにある。これには、不正又は誤謬による重要な虚偽表示のない中間連結財
務諸表を作成し適正に表示するために経営者が必要と判断した内部統制を整備及び運用することが含まれる。
中間連結財務諸表を作成するに当たり、経営者は、継続企業の前提に基づき中間連結財務諸表を作成することが適切
であるかどうかを評価し、期中連結財務諸表に係る我が国において一般に公正妥当と認められる企業会計の基準に基づ
いて継続企業に関する事項を開示する必要がある場合には当該事項を開示する責任がある。
監査役及び監査役会の責任は、財務報告プロセスの整備及び運用における取締役の職務の執行を監視することにあ
る。
27/28
EDINET提出書類
株式会社J−オイルミルズ(E00434)
半期報告書
中間連結財務諸表の期中レビューにおける監査人の責任
監査人の責任は、監査人が実施した期中レビューに基づいて、期中レビュー報告書において独立の立場から中間連結
財務諸表に対する結論を表明することにある。
監査人は、我が国において一般に公正妥当と認められる期中レビューの基準に従って、期中レビューの過程を通じ
て、職業的専門家としての判断を行い、職業的懐疑心を保持して以下を実施する。
・
主として経営者、財務及び会計に関する事項に責任を有する者等に対する質問、分析的手続その他の期中レビュー
手続を実施する。期中レビュー手続は、我が国において一般に公正妥当と認められる監査の基準に準拠して実施され
る年度の財務諸表の監査に比べて限定された手続である。
・
継続企業の前提に関する事項について、重要な疑義を生じさせるような事象又は状況に関して重要な不確実性が認
められると判断した場合には、入手した証拠に基づき、中間連結財務諸表において、期中連結財務諸表に係る我が国
において一般に公正妥当と認められる企業会計の基準に準拠して、適正に表示されていないと信じさせる事項が認め
られないかどうか結論付ける。また、継続企業の前提に関する重要な不確実性が認められる場合は、期中レビュー報
告書において中間連結財務諸表の注記事項に注意を喚起すること、又は重要な不確実性に関する中間連結財務諸表の
注記事項が適切でない場合は、中間連結財務諸表に対して限定付結論又は否定的結論を表明することが求められてい
る。監査人の結論は、期中レビュー報告書日までに入手した証拠に基づいているが、将来の事象や状況により、企業
は継続企業として存続できなくなる可能性がある。
・
中間連結財務諸表の表示及び注記事項が、期中連結財務諸表に係る我が国において一般に公正妥当と認められる企
業会計の基準に準拠していないと信じさせる事項が認められないかどうかとともに、関連する注記事項を含めた中間
連結財務諸表の表示、構成及び内容、並びに中間連結財務諸表が基礎となる取引や会計事象を適正に表示していない
と信じさせる事項が認められないかどうかを評価する。
・
中間連結財務諸表に対する結論表明の基礎となる、会社及び連結子会社の財務情報に関する証拠を入手する。監査
人は、中間連結財務諸表の期中レビューに関する指揮、監督及び査閲に関して責任がある。監査人は、単独で監査人
の結論に対して責任を負う。
監査人は、監査役及び監査役会に対して、計画した期中レビューの範囲とその実施時期、期中レビュー上の重要な発
見事項について報告を行う。
監査人は、監査役及び監査役会に対して、独立性についての我が国における職業倫理に関する規定を遵守したこと、
並びに監査人の独立性に影響を与えると合理的に考えられる事項、及び阻害要因を除去するための対応策を講じている
場合又は阻害要因を許容可能な水準にまで軽減するためのセーフガードを適用している場合はその内容について報告を
行う。
利害関係
会社及び連結子会社と当監査法人又は業務執行社員との間には、公認会計士法の規定により記載すべき利害関係はな
い。
以
(注)1.上記の期中レビュー報告書の原本は当社(半期報告書提出会社)が別途保管しております。
2.XBRLデータは期中レビューの対象には含まれていません。
28/28
上
 「
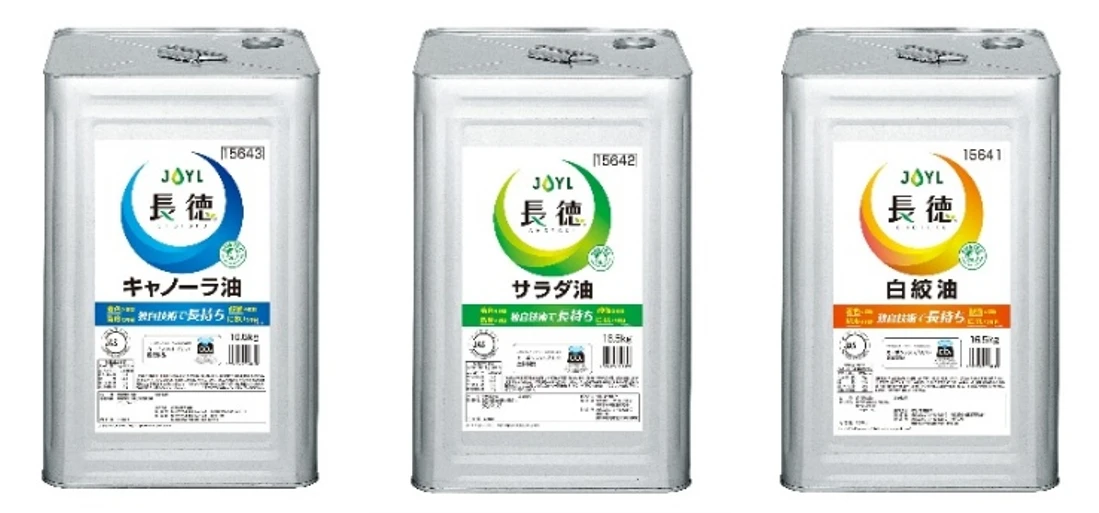
 オリーブオイル」をはじめとする油脂製品を主力とし、特に業務用油脂では高いシェアを誇ります。マーガリン類、油糧(ミール)、スターチ、機能性素材など幅広い事業を展開しており、プラスチック使用量を6割以上※注削減した紙パックの食用油シリーズやCFP(Carbon Footprint of Products)マークを取得した業務用の長持ち油「長徳®」シリーズなど、植物由来の原料から価値を引き出し「おいしさ×健康×低負荷」の実現を目指しています。
詳細については