有価証券報告書 第98期 自 至 2025年4月1日 2026年3月31日 不二製油株式会社 E00431 目 次 頁 第98期有価証券報告書 【表紙】 第一部【企業情報】 ……………………………………………………………………………………………………… 第1【企業の概況】 ………………………………………………………………………………………………………
有価証券報告書
第98期
自
至
2025年4月1日
2026年3月31日
不二製油株式会社
E00431
目
次
頁
第98期有価証券報告書
【表紙】
第一部【企業情報】 ………………………………………………………………………………………………………
第1【企業の概況】 ……………………………………………………………………………………………………
1【主要な経営指標等の推移】 …………………………………………………………………………………
2【沿革】 …………………………………………………………………………………………………………
3【事業の内容】 …………………………………………………………………………………………………
4【関係会社の状況】 ……………………………………………………………………………………………
第2【事業の状況】 ……………………………………………………………………………………………………
1【経営方針、経営環境及び対処すべき課題等】 ……………………………………………………………
2【サステナビリティに関する考え方及び取組】 ……………………………………………………………
3【事業等のリスク】 ……………………………………………………………………………………………
4【経営者による財政状態、経営成績及びキャッシュ・フローの状況の分析】 …………………………
5【重要な契約等】 ………………………………………………………………………………………………
6【研究開発活動】 ………………………………………………………………………………………………
第3【設備の状況】 ……………………………………………………………………………………………………
1【設備投資等の概要】 …………………………………………………………………………………………
2【主要な設備の状況】 …………………………………………………………………………………………
3【設備の新設、除却等の計画】 ………………………………………………………………………………
第4【提出会社の状況】 ………………………………………………………………………………………………
1【株式等の状況】 ………………………………………………………………………………………………
2【自己株式の取得等の状況】 …………………………………………………………………………………
3【配当政策】 ……………………………………………………………………………………………………
4【コーポレート・ガバナンスの状況等】 ……………………………………………………………………
5【従業員の状況等】 ……………………………………………………………………………………………
第5【経理の状況】 ……………………………………………………………………………………………………
1【連結財務諸表等】 ……………………………………………………………………………………………
2【財務諸表等】 …………………………………………………………………………………………………
第6【提出会社の株式事務の概要】 …………………………………………………………………………………
第7【提出会社の参考情報】 …………………………………………………………………………………………
1【提出会社の親会社等の情報】 ………………………………………………………………………………
2【その他の参考情報】 …………………………………………………………………………………………
第二部【提出会社の保証会社等の情報】 ………………………………………………………………………………
監査報告書
内部統制報告書
1
1
1
4
5
8
11
11
17
30
32
40
41
45
45
45
47
48
48
51
52
53
78
83
84
173
192
193
193
193
194
【表紙】
【提出書類】
有価証券報告書
【根拠条文】
金融商品取引法第24条第1項
【提出先】
関東財務局長
【提出日】
2026年6月22日
【事業年度】
第98期(自
【会社名】
不二製油株式会社
【英訳名】
FUJI OIL CO., LTD.
【代表者の役職氏名】
代表取締役社長CEO
【本店の所在の場所】
大阪府泉佐野市住吉町1番地
【電話番号】
072-463-1081
【事務連絡者氏名】
取締役上席執行役員CFO
【最寄りの連絡場所】
大阪府泉佐野市住吉町1番地
【電話番号】
072-463-1081
【事務連絡者氏名】
取締役上席執行役員CFO
【縦覧に供する場所】
不二製油株式会社東京支社
(東京都港区東新橋1丁目9番1号(東京汐留ビルディング内))
株式会社東京証券取引所
2025年4月1日
至
大森
2026年3月31日)
達司
前田
淳
前田
淳
(東京都中央区日本橋兜町2番1号)
第一部【企業情報】
第1【企業の概況】
1【主要な経営指標等の推移】
(1)連結経営指標等
国際財務報告基準
回次
決算年月
移行日
第97期
第98期
2024年
4月1日
2025年3月
2026年3月
売上高
(百万円)
-
671,207
772,288
税引前当期利益
(百万円)
-
6,900
23,430
親会社の所有者に帰属する当期利益
(百万円)
-
3,863
11,142
親会社の所有者に帰属する当期包括利益
(百万円)
-
△1,543
38,010
親会社の所有者に帰属する持分
(百万円)
220,477
206,923
240,159
総資産額
(百万円)
477,193
597,076
636,933
1株当たり親会社所有者帰属持分
(円)
2,564.76
2,406.81
2,793.12
基本的1株当たり当期利益
(円)
-
44.94
129.60
希薄化後1株当たり当期利益
(円)
-
-
-
親会社所有者帰属持分比率
(%)
46.2
34.7
37.7
親会社所有者帰属持分当期利益率
(%)
-
1.80
5.00
株価収益率
(倍)
-
68.13
27.71
営業活動によるキャッシュ・フロー
(百万円)
-
△48,828
54,840
投資活動によるキャッシュ・フロー
(百万円)
-
△21,753
△46,847
財務活動によるキャッシュ・フロー
(百万円)
-
113,188
△38,590
現金及び現金同等物の期末残高
(百万円)
28,499
70,840
46,811
(名)
5,731
(485)
5,654
(451)
5,891
(496)
従業員数
(外、平均臨時雇用者数)
(注)1.第98期より国際財務報告基準(以下「IFRS」という。)に基づいて連結財務諸表を作成しております。
2.希薄化後1株当たり当期利益につきましては、潜在株式が存在しないため記載しておりません。
3.当社は、当社取締役(社外取締役及び監査等委員である取締役を除く)並びに執行役員に対し、信託を用い
た株式報酬制度を導入しております。「1株当たり親会社所有者帰属持分」及び「基本的1株当たり当期利
益」の算定上の基礎となる期末の普通株式の数及び期中平均株式数には、その計算において控除する自己株
式に当該信託口が保有する当社株式を含めております。
-1-
日本基準
回次
決算年月
第94期
第95期
第96期
第97期
第98期
2022年3月
2023年3月
2024年3月
2025年3月
2026年3月
売上高
(百万円)
433,831
557,410
564,087
671,211
772,285
経常利益
(百万円)
14,360
9,690
16,791
5,304
26,684
親会社株主に帰属する
当期純利益
(百万円)
11,504
6,126
6,524
2,230
12,325
包括利益
(百万円)
31,254
18,811
37,273
△4,681
41,131
純資産額
(百万円)
189,495
210,983
244,291
214,524
250,944
総資産額
(百万円)
416,617
468,789
470,221
596,564
635,556
1株当たり純資産額
(円)
2,168.13
2,359.34
2,700.95
2,448.40
2,868.33
1株当たり当期純利益
(円)
133.84
71.27
75.90
25.95
143.36
(円)
-
-
-
-
-
自己資本比率
(%)
44.7
43.3
49.4
35.3
38.8
自己資本利益率
(%)
6.64
3.15
3.00
1.01
5.39
株価収益率
(倍)
14.79
26.98
31.50
118.01
25.05
営業活動による
キャッシュ・フロー
(百万円)
3,537
7,594
48,242
△50,631
54,263
投資活動による
キャッシュ・フロー
(百万円)
△18,807
△16,487
8,803
△21,738
△46,823
(百万円)
9,387
9,804
△50,007
114,931
△37,380
(百万円)
15,915
18,991
27,480
69,846
46,440
(名)
5,623
(528)
5,799
(463)
5,731
(485)
5,654
(451)
5,891
(496)
潜在株式調整後
1株当たり当期純利益
財務活動による
キャッシュ・フロー
現金及び現金同等物の
期末残高
従業員数
(外、平均臨時雇用者数)
(注)1.潜在株式調整後1株当たり当期純利益につきましては、潜在株式が存在しないため記載しておりません。
2.当社は、当社取締役(社外取締役及び監査等委員である取締役を除く)並びに執行役員に対し、信託を用い
た株式報酬制度を導入しております。「1株当たり純資産額」及び「1株当たり当期純利益」の算定上の基
礎となる期末の普通株式の数及び期中平均株式数には、その計算において控除する自己株式に当該信託口が
保有する当社株式を含めております。
3.第98期の日本基準による諸数値につきましては、金融商品取引法第193条の2第1項の規定に基づく監査を
受けておりません。
-2-
(2)提出会社の経営指標等
回次
第94期
第95期
第96期
第97期
第98期
決算年月
2022年3月
2023年3月
2024年3月
2025年3月
2026年3月
売上高及び営業収益
(百万円)
6,496
6,212
6,619
10,139
224,110
経常利益
(百万円)
1,255
880
1,755
3,579
25,082
当期純利益又は当期純損失(△)
(百万円)
2,463
1,659
△5,163
△29,671
78,359
資本金
(百万円)
13,208
13,208
13,208
13,208
13,208
発行済株式総数
(千株)
87,569
87,569
87,569
87,569
87,569
純資産額
(百万円)
123,528
120,766
111,408
76,757
151,873
総資産額
(百万円)
239,118
240,312
207,238
296,579
411,197
(円)
1,437.01
1,404.84
1,295.98
892.80
1,766.33
52.00
52.00
52.00
52.00
52.00
(26.00)
(26.00)
(26.00)
(26.00)
(26.00)
1株当たり純資産額
1株当たり配当額
(うち1株当たり中間配当額)
(円)
1株当たり当期純利益又は
1株当たり当期純損失(△)
(円)
28.66
19.30
△60.06
△345.13
911.38
潜在株式調整後1株当たり
当期純利益
(円)
-
-
-
-
-
自己資本比率
(%)
51.7
50.3
53.8
25.9
36.9
自己資本利益率
(%)
1.98
1.36
△4.45
△31.54
68.55
株価収益率
(倍)
69.09
99.61
-
-
3.94
配当性向
(%)
181.45
269.36
-
-
5.71
従業員数
(外、平均臨時雇用者数)
(名)
137
(5)
134
(4)
141
(5)
131
(8)
1,550
(212)
株主総利回り
(比較指標:配当込みTOPIX)
(%)
(%)
68.8
(102.0)
68.6
(107.9)
86.2
(152.5)
110.7
(150.2)
130.4
(202.2)
最高株価
(円)
3,010
2,445
2,635
3,722
4,312
最低株価
(円)
1,931
1,746
1,895
2,226
2,716
(注)1.第94期、第95期及び第98期の潜在株式調整後1株当たり当期純利益につきましては、潜在株式が存在しない
ため記載しておりません。
2.第98期より為替予約取引に係る会計処理を変更しており、第97期の関連する主要な経営指標等について遡及
処理の内容を反映させた数値を記載しております。
3.第96期及び第97期の潜在株式調整後1株当たり当期純利益につきましては、1株当たり当期純損失であり、
また潜在株式が存在しないため記載しておりません。
4.第96期及び第97期の株価収益率及び配当性向につきましては、1株当たり当期純損失であるため記載してお
りません。
5.第98期における経営指標等の大幅な変動は、2025年4月1日付で当社の連結子会社であった旧不二製油株式
会社を吸収合併したことによるものです。
6.最高株価及び最低株価は、2022年4月3日以前は東京証券取引所(市場第一部)におけるものであり、2022
年4月4日以降は東京証券取引所(プライム市場)におけるものであります。
7.当社は、当社取締役(社外取締役及び監査等委員である取締役を除く)並びに執行役員に対し、信託を用い
た株式報酬制度を導入しております。「1株当たり純資産額」及び「1株当たり当期純利益又は1株当たり
当期純損失」の算定上の基礎となる期末の普通株式の数及び期中平均株式数には、その計算において控除す
る自己株式に当該信託口が保有する当社株式を含めております。
8.2026年3月期の1株当たり配当額52円00銭のうち、期末配当額26円00銭については、2026年6月23日開催予
定の定時株主総会の決議事項になっています。
-3-
2【沿革】
1950年10月
伊藤忠商事株式会社の全額出資(資本金300万円)による不二製油株式会社を設立し、不二蚕糸株式会社
1951年2月
1953年11月
1954年1月
大阪工場を買収。
圧搾工場を新設してコプラの製油を開始、我が国最初の圧抽式製油に成功。
本社を大阪工場所在地から大阪市東区安土町(現大阪市中央区安土町)に移転。
我が国最初の本格的パーム核油搾油を開始。
1955年8月
1955年9月
1961年10月
1963年2月
神戸工場を建設し操業を開始。
大阪工場に油脂溶剤分別装置を完成し、我が国最初のハードバター(商品名
始。
株式を大阪証券取引所市場第二部に上場。
洋生菓子用チョコレートの販売開始。
1967年4月
植物性クリームの生産開始。
1967年12月
1968年4月
1969年4月
大阪工場に大豆たん白分離設備を完成し、大豆たん白事業を開始。
泉佐野食品コンビナートに約192千平方メートルの工場建設用地を取得。
阪南工場第1期工事完了、操業を開始。
1971年4月
1973年2月
阪南工場第2期工事完了、操業拡大。大阪工場の移転を完了し、閉鎖。
大阪証券取引所市場第一部に指定。
1974年7月
1978年10月
本社(大阪支店)を大阪市南区八幡町(現
東京証券取引所市場第一部に上場。
1981年10月
1986年10月
シンガポールにFUJI OIL (SINGAPORE) PTE. LTD.を設立。
マレーシアにPALMAJU EDIBLE OIL SDN. BHD.を設立。
1987年6月
1988年5月
米国に海外子会社FUJI SPECIALTIES, INC.及び同社の子会社FUJI VEGETABLE OIL, INC.を設立。
シンガポールにWOODLANDS SUNNY FOODS PTE. LTD.を設立。
1990年2月
1992年2月
つくば研究開発センターの業務開始。
ベルギーにVAMO-FUJI SPECIALITIES,N.V.(現
1994年10月
関東工場を建設し、操業を開始。
1995年12月
1999年2月
中国に不二製油(張家港)有限公司を設立。
阪南事業所内のセンタービル(1998年10月完成)に本社事務所を移転。
2001年8月
2004年8月
2005年12月
関東工場内にチョコレート工場を建設し、操業を開始。
中国に天津不二蛋白有限公司を設立。
りんくう工場を建設し、操業を開始。
2006年5月
千葉工場を建設し、操業を開始。
2010年2月
2012年3月
タイにFUJI OIL (THAILAND) CO., LTD.を設立。
シンガポールにアジア地域統括会社 FUJI OIL ASIA PTE. LTD.を設立。
2014年7月
2015年1月
本社を大阪府泉佐野市に移転。
中国に不二(中国)投資有限公司を設立。
2015年3月
シンガポールにアジアR&Dセンターを開設。
2015年6月
2015年10月
HARALD INDÚSTRIA E COMÉRCIO DE ALIMENTOS LTDAの株式を取得。
商号を「不二製油グループ本社株式会社」に変更し、新設承継会社として「不二製油株式会社」を設立。
2016年8月
2016年8月
FUJI GLOBAL CHOCOLATE (M) SDN. BHD.の株式を取得。
阪南事業所内に不二サイエンスイノベーションセンターを開設。
2017年4月
中国に不二製油(肇慶)有限公司を設立。
2017年11月
2018年3月
マレーシアにUNIFUJI SDN. BHD.を設立。
米国にFuji Oil New Orleans, LLCを設立。
2018年7月
INDUSTRIAL FOOD SERVICES PTY LIMITEDの株式を取得。
2019年1月
2019年7月
Blommer Chocolate Company(現 Blommer Chocolate Company, LLC)の株式を取得。
ドイツにFuji Brandenburg GmbHを設立。
2022年4月
2022年4月
米国に合弁会社Fuji Oil International, Inc.を設立。
東京証券取引所の市場区分の見直しにより、東京証券取引所の市場第一部からプライム市場に移行。
2022年5月
2025年3月
米国の合弁会社Fuji Oil International, Inc.が現物出資を受け、米国のOilseeds International, Ltd.
(現 Oilseeds International, LLC)の株式を取得。
Fuji Oil International Inc.の株式を追加取得し、同社を完全子会社化。
2025年4月
完全子会社の不二製油株式会社を吸収合併し、商号を「不二製油株式会社」に変更。
2025年4月
PROVENCE HUILES S.A.Sの株式を取得。
メラノバター)の製造を開
大阪市中央区西心斎橋)に移転。
-4-
FUJI OIL EUROPE)を設立。
3【事業の内容】
当社グループは、当社、子会社41社(うち連結子会社39社)、関連会社6社(うち持分法適用会社5社)、その他
の関係会社1社及びその他の関係会社の親会社1社で構成され、植物性油脂、業務用チョコレート、乳化・発酵素
材、大豆加工素材の製造販売を主として行っており、さらに各事業に関連する物流及びその他のサービス等の事業活
動を展開しております。
また、当社は有価証券の取引等の規制に関する内閣府令第49条第2項に規定する特定上場会社等に該当しており、
インサイダー取引規制の重要事実の軽微基準については連結ベースの数値に基づいて判断することになります。
当社グループの事業に係わる位置付け及びセグメントとの関連は、次のとおりです。
報告セグメント
主要な製品
主要な会社
・不二製油(株)
・FUJI OIL ASIA PTE. LTD.
・FUJI OIL (SINGAPORE) PTE. LTD.
・PALMAJU EDIBLE OIL SDN. BHD.
・不二(中国)投資有限公司
・不二製油(張家港)有限公司
・食用加工油脂
・FUJI SPECIALTIES, INC.
植物性油脂
・食用油
・FUJI VEGETABLE OIL, INC.
・チョコレート用油脂
・Fuji Oil International Inc.
・Oilseeds International, LLC
・FUJI OIL EUROPE
・FUJI OIL GHANA LIMITED
・UNIFUJI SDN. BHD.
・RITO Partnership
・PROVENCE HUILES S.A.S
・不二製油(株)
・PT. FREYABADI INDOTAMA
・FUJI GLOBAL CHOCOLATE (M) SDN. BHD.
・INDUSTRIAL FOOD SERVICES PTY LIMITED
・不二(中国)投資有限公司
・不二製油(張家港)有限公司
業務用チョコレート
・チョコレート
・Blommer Chocolate Manufacturing
(Shanghai) Co., Ltd.
・HARALD INDÚSTRIA E COMÉRCIO DE
ALIMENTOS LTDA
・Blommer Chocolate Company, LLC
・FUJI OIL EUROPE
・不二製油(株)
・(株)フジサニーフーズ
・クリーム
・オーム乳業(株)
・マーガリン
・FUJI OIL ASIA PTE. LTD.
・フィリング
乳化・発酵素材
・WOODLANDS SUNNY FOODS PTE. LTD.
・チーズ風味素材
・FUJI OIL (THAILAND) CO., LTD.
・USS製法による豆乳加工品
・不二(中国)投資有限公司
及びプレミアム豆乳製品
・不二製油(張家港)有限公司
・不二製油(肇慶)有限公司
・不二製油(株)
・大豆たん白素材
・(株)フジサニーフーズ
大豆加工素材
・大豆たん白食品
・天津不二蛋白有限公司
・水溶性大豆多糖類
・Fuji Brandenburg GmbH
以上のほか、その他の関係会社の親会社である伊藤忠商事㈱とは、主に不二製油㈱が原材料等の購入及び製品販売
等の取引を行っております。
-5-
以上に述べた当社グループの事業系統図は次のとおりです。(2026年3月31日現在)
-6-
-7-
4【関係会社の状況】
関係内容
名称
住所
資本金又は
出資金
(百万円)
セグメント
の名称
主要な事業の
内容
議決権の所
有割合又は
被所有割合
(%)
役員の兼任
当社役当社従
員
業員
(名) (名)
資金
援助
営業上の取
引
設備の
賃貸借
等
(連結子会社)
乳化・発酵
㈱フジサニーフーズ
大阪府吹田市
309
素材
大豆加工素
材
製品等の売
乳化・発酵素
材、大豆加工
100.0
-
8
なし
素材の卸売
買、当社へ
のシステム
利用料支払
なし
製品等の売
FUJI OIL ASIA PTE.
LTD.
シンガポール
(注)1
68,512千
米ドル
植物性油脂
乳化・発酵
素材
買、同社の
地域統括、植
物性油脂、乳
化・発酵素材
100.0
1
-
なし
管理業務の
受託、当社
なし
へのシステ
の卸売
ム利用料支
払
製品等の売
FUJI OIL
(SINGAPORE) PTE.
LTD.
(注)1、2
WOODLANDS SUNNY
FOODS PTE. LTD.
シンガポール
SDN BHD
(注)1、2
FUJI OIL (THAILAND)
CO., LTD.
(注)1、2
PT. FREYABADI
INDOTAMA
(注)2
シンガポール
マレーシア
10,088千
米ドル
乳化・発酵
素材
54,000千
ジョホール
マレーシア
リンギット
植物性油脂
タイ
ラヨーン県
730,000千
タイバーツ
乳化・発酵
素材
49,039百万
インドネシア
インドネシア
プルワカルタ
ルピア
マレーシア
ジョホール
オーストラリ
SERVICES PTY
LIMITED
ア
ビクトリア州
20,000千
マレーシア
リンギット
73千豪ドル
業務用チョ
コレート
業務用チョ
コレート
業務用チョ
コレート
植物性油脂
不二(中国)投資有
業務用チョ
中国上海市
643,962千元
不二製油(張家港)
不二製油(肇慶)有
限公司
(注)1、2
製造販売
(100.0)
買、当社へ
-
1
なし
の特許料、
システム利
なし
調製品等の製
造販売
100.0
(100.0)
植物性油脂の
100.0
製造販売
(100.0)
乳化・発酵素
材の製造販売
90.0
(90.0)
-
1
なし
-
1
なし
買、当社へ
のシステム
利用料支払
製品等の購
入
なし
なし
-
1
なし
売、当社へ
のシステム
なし
利用料支払
INDUSTRIAL FOOD
有限公司
(注)1、2
100.0
製品等の販
(注)2
限公司
(注)1
植物性油脂の
用料支払
FUJI GLOBAL
CHOCOLATE (M) SDN.
BHD.
米ドル
植物性油脂
製品等の売
(注)2
PALMAJU EDIBLE OIL
11,741千
中国江蘇省
中国広東省
273,480千元
200,000千元
コレート
乳化・発酵
素材
業務用チョコ
レートの製造
販売
業務用チョコ
レートの製造
販売
製品等の売
51.0
(51.0)
-
-
なし
なし
利用料支払
製品等の売
100.0
(100.0)
-
1
なし
買、当社へ
のシステム
なし
利用料支払
業務用チョコ
レートの製造
販売
買、当社へ
のシステム
100.0
-
1
なし
製品等の購
入
なし
地域統括、植
物性油脂、業
務用チョコレ
ート、乳化・
発酵素材の卸
製品等の売
100.0
1
4
なし
買、当社へ
のシステム
利用料支払
なし
売
植物性油脂
植物性油脂、
業務用チョ
業務用チョコ
コレート
乳化・発酵
レート、乳
化・発酵素材
素材
の製造販売
乳化・発酵
素材
乳化・発酵素
材の製造販売
製品等の売
98.1
(98.1)
-
2
なし
買、当社へ
のシステム
利用料支払
98.1
(98.1)
-
2
なし
製品等の販
売、当社へ
のシステム
利用料支払
-8-
なし
なし
関係内容
住所
資本金又は
出資金
(百万円)
中国天津市
91,325千元
名称
天津不二蛋白有限公
司
セグメント
の名称
主要な事業の
内容
大豆加工素
大豆加工素材
材
の製造販売
議決権の所
有割合又は
被所有割合
(%)
100.0
役員の兼任
当社役当社従
員
業員
(名) (名)
資金
援助
営業上の取
引
製品等の売
設備の
賃貸借
等
-
2
なし
-
2
あり
なし
なし
2
1
あり
なし
なし
1
1
なし
なし
なし
買
なし
Blommer Chocolate
Manufacturing
(Shanghai) Co.,
Ltd.
中国上海市
業務用チョコ
33,000千
業務用チョ
米ドル
コレート
レートの製造
販売
(100.0)
100.0
植物性油脂
地域統括
100.0
(注)1、2
FUJI SPECIALTIES,
INC.
(注)1
Fuji Oil
International Inc.
(注)1、2
米国
デラウエア州
米国
デラウエア州
100,000千
米ドル
10千
米ドル
植物性油脂
北米油脂事業
100.0
の地域統括
(100.0)
同社の管理
FUJI VEGETABLE OIL, 米国
INC.
ニューヨーク
(注)1、2
州
101,500千
米ドル
植物性油脂
植物性油脂の
100.0
製造販売
(100.0)
-
1
なし
業務の受
託、当社へ
の特許料支
なし
払
HARALD INDÚSTRIA E
COMÉRCIO DE
ALIMENTOS LTDA
ブラジル
サンパウロ州
(注)1、2
Blommer Chocolate
Company, LLC
(注)2、4
177,834千
ブラジル
レアル
米国
イリノイ州
19千米ドル
ベルギー
17,900千
(注)1、2
ゲント
ユーロ
LIMITED
(注)2
業務用チョコ
レートの製造
販売
製品等の販
100.0
(0.1)
1
3
なし
ガーナ
テチマン
レートの製造
100.0
コレート
販売、ココア
豆加工事業
(100.0)
業務用チョ
コレート
19,030千
ガーナ
植物性油脂
セディ
2
1
あり
植物性油脂、
100.0
レートの製造
販売
(0.7)
-
1
なし
100.0
-
1
あり
100.0
1
2
なし
なし
なし
-
1
なし
なし
なし
100.0
25千
大豆加工素
大豆加工素材
ユーロ
材
の製造販売
PROVENCE HUILES
S.A.S
フランス
ヴィトロル
3,483千
ユーロ
植物性油脂
植物性油脂の
製造販売
買、同社の
なし
(100.0)
ゴルセン
なし
2
製造販売
ドイツ
管理業務の
受託
1
植物性油脂の
GmbH
売、同社の
製品等の売
業務用チョコ
Fuji Brandenburg
なし
製品等の販
業務用チョ
植物性油脂
売、同社の
管理業務の
受託
業務用チョコ
FUJI OIL EUROPE
FUJI OIL GHANA
業務用チョ
コレート
管理業務の
受託
なし
製品等の売
買
なし
なし
なし
その他16社
(持分法適用関連会
社)
PT. MUSIM MAS-FUJI
インドネシア
(注)2
ブカシ
UNIFUJI SDN. BHD.
(注)2
マレーシア
ペラック
RITO Partnership
(注)2
米国
アーカンソー
州
250,000百万
植物性油脂の
49.0
製造販売
(49.0)
植物性油脂
植物性油脂の
製造販売
50.0
(50.0)
-
1
なし
なし
なし
20,808千
米ドル
植物性油脂
植物性油脂の
製造販売
50.0
(50.0)
-
-
なし
なし
なし
164千
業務用チョ
-
1
なし
インドネシア
植物性油脂
ルピア
60,000千
マレーシア
リンギット
FREYABADI
(THAILAND) CO.,
タイ
LTD.
(注)2
ラヨーン県
タイバーツ
コレート
業務用チョコ
レートの製造
販売
-9-
50.0
(50.0)
製品等の売
買
なし
関係内容
名称
住所
JPG FUJI SDN.BHD.
マレーシア
(注)2
ジョホール
資本金又は
出資金
(百万円)
セグメント
の名称
120,000千
マレーシア
植物性油脂
リンギット
主要な事業の
内容
議決権の所
有割合又は
被所有割合
(%)
植物性油脂の
製造販売
49.0
(49.0)
役員の兼任
当社役当社従
員
業員
(名) (名)
資金
援助
営業上の取
引
設備の
賃貸借
等
-
1
なし
なし
なし
-
-
なし
なし
なし
-
-
なし
(その他の関係会社)
食糧関連ビジ
ネスに関する
伊藤忠フードインベ
ストメント(同)
東京都港区
1
-
調査・コンサ
ルティング、
食糧関連ビジ
被所有
42.5
ネスに対する
投融資
(その他の関係会社
の親会社)
被所有
伊藤忠商事㈱
大阪市北区
(注)2、3
253,448
-
総合商社
43.8
(42.5)
(注)1.特定子会社です。
2.「議決権の所有割合又は被所有割合」欄の(
製品等の売
買
なし
)は間接所有割合であり、内数です。
3.有価証券報告書の提出会社です。
4.Blommer Chocolate Company, LLCについては、売上高(連結会社相互間の内部売上高を除く)の連結売上高
に占める割合が10%を超えております。
主要な損益情報等
Blommer Chocolate
Company, LLC
①
売上高
184,879百万円
②
③
④
⑤
税引前利益又は税引前損失(△)
当期利益又は当期損失(△)
純資産額
総資産額
△16,036百万円
△16,136百万円
23,592百万円
116,215百万円
第2【事業の状況】
1【経営方針、経営環境及び対処すべき課題等】
文中の将来に関する事項は、提出日現在において当社グループが入手可能な情報に基づき作成したものです。実際
の成果や業績は、今後様々な要因によって、記載されている内容とは異なる可能性があります。
(1)経営の基本方針
当社グループは、食品企業としての責任を強く自覚し、私たちの使命、目指す姿、行動する上で持つべき価値観、
そして行動原則を明文化した「不二製油グループ憲法」を経営の基本方針として掲げております。本憲法は、グルー
プ社員全員の価値観の共有化を図るとともにグループガバナンスの基本であり、判断・行動の優先基準付けの拠り所
となるものです。当社グループは、「不二製油グループ憲法」のミッション「私たち不二製油グループは、食の素材
の可能性を追求し、食の歓びと健康に貢献します。」を会社運営の基本方針としています。
当社グループは創業以来、植物性素材のもつ可能性を追求し、おいしいもの、体によいものをお届けしたいという
想いで製品を生み出し、価値を提供してきました。「不二製油グループ憲法」のミッションの下、当社グループが目
指す姿として「植物性素材でおいしさと健康を追求し、サステナブルな食の未来を共創します。」をビジョンとし、
社会課題の解決と持続的な成長を目指しています。
社員一人一人が本憲法に示されているバリュー(価値観)を共有し、プリンシプル(行動原則)を実践すること
で、ビジョンを実現し、全てのステークホルダーに対する貢献を果たしてまいります。
<不二製油グループ憲法>
(2)ビジョン実現に向けた考え方
食が消費者に届くまでには、複雑なサプライチェーンと多くのステークホルダーが関与しています。食の社会課題
の解決には、一社のみならず消費者も含めたバリューチェーン全体で価値向上に取り組むことが重要です。当社グル
ープは食のバリューチェーンにおける川中の機能を担い、研究開発や生産活動を通して、顧客とその先の消費者の困
りごとに対するソリューションの提供に努めています。
当社グループは心身の健康・地球環境問題・人権等、食のバリューチェーン上の社会課題を機敏に捉え、当社の提
供価値につながるESGマテリアリティを特定し、経営戦略の立案・推進に活用しています。
経営戦略に基づき、財務資本、製造資本、人的資本等、当社グループが有する経営資本を活用し、4つの事業が持
つ強みを組み合わせて、当社グループならではの植物性素材を創出しています。この植物性素材により食の選択肢を
広げ“おいしさと健康”“サステナブルな食のバリューチェーン”を構築することが、当社グループの提供価値であ
ると考えています。
そして、当社グループの提供価値が顧客価値=消費者価値となり、獲得した利益やキャッシュ・フローは食のバリ
ューチェーン全体のサステナビリティ向上に寄与する当社グループの持続的な成長を支える財務基盤の強化に資する
とともに、提供価値の拡大及び新たな価値の創出のために再投資しています。
当社グループは価値創造プロセスの循環を通じ、持続的な成長を果たし、「サステナブルな食の未来」の実現を目
指しています。
当社グループの経営資本は以下のとおりです。
“財務資本”とは、当社グループの事業活動により獲得した利益やキャッシュ・フローを持続的な企業価値向上へ
向けて再投資することで構築される財務基盤です。2025年度において親会社の所有者に帰属する持分は2,401億59百
万円、有利子負債は2,683億81百万円、営業キャッシュ・フローは548億40百万円の収入となりました。
詳細は「4 経営者による財政状態、経営成績及びキャッシュ・フローの状況の分析」及び「第5 経理の状況」に
記載のとおりです。
“製造資本”とは、当社グループの安全・安心で安定した品質の製品を生産、顧客に提供するための製造拠点・製
造能力です。2026年3月末時点においては、連結子会社39社、持分法適用会社5社がグループの生産を支えていま
す。また、2025年度の設備投資額は292億25百万円となりました。
詳細は「第1 企業の概況 3 事業の内容」、「第1 企業の概況 4 関係会社の状況」及び「第3 設備の
状況」に記載のとおりです。
“人的資本”とは、当社グループの企業活動を支え、持続的な成長を支える人材です。2026年3月末時点で連結従
業員5,891名となり、うち約7割が海外拠点で働く従業員となりました。詳細は「第4 提出会社の状況 5 従業
員の状況等」及び「2 サステナビリティに関する考え方及び取組(3)戦略」に記載の、人的資本に関する当社の
考え方及び取組をご覧ください。
“知的資本”とは、当社グループの技術革新と社会課題に貢献する製品の創出を支える研究成果と技術力です。
2025年度の研究開発費は70億77百万円となりました。特許ポートフォリオ等の研究開発活動に関する情報は「6 研
究開発活動」に記載のとおりです。
“社会・関係資本”とは、食のバリューチェーンの川中に位置する存在として構築してきた、ステークホルダーと
の共創関係です。ステークホルダーとの共創の詳細は「2 サステナビリティに関する考え方及び取組(1)不二製
油グループのサステナビリティ経営」に記載のとおりです。
“自然資本”とは、エネルギーや水、生態系サービス(注)などの自然の恩恵を受けて生産されるパーム、カカ
オ、大豆、シアカーネル等の農産物原料を指します。当社グループの事業活動はこうした自然や生態系サービスに依
存するとともに、その利用を通じて環境や生態系に負の影響を及ぼす可能性があります。当社グループは環境負荷の
低減や持続可能な調達の推進を通じて、自然資本の保全と回復に努めています。
詳細は、「2 サステナビリティに関する考え方及び取組(4)リスク管理 ② 環境マネジメント」に記載のと
おりです。
(注)生態系サービス:食料や水の供給、気候の安定等、生物多様性を基盤とする生態系から得られる恵み
①
不二製油グループの強み
当社グループは創業当初から、南方系油脂と大豆たん白を中核に「植物性素材」にこだわり、パーム、カカオ、
大豆を主原料とした技術の深掘りと横展開で植物性油脂事業、業務用チョコレート事業、乳化・発酵素材事業、大
豆加工素材事業を発展させてきました。当社グループは、その歴史の中で培った各事業固有の技術で製品を創出す
るのみならず、各事業の持つ技術の融合により事業の垣根を越えた新しい、安全・安心で安定した品質の製品を生
み出しています。
また、創業の精神「挑戦と革新」の下、BtoBの食品素材メーカーとして、顧客の課題、困りごとに共に挑み、当
社グループの製品・取組による解決策を提案するとともに、多様化する消費者の食シーンに貢献する‘食’を顧客
と共に創造し、社会課題解決に取り組んでいます。
さらには、当社グループは持続可能な社会の実現に向けて、サプライチェーン上での環境、人権等の社会課題を
解決するべく、事業活動全体を通じて、環境や人権等を尊重するサプライヤー等との信頼関係を構築し、エンゲー
ジメントを高める取組を進めるとともに、これらサプライヤーから主要な原料を調達するサステナブル調達を進め
ています。
主要事業で培ってきた「技術の融合」、「顧客との課題解決力」、「サステナブル調達」は当社グループの歴史
の中で育んできた、大きな強みであり、当社グループビジネスモデルの核となっています。
②
ビジネスモデルと競争優位性
当社グループのビジネスモデルは、「植物性油脂事業」、「業務用チョコレート事業」、「乳化・発酵素材事
業」、「大豆加工素材事業」から構成されています。
当社グループは当社グループと関わる顧客・消費者・社会等のステークホルダーが直面する食の課題解決に取り
組む課題解決型ビジネスを展開しています。
a.植物性油脂事業
―南方系油脂を軸とした高度な利用技術(注1)・サステナブル原料のサプライチェーン―
当社グループは創業当初から、南方系油脂の加工、チョコレート用油脂(CBE:注2)に活路を見出し、南方
系油脂を軸として、様々な油脂の高度な利用技術の革新を進め、植物性油脂事業を基盤事業として展開してきま
した。また、限りある資源の中で、自然との共生によるサステナブルな社会・事業活動を指向しており、サプラ
イチェーン上での環境、人権等の社会課題を解決すべく、早くから農園・農家との協働に取り組み、信頼関係を
構築しています。このような取組で構築してきた‘サステナブル原料のサプライチェーン’も植物性油脂事業の
差別化戦略につながる強みとなっています。
(注)1.高度な利用技術:多様なニーズに合わせて、油脂加工技術と様々な油脂種の組み合わせにより油脂原
料を余すことなく利用し、製品化する技術。
2.CBE:Cocoa Butter Equivalentの略。ココアバターと同等の物性を持ったチョコレート用油脂。
b.業務用チョコレート事業
―油脂技術の融合による多様化する価値を実現する機能性とおいしさの提供―
業務用チョコレート事業は、技術革新を進めてきた当社グループのチョコレート用油脂技術に支えられていま
す。顧客の多様化する商品価値を具現化でき、価値を高める機能性と、口溶けのよさや豊かな風味といった消費
者が求める‘おいしさ’を兼ね備えた高品質なコンパウンドチョコレートに強みを有しています。
c.乳化・発酵素材事業
―乳化・発酵技術により「おいしさと使いやすさ」を提供―
乳化・発酵素材事業は、顧客の商品製造過程における加工安定性や流通過程での保形性等の‘使いやすさ’を
実現できる油脂を使用した乳化技術と、消費者にとっての‘おいしさ’につながる風味を生む発酵技術の融合に
より、製菓・製パン・調理用途等にクリーム、マーガリン、フィリングといった幅広い素材を提供しています。
d.大豆加工素材事業
―大豆のおいしさと栄養を活用した多様な製品群―
当社グループでは創業時から油脂とともに、大豆の豊富な栄養と大豆たん白の特性に着目し、研究を進め、用
途拡大と技術革新を進めてきました。また大豆本来の‘おいしさ’を引き出す研究開発とともに、大豆たん白に
含まれる機能性成分の研究により製品を創出し、多様な製品群を展開しています。大豆に含まれる植物性のタン
パク質は食の未来を見据える中で、重要な食資源の一つです。大豆加工素材事業において社会課題の解決と消費
者の要望に応える多様な高付加価値製品を創出し、提供することで、社会貢献を果たしてまいります。
③
不二製油グループの提供価値
持続可能な社会の実現に向けて、また食と健康への意識の高まりに伴い、消費者からはウェルビーイングにつな
がるおいしくて心と身体に良いものを食べること、つまり「おいしさと健康」の両立と「サステナブルな食のバリ
ューチェーン」への貢献が求められています。当社グループは4つの事業の強みを活かした事業活動を通じ、「社
会価値」と「経済価値」を創出し、ステークホルダーへの貢献を果たしてまいります。
「社会価値」
当社グループの事業活動では、創業以来培ってきた技術、顧客の課題や困りごとを解決する課題解決力、環境や
人権等に配慮した原料の調達、そしてそれらを元に、様々なステークホルダーとの共創によって付加価値の高い製
品を生み出しています。
当社グループは、事業活動を通じ、自然環境への負荷低減に取り組むとともにサステナブルな食資源の供給によ
り、消費者の食の歓び、健康増進、雇用、人権尊重等のウェルビーイングの実現に貢献してまいります。
「経済価値」
当社グループの事業活動により得られた利益やキャッシュ・フローは当社グループの持続的な成長を支える財務
基盤の強化に資するとともに、提供価値の拡大及び新たな価値の創出のために再投資してまいります。
(3)対処すべき課題
当社グループは、2025年度から2027年度を対象期間とする中期経営計画「United for Growth 2027」を、2030年ビ
ジョン実現に向けたPhase2「軌道に乗せる」期間として位置付けており、初年度となる当連結会計年度は、成長領域
の強化など、当初企図した施策において目標を達成することができました。
しかしながら、2024年から発生したカカオ相場の高騰は継続しており、Blommer Chocolate Company, LLC(米国、
以下「Blommer」という。)の収益悪化も継続し、当社グループの連結業績及び資本効率に影響を与え、引続きリス
ク管理の強化に課題を残す結果となりました。
このような状況のもと当社グループが引き続き取り組む対処すべき課題は、以下と認識して対応を進めてまいりま
す。
①
成長領域における収益力の安定化と競争力強化
当社グループの持続的な成長と企業価値向上において、植物性油脂事業及び業務用チョコレート事業を中心とす
る成長領域の収益力を安定的に確保し、競争力を一層強化することが、最も重要な経営課題のひとつであると考え
ています。
植物性油脂事業においては、原料のボラティリティリスクに対して当社グループは、パーム油、ひまわり油、シ
ア脂、米ぬか油など多様な原料を活用した油脂加工技術を強みとして、原料の調達から製造、販売に至るまでのサ
プライチェーン全体の強化を通じて、安定供給と品質の両立を図ってまいりました。気候変動や地政学的な視点か
ら、市場の不確実性は、今後も継続すると予測しており、今後はさらに原料段階からの付加価値化や機能性の高度
化を進めることで、価格競争に依存しない収益構造の構築を目指してまいります。
また、チョコレート用油脂(CBE)のグループ供給体制の強化では、サステナブル調達やトレーサビリティへの
対応が競争優位性の重要な要素となっております。環境・人権に配慮した原料調達体制の構築を進めるとともに、
顧客の要請や各国の規制動向を踏まえた対応力を高めることで、グローバル市場における信頼性と競争力の向上に
取り組んでまいります。
業務用チョコレート事業においては、ピュアチョコレート比率の高いBlommerにおいて引続きカカオ豆の価格変
動への対応が重要な課題と認識しており、原料産地の多角化、適正在庫の厳格な管理に加え、カナダ工場の増産も
含め、コンパウンドチョコレートの増産・拡販にてバランスを改善していきます。
当社グループは長年培ってきた油脂技術を活用した、機能性の高いコンパウンドチョコレートの製造技術とアプ
リケーション提案力を強みとして、日本市場以外でも、機能性を兼ね備えたコンパウンドチョコレートの更なる拡
販など、ブラジル、豪州、欧州を中心に販売拡大を実行してまいります。
②
事業構造改革と収益性改善
市場環境の悪化や、競争環境が変化している乳化・発酵素材事業及び、大豆加工素材事業については、更なる高
付加価値製品へのシフトと、事業効率の改善が重要な課題であると認識しています。
乳化・発酵素材事業では、日本市場においては競争が激化する中でも乳化・発酵技術を生かし、成長領域での収
益力強化に加え、挑戦領域における新製品開発まで、幅広い取り組みを推進してまいります。
また海外市場においては、技術のグローバル展開を通じて、高付加価値製品群を中心とした事業ポートフォリオ
の拡充を目指すとともに当社が培ってきた商品開発力やアプリケーション提案力を基盤として、東南アジアや中国
など成長が見込まれる地域への展開を加速させてまいります。
大豆加工素材事業については、日本市場は食品の値上げ継続により、購買意欲が減退する中、中国産との競争環
境が激化するなど、厳しい事業環境となりました。このような状況を踏まえ、更なる生産性の改善を含む、コスト
競争力の強化を課題として認識しております。加えて、新商品の開発・投入により付加価値化・差別化を高め、収
益性の改善を推進します。
③
新たな挑戦領域の確立と将来成長への布石
新しい製品や技術の開発にとどまらず、新しい市場や新しい販売手法による価値創出を含む概念として「挑戦領
域」を位置づけております。
付加価値の高いプレミアムオイルの市場開拓、顧客の課題解決につながる製品群として日本の技術を駆使し機能
を追求した素材並びにアプリケーションを展開するなど、挑戦領域製品群の拡充を進めています。
日本市場においては、挑戦領域を牽引するフラッグシップとして植物性に特化したブランド‘GOODNOON’を展開
しています。短期的な収益性にとらわれることなく、中長期的な視点で市場性や競争優位性を評価し、成長が見込
まれる領域には重点的に経営資源を配分してまいります。
‘GOODNOON’の展開などを通じて、当社グループが掲げるビジョンや価値観を社内外に共有し、将来の成長を牽
引する事業基盤の構築に取り組んでまいります。
(4)会社の経営戦略と経営目標
①
中期経営計画「United for Growth 2027」
2030年に向けて、対処すべき課題への対応に取り組み、収益成長と資本効率の改善を今中期経営計画「United
for Growth 2027」においても推進しております。本中期経営計画では、経営方針の中核として以下の3つの基本方
針を掲げております。
a.事業持株会社体制への移行によるガバナンスの強化
当社グループは事業持株会社体制へ移行し、各事業本部が国内外のグループ会社を含めた事業運営及び管理
責任を担うガバナンス体制へと再編いたしました。
これにより、事業本部長の権限と責任を明確化し、事業戦略の立案から実行、業績管理、リスク対応までを
一体的に推進しています。
一方、機能軸においては、全社的な視点からの統制、リスク管理、コンプライアンスの確保を行うことで、
経営の健全性を担保し、グループ全体の資本効率及び財務健全性の向上を図っております。また、人事におい
ては、海外を含む人材マネジメントや人材育成体制を強化し、グローバル経営を支える人材基盤の整備を進め
ております。
当体制により、全社が一体となって喫緊の経営課題となっているBlommerの構造改革の推進に取り組むと共
に、グループ全体の経営管理体制の強化を進めてまいります。
b.資本効率を重視した経営管理と財務体質の強化
中期経営計画「United for Growth 2027」における経営目標は以下の通りです。
財務KPI
中期経営計画目標(2027年度)
事業利益(注1)
ROE
450億円
10.0%以上
FUJI ROIC(投下資本利益率)
(注2)
6.0%以上
(注)1.2025年度よりIFRSを任意適用しております。
2.FUJI ROIC=税引後事業利益 ÷(運転資本+固定資産+持分法投資)
当社グループでは本指標を各事業で把握・管理可能な項目とすべく、分母となる投下資本を運転資
本、固定資産、持分法投資に置き換えて使用しております。
事業持株会社体制の下、FUJI ROICを経営指標として活用し、事業ごとの資本効率を可視化することにより、
投資判断の精度向上や経営資源の最適配分を推進することで、持続的な成長と企業価値向上を実現してまいり
ます。
また、運転資本の適正化や固定資産の効率的な活用を通じて、キャッシュ・フロー創出力の向上に取り組ん
でおります。
さらに、当連結会計年度より国際財務報告基準(IFRS)を任意適用し、財務情報の比較可能性及び透明性を
高め、資本市場との対話の一層の充実を図っております。
c.サステナビリティの更なる深化
将来財務KPI
中期経営計画目標(2027年度)
GHG排出量の削減(スコープ1+2)
(注1)
20%削減
サステナブル調達
(パーム油TTP比率(注2))
95%以上
(注)1.基準年:2020年度(全連結子会社)
2.パーム油TTP:パーム油の農園までのトレーサビリティ(Traceability to Plantation)
※2025年度実績は2026年9月発行予定のサステナビリティレポートにて開示予定。
当社グループにとって、サステナビリティの深化は、単なる社会的要請への対応にとどまるものではなく、
競争力の源泉であり、持続的成長を支える重要な経営基盤であると認識しております。
サステナビリティ分野においては、環境ビジョン2030/2050及びサステナブル調達コミットメントに基づ
き、GHG排出量の削減、資源循環の推進、原料のトレーサビリティの確保などの取り組みを継続しております。
これらの取り組みは、環境・社会への貢献に加え、顧客や投資家からの信頼獲得を通じて、当社グループの
競争力向上にも寄与するものと考えております。
詳細は「2 サステナビリティに関する考え方及び取組」に記載のとおりです。
②
財務戦略
当社グループは、資本コストを基準とした投資管理の徹底及び投資管理レビュー制度を通じた投資・撤退判断に
より、資本効率の改善を推進しております。製品ポートフォリオの見直しや在庫回転率の向上による運転資本の圧
縮、各事業本部及びグループ会社におけるFUJI ROIC改善の取り組みを強化するとともに、グループファイナンス
を活用した資金の最適配分により、金利上昇や原料高騰といった事業環境の変化への対応力を高めております。
これらの取り組みを通じて安定的なキャッシュ・フローの創出を図るとともに、株主還元については配当性向30
~40%を目安とした、安定的かつ継続的な配当の実施を基本方針としております。
2【サステナビリティに関する考え方及び取組】
(1)不二製油グループのサステナビリティ経営
当社グループは、「不二製油グループ憲法」のビジョンとして「植物性素材でおいしさと健康を追求し、サス
テナブルな食の未来を共創します。」を掲げています。
当社グループは、地球環境、人権、心身の健康等の社会課題を機敏に捉え、グループ全従業員がバリューチェ
ーン全体における多様なステークホルダーとの対話と共創を通じて、それらの解決に取り組んでいます。
また、リスクの低減にとどまらず、ステークホルダーの期待に応えるソリューションの提供に努め、社会価値
を創造するとともに、サステナブルな食の未来の実現及び当社グループの企業価値の向上を目指しています。
(2)ガバナンス
①
取締役会とサステナビリティ委員会
当社グループは監査等委員会設置会社であり、取締役会の任意の諮問機関のひとつとしてサステナビリティ委員
会を設置しサステナビリティ関連のリスク及び機会をモニタリングしています。同委員会は「サステナビリティ委
員会規程」に基づき年2回以上開催し、取締役会にサステナビリティ事項に係る答申・報告を実施しています。取
締役会は当該答申・報告を受け、中長期のグループ経営の方向性を決定しています。
同委員会は、代表取締役社長兼最高経営責任者(CEO)を委員長とし、COO、CFO、事業本部及び機能本部の各本
部長、並びにESGアドバイザー(社外取締役)で構成しています。さらに、同委員会は、委員会へ参画するESGアド
バイザーに加え、委員会外の社外有識者からも助言を受ける体制とすることで、経営戦略とESGマテリアリティの
連動性を高めるとともに、社外の視点を取り入れています。
これにより、中長期的な環境(E)・社会(S)と企業経営双方の持続可能性の観点から、ESGマテリアリティを
特定し、多様で複雑化するサステナビリティ課題について中長期的な視点による審議を行い、事業と連動した取り
組みの状況について助言・モニタリングしています。
サステナビリティ委員会
2025年度審議事項
開催時期
サステナビリティ委員会における審議事項
取締役会への答申・報告における主な
議論
第1回
(2025年4月)
・2024年度ESG活動実績の確認
・2025年度ESG活動計画の決定
2024年度ESG活動実績並びに2025年度
ESG活動計画(目標・KPI)の承認
・2025年度ESG活動進捗と課題の確認
・サステナビリティ推進に関する課題と方針の確
認
・サステナビリティ関連リスク・機会
第2回
(2025年10月)
第3回
・2026年度ESGマテリアリティと管掌役の決定
(2025年12月)
・ESGマテリアリティの施策・KPIの考え方
の財務影響、及び企業価値とのつなが
りの提示について
・2026年度ESGマテリアリティと管掌
役の承認
②
サステナビリティに関連する役員報酬(業務執行評価連動型金銭報酬)
2025年4月事業持株会社制への移行に伴い、取締役と執行役員各々に求められる役割と責任を明確にし、各々の
立場で会社の成長に貢献するインセンティブ制度への転換を目指し、指名・報酬諮問委員会での議論を経て、2025
年度より役員報酬制度を改定しております。
新制度では、取締役と執行役員、双方の業績評価反映指標にESGマテリアリティと連動した非財務共通KPIを設定
し、よりステークホルダーからの企業価値向上への期待に応える行動を促す仕組みとなっています。2025年度の非
財務KPIは、エンゲージメントスコア(全社総合スコア)を設定し、その評価ウェイトは取締役及び執行役員とも
に10%としています。KPIの設定と評価については、指名・報酬諮問委員会でレビューを実施することとしており
ます。役員の報酬の詳細は、「第4 提出会社の状況 4 コーポレート・ガバナンスの状況等(4)役員の報酬
等」に記載のとおりです。
また、不二製油では、2022年度から管理職制度において経営と視点を合わせた目標設定を行うためのガイドライ
ンを策定しています。このガイドラインに則して、短期の利益目標のみならず、中期経営計画で掲げる非財務領
域、例えば人的資本やその他サステナビリティに関する項目などを目標として設定し、業績目標を含め適切なウェ
イトで評価することとしています。
(3)戦略
① バリューチェーン上のサステナビリティ関連のリスクと機会
当社グループは、植物性油脂事業、業務用チョコレート事業、乳化・発酵素材事業、大豆加工素材事業の4つの
事業を15ヵ国で展開し、様々な食品素材を開発・製造・販売しています。顧客は食品メーカーや外食店、コンビニ
エンスストアや小売店など、幅広い業態に及び、各国、各事業における原材料の生産から消費・廃棄に至る食のバ
リューチェーンは多様かつ複雑に広がっています。こうしたバリューチェーン上には、様々な環境及び人権に関す
る課題が存在しています。
当社グループは、依存と影響、並びにリスクと機会の観点から重要なサステナビリティ課題を特定し、これに基
づきESGマテリアリティを設定しています。特に、当社のビジネスモデルが依存する農産物の主原料の原産地にお
いて、自然や気候並びに人権に関する重要な課題が多いことを確認しています。
そして、こうした重要なサステナビリティ課題の把握に基づき、事業を通じてESGマテリアリティへの取り組み
を推進することで、ポジティブインパクトの創出またはネガティブインパクトの低減を図り、事業リスクの低減や
事業機会の創出につなげています。
なお、ESGマテリアリティへ取り組む上で基本的なグループの姿勢をまとめた各種方針・規範を制定していま
す。各種方針・規範一覧は以下のURLよりご参照ください。
https://www.fujioil.co.jp/sustainability/policy/
②
ESGマテリアリティの特定
ESGマテリアリティは、新たな社会課題の把握とステークホルダーエンゲージメントを踏まえ、毎年レビューを
行った上で特定しています。特定したマテリアリティは、管掌役のもと推進責任者を任命し、具体的な目標・対応
策を定め、取り組みを推進しています。
2025年度のESGマテリアリティは、「インパクトマテリアリティ(社会・環境へのインパクト評価)」と「財務
マテリアリティ(不二製油グループへの財務インパクト評価)」の2軸による重要性評価に基づき特定しました。
財務マテリアリティ評価においては、重要なサステナビリティ課題のリスクと機会について、多面的な財務影響シ
ナリオを設定し、定量・定性の客的な閾値と発生可能性を併せて評価しています。
また、同マテリアリティ評価で用いたシナリオの妥当性や、新たに考慮すべき社会課題がないことを確認したうえ
で、2025年度のESGマテリアリティを踏襲し、2026年度のマテリアリティを特定しました。
(注)ESGマテリアリティの特定プロセスの詳細は、サステナビリティレポートをご参照ください。
https://www.fujioil.co.jp/sustainability/sustainability_management/
③
ESGマテリアリティと具体的な取組
2025年度は、以下のESGマテリアリティの重点項目を推進しました。
(食品安全と健康)
当社グループは、安全・安心な製品を社会に提供することを前提に事業活動を展開し、不二製油グループ「品質
基本方針」(注)を定め、製品安全と安定品質の製品出荷を最優先に、製品設計からお客様にお届けするまでの品
質保証体制の確立と強化に努めています。重点項目「製品安全と品質管理の徹底」では「品質保証規程」に基づく
品質及び食品安全マネジメントの強化、従業員の継続的な品質意識向上のための活動を推進しています。
ライフステージの変化や食・生活習慣に起因する健康課題の増大が危惧されている中、人々が心身ともに健康で
生きがいを持って暮らせる社会の構築に貢献する製品の創出を目指しています。人の健康へ悪影響を与える恐れの
ある物質の低減、心身の健康増進に寄与する食品の市場拡大や、高齢者の認知機能の低下予防に寄与する研究及び
製品開発を推進しています。また、食の選択肢の拡大により食料課題解決へ貢献し当社グループ挑戦領域の拡大を
果たす多様な植物性素材の創出に注力しています。詳細は「6 研究開発活動」に記載のとおりです。
(注)
「品質基本方針」は以下のURLよりご参照ください。
https://www.fujioil.co.jp/pdf/sustainability/environment/management.pdf
(環境に配慮したものづくり)
当社グループの事業活動は、自然環境や生態系の恩恵を受けると同時に、地球環境や地域の自然環境に影響を
与える側面を有しています。気候変動の進行や生物多様性の損失が加速する中、自然環境の変化は事業継続上の
重要な経営課題・リスクです(注1)。
当社グループは、2015年10月に「環境基本方針」を制定しており(注2)、2025年4月には「環境ビジョン
2030」を改定し「不二製油グループ環境ビジョン2030/2050」を公表しました。改定にあたっては、2030年度CO2
排出量削減目標を、GHGを対象に2050年度ネットゼロ及びScience Based Targetsイニシアティブ(SBTi)1.5℃
基準に沿ってスコープ1+2、スコープ3の2030年度目標を策定しました。また、森林や土地・農業由来のGHG排出
量を考慮したFLAG(Forest, Land and Agriculture)2030年度目標を新たに設定しました(注3)。なお、2025年
12月には、「SBT1.5℃」認定を取得しました。
また、2023年3月に制定した「不二製油グループ生物多様性方針」に基づき、バリューチェーン上の生物多様性
への負の影響を回避または軽減を図り、自然生態系の保全と回復に取り組んでいます(注1)。
(注)1.詳細は「(4)リスク管理 ② 環境マネジメント」に記載のとおりです。
2.「環境基本方針」は以下のURLよりご参照ください。
https://www.fujioil.co.jp/pdf/sustainability/environment/management.pdf
3.「不二製油グループ環境ビジョン2030/2050」は「(5)指標及び目標」に記載のとおりです。
(サステナブル調達)
当社グループは、食のバリューチェーンの川中に位置し、顧客である食品メーカー等に食品中間素材を販売し
ています。「サステナブルな食の未来」の実現に向け「サステナブルな食のバリューチェーン」を構築するた
め、社会課題を解決していく上で鍵となるサプライヤーや顧客とともに、環境保全、人権尊重、公正な事業慣
行、リスクマネジメント等に取り組み、持続可能な食品素材を提供しています。
調達に関するグループの上位方針「サプライヤー行動規範」及び主原料であるパーム油、カカオ、大豆及び戦
略原料であるシアカーネルについて原料別の責任ある調達方針を掲げ(注1)、中長期目標とKPI(注2)を公
表し、取組を推進しています。
(注)1.「サプライヤー行動規範」及び原料別の責任ある調達方針は以下のURLよりご参照ください。
https://www.fujioil.co.jp /sustainability/procurement/
2.各原料別の中長期目標とKPIにつきましては「(5)指標及び目標」に記載のとおりです。
(人的資本と労働安全)
急速に変化する事業環境の中で、当社グループが持続的に成長し競争力を高めていく上で、多様性を「組織の
力」へ転換することは重要な経営課題の一つです。当社グループは、公正な機会提供のもと、心身ともに安全・
安心で多様性が尊重される職場環境の整備を推進し、従業員のHataraki-Gai(働きがい)の向上に注力していま
す。
あわせて、課題解決と価値創出を担う高度専門人材の厚みを増すとともに、重要ポジションの後継者を継続的
に確保するため、経営戦略・事業戦略との連動性を高め、人材の獲得・育成・登用・配置の仕組みの最適化を進
めています。
詳細は「第4
提出会社の状況
5
従業員の状況等」に記載のとおりです。
また、従業員の安全を確保することは企業の社会的責任であり、持続可能な経営を行う上での前提条件です。
「安全衛生基本方針」(注)に基づき、当社グループの従業員及び事業所内で働く全ての人々の命を守るととも
に、労働災害ゼロの達成を目指し、従業員の安全意識の向上のための活動や、安全監査の強化を進めています。
(注)「安全衛生基本方針」は以下のURLよりご参照ください。
https://www.fujioil.co.jp/pdf/sustainability/environment/management.pdf
(情報セキュリティ)(公正な企業行動)
コンプライアンス違反や不正行為、情報セキュリティ事故は、経営基盤や社会的信用を大きく損なうリスクで
あることから、これらのリスクを未然に防止し、万一顕在化した場合でも影響を最小化できる体制の構築が不可
欠であると認識しています。
教育・啓発や監査を通じて管理体制の整備や意識向上を進め、リスク管理の実効性を高めています。「公正な
企業行動」においては、内部通報制度の信頼性向上や、グローバルな事業展開に対応したコンプライアンス意識
の醸成、「情報セキュリティ」においては、ITセキュリティ対策の高度化と人材教育を軸に、セキュリティイン
シデントの抑制と業務影響の最小化に取り組んでいます。
(4)リスク管理
バリューチェーン上の様々なサステナビリティ課題に紐づくリスクと機会について、グループ戦略上のリスクや財
務リスク等と合わせ、全社重要リスクを用いて統合的なリスクマネジメントを行っています。当社グループのリスク
マネジメント体制の全体像の詳細は、「3 事業等のリスク」に記載のとおりです。
また、自然や気候変動に関する環境課題、サプライチェーン上の労働者や地域コミュニティにおける人権リスクに
ついて、バリューチェーンを横断的に把握し重要リスクに優先的に対処するため、人権マネジメントと環境マネジメ
ントを実施しています。
①
人権マネジメント
人権尊重は企業の責任であり、サステナビリティ経営を推進するための大前提となる重要な経営課題です。特
に、当社グループが依存する主原料のサプライチェーンでは様々な人権課題が懸念されており、人権尊重の取り組
みへの対応を怠った場合、ステークホルダーの人権リスクが高まる恐れがあると同時に、顧客との取引の中止など
のビジネスリスクにもつながります。当社グループは「不二製油グループ人権方針」や人権に関する各種方針に基
づき、人権デュー・ディリジェンスを実施しています。
(人権デュー・ディリジェンス)
グループ全体の優先的な人権リスクについては、人権インパクトアセスメントにより特定し、ESGマテリアリ
ティの重点項目に反映しています。特定された人権リスクについては、該当するESGマテリアリティ重点項目の
管掌役のもと、人権リスクの低減に向けた具体的な取り組みを推進しています。これらの取り組みの進捗状況
は、サステナビリティ委員会で審議・監督し、取締役会へ報告しています。
第3回人権インパクトアセスメント(2024年度)で特定した優先的な人権リスク
サプライチェーン川上
(サプライチェーン上の
労働者・周辺コミュニティ)
最優先で対処
すべきリスク
・労働基準
・労働安全衛生
対処する必要性
があるリスク
・非差別と機会均等
・強制、奴隷、債務労働
・児童労働・若年労働者
・土地の権利
不二製油グループ
サプライチェーン川下
(従業員・自社操業)
(顧客・消費者)
・職場環境
・労働安全衛生
・周辺コミュニティへの環境・
社会影響
・非差別と機会均等
・団体交渉権と結社の自由
・強制、奴隷、債務労働
ビジネス倫理に
関する課題
・詐欺、贈収賄、汚職
サプライチェー
ン横断的な課題
・苦情処理メカニズムと救済へのアクセス
・情報セキュリティとプライバシー
・食品安全
・健康への権利
・倫理的な研究開発
・気候変動による人権への影響
・DE&I
優先的な人権リスクに関連するESGマテリアリティ(サステナビリティ課題領域)は以下のとおりです。
「食品安全と健康」「サステナブル調達」「人的資本と労働安全」「情報セキュリティ」「公正な企業行動」
(注)人権インパクトアセスメントの詳細は、サステナビリティレポートをご参照ください。
https://www.fujioil.co.jp/sustainability/human_rights/
また、特にサプライチェーン上の人権リスクが懸念される主原料では、権利保有者との直接対話を含むデュー・
ディリジェンスプロセスを通し、顕在・潜在人権リスクの特定と防止・軽減に努めています。
原料
パーム
人権デュー・ディリジェンスの取り組み(対象人権リスク)
・自己評価ツール(全般的なリスク)
・サプライチェーン変革プログラム(サプライヤーの労働者の人権リスク)
・グリーバンス(苦情処理)メカニズム(主に農園における人権リスク)
・ランドスケープイニシアチブ(地域コミュニティ、先住民の土地の権利)
カカオ
・児童労働監視・是正システム(CLMRS)(児童労働)
シアカーネル
・児童労働デュー・ディリジェンスプロジェクト(児童労働)
(救済の実施)
・内部通報制度
当社グループまたは当社グループの役職員等による法令違反行為、不正行為等をはじめ、その他ハラスメン
ト・差別等あらゆる人権侵害を含む、法令やグループの行動規範や方針に違反またはそのおそれのある行為に
ついて、相談・連絡頂けるよう国内向けの「内部通報窓口」及び海外グループ会社の役職員等向けの「コンプ
ライアンス・ヘルプライン」を設けています。
「内部通報窓口」については、社外からもアクセス可能な窓口とするとともに、通報者の匿名性の確保及び
プライバシー保護の強化、通報窓口の透明性・公正性を担保の観点から、社外の弁護士事務所に通報窓口を設
置しています。
また、当社の内部通報規程では、法令違反行為等に関する通報の適正な仕組みを定めており、通報者保護の
ため、上記「内部通報窓口」及び「コンプライアンス・ヘルプライン」に通報したことを理由に、通報者とな
った役職員等を解雇及び不利益に取り扱うことを禁止しています。さらに、通報者に対して不利益な取り扱い
や嫌がらせ等をした者に、就業規則等に従い処分を課すことができると定めています。
引き続き、通報者の通報に対する信頼感と心理的安全性の醸成に努め、内部通報制度の運用の改善に努めま
す。
・サプライチェーン上の人権・環境リスクに対応するグリーバンス(苦情処理)メカニズム
「責任あるパーム油調達方針」を実現する目的で、2018年5月にグリーバンス(苦情処理)メカニズムを構
築・公表しました。グリーバンスメカニズムは、ステークホルダーから当社グループに提起されたサプライチ
ェーン上の環境・人権問題について、「責任あるパーム油調達方針」に基づいてパートナーとともにサプライ
ヤーへエンゲージし、問題を改善する仕組みであり、あらゆるステークホルダーが「不二製油グループ グリ
ーバンスウェブページ(英語)」より、当社グループやグループのサプライチェーン上の環境、人権を含む
様々な問題について報復や不利益を被らない形で提起することができます。
当社ウェブサイトでは、グリーバンス手順書を掲載し、エンゲージ対象企業の定義や、グリーバンス対応プ
ロセスを公開しています。また、四半期に一度、受け付けたグリーバンスへの対応状況を更新し、ステークホ
ルダーへ情報を開示しています。
(注)グリーバンスメカニズムについては以下のURLより当社ウェブサイト(英語)をご参照ください。
https://www.fujioil.co.jp/en/sustainability/grievance_mechanism/
②
環境マネジメント(気候・自然関連インパクト、リスク・機会の管理)
当社グループの事業活動は、大気、水、土壌、森林、植物といった自然資本の恵みに支えられています。一方
で、原料生産から製造・販売に至るバリューチェーン全体を通じて、地球環境や地域の自然環境に影響を与える側
面も有しています。近年、気候変動の進行や生物多様性の喪失が加速する中、こうした自然環境の変化は、原料調
達や事業継続に影響を及ぼす重要な経営課題・リスクであると認識しています。
(表1)不二製油グループにおける気候変動リスク・機会及び財務インパクトの影響度評価(概要版)
詳細はサステナビリティレポートをご参照ください
https://www.fujioil.co.jp/sustainability/environmental_management/
*¹ 影響度
大:「利益への影響額が100億円以上となる可能性がある」
中:「利益への影響額が20億円以上~100億円未満となる可能性がある」
小:「利益への影響額が20億円未満となる可能性がある」
上記、大・中・小の影響度は、当社グループにおける現在のポートフォリオ、財務状況、業績等に基づき、ある条件下の試算により予測される2050年
頃の財務インパクトについて言及したものです。財務インパクトの評価はこの影響度を基準として行っておりますが、変動する場合があります。
*² 「IEA」による各国炭素税見込額と当社グループのCO2排出見込量より算出。
*³ サプライヤー行動規範:グループ共通の調達に関する包括的な考え方を全てのサプライヤーにお伝えすることを目的に、既存の各ガイドライン・方針の上
位方針となる「サプライヤー行動規範」を策定し、環境保全をはじめとした一連の原則の遵守、及び本行動規範の違反を特定し改善するための予防策や救
済策を講じることを全てのサプライヤーに訴求するもの
*⁴「One Health」:生態系の健康、そして動物の健康を守ることが人の健康を守ることでもあるという事実を認識し、人、動物、生態系、3つの健康を1つと
考え、守っていこうという概念。
(表2)不二製油グループのバリューチェーン上の自然関連リスク・機会
(5)指標及び目標
当社グループでは、サステナビリティに関する指標及び目標として、以下を設定しております。
①
ESGマテリアリティ
ESGマテリアリティ毎に管掌者及び推進責任者を定め、目指す姿・目標・施策を設定し、取組を推進していま
す。
(注)取組テーマの指標及び目標についてはサステナビリティレポートをご参照ください。
https://www.fujioil.co.jp/sustainability/sustainability_management/
(サステナブル調達)
主原料及び戦略原料である以下の4つの原料につき、持続可能な調達を実現するための中長期目標とKPIを設
定し取組を推進しています。
(環境ビジョン2030/2050)
2025年4月に「不二製油グループ環境ビジョン2030/2050」を改定・公表し、2030年度並びに2050年度目標に
向けて取組を推進しています。
(注)改定前の「環境ビジョン2030」の従来目標に基づく取り組みの実績はサステナビリティレポートをご参照
ください。
https://www.fujioil.co.jp/sustainability/environmental_management/
また、改訂目標に基づく2025年度実績はサステナビリティレポート2026で公開予定です。
(人的資本に関する指標)
詳細は「第4 提出会社の状況
標」に記載のとおりです。
②
5
従業員の状況等(2)従業員の状況
③
人的資本に関する指標及び目
中期経営計画「United for Growth 2027」における将来財務項目
詳細は「1 経営方針、経営環境及び対処すべき課題等(4)会社の経営戦略と経営目標」に記載のとおりで
す。
3【事業等のリスク】
文中の将来に関する事項は、当連結会計年度末において、当社グループが判断したものです。
(1)不二製油グループのリスクマネジメント
日本・欧米・アジアの各エリアで主要4事業を展開していることから、当社グループのバリューチェーンには社会
課題・経済環境変化等の影響を受けた、様々なリスクが潜在します。不二製油株式会社では全社リスクマネジメント
体制を構築し、グループを取り巻く環境を踏まえた情報ソースから、本社(事業軸、機能軸)主導で経営への影響度、
発生可能性、顕在化時期等を総合的に判断し、「全社重要リスク」を選定しています。
また、「リスクマネジメント委員会」を開催し、優先して対処すべき「全社重要リスク」の審議、リスク対策状況
の進捗管理を実施しています。リスクマネジメント委員会で審議した「全社重要リスク」は、不二製油株式会社の経
営会議による決議、不二製油株式会社の取締役会によるモニタリングを行っています。
(2)全社重要リスクの管理プロセス
①
全社重要リスクの特定
不二製油グループでは、全社リスクマネジメント体制のもと、戦略や財務、災害・事故、オペレーショナルに関
するリスク、ESGマテリアリティを踏まえてグループのリスクを網羅的に把握しています。全社重要リスク分科会
での検討・議論、リスクマネジメント委員会での審議を経て、全社として認識・対応すべき重要なリスクを「全社
重要リスク」と特定しています。加えて、グループ各社特有のリスクは、各社のリスクアセスメントを通じて「リ
スクマップ」を作成し、本社主導で各種リスクの特定と対策を行っています。
②
全社重要リスクの対応とモニタリング
当社グループは、特定された全社重要リスクの主管本部・部門を定め、リスク低減施策と目標KPIを設定し管理
しています。これらの施策・目標KPIは「リスクマネジメント委員会」にて進捗管理を行っています。
2025年度の活動では、リスクマネジメント委員会を3回開催し、特定された全社重要リスク(12項目)の個別進捗
や課題状況の確認を行いました。また適宜、経営会議、取締役会に報告し、顕在化したリスクの発生原因、対応策
と妥当性、適時性等を確認しています。
③
不二製油グループ全社重要リスク
当社グループは、投資者の判断に重大な影響を及ぼす可能性があり管理すべき重要なリスクとして以下の項目を
特定し、各リスクに対応する主管本部・部門を定め、対応方針を策定しています。なお、将来事項に関する記述に
つきましては、2026年3月31日現在において入手可能な情報に基づき、当社が合理的であると判断したものです。
(2026年度
全社重要リスク)
4【経営者による財政状態、経営成績及びキャッシュ・フローの状況の分析】
当社グループは当連結会計年度より、IFRSを任意適用しております。また、前連結会計年度の数値も、IFRSに組み
替えて表示しております。連結財務数値に係るIFRSと日本において一般に公正妥当と認められる会計基準(以下「日
本基準」という。)との差異につきましては、「第5 経理の状況 1 連結財務諸表等(1)連結財務諸表連結
財務諸表注記 40.初度適用(IFRSへの移行に関する開示)」をご参照ください。
当連結会計年度における当社グループ(当社、連結子会社及び持分法適用会社)の財政状態、経営成績、キャッシ
ュ・フロー(以下「経営成績等」という。)の状況の概要及び経営者の視点による経営成績等の状況に関する認識及
び分析・検討内容は、以下のとおりです。なお、文中の将来に関する事項は、提出日現在において当社グループが入
手可能な情報に基づき作成したものです。実際の成果や業績は、今後様々な要因によって、記載されている内容とは
異なる可能性があります。
(1)経営者の視点による経営成績等の状況に関する認識及び分析・検討内容
①
経営成績の状況の分析
当連結会計年度における当社グループを取り巻く事業環境は、米国の関税政策や地政学リスクの高まりに関連す
る経済的な影響、中国の景気動向等が懸念要素となる状況が続いています。日本においては物価上昇の影響が続い
ているものの、雇用・所得環境の改善等により、支出動向は底堅い推移が続いています。
当社グループにおいては、2025年度から2027年度までの3ヵ年を対象とした中期経営計画「United for Growth
2027」を策定しました。持続的な企業価値の向上に向けて、「ガバナンスの深化」、「成長領域の更なる強化」、
「新たな挑戦領域の確立」を基本方針として、事業軸と機能軸の強化による管理体制の強化、チョコレート用油脂
(CBE)やコンパウンドチョコレートといった成長領域における競争優位性の更なる強化、新たな事業の柱を担う
挑戦領域の育成へ注力します。
中期経営計画の初年度となる2025年度は、チョコレート用油脂(CBE)を中心とした成長領域において競争優位
性を発揮し、収益力の向上が進みました。なお、Blommer Chocolate Company, LLC(米国、以下「Blommer」)に
おいては、2024年3月に公表しております構造改革を推進中であり、2024年以降のカカオ価格高騰を背景とした
2024年度の事業損失からも大幅な回復の途上にあります。しかしながら、需要低迷の長期化による販売数量の減少
や管理強化に伴う固定費増加等により、当連結会計年度において当初の事業計画と実績に乖離が発生しました。こ
のような状況から、想定していたBlommerの収益実現には時間を要すると判断し、同社に係るのれんの減損損失と
繰延税金資産の取崩しに伴う法人税等調整額を計上しました。Blommerの収益改善に向けて、ガバナンス体制の強
化によるリスク低減や、当社グループの強みであり技術力を有するコンパウンドチョコレートの販売強化等の施策
を実行しています。
以上の結果、当連結会計年度における経営成績は、以下のとおりとなりました。
(単位:百万円)
売上高
事業利益
税引前当期利益
親会社の所有者に帰属
する当期利益
2026年3月期
772,288
36,048
23,430
11,142
2025年3月期
671,207
13,261
6,900
3,863
前期比増減
(前期比増減率)
+101,080
(+15.1%)
+22,787
(+171.8%)
+16,529
(+239.5%)
+7,278
(+188.4%)
売上高は、パーム油価格が前年同期比で上昇したことに加え、カカオ豆価格も2024年の高騰以降、調達価格が高
値水準を継続していることから、主要原材料の調達価格上昇に伴う販売価格の上昇により増収となりました。事業
利益は、植物性油脂事業のチョコレート用油脂の堅調な販売や、Blommerでのカカオ豆価格の安定及び関連費用の
減少により増益となりました。親会社の所有者に帰属する当期利益は、Blommerに係るのれんの減損損失や繰延税
金資産の取崩しに伴う法人税等調整額を計上しましたが、事業利益の伸長により、増益となりました。
当社は、当連結会計年度より、従来「連結消去・グループ管理費用」に含めていたセグメントに配分していない
全社費用を、各報告セグメントに配分して記載しております。そのため、前連結会計年度のセグメント情報は、全
社費用を各報告セグメントに配分し、比較分析をしております。
セグメントごとの経営成績は、次のとおりです。
(単位:百万円)
売上高
前期比
前期比
増減
(%)
事業利益
前期比
前期比
増減
(%)
植物性油脂
271,076
+63,747
+30.7%
33,394
+6,612
+24.7%
業務用チョコレート
370,904
+36,219
+10.8%
2,391
+16,560
-
乳化・発酵素材
97,432
+3,180
+3.4%
1,144
△556
△32.7%
大豆加工素材
32,874
△2,066
△5.9%
△874
△57
-
-
-
-
△8
+226
-
772,288
+101,080
+15.1%
36,048
+22,787
+171.8%
連結消去・グループ管理費用
合
計
(植物性油脂事業)
売上高は、原材料価格の上昇並びに需要の拡大に伴う販売価格の上昇に加え、当第1四半期連結累計期間に発生
した新規連結に伴う売上高の増加により増収となりました。事業利益は、チョコレート用油脂の堅調な販売等によ
り増益となりました。
(業務用チョコレート事業)
売上高は、原材料価格の上昇に伴う販売価格の上昇により増収となりました。事業利益は、Blommerにおいて販
売数量が減少しましたが、カカオ豆関連費用の減少により損失は改善しました。
(乳化・発酵素材事業)
売上高は、原材料価格の上昇に伴う販売価格の上昇により増収となりました。事業利益は、原材料価格の上昇に
伴う採算性の悪化や、アジアでの販売数量の減少により減益となりました。
(大豆加工素材事業)
売上高及び事業利益は、機能剤の販売数量減少等により減収減益となりました。
②
財政状態の状況の分析
当連結会計年度末における連結財政状態は、以下のとおりです。
(単位:百万円)
2025年3月期
2026年3月期
流動資産
363,997
359,051
△4,946
非流動資産
233,079
277,881
+44,802
597,076
636,933
+39,856
有利子負債
283,721
268,381
△15,340
その他
資産
増減
102,428
124,074
+21,645
負債
386,150
392,455
+6,305
資本
210,926
244,477
+33,550
(資産)
当連結会計年度末の資産は、原材料価格の上昇や新規連結会社の増加に伴い棚卸資産や営業債権が増加しました
が、現金及び現金同等物の減少により、流動資産が減少しました。新規連結会社の株式取得に伴うのれんの増加や
設備投資の実施等により、非流動資産が増加しました。以上の結果、前連結会計年度末に比べ398億56百万円増加
し、6,369億33百万円となりました。
(負債)
当連結会計年度末の負債は、運転資本の減少等に伴う短期借入金の返済により有利子負債が減少しましたが、そ
の他に含まれる営業債務の増加等により、前連結会計年度末に比べ63億5百万円増加し、3,924億55百万円となり
ました。
(資本)
当連結会計年度末の資本は、利益剰余金の増加やアメリカドル、ユーロ並びにブラジルレアルに対する円安によ
るその他の資本の構成要素の増加等により、前連結会計年度末に比べ335億50百万円増加し、2,444億77百万円とな
りました。
③
キャッシュ・フローの状況の分析
当連結会計年度末におけるキャッシュ・フローの状況は、以下のとおりです。
(単位:百万円)
2025年3月期
2026年3月期
増減
営業活動によるキャッシュ・フロー
△48,828
54,840
+103,669
投資活動によるキャッシュ・フロー
△21,753
△46,847
△25,094
フリー・キャッシュ・フロー
△70,581
7,993
+78,575
財務活動によるキャッシュ・フロー
113,188
△38,590
△151,778
現金及び現金同等物
70,840
46,811
△24,029
(営業活動によるキャッシュ・フロー)
当連結会計年度の営業活動によるキャッシュ・フローは、548億40百万円の収入となりました。前連結会計年度
では増加していた運転資本需要の改善等により、1,036億69百万円収入が増加しております。
(投資活動によるキャッシュ・フロー)
当連結会計年度の投資活動によるキャッシュ・フローは、468億47百万円の支出となりました。新規連結会社の
株式並びに有形固定資産の取得の増加等により、250億94百万円支出が増加しております。
(財務活動によるキャッシュ・フロー)
当連結会計年度の財務活動によるキャッシュ・フローは、385億90百万円の支出となりました。運転資本の増加
を主要因として資金需要が増加した前連結会計年度からの反動に加えて、手元資金を活用し借入金等の返済を進め
たことにより、1,517億78百万円支出が増加しております。
(2)資本の財源及び資金の流動性
当社グループは円滑な事業活動に必要十分な流動性の確保と財務規律の維持及び財務健全性の向上を基本方針と
し、中長期的な企業価値向上を実現すべく、資本コストを意識した経営を実践しております。
当社グループの主な資金需要は、生産活動及び販売活動に必要な運転資金、生産性向上のための設備投資、成長基
盤強化のための事業投資等です。資金の源泉は、営業活動によるキャッシュ・フローと金融機関からの借入やコマー
シャル・ペーパー並びに社債の発行等による資金調達です。
短期運転資金は営業キャッシュ・フローとコマーシャル・ペーパー発行及び金融機関からの短期借入を基本として
おり、設備投資及び事業投資の資金は金融機関からの長期借入のほか、社債発行による資金調達を行っております。
当社グループは複数の金融機関との間で当座貸越契約を締結しているほか、コマーシャル・ペーパー発行枠及び国
内社債発行枠の登録により資金調達手段の多様化を図り、事業運営に必要な資金の流動性を十分に確保しておりま
す。
なお、当連結会計年度末における有利子負債残高は2,683億81百万円となっております。また、当連結会計年度末
における現金及び現金同等物の残高は468億11百万円となっております。
(3)生産、受注及び販売の実績
①
生産実績
当社グループの生産品目は広範囲、多種多様であり、かつ、製品のグループ内使用(製品を他のグループ会社の
原材料として使用)が数多くあるため、セグメント別(連結ベース)に生産実績を、金額あるいは数量で示すこと
はしておりません。
容
このため生産の実績については、「(1)経営者の視点による経営成績等の状況に関する認識及び分析・検討内
① 経営成績の状況の分析」における各セグメントの業績に関連付けて示しております。
②
受注実績
当社グループは需要予測に基づく見込み生産を行っているため、該当事項はありません。
③
販売実績
当連結会計年度におけるセグメントごとの販売実績については、「(1)経営者の視点による経営成績等の状況
に関する認識及び分析・検討内容 ① 経営成績の状況の分析」に記載のとおりです。
(4)重要性がある会計方針及び見積り
重要性がある会計方針については、「第5 経理の状況 1 連結財務諸表等(1)連結財務諸表連結財務諸表
注記 3.重要性がある会計方針」に記載しております。連結財務諸表を作成するに当たり、必要な見積りを行って
おり、それらは資産、負債、収益及び費用の計上金額に影響を与えております。これらの見積りは、その性質上判断
及び入手し得る情報に基づいて行いますので、実際の結果がそれらの見積りと相違する場合があります。特に以下の
事項は、経営者の会計上の見積りの判断が財政状態及び経営成績に重要な影響を及ぼすと考えております。
なお、当連結会計年度の連結財務諸表に計上した金額が会計上の見積りによるもののうち、翌連結会計年度の連結
財務諸表に重要な影響を及ぼすリスクがある重要な会計上の見積りについては、「第5 経理の状況 1 連結財務
諸表等(1)連結財務諸表連結財務諸表注記 4.見積り及び判断の利用」に記載しております。
(5)並行開示情報
連結財務諸表規則(第3編から第6編までを除く。以下「日本基準」という。)により作成した要約連結財務諸表
は、以下のとおりです。
なお、日本基準により作成した当連結会計年度の要約連結財務諸表については、金融商品取引法第193条の2第1
項の規定に基づく監査を受けておりません。
①
要約連結貸借対照表(日本基準)
(単位:百万円)
前連結会計年度
(2025年3月31日)
資産の部
流動資産
当連結会計年度
(2026年3月31日)
354,830
358,540
有形固定資産
無形固定資産
156,505
51,185
178,372
67,028
投資その他の資産
33,859
31,479
固定資産合計
固定資産
241,550
276,880
繰延資産
183
134
資産合計
596,564
635,556
負債の部
流動負債
273,204
254,448
固定負債
108,835
130,164
負債合計
382,040
384,612
174,998
35,499
4,025
183,788
62,837
4,318
純資産合計
214,524
250,944
負債純資産合計
596,564
635,556
純資産の部
株主資本
その他の包括利益累計額
非支配株主持分
②
要約連結損益計算書及び要約連結包括利益計算書(日本基準)
要約連結損益計算書
(単位:百万円)
前連結会計年度
(自 2024年4月1日
至 2025年3月31日)
当連結会計年度
(自 2025年4月1日
至 2026年3月31日)
売上高
売上原価
671,211
591,984
772,285
664,273
売上総利益
79,227
108,012
販売費及び一般管理費
69,332
75,342
営業利益
9,895
32,669
営業外収益
営業外費用
3,267
7,858
3,422
9,408
経常利益
5,304
26,684
特別利益
990
443
373
2,115
税金等調整前当期純利益
5,850
24,942
法人税等合計
2,067
12,248
当期純利益
3,783
12,693
非支配株主に帰属する当期純利益
1,552
367
親会社株主に帰属する当期純利益
2,230
12,325
特別損失
要約連結包括利益計算書
(単位:百万円)
前連結会計年度
(自 2024年4月1日
至 2025年3月31日)
当期純利益
当連結会計年度
(自 2025年4月1日
至 2026年3月31日)
3,783
12,693
その他の包括利益合計
△8,464
28,437
包括利益
△4,681
41,131
△5,983
1,302
40,591
539
(内訳)
親会社株主に係る包括利益
非支配株主に係る包括利益
③
要約連結株主資本等変動計算書(日本基準)
前連結会計年度(自 2024年4月1日至 2025年3月31日)
(単位:百万円)
その他の包括利益
累計額
株主資本
非支配株主持分
純資産合計
当期首残高
189,828
42,357
12,105
244,291
当期変動額
△14,830
△6,857
△8,079
△29,767
当期末残高
174,998
35,499
4,025
214,524
当連結会計年度(自
2025年4月1日
至
2026年3月31日)
(単位:百万円)
その他の包括利益
累計額
株主資本
非支配株主持分
純資産合計
当期首残高
174,998
35,499
4,025
214,524
当期変動額
8,790
27,337
292
36,419
当期末残高
183,788
62,837
4,318
250,944
④
要約連結キャッシュ・フロー計算書(日本基準)
(単位:百万円)
前連結会計年度
(自 2024年4月1日
至 2025年3月31日)
当連結会計年度
(自 2025年4月1日
至 2026年3月31日)
営業活動によるキャッシュ・フロー
△50,631
54,263
投資活動によるキャッシュ・フロー
財務活動によるキャッシュ・フロー
△21,738
114,931
△46,823
△37,380
現金及び現金同等物に係る換算差額
△250
6,533
現金及び現金同等物の増減額(△は減少)
42,311
△23,405
現金及び現金同等物の期首残高
27,480
69,846
54
-
69,846
46,440
連結子会社の決算期変更に伴う現金及び現金同等物
の増減額(△は減少)
現金及び現金同等物の期末残高
⑤
連結財務諸表作成のための基本となる重要な事項の変更(日本基準)
前連結会計年度(自 2024年4月1日
該当事項はありません。
至
2025年3月31日)
当連結会計年度(自
至
2026年3月31日)
2025年4月1日
(連結の範囲の変更)
増加2社(新規取得)
減少2社(吸収合併)
⑥
経営成績等の状況の概要に係る主要な項目における差異に関する情報
IFRSにより作成した連結財務諸表における主要な項目と日本基準により作成した場合の連結財務諸表におけるこ
れらに相当する項目との差異に関する事項は、以下のとおりです。
前連結会計年度(自 2024年4月1日至 2025年3月31日)
「第5 経理の状況 1連結財務諸表等 (1)連結財務諸表
移行に関する開示)」に記載のとおりです。
当連結会計年度(自
(のれんの償却)
2025年4月1日
至
連結財務諸表注記
40.初度適用(IFRSへの
2026年3月31日)
日本基準ではのれんを一定期間にわたり償却しておりましたが、IFRSではのれんの償却は行われず、毎期減損
テストを実施することが要求されます。この影響により、IFRSでは日本基準に比べて「販売費及び一般管理費」
が2,735百万円減少しております。
(リース)
日本基準では借手のリースについてファイナンス・リースとオペレーティング・リースに分類し、オペレーテ
ィング・リースについては通常の賃貸借取引に係る方法に準じた会計処理を行っておりましたが、IFRSでは原則
としてすべての借手のリースについて使用権資産及びリース負債を計上しております。この影響により、IFRSで
は日本基準に比べて「使用権資産」及び「リース負債」がそれぞれ3,103百万円及び3,854百万円増加しておりま
す。
(退職給付)
日本基準では数理計算上の差異を発生時にその他の包括利益で認識し、従業員の平均残存勤務期間以内の一定
の年数で純損益に振替えておりましたが、IFRSでは発生時にその他の包括利益で認識し、利益剰余金に振り替え
ております。また、IFRSでは、日本基準と異なり、確定給付制度が積立超過である場合には、確定給付資産の純
額は資産上限額に制限され、その調整をその他の包括利益で認識しております。この影響により、IFRSでは日本
基準に比べて「退職給付に係る資産」が9,589百万円減少しております。
5【重要な契約等】
(1)株式会社J-オイルミルズとの業務提携及び株式相互保有に関する契約
① 株式の持ち合い
相互に相手方株式を保有します。
②
原料・資材の効率的調達
原料・資材の共同調達により安定調達及びコスト低減を図ります。
中間原料油の相互供給
双方の強みを活かした中間原料油の相互供給により、使用製品の機能強化、コスト削減を図ります。
相互の生産設備の有効活用
③
④
両社が有する生産設備を相互に有効活用し、生産の効率化を図ります。
物流業務の効率化
物流拠点の集約化、共同配送・共同輸送等により、物流業務の効率化、コスト低減を図ります。
その他
双方にメリットのある取組を行います。
⑤
⑥
(2)財務上の特約が付されている金銭消費貸借契約
当社は、財務上の特約が付された金銭消費貸借契約(シンジケートローン)を2025年9月25日付で締結いたしま
した。
①
金銭消費貸借契約の内容
契約締結日
相手方の属性
元本並びに当期末残高
弁済期限
2025年9月25日
株式会社三井住友銀行他3行
トランシェA
32,500百万円
トランシェB
70百万USドル
2030年9月30日
担保の内容
無担保
② 金銭消費貸借契約に付されている財務上の特約の内容
・各事業年度末日における連結貸借対照表に記載される純資産の部の合計金額を、直前の事業年度末日における連
結貸借対照表に記載される純資産の部の合計金額の75%に相当する金額以上に維持すること。
・各事業年度末日の報告書等に記載される連結損益計算書における事業損益を2期連続で損失としないこと。
6【研究開発活動】
当社グループは、植物性の油脂とたん白を基盤とする新しい機能を持つ食品素材の開発に取り組んできました。長
年積み重ねてきた研究成果と先進の技術力を生かし、不二製油グループ憲法のビジョン「植物性素材でおいしさと健
康を追求し、サステナブルな食の未来を共創します。」に向けて、新技術・新素材の開発による事業シナジーの最大
化や新たなビジネスモデルの創出を目指した研究開発活動を実施しています。世界中の人びとの食べることの歓びと
健康に貢献することをモットーに、「社会になくてはならない会社」になるための研究開発活動に努めています。
日本国内の「不二サイエンスイノベーションセンター」と「つくば研究開発センター」を研究開発の中核拠点と
し、顧客との共創の場である「フジサニープラザ」、オランダのフードバレーの中心となるワーヘニンゲン大学キャ
ンパス内に2021年度に開設した「フジグローバルイノベーションセンターヨーロッパ」、そして各グループ会社の研
究開発部門が連携し、事業戦略と一体となったグローバルな研究開発を推進しています。2025年度からは事業軸での
研究開発部門のグローバル連携をさらに深めることを意識して、事業毎にグローバルミーティングを開催してコミュ
ニケーションを活性化しています。また、イノベーションを推進するため、国内外の大学や研究機関とのオープンイ
ノベーションや顧客との共創活動を強化しています。
知的財産部では、各研究開発部門の活動成果を特許ポートフォリオとして戦略的に構築してきました。市場優位性
や価格決定力に影響し得る指標である重要特許シェア率(注1)において、油脂・チョコレート関連及びPBF関連分
野のいずれにおいても、国内外の競合企業と比較して上位水準を維持しています。特に国内の競合企業と比較した場
合において、その傾向は顕著です。
また、将来の重要特許を継続的に創出するための人材投資として、知財教育の実施や発明報酬制度の整備ととも
に、社長をはじめとする経営幹部に、創造性の高いアイデアを披露する、アイデアコンテストを実施するなど、発明
者の育成に継続的に取り組んできました。その結果、国内外においてもトップレベルの新規発明者数(注2)を維持
しています。今後は、海外グループメンバーに対してもeラーニングを活用した知財教育を実施し、グループ全体で
特許を創出する体制を一層推進することで、グローバル市場における競争優位性の更なる向上を目指してまいりま
す。
(注)1.過去10年(2016年以降)における、特許分類・キーワードに基づき抽出した各母集団を対象とし、被引用
数上位5%に該当する特許を重要特許と定義した上で、(各社の重要特許件数)÷(全重要特許件数)により
算出した割合(%)です。
2.過去10年(2016年以降)に出現した発明者の人数を集計したものです。
技術開発部では、「安全、品質、環境」にこだわり、コア技術の強化・革新に関する研究開発を進めております。
当連結会計年度の研究開発費の総額は7,077百万円です。
研究開発活動の概要は次のとおりです。
(植物性油脂事業)
安全・安心で環境に配慮した油脂の製造技術、新機能を有する油脂製品、及びその最適な応用法に関する研究開
発を通して、顧客の要望を形にし、新しいおいしさの創造に貢献しております。
当連結会計年度の主な成果としては、価格高騰が続く国内外のココアバターの代替需要への対応策として、チョ
コレート規格の変更にも対応する、多様なCBE(注1)及び風味強化素材を開発し、その利用方法等も含めて顧客
へ提案し、チョコレート菓子市場の安定化に対応しました。また、今期は動物性油脂が主流の惣菜・加工食品など
の用途において、新たな価値コンセプトを謳った植物性油脂の新ブランド「Melavio®」を立ち上げ、多様化する食
市場に対応する選択肢をよりわかりやすく、市場に伝える基盤を構築しました。
当社独自技術の分散技術であるDTR®技術(注2)を利用した、風味の満足感の付与に加え、加工食品メーカーで
の加工適性向上に寄与する形態改良も行い、冷凍食品や加工食品用途での実績化が進んでいます。
従来の油脂結晶制御技術や酵素応用技術の深掘も継続して技術革新を進めております。酵素技術を活用した品質
改良法の導入によるココアバター代用脂の機能性向上を図る等、事業基盤を強化する技術開発にも取り組んでいま
す。欧州を中心に規制が強化されているプロセスコンタミナント(グリシドール脂肪酸エステル等)除去につなが
る製造技術開発に一層注力し、国内及びグローバルの市場環境にも対応可能な油脂素材として提案を継続しており
ます。
また、栄養健康分野においては、消費者への認知をさらに拡大し、健康油脂素材需要の潜在需要開拓のため、健
康関連油脂の摂り方を伝える動画配信やウェブ配信記事など、デジタルを活用した情報発信基盤を拡充しました。
当事業の研究開発費は1,186百万円です。
(注)1.CBE:Cocoa Butter Equivalentの略。ココアバターと同等の物性を持ったチョコレート用油脂。
2.DTR®技術:水溶性成分を油脂に微分散させる技術で、素材の呈味(塩味、旨味、辛味等)や保存安定性
を付与増強する技術。
(業務用チョコレート事業)
チョコレートを通じた社会課題の解決を目指し、新技術の開発や原料選定に取り組むとともに、それらを具現化
したアプリケーションと組み合わせたソリューション提案を行っています。
カカオ不足及び価格高騰の影響が継続した2025年度において、日本国内では挑戦領域として、「カカオ原料に依
存しないものづくり方針」に基づく課題解決型製品の導入を進めました。具体的には、溶かすだけで簡単に使用で
き、室温で安定して固まり、チョコレートのようなパリッとした食感と滑らかな口溶けを特長とするコンパウンド
チョコレート製品「パータグラッセ」を上市しました。
また、成型新製品として、ベーカリー製品向けに焼成後の新たな食感を付与する「じゅわっとキューブ」を開発
しました。さらに、カカオ原料を使用しない「アノザ®M」については、積極的なプロモーション活動を通じて市場
認知の拡大を図りました。
一方、カカオ原料価格が高騰する環境下においても、「高品質なチョコレートをもっと身近に」という価値提案
TM
のもと、「カカオクオリー®」シリーズに新たなラインナップとして「カカオクオリー ベーシック 58%」を上市
しました。加えて、2026年度稼働予定の新工場での生産を見据えた新製品開発にも取り組みました。これらの取り
組みを通じ、「課題解決型製品の創出」と「新市場への拡販」を推進し、2026年度には新製品の上市を予定してい
ます。
海外市場においても、カカオ原料価格の高騰を背景に、各グループ会社が市場特性に応じた提案を進めました。
米国のBlommer Chocolate Company, LLCでは、ココアバター価格の上昇に対応するため、CBEコンパウンド製品の
拡販を推進しました。加えて、2026年度下期に稼働予定のキャンベルフォード工場の新ラインでは、付加価値型コ
ンパウンド製品の増産を計画しています。
ブラジルのHARALD INDÚSTRIA E COMÉRCIO DE ALIMENTOS LTDAでは、カカオ相場の高騰により比例費が増加する
事業環境の中、植物性油脂の機能特性や原材料選択の最適化を通じて、コンパウンドチョコレートにおける「おい
しさ」と「課題解決」の両立を追求してきました。その結果、需要の高いブラジルのチョコレート菓子市場におい
て、チョコレート製品からコンパウンドチョコレート製品への需要シフトを加速させることができました。これ
は、機能訴求型レシピの展開やフードサービス向けキャンペーンの実施、アプリケーション提案を通じた拡販活動
が寄与したものです。
当事業の研究開発費は1,720百万円です。
(乳化・発酵素材事業)
ホイップクリーム、調理用クリーム、ドリンクベース、マーガリン、フィリング、チーズ風味素材等の開発、弊
社独自のUSS®製法による豆乳素材を活用した新技術・新製品開発、及びアプリケーション開発を通し、美味しさに
こだわりながら社会課題のソリューションの提供を目指して活動しております。
近年は、地政学的な影響や人口動態の変動などにより、あらゆる原料の価格が高騰しているだけではなく、供給
そのものも不安定になるなど、原料調達事情や市場の変化が激しくなっており、弊社並びにお客様への影響がます
ます大きくなってきています。本事業の強みとする、乳化・発酵の技術を駆使し、原料に依存せず、高品質でリー
ズナブル、お客様の原料調達の安定に貢献できる新製品開発を推進し、顧客貢献を高めることを目指しています。
昨年上市したチーズ風味素材の「本熟フロマージュ®P」は、新しい発酵技術により、輸入中心で高価な熟成チ
ーズに依存せずとも、濃厚で本格的な風味を提供できます。熟成チーズは物性面でも使用方法の制約が多いのです
が、滑らかで使いやすい物性は、今までにない用途でもご活用いただくことができ、お客様の品質向上や新商品の
アイデアの幅を広げるなどに貢献し、製菓製パンのみならず、外食、加工食品等幅広い市場のお客様から多くの支
持をいただいています。また、本発酵技術は乳風味を増強する効果があり、チーズ関連製品のみならず、ホイップ
クリーム製品やマーガリン製品の乳風味向上に活用し、お客様のメイン商品にご採用いただくなど、その価値をご
評価いただいております。
弊社乳化技術の代表となる、独自のUSS®製法で生み出す豆乳クリームは、従来にないクリーミーさ、濃厚さが特
徴です。豆乳クリームを活用した、豆乳クリームバター「ソイレブール®」はバターのようなクリーミーさ、ジュ
ーシーさを持ちながらも、バターとは異なる他素材との相性の良さという特徴でお客様の商品の幅を広げ、高い評
価をいただいております。洋菓子向けに塩味を抑えた「ソイレブールラフィーネ®」、パイ・デニッシュなどに活
用いただけるシートタイプの「ソイレブール®シート」とともにお客様より好評をいただいており、年々実績を伸
ばしています。豆乳クリームは調理用クリーム、ドリンク、冷菓やチルド洋菓子などにも幅広くご利用いただいて
おり、時短ニーズの高まっている調理加工市場、好調な外食・カフェなどでの採用も増えています。
日本のパンや洋菓子のトレンドは、中国や東南アジア地域で非常に注目されています。日本で実績のある製品の
横展開を積極的に行い、海外のベーカリーや洋菓子マーケット向けに日本のトレンドと合わせて紹介することで、
マーガリンやフィリング、ホイップクリームの採用につながっております。
当事業の研究開発費は1,212百万円です。
(大豆加工素材事業)
大豆たん白質や大豆たん白食品、大豆ペプチド、大豆多糖類等による、お客様の課題解決を目指した製品の開発
を進め、これまで上市した新製品の拡販、改良に取り組んでいます。
粉末状大豆たん白素材では、「サンラバー®SY2000」は、粉体の分散性と物性に優れ、従来製品では対応できな
かったミキサー攪拌機での乳化生地生産が可能となり、生産現場の作業効率化や省人化を可能とする点が高く評価
され、従来からの主要市場である食肉加工、総菜加工市場での採用が進みました。栄養健康市場用途では、「プロ
リーナ®23LG」のプロテイン飲料市場での採用、また新製品として分散性、粉立ちをより改良した「プロリーナ
®CLHG」を上市、早速海外市場で粉末飲料への採用が進みました。高騰する卵素材への対応として、スポンジケー
キ等の洋菓子利用に特化した大豆たん白製剤の「ウフリー®」は、全卵の一部置き換え利用や、卵を使わないプラ
ントベースのスポンジケーキへの採用が進みました。
大豆多糖類素材では、従来と異なる高pH領域で安定特性を持つ酸性乳飲料用途向け「ソヤファイブ®HP100」の採
用が進みました。高たん白飲料において飲料設計に自由度を与える素材として認知が進んでいます。また、副産物
のオカラを原料として開発した機能性食物繊維素材の「ソヤセル®」は、小麦粉加工製品や、ソース類等での採用
が国内のみならず海外市場でも進みました。粘度安定性に優れた特性を有しながらも食品添加物扱いではなく、食
品としての表示が可能です。
粒状大豆たん白素材では、従来からの主要市場である総菜加工用途で、吸水力が高く風味が良好な「ニューフジ
ニック®90」を上市し、お客様に高く評価され、早速採用されております。「プライムソイ®国産大豆」はホテルメ
ニューや流通PBのワンハンドスナック、また製菓市場で採用されました。「プライムソイミート」シリーズは、焼
き肉にも使えるスライス肉タイプや、外食・中食のお客様向けに小袋タイプが健康コンセプトのメニュー等でお客
様から、従来の大豆ミート素材とは一線を画した品質との評価を戴いております。栄養スナック、バー市場では、
プロテインのコンセプトをうたう商品の多様化が進んでいます。「ソヤパフ®10」は大豆の美味しさを活かした製
品として発売し、たん白質訴求スナックで採用されております。またペットフード市場はプレミアム化が進んでお
り、本市場向けにも新製品を開発、大豆の栄養価に着目し高い評価を戴いております。
当事業の研究開発費は1,162百万円です。
(中長期視点での研究活動)
中長期視点の研究開発活動としては、大きくは、社会課題に対する研究開発及び新規事業につながる技術開発を
行っています。
未来創造研究所では、人口・経済・環境・食糧・ヘルスケアに関する定量情報を用いて2050年までの未来年表を
作成し、社会課題起点で研究テーマを創出・推進しています。NEDO(国立研究開発法人新エネルギー・産業技術総
合開発機構)『バイオものづくり革命推進事業』において「未利用原料を用いた油脂産業構造転換に寄与するバイ
オものづくり技術の開発と実証」が採択され、国内の廃棄バイオマス等の原料化、高付加価値な酵母油(イースト
オイル)を生産する酵母株及び商業生産プロセスの開発、並びに市場展開に必要な規格・標準化の検討を進めてい
ます。2025年度は、CO2を活用した大豆栽培の検証(たん白質含量向上条件の確認、特許出願等)を行うととも
に、大豆ペプチドのエビデンスを基にeスポーツ等の領域で用途提案を進め、将棋名人戦(2025年5月・大阪府泉佐
野市)において大豆ペプチド配合飲料を提供しました。さらに、安定化DHA油脂素材では、DHA強化乳飲料の継続摂
取に関する論文採択等により科学的根拠取得を進め、機能性表示に関する再申請に向けた対応を行いました。
植物性の風味創成技術MIRACORE®は、未来創造研究所における基盤研究から生まれた技術です。植物性油脂とた
ん白に関する長年の研究蓄積を基に、動物性食品特有の「満足感」を植物性素材で表現することを目的として研究
開発を進めてきました。当該技術を活用した製品群については、研究開発部門と事業部門が連携し、社会実装を見
据えた開発を推進しています。2025年度には、植物性で貝の風味を表現する「MIRA‑Dashi®貝タイプ」と、粉末
状・白湯タイプの「MIRA‑Dashi® C820P」を展開するなど、製品形態の拡張を進めています。これらの新製品は、
魚介類のダシ資源に関する将来的な供給不安への対応や、常温流通による海外輸出への適応、加工食品分野での幅
広い活用を視野に入れたものであり、ビーガン・ベジタリアン対応にとどまらない多様なプラントベース需要への
対応を目指しています。
また、未来創造研究所は、当社グループの将来の事業創出を見据え、国内外の大学を含む公的機関や企業とのコ
ラボレーション、並びに研究員の派遣等を通じたオープンイノベーションに取り組んでいます。2025年度は、オー
フス大学との共同研究を継続するとともに、コペンハーゲン大学の学生受入を実施しました。研究成果の一部は学
術誌に掲載されており 、油脂分野では 「Journal of Oleo Science, 74, 1057-1065 (2025)」、「Bioscience,
Biotechnology, and Biochemistry, 90, 76–87 (2026)」及び「サステナブルな食の未来の実現に向けた油脂酵母
を用いた持続可能な油脂生産技術の構築」(Bioscience and Industry, 83, 491-493 (2025))、たん白分野では
「Journal of Agriculture and Food Research, 24, 102447 (2025)」、「Food Science & Nutrition, 13,
e70319 (2025)」及び「Experimental Gerontology, 213, 112995 (2026)」が掲載されました。
当事業の研究開発費は1,796百万円です。
第3【設備の状況】
1【設備投資等の概要】
当連結会計年度の設備投資は総額29,225百万円(使用権資産を含む)となっております。この内、当社における投
資総額は9,855百万円、国内子会社における投資総額は1,134百万円、在外子会社における投資総額は18,236百万円で
す。
セグメント別の設備投資は次のとおりです。
(植物性油脂事業)
当連結会計年度における当事業の設備投資の主な内容は、在外子会社におけるFUJI VEGETABLE OIL, INC.の能力
増強工事や生産設備の更新及び、当社の能力増強工事や生産設備の更新等です。
当事業に係る設備投資金額は7,531百万円です。
なお、重要な設備の除却、売却等はありません。
(業務用チョコレート事業)
当連結会計年度における当事業の設備投資の主な内容は、在外子会社におけるBlommer Chocolate Company, LLC
の高付加価値製品の能力増強工事やHARALD INDÚSTRIA E COMÉRCIO DE ALIMENTOS LTDAの能力増強工事及び、当社
の能力増強工事や生産設備の更新等です。
当事業に係る設備投資金額は13,639百万円です。
なお、重要な設備の除却、売却等はありません。
(乳化・発酵素材事業)
当連結会計年度における当事業の設備投資の主な内容は、在外子会社におけるWOODLANDS SUNNY FOODS PTE.
LTD.の生産設備の更新及び、当社の能力増強工事や生産設備の更新等です。
当事業に係る設備投資金額は4,108百万円です。
なお、重要な設備の除却、売却等はありません。
(大豆加工素材事業)
当連結会計年度における当事業の設備投資の主な内容は、在外子会社における天津不二蛋白有限公司の生産設備
の更新及び、当社の能力増強工事や生産設備の更新等です。
当事業に係る設備投資金額は3,165百万円です。
なお、重要な設備の除却、売却等はありません。
2【主要な設備の状況】
(1)提出会社
2026年3月31日現在
帳簿価額(百万円)
事業所名
(所在地)
セグメントの名称
阪南事業所
植物性油脂、業務用チョ
(大阪府泉佐野市
コレート、乳化・発酵素
他)
材、大豆加工素材
関東工場
(茨城県笠間市)
業務用チョコレート、乳
化・発酵素材
つくば研究開発セン
ター
(茨城県つくばみら
い市)
神戸工場
設備の内容
生産設備、研
建物及び構
築物
機械装置及
土地
び運搬具
(面積千㎡)
16,484
11,130
生産設備
2,308
1,650
研究開発施設
1,593
54
究開発施設他
植物性油脂、業務用チョ
コレート、乳化・発酵素
材、大豆加工素材
大豆加工素材
生産設備
728
408
りんくう工場
(大阪府泉南市)
業務用チョコレート
生産設備
352
98
千葉工場
植物性油脂、乳化・発酵
(千葉市美浜区)
素材、大豆加工素材
生産設備
3,306
1,354
(神戸市兵庫区)
2,945
(214)
2,340
(63)
1,679
(22)
870
(15)
その他
9,072
39,634
107
6,407
279
3,606
105
2,112
7
943
140
7,047
485
(10)
2,246
(60)
(注)1.上記の帳簿価額は、日本基準に基づく個別財務諸表の帳簿価額を記載しています。
合計
従業員数
(名)
981
[165]
106
[5]
125
[11]
0
[-]
0
[-]
52
[3]
2.帳簿価額のうち「その他」は、「工具、器具及び備品」及び「建設仮勘定」です。
3.従業員数の[
]は、平均臨時雇用者数を外書きしております。
(2)国内子会社
2026年3月31日現在
帳簿価額(百万円)
会社名
事業所名
(所在地)
本社工場
オーム乳業㈱
(福岡県大牟田
市)
セグメントの
名称
乳化・発酵素
材
設備の内容
生産設備
建物及び構
築物
414
機械装置及
土地
び運搬具
(面積千㎡)
555
その他
526
138
(21)
合計
従業員数
(名)
67
1,634
[14]
(注)1.上記の帳簿価額は、日本基準に基づく個別財務諸表の帳簿価額を記載しています。
2.帳簿価額のうち「その他」は、「工具、器具及び備品」、「リース資産」及び「建設仮勘定」です。
3.従業員数の[ ]は、平均臨時雇用者数を外書きしております。
(3)在外子会社
2026年3月31日現在
帳簿価額(百万円)
会社名
事業所名
(所在地)
FUJI OIL
本社工場
(SINGAPORE)
PTE. LTD.
(シンガポー
ル)
WOODLANDS
本社工場
SUNNY FOODS
(シンガポー
PTE. LTD.
ル)
PALMAJU
本社工場
EDIBLE OIL
(マレーシア
SDN. BHD.
ジョホール)
FUJI OIL
本社工場
(THAILAND)
(タイ王国
CO., LTD.
ラヨーン県)
PT.
カラワン工場
FREYABADI
(インドネシア
INDOTAMA
カラワン)
FUJI GLOBAL
CHOCOLATE
本社工場
(M) SDN.
BHD.
INDUSTRIAL
(マレーシア
ジョホール)
不二製油(張
設備の内容
植物性油脂
生産設備
1,340
1,100
生産設備
1,934
1,889
生産設備
509
1,327
生産設備
829
100
生産設備
169
603
生産設備
772
972
生産設備
201
1,154
生産設備
567
1,221
生産設備
1,845
2,350
生産設備
320
1,325
生産設備
993
897
生産設備
1,664
4,511
乳化・発酵素
材
植物性油脂
乳化・発酵素
材
業務用チョコ
レート
業務用チョコ
レート
業務用チョコ
レート
-
(-)
-
(-)
-
(-)
197
(35)
85
(20)
-
(-)
その他
合計
2,301
4,742
1,332
5,157
375
2,213
163
1,290
21
879
488
2,233
1,377
2,733
302
2,091
512
4,709
59
1,705
653
2,545
3,733
9,909
従業員数
(名)
163
[3]
136
[-]
209
[2]
100
[-]
246
[65]
165
[-]
-
(-)
80
[6]
植物性油脂、
業務用チョコ
(中国江蘇省)
レート、乳
化・発酵素材
不二製油(肇
本社工場
乳化・発酵素
慶)有限公司
(中国広東省)
材
天津不二蛋白
本社工場
有限公司
(中国天津市)
司
機械装置及
土地
び運搬具
(面積千㎡)
ア)
本社工場
家港)有限公
建物及び構
築物
本社工場
FOOD
(オーストラリ
SERVICES PTY ア ビクトリ
LIMITED
セグメントの
名称
Blommer
Chocolate
本社工場
Manufacturin
(中国上海市)
g (Shanghai)
大豆加工素材
業務用チョコ
レート
-
(-)
-
(-)
-
(-)
-
(-)
347
[2]
151
[-]
82
[1]
98
[-]
Co., Ltd.
FUJI
VEGETABLE
OIL, INC.
本社工場
(米国サバナ)
植物性油脂
-
(-)
143
[2]
帳簿価額(百万円)
会社名
事業所名
(所在地)
セグメントの
名称
設備の内容
建物及び構
築物
機械装置及
土地
び運搬具
(面積千㎡)
その他
合計
従業員数
(名)
HARALD
INDÚSTRIA E
本社工場
COMÉRCIO DE
ALIMENTOS
(ブラジル
サンパウロ州)
業務用チョコ
生産設備
4,953
5,936
生産設備
667
8,161
生産設備
337
4,077
生産設備
880
1,442
生産設備
956
4,197
大豆加工素材
生産設備
2,205
5,057
植物性油脂
生産設備
656
305
レート
449
(26)
1,905
13,244
1,915
11,060
327
7,237
8,314
10,765
311
5,998
176
7,868
595
1,558
666
[14]
LTDA
Blommer
Chocolate
Company, LLC
Blommer
Chocolate
Company of
California,
LLC
イーストグリー
ンビル工場
業務用チョコ
(米国イースト
グリーンビル)
レート
315
(85)
323
[2]
ユニオンシティ
工場
業務用チョコ
(米国ユニオン
シティ)
レート
2,494
(39)
162
[1]
キャンベルフォ
Blommer
ード工場
Chocolate of (カナダ キャ
Canada Inc.
ンベルフォー
業務用チョコ
レート
127
(28)
167
[1]
ド)
FUJI OIL
EUROPE
本社工場
植物性油脂、
(ベルギー
業務用チョコ
ゲント)
レート
Fuji
本社工場
Brandenburg
GmbH
(ドイツ
ゴルセン)
PROVENCE
HUILES S.A.S
本社工場
(フランス
ヴィトロル)
532
(94)
429
(32)
-
(-)
(注)1.帳簿価額のうち「その他」は、「工具、器具及び備品」、「使用権資産」及び「建設仮勘定」です。
なお、使用権資産は主に生産設備や土地、物流拠点等の賃貸借契約に基づくものです。
2.従業員数の[ ]は、平均臨時雇用者数を外書きしております。
3【設備の新設、除却等の計画】
(1)重要な設備の新設等
該当する事項はありません。
(2)重要な設備の除却等
該当する事項はありません。
149
[28]
18
[-]
22
[1]
第4【提出会社の状況】
1【株式等の状況】
(1)【株式の総数等】
①【株式の総数】
種類
発行可能株式総数(株)
普通株式
357,324,000
計
357,324,000
②【発行済株式】
事業年度末現在
発行数(株)
(2026年3月31日)
種類
提出日現在
発行数(株)
(2026年6月22日)
上場金融商品取引所名又は登
録認可金融商品取引業協会名
内容
普通株式
87,569,383
87,569,383
東京証券取引所
プライム市場
単元株式数
100株
計
87,569,383
87,569,383
-
-
(2)【新株予約権等の状況】
①【ストックオプション制度の内容】
該当事項はありません。
②【ライツプランの内容】
該当事項はありません。
③【その他の新株予約権等の状況】
該当事項はありません。
(3)【行使価額修正条項付新株予約権付社債券等の行使状況等】
該当事項はありません。
(4)【発行済株式総数、資本金等の推移】
年月日
1999年4月1日
~
2000年3月31日
発行済株式
総数増減数
(株)
発行済株式
総数残高
(株)
資本金
増減額
(百万円)
資本金
残高
(百万円)
資本準備金
増減額
(百万円)
資本準備金
残高
(百万円)
△658,000
87,569,383
-
13,208
△450
18,324
(注)資本準備金による自己株式の消却による減少です。
(5)【所有者別状況】
2026年3月31日現在
株式の状況(1単元の株式数100株)
区分
政府及び
地方公共金融機関
団体
金融商品 その他の
取引業者
法人
外国法人等
個人以外
個人
個人
その他
計
単元未満株
式の状況
(株)
株主数(名)
-
29
33
241
227
51
25,277
25,858
-
所有株式数
(単元)
-
154,004
36,494
435,828
131,367
147
117,338
875,178
51,583
所有株式数の
割合(%)
-
17.60
4.17
49.80
15.01
0.02
13.41
100.00
-
(注)1.自己株式1,347,296株は、「個人その他」の欄に13,472単元及び「単元未満株式の状況」の欄に96株それぞ
れ含めて記載しております。
2.「株式の状況」の「その他の法人」欄には、証券保管振替機構名義の株式2単元が含まれております。
(6)【大株主の状況】
2026年3月31日現在
氏名又は名称
所有株式数
(千株)
住所
発行済株式(自己
株式を除く。)の
総数に対する所有
株式数の割合
(%)
伊藤忠フードインベストメント合同
会社
東京都港区北青山2丁目5-1
36,660
42.52
株式会社日本カストディ銀行(信託
口)
東京都中央区晴海1丁目8-12
6,009
6.97
日本マスタートラスト信託銀行株式
会社(信託口)
東京都港区赤坂1丁目8-1
5,607
6.50
東京都千代田区大手町1丁目9-7
2,122
2.46
株式会社ロイズコンフェクト
北海道札幌市北区あいの里四条9丁目1
-1
1,600
1.86
不二製油取引先持株会
大阪府泉佐野市住吉町1番地
1,482
1.72
MSIP CLIENT SECURITIES
(常任代理人 モルガン・スタンレ
ーMUFG証券株式会社)
25 CABOT SQUARE, CANARY WHARF,
LONDON E14 4QA, U.K.
(東京都千代田区大手町1丁目9-7)
1,291
1.50
伊藤忠商事株式会社
東京都港区北青山2丁目5-1
1,141
1.32
日本生命保険相互会社
東京都千代田区丸の内1丁目6-6
1,100
1.28
GOVERNMENT OF NORWAY
(常任代理人 シティバンク、エ
ヌ・エイ東京支店)
BANKPLASSEN 2, 0107 OSLO 1 OSLO 0107
NORWAY
(東京都新宿区新宿6丁目27-30)
1,066
1.24
計
-
58,082
67.36
モルガン・スタンレーMUFG証券株式
会社
(注)1.上記の所有株式数のうち、信託業務に係る株式数は、次のとおりです。
株式会社日本カストディ銀行(信託口)
6,009千株
日本マスタートラスト信託銀行株式会社(信託口)
5,607千株
2.株式会社日本カストディ銀行(信託口)の所有株式数には、当社取締役(社外取締役及び監査等委員である
取締役を除く)並びに執行役員への株式報酬制度のために設定した株式交付信託に係る信託口が所有する当
社株式が239,600株含まれております。
(7)【議決権の状況】
①【発行済株式】
2026年3月31日現在
区分
株式数(株)
議決権の数(個)
内容
無議決権株式
-
-
-
議決権制限株式(自己株式等)
-
-
-
議決権制限株式(その他)
-
-
-
-
-
完全議決権株式(自己株式等)
(自己保有株式)
普通株式
1,347,200
完全議決権株式(その他)
普通株式
86,170,600
861,706
-
単元未満株式
普通株式
51,583
-
-
発行済株式総数
87,569,383
-
-
総株主の議決権
-
861,706
-
(注)「完全議決権株式(その他)」欄の普通株式には、証券保管振替機構名義の株式が200株(議決権2個)及び
当社取締役(社外取締役及び監査等委員である取締役を除く)並びに執行役員への株式報酬制度のために設定
した株式交付信託に係る信託口が所有する株式239,600株(議決権数2,396個)が含まれております。
②【自己株式等】
2026年3月31日現在
所有者の氏名又は名称
所有者の住所
自己名義所有
株式数(株)
他人名義所有
株式数(株)
所有株式数の
合計(株)
発行済株式総
数に対する所
有株式数の割
合(%)
大阪府泉佐野市住吉町
1番地
1,347,200
-
1,347,200
1.54
-
1,347,200
-
1,347,200
1.54
(自己保有株式)
不二製油株式会社
計
(注)上記の自己名義所有株式数には、当社取締役(社外取締役及び監査等委員である取締役を除く)並びに執行役
員への株式報酬制度のために設定した株式交付信託に係る信託口が所有する株式239,600株は含まれておりま
せん。
(8)【役員・従業員株式所有制度の内容】
取締役に対する株式報酬制度
当社は、2022年6月21日開催の第94回定時株主総会決議に基づき、当社取締役(社外取締役及び監査等委員であ
る取締役を除く)を対象に、取締役の報酬と当社の株式価値との連動性をより明確にし、取締役が株価の変動によ
る利益・リスクを株主の皆様と共有することで、中長期的な業績の向上と企業価値の増大に貢献する意識を高める
ことを目的として、業績連動型株式報酬(株式交付信託)制度(以下「本制度」)を導入しております。
本制度に関する詳細は、「第4 提出会社の状況 4 コーポレート・ガバナンスの状況等 (4)役員の報酬
等」に記載しております。
① 制度の概要
本制度は、当社が金銭を拠出することにより設定する信託が当社株式を取得し、当社が各取締役(社外取締役
及び監査等委員である取締役を除く)に付与するポイントの数に相当する数の当社株式が本信託を通じて各取締
役に対して交付される株式報酬制度です。なお、取締役が付与されたポイントに応じた当社株式の交付を受ける
時期は、原則として取締役の退任時です。
② 取締役に取得させる予定の株式の総額
本制度の対象となる取締役に交付するために必要な当社株式の取得資金として、当初3年間の信託期間(当該
信託間は当社取締役会の決定により5事業年度以内の期間を都度定めて延長できる)を定めたうえで、当社が拠
出する金銭の上限を合計600百万円と決議しております。
③ 受益権その他の権利を受けることができる者の範囲
当社取締役(社外取締役及び監査等委員である取締役を除く)
2【自己株式の取得等の状況】
【株式の種類等】
会社法第155条第7号に該当する普通株式の取得
(1)【株主総会決議による取得の状況】
該当事項はありません。
(2)【取締役会決議による取得の状況】
該当事項はありません。
(3)【株主総会決議又は取締役会決議に基づかないものの内容】
区分
株式数(株)
価額の総額(円)
当事業年度における取得自己株式
164
525,425
当期間における取得自己株式
-
-
(注)当期間における取得自己株式には、2026年6月1日からこの有価証券報告書提出日までの単元未満株式の買取り
による株式は含まれておりません。
(4)【取得自己株式の処理状況及び保有状況】
当事業年度
区分
当期間
株式数(株)
処分価額の総額
(円)
株式数(株)
処分価額の総額
(円)
148,000
420,986,000
-
-
消却の処分を行った取得自己株式
-
-
-
-
合併、株式交換、株式交付、会社分割に係る移
転を行った取得自己株式
-
-
-
-
その他
-
-
-
-
1,347,296
-
-
-
引き受ける者の募集を行った取得自己株式
保有自己株式数
(注)1.当事業年度の引き受ける者の募集を行った取得自己株式の処分は、当社取締役(社外取締役及び監査等委員
である取締役を除く)並びに執行役員への株式報酬制度のために設定した株式交付信託の受託者である三井
住友信託銀行株式会社(信託口)(再信託受託者:株式会社日本カストディ銀行(信託口))に対して行っ
たものであります。
2.上記の保有自己株式数には、当社取締役(社外取締役及び監査等委員である取締役を除く)並びに執行役員
への株式報酬制度のために設定した株式交付信託に係る信託口が所有する株式239,600株は含まれておりま
せん。
3.当期間における保有自己株式数には、2026年6月1日からこの有価証券報告書提出日までの単元未満株式の
買取りによる株式は含まれておりません。
3【配当政策】
当社は株主の皆様への利益還元を経営の重要課題の一つとして認識をしております。株主配当につきましては、配
当性向30%~40%を目安とし、安定的かつ継続的な配当を実施してまいります。内部留保資金につきましては、企業
価値向上のために生産設備投資、新規事業投資及び研究開発投資等の成長投資に活用してまいります。
また、当社は中間配当と期末配当の年2回の剰余金配当を行うことを基本としております。
これらの剰余金の配当の決定機関は、期末配当については株主総会、中間配当については取締役会です。
当事業年度の配当につきましては、上記配当政策に基づき当期は1株につき52円の配当(うち中間配当26円)を実
施することを予定しております。
当社は、「会社法第454条第5項の規定に基づき、取締役会の決議により、毎年9月30日を基準日として、中間配
当を行うことができる。」旨を定款に定めております。
なお、当事業年度に係る剰余金の配当は以下のとおりです。期末配当に関する配当金の総額2,241百万円及び1株
当たり配当額26円につきましては、2026年6月23日開催予定の定時株主総会の決議事項となっております。
決議年月日
2025年11月11日
取締役会決議
2026年6月23日
定時株主総会決議(予定)
配当金の総額
(百万円)
1株当たり配当額
(円)
2,241
26.00
2,241
26.00
4【コーポレート・ガバナンスの状況等】
(1)【コーポレート・ガバナンスの概要】
① コーポレート・ガバナンスに関する基本的な考え方
当社においては、「コーポレート・ガバナンス」を、当社が、株主、顧客、その他取引先、役職員及び社会等の
ステークホルダーの期待に応えていくために、透明・公正かつ迅速・果断な意思決定を行うための仕組みと捉え、
実効性あるコーポレート・ガバナンスの実現を通じて、法令違反、不正や不祥事等の企業価値を毀損するような事
態の発生を防止しつつ、持続的な成長と中長期的な企業価値の向上を図ることを目的としております。
当社は機動的かつ合理的な意思決定や業務遂行を行うとともに、取締役会のモニタリング機能を強化すること
が、株主をはじめとするステークホルダーからの信頼や期待に応えるために重要であると考えております。監査等
委員会設置会社として、取締役会の監督機能の強化を通じてより一層のコーポレート・ガバナンスの充実を図ると
ともに、重要な業務執行の意思決定を取締役へ権限委譲することにより、成長戦略の実行を加速いたします。
②
企業統治の体制の概要及び当該体制を採用する理由
当社は重要事項に関する意思決定機関及び監督機関として取締役会を、監査機関として監査等委員会を、取締役
会の任意の諮問機関として「指名・報酬諮問委員会」及び「サステナビリティ委員会」を、業務執行機関として代
表取締役社長の下に経営会議を設置しております。
取締役会は、有価証券報告書提出日時点で、取締役(監査等委員である取締役を除く)8名(内、独立社外取締
役4名)と監査等委員3名(内、独立社外取締役2名)の全11名であり、独立社外取締役を6名(社外取締役7
名)とする体制となっております。取締役会規則を定め、原則月1回開催される「取締役会」及び、必要に応じ
「臨時取締役会」を適宜開催しております。法令に定められた事項及び重要事項の審議、決議がなされるとともに
業務を執行する取締役は自己の職務の執行状況を報告しております。
監査等委員会は、監査等委員3名(内、独立社外取締役2名)となっております。監査等委員会規則を定め、
「監査等委員会」を原則月1回開催してまいります。当社及び当社グループの業務及び財産の状況の調査や、内部
統制システムを利用した取締役(監査等委員である取締役を除く)の職務執行の監査を実施いたします。
取締役会の任意の諮問機関として、役員の選解任やサクセッションプラン、取締役報酬制度の策定等の審議・答
申を行う「指名・報酬諮問委員会」を、中長期的な環境(E)・社会(S)と企業経営双方の観点からサステナビリテ
ィに関する経営の重要課題につき審議・答申を行う「サステナビリティ委員会」を設置しております。
業務執行に関する重要事項については、代表取締役社長、業務執行取締役及び執行役員を主要メンバーとする経
営会議等において十分に議論、審議することにより代表取締役社長及び取締役会の意思決定に資するものとし、業
務執行の適法かつ効率的な運営を確保できる体制を整備、強化しております。
本報告書提出時点での各機関の構成員は以下のとおりであります。
(◎議長・委員長、〇構成員、アドバイザー又はオブザーバー)
役
職
監査等
委員会
指名・報
酬諮問委
員会
サステナ
ビリティ
委員会
経営会議
〇
◎
◎
〇
〇
〇
〇
氏
名
取締役会
代表取締役社長
大森
達司
◎
取締役上席執行役員
田中
寛之
〇
取締役上席執行役員
前田
淳
〇
〇
取締役(社外取締役)
梅原
俊志
〇
〇
取締役(社外取締役)
辻
智子
〇
◎
取締役(社外取締役)
中川
理惠
〇
〇
取締役(社外取締役)
立川
義大
〇
取締役(社外取締役)
十河
哲也
〇
取締役常勤監査等委員
戸川
雄介
〇
◎
取締役監査等委員(社外取締役)
池田
裕彦
〇
〇
取締役監査等委員(社外取締役)
谷
保廣
〇
〇
アドバイザー
〇
〇
オブザーバー
アドバイザー
当社が監査等委員会設置会社を選択している理由としては、常勤の監査等委員である社内取締役が監査に資する
社内情報を収集し、監査等委員会を通じて監査等委員である独立社外取締役と共有する他、内部監査部門との緊密
な連携を通じて組織監査の実効性の確保が可能であること、また、取締役会のモニタリング機能の強化において
は、企業経営に関し豊富な経験を持つ社外取締役の充実に加え、公認会計士、弁護士である独立社外取締役が監査
等委員として取締役会において高い専門性や見識からの意見を述べ、かつ議決権を行使することにより、適切な審
議や取締役の職務執行の監督等に寄与し得ると考えているからであります。
これらの体制を採用することにより、透明性の高い健全な経営を実現することが可能であると考えます。
③
企業統治に関するその他の事項
当社の内部統制システムは、業務の有効性・効率性、財務報告の信頼性、関連法規の遵守、財産の保全、リスク
管理を徹底するため、内部統制システム・プロセスの構築、整備を行っております。その内容は以下のとおりで
す。なお、組織及び社内規程の名称は提出日現在のものです。
a.取締役及び使用人の職務の執行が法令及び定款に適合することを確保するための体制
(ⅰ) 取締役及び使用人は、当社グループの使命、目指す姿、行動する上で持つべき価値観、行動原則を明文化し
た「不二製油グループ憲法」に則り行動する。
(ⅱ) 当社は、取締役会の任意の諮問機関として独立社外取締役で過半数を構成する「指名・報酬諮問委員会」を
設置し、役員選任及び役員報酬決定のプロセスの透明性の確保を図る。
(ⅲ) 当社において「不二製油グループ憲法」の行動原則、法令違反、その他コンプライアンスに反する行為があ
り、職制を通じての是正が機能しない場合、役職員は「内部通報制度」により通報できるようにする。この
場合、通報することにより通報者に対して不利益が生じないことを確保する。また、「内部通報規程」を定
め、外部の弁護士が「通報窓口」を担当することにより、運用面での実効性を図る。海外のグループ会社に
対しては、多言語対応の通報窓口(名称:コンプライアンス・ヘルプライン)を設置し、不二製油グループ
全体でのコンプライアンス体制の強化を図る。
(ⅳ) 当社は、違法な勢力とは接触を持たず、市民社会の秩序や安全に脅威を与える反社会的勢力には、毅然とし
た態度を貫くことを基本とする。
(ⅴ) 当社は、内部監査部門として内部監査室を設置。法令、定款、社内諸規程の順守状況につき内部監査を実施
し監査等委員会及び取締役会に結果を報告する。
b.取締役の職務の執行に係る情報の保存及び管理に関する体制
当社は、法令で定める文書他、職務執行に係る重要情報が記載された文書(電磁的記録含む)を、「文書管理
規程」「情報管理規程」他社内規程の定めにより、適切に保存し管理する。
c.損失の危険の管理に関する規程その他の体制
(ⅰ) 当社は、「リスクマネジメント規程」を定め、グループ各社で設置のリスクマネジメント委員会を通じ、当
社経営会議で全社リスクを網羅的に把握し重要なリスクを特定の上、モニタリング機関である取締役会に報
告する。全社リスクマネジメント機関と位置づける経営会議では、各リスクの管掌役員を定め、対応策の立
案、実施、進捗確認、評価・改善を行うとともに、検討・対応内容は年1回以上、取締役会へ報告され、取
締役会はそのモニタリングを行う。
(ⅱ) 当社は、危機対応として「クライシス対応に関する規程」を定め、グループ全体に対する影響の重大さに応
じ、当社またはグループ各社で社長を本部長とする緊急対策本部を設置。迅速に対応を行うとともに、「危
機管理広報マニュアル」を整備し、当社グループとして危機発生時の情報開示における初期対応を適切に行
う。
d.取締役の職務の執行が効率的に行われることを確保するための体制
(ⅰ) 当社は、意思決定の迅速化のため職務分掌及び職務権限に関する社内規程を整備し、権限と責任を明確にす
るとともに、重要事項については、代表取締役社長、業務執行取締役及び執行役員を主なメンバーとする経
営会議等での審議を踏まえて代表取締役社長及び取締役会の意思決定に資するものとする。
(ⅱ) 取締役会規則を定め、原則月1回開催される取締役会において、経営に関する重要事項について決定を行う
とともに、職務の執行状況のモニタリングを行う。
(ⅲ) 当社は、中期経営計画を定め、会社として達成すべき目標を明確化するとともに、業務執行取締役及び執行
役員の業績目標を明確にする。
(ⅳ) 当社は、業績の進捗状況を的確、タイムリーに把握するための管理会計システムを整備し、この実践的運用
を通じ、変化に対しスピーディーに対処する体制を構築する。
e.当社及びその子会社から成る企業集団における業務の適正を確保するための体制
(ⅰ) 当社は「不二マネジメント規程」を定め、グループ会社への統括事項やそれらの主管部門・責任者を規定す
る。当社は、グループ会社に対し、「決裁権限基準一覧規程」及び「決裁権限に関する運用規程」に定める
重要項目については当社の承認を得、報告を行うことを義務付ける。
(ⅱ) 当社は、グループ会社の経営に責任と権限を持ち、グループ会社に対し「不二製油グループ憲法」その他不
二製油グループ方針・規程が適切に実施されるよう助言指導するとともに、グループ会社全体のリスク及び
コンプライアンスを管理するため、企業規模や組織体制等に応じた適切なリスク管理体制及びコンプライア
ンス体制を構築する。
(ⅲ) 監査等委員会は、内部監査室と連携し、また指揮を行い、グループ会社の業務の適正を監査する。監査の結
果、是正が必要な場合には助言、勧告を行うとともに、内部監査室は監査結果を監査等委員会及び取締役会
に報告する。
(ⅳ) 当社は、「不二マネジメント規程」及び他関連規程により、当社グループにおける職務分掌、指揮命令系
統、権限及び意思決定その他組織等に関する基準を定め、子会社にこれに準拠した体制を構築させる。
(ⅴ) 当社は「税務規程」にグループ全体の税務業務に係る役割・責任を定め、グループ各社の税務法令・規則の
順守、税務リスク管理、納税額の適正化を推進するための体制を構築する。(「⑭税務ガバナンス」参照)
f.監査等委員会の職務を補助すべき取締役及び使用人に関する事項、当該使用人の監査等委員以外の取締役から
の独立性に関する事項及び使用人に対する指示の実効性の確保に関する事項
(ⅰ) 監査等委員会は、必要に応じて業務を補助する使用人をおくことができる。補助使用人は、業務の独立性や
効率性の観点から専任であることが望ましいが、他部門との兼務者を補助人とすることがある。この場合、
当該使用人の監査等委員会の補助人としての業務に係る能力考課・業績考課は監査等委員会の意見を尊重
し、また、当該使用人の異動には監査等委員会の同意を必要とする。
(ⅱ) 監査等委員会は、同補助人の充実と取締役(監査等委員である取締役を除く)からの独立性及び同補助人に
対する監査等委員会の指示の実効性確保に関し、代表取締役社長と意見交換を行う。
g.監査等委員会への報告に関する体制
(ⅰ) 監査等委員である取締役は経営会議、その他の重要な会議に出席し、取締役等からその職務の執行状況を聴
取し、関係資料を閲覧することができる。
(ⅱ) 取締役(監査等委員である取締役を除く)は、以下の事項につき速やかに監査等委員会に報告する。
・会社の信用を大きく低下させた、又はさせる恐れのあるもの
・会社業績に大きく悪影響を与えた、又は与える恐れのあるもの
・法令・定款又は「不二製油グループ憲法」に反し、その影響が重大なもの、又はその恐れがあるもの
・その他上記に準じる事項
(ⅲ) 取締役(監査等委員である取締役を除く)及び使用人は、監査等委員会が報告を求めた場合は、迅速かつ的
確に対応する。
(ⅳ) 当社グループの役職員は、当社監査等委員会から業務執行に関する報告を求められた場合には、速やかに適
切な報告を行う。
(ⅴ) 当社は、当社監査等委員会及び当社グループの監査役へ報告を行った当社グループの役職員に対し、当該報
告をしたことを理由として不利な取り扱いを行うことを禁止し、その旨を当社グループ役職員に周知徹底す
る。
(ⅵ) 当社は、内部通報(対象地域:日本)及びコンプライアンス・ヘルプライン(対象地域:日本以外)の通報
内容については、直接的又は間接的に監査等委員である取締役に報告を行う。
h.その他監査等委員会の監査が実効的に行われることを確保するための体制
(ⅰ) 監査等委員会は、主要な稟議書その他業務執行に関する重要な文書を閲覧し、また必要に応じて取締役、使
用人にその説明を求めることができる。
(ⅱ) 監査等委員会は、監査等委員である取締役を通じ、代表取締役社長との定期的な会合を実施するほか、内部
監査室、会計監査人との連携を図り、適切な意思疎通及び効果的な監査業務の遂行を図る。
(ⅲ) 監査等委員会は、独自意見を形成するため必要あるときは、その判断で外部専門家を起用することができ
る。
(ⅳ) 当社は、監査等委員である取締役がその職務の執行に関して、当社に対し、会社法第399条の2第4項に基づ
く費用の前払い等の請求をしたときは、担当部署において審議の上、当該請求にかかる費用または債務が当
該監査等委員である取締役の職務の執行に必要でないと認められた場合を除き、速やかに当該費用または債
務を処理する。
i.財務報告の適正性を確保するための体制
財務報告の適正性の確保及び金融商品取引法に規定する内部統制報告書の有効かつ適切な提出の目的のため、
内部統制システムが適正に機能することを継続的に評価し、改善を図る。
当社のコーポレート・ガバナンス体制の模式図は、以下のとおりです。
(2026年6月22日現在)
④
責任限定契約の内容と概要
当社は各取締役(業務執行取締役であるものを除く)との間で、会社法第427条第1項及び当社定款の規定に基
づき、会社法第423条第1項の賠償責任を限定する契約を締結しており、当該契約に基づく賠償責任限度額は、会
社法第425条第1項に定める額としております。なお、当該責任限定が認められるのは、当該役員が責任の原因と
なった職務の遂行について善意でかつ、重大な過失がないときに限られます。
⑤
補償契約の内容と概要
当社は、会社法第430条の2第1項に基づき、各取締役との間において、同項第1号の費用及び同項第2号の損
失を法令の定める範囲内において当社が補償する補償契約を締結する予定であります。ただし、当該補償契約によ
って会社役員の職務の執行の適正性が損なわれないようにするため、通常要する額を超える防御費用や会社役員が
その職務を行うにつき悪意または重大な過失があった場合の賠償金等は補償の対象外とすることを予定しておりま
す。
⑥
役員等賠償責任保険契約の内容の概要
当社は、会社法第430条の3第1項に規定する役員等賠償責任保険契約を保険会社との間で締結しております。
当該保険契約の被保険者の範囲は、当社及び当社子会社の役員(取締役及び監査役)、執行役員その他会社法上の
重要な使用人、並びに当社または当社子会社の役員であった者であり、被保険者は保険料を負担しておりません。
当該保険契約では、被保険者が会社の役員等の地位に基づき行った行為(不作為を含みます。)に起因して損害賠
償請求がなされたことにより、被保険者が被る損害賠償金や訴訟費用等が塡補されることとなります。ただし、法
令違反の行為であることを認識して行った行為の場合等を免責事由とすることにより、役員等の職務の執行の適正
性が損なわれないように措置を講じています。
⑦
取締役(業務執行取締役であるものを除く)の責任免除
当社は、取締役が期待される役割を十分発揮できるよう会社法第426条第1項の規定により、任務を怠ったこと
による取締役(取締役であった者及び監査役であった者を含む)の損害賠償責任を、法令の限度額において、取締
役会の決議によって免除することができる旨を定款に定めております。
⑧
取締役の定数
当社の取締役(監査等委員である取締役を除く)は12名以内、監査等委員である取締役を4名以内とする旨を定
款に定めております。
⑨
取締役の選任の決議要件
当社は、取締役の選任決議について、議決権を行使することができる株主の議決権の3分の1以上を有する株主
が出席し、その議決権の過半数をもって行う旨を、また、取締役の選任決議は、累積投票によらないものとする旨
を定款に定めております。
⑩
中間配当の決定機関
当社は、株主への機動的な利益還元を行うため、会社法第454条第5項の規定により、取締役会の決議によって
毎年9月30日を基準日として、中間配当を行うことができる旨を定款に定めております。
⑪
自己株式の取得の決定機関
当社は、経営環境に応じた機動的な資本政策を遂行するため、会社法第165条第2項の規定により、取締役会の
決議によって市場取引等により自己株式を取得できる旨を定款に定めております。
⑫
株主総会の特別決議要件
当社は、会社法第309条第2項に定める株主総会の特別決議要件について、議決権を行使することのできる株主
の議決権の3分の1以上を有する株主が出席し、その議決権の3分の2以上をもって行う旨を定款に定めておりま
す。これは、株主総会の円滑な運営を行うことを目的とするものです。
⑬
株式会社の支配に関する基本方針
当社は、財務及び事業の方針の決定を支配する者の在り方に関する「基本方針」及び「買収防衛策」について
は、特に定めておりません。
⑭
税務ガバナンス
当社は、税に関する国内外の法令及び規則を順守することは「不二製油グループ憲法」に沿って高い倫理観の基
で行われるべき、企業の社会的責任であると認識しております。
当社は最高財務責任者(CFO)を最終責任者として、グループ全体の税務業務に係る役割・責任を「税務規程」
に定め、グループ各社の税務法令・規則の順守、適切な税務リスク管理の確保、納税額の適正化を推進するための
税務ガバナンス体制を構築いたします。また、その体制が適切に維持・実行されるためグループ会社に対する周知
やモニタリングを行い、持続的な企業価値の向上へ向けた取組を行っております。
これらの取組を含め当社グループとしての税務に関する基本理念を「不二製油グループ税務ポリシー」として、
当社ウェブサイトにてステークホルダーに向けて示しております。
「不二製油グループ税務ポリシー」は以下のURLよりご参照ください。
https://www.fujioil.co.jp/about/governance/compliance/
<企業価値向上へ向けた税務ガバナンス体制>
⑮
取締役会の活動状況
当連結会計年度において、当社は取締役会を16回開催しており、本報告書提出時点での個々の取締役の出席状況
については次のとおりであります。
氏
名
開催
回数
出席
回数
出席
率
代表取締役社長
大森
達司
13回
13回
100%
取締役上席執行役員
田中
寛之
16回
16回
100%
取締役上席執行役員
前田
淳
16回
16回
100%
取締役(社外取締役)
梅原
俊志
16回
16回
100%
取締役(社外取締役)
辻
智子
16回
16回
100%
取締役(社外取締役)
中川
理惠
16回
16回
100%
取締役(社外取締役)
立川
義大
16回
16回
100%
取締役(社外取締役)
十河
哲也
13回
13回
100%
取締役常勤監査等委員
戸川
雄介
16回
16回
100%
取締役監査等委員
(社外取締役)
池田
裕彦
16回
15回
94%
取締役監査等委員
(社外取締役)
谷
保廣
16回
16回
100%
役
職
備
考
2025年6月27日開催の第97回定時株主総会で
選任
2025年6月27日開催の第97回定時株主総会で
選任
取締役会では、企業価値の向上、リスクマネジメント、取締役会運営、執行の実態把握、その他定例議題等が審
議され、具体的な検討内容として、研究開発戦略、生物多様性に関する方針の策定、取締役会実効性評価等、ま
た、全社重要リスク対応及びコンプライアンス活動レビュー等について、審議を行っております。
⑯
指名・報酬諮問委員会の活動状況
当社は社外取締役を過半数として構成する指名・報酬諮問委員会を設置し、当連結会計年度においては13回開催
しており、本報告書提出時点での個々の取締役の出席状況については次のとおりであります。
なお、当連結会計年度中の委員の異動等により、それぞれの委員に対して対象となる開催回数が異なります。
役
職
氏
名
開催
回数
出席
回数
出席
率
備
考
取締役(社外取締役)
梅原俊志
13回
13回
100%
取締役(社外取締役)
辻
智子
13回
12回
92%
当委員会委員長
取締役(社外取締役)
中川理惠
13回
12回
92%
取締役(社外取締役)
十河哲也
9回
9回
100% 2025年6月27日開催の取締役会で選任
代表取締役社長
大森達司
9回
9回
100% 2025年6月27日開催の取締役会で選任
取締役上席執行役員
前田淳
9回
9回
100% 2025年6月27日開催の取締役会で選任
指名・報酬諮問委員会における具体的な検討内容として、最高経営責任者(CEO)の後継者計画のモニタリン
グ、取締役会の構成、取締役・執行役員体制、並びに取締役の報酬支給総額、報酬額算定方法、業績連動の算定指
標(KPI)に関する事項等について審議し、取締役会に答申を行っております。
(2)【役員の状況】
①
役員一覧
男性9名
役職名
女性2名(役員のうち女性の比率18.2%)
氏名
生年月日
略歴
任期
所有株式数
(千株)
(注)2
17
(注)2
11
(注)2
4
1983年4月当社入社
2004年3月山東龍藤不二食品有限公司総経理
2008年4月当社蛋白加工食品カンパニー蛋白食品部門蛋
白食品販売第三部長
2013年4月営業本部第一営業部門第一部長
2014年4月当社執行役員
2014年4月営業本部第二営業部門長
2015年4月事業本部乳化・発酵事業部長
代表取締役社長
最高経営責任者
大森
達司
1960年4月28日生
(CEO)
2017年4月当社最高業務執行責任者(COO)
旧不二製油株式会社(2025年4月当社に吸
収合併)代表取締役社長
2017年6月当社取締役
2019年4月当社上席執行役員
2021年6月当社取締役退任
2025年4月当社社長執行役員
当社最高経営責任者(CEO)(現任)
2025年6月当社代表取締役社長(現任)
1990年4月伊藤忠商事株式会社入社
2014年4月同社から当社に出向
2015年6月 HARALD INDÚSTRIA E COMÉRCIO DE ALIMENTOS
LTDA取締役最高財務責任者(CFO)
2017年4月伊藤忠商事株式会社食糧部門飼料・穀物・油
糧部長
2019年4月同社食糧部門長代行兼飼料・穀物・油糧部長
取締役
上席執行役員
最高執行責任者
2020年9月同社から当社に出向
田中
寛之
1968年1月3日生
2020年10月 Blommer Chocolate Company, LLC取締役(現
任)
(COO)
2021年4月 HARALD INDÚSTRIA E COMÉRCIO DE ALIMENTOS
LTDA会長(現任)
2022年3月伊藤忠商事株式会社退社
2022年4月当社入社
当社上席執行役員(現任)
当社最高経営戦略責任者(CSO)
2022年6月当社取締役(現任)
2025年4月当社最高執行責任者(COO)(現任)
1990年4月当社入社
2015年4月 FUJI OIL ASIA PTE. LTD. 取締役
2018年6月当社経営企画グループ グループリーダー
取締役
上席執行役員
最高財務責任者
(CFO)
前田
淳
1967年11月2日生
2021年7月当社執行役員
FUJI EUROPE AFRICA B.V.社長
2023年7月当社上席執行役員(現任)
当社最高財務責任者(CFO)(現任)
2024年6月当社取締役(現任)
役職名
氏名
生年月日
略歴
任期
所有株式数
(千株)
(注)2
1
(注)2
1
(注)2
1
1984年4月日東電工株式会社入社
2005年5月同社オプティカル事業部生産本部長
2009年7月同社オプティカル事業部事業部長
2010年6月同社執行役員オプティカル事業部門長
2013年6月同社上席執行役員
2014年8月同社上席執行役員CIO経営戦略統括部長兼IT統
括部長
2015年6月同社取締役常務執行役員自動車材料事業部門
長
2017年6月同社取締役専務執行役員
取締役
(注)1
梅原
俊志
1957年9月3日生
2018年4月同社取締役専務執行役員CTO、CIO全社技術部
門長
2019年6月同社代表取締役専務執行役員CTO全社技術部門
長
2020年7月国立大学法人北海道大学理事(非常勤)(現
任)
2020年8月慶應義塾大学特任教授
2021年6月当社社外取締役(現任)
2022年6月第一稀元素化学工業株式会社社外取締役(現
任)
2022年6月新明和工業株式会社社外取締役(現任)
2023年4月株式会社JCCL 代表取締役(現任)
1979年4月
味の素株式会社入社
1987年2月
農学博士号取得(東京大学旧応用微生物科学
研究所)
取締役
(注)1
辻
智子
1956年8月16日生
1988年3月
米国ロックフェラー大学博士研究員
1988年11月
米国ペンシルバニア州立大学博士研究員
1989年12月
財団法人相模中央化学研究所入所
1999年5月
株式会社ファンケル入社
2004年6月
同社執行役員中央研究所長
2007年6月
同社取締役執行役員総合研究所長
2008年5月
日本水産株式会社(現株式会社ニッスイ)顧
問
2009年4月
同社生活機能科学研究所長
2015年5月
株式会社吉野家ホールディングス執行役員
同社グループ商品本部素材開発部長
2020年6月
株式会社サンドラッグ社外取締役(現任)
2022年6月
当社社外取締役(現任)
2025年6月
株式会社吉野家ホールディングス R&Dエグゼ
クティブフェロー
2003年8月株式会社ミスミ(現株式会社ミスミグループ
本社)入社
2011年10月同社FA企業体複合加工品事業部事業部長
2013年10月同社FA加工品企業体企業体社長
2015年10月同社FA企業体企業体社長代表執行役員
取締役
(注)1
2020年10月同社ユーザーサービスプラットフォーム代表
執行役員
中川
理惠
1968年8月10日生
2022年1月同社サステナビリティプラットフォーム代表
執行役員
2022年12月同社退社
2022年12月一般社団法人グラミン日本理事・COO(現任)
2023年6月当社社外取締役(現任)
2024年6月株式会社ダスキン 社外取締役(現任)
2025年6月日本ライフライン株式会社社外取締役(現
任)
役職名
氏名
生年月日
略歴
任期
所有株式数
(千株)
(注)2
-
(注)2
0
(注)3
3
(注)3
-
(注)3
-
1993年4月伊藤忠商事株式会社入社
1998年3月同社退社
2003年2月伊藤忠商事株式会社入社
2008年4月日本ニュートリション株式会社出向
代表取締役社長
取締役
(注)1
立川
義大
1971年1月7日生
2020年4月伊藤忠商事株式会社飼料・穀物部長
2020年4月伊藤忠食糧株式会社取締役(現任)
2020年9月伊藤忠飼料株式会社取締役(現任)
2023年4月伊藤忠商事株式会社食糧部門長(現任)
2023年6月当社社外取締役(現任)
2025年4月伊藤忠商事株式会社執行役員(現任)
1982年4月 エヌ・テー・エヌ東洋ベアリング株式会社
(現NTN株式会社)入社
2007年4月同社経営企画本部経営企画部長
2007年10月同社経営企画本部副本部長兼経営企画部長
取締役
(注)1
十河
哲也
1959年12月3日生
2011年4月同社執行役員米州地区副総支配人
2014年4月同社常務執行役員米州地区総支配人
2018年4月同社常務執行役員財務本部長
2019年6月同社執行役財務本部長
2020年4月同社執行役CFO(最高財務責任者)
2025年6月当社社外取締役(現任)
1986年4月当社入社
2012年10月乳化・発酵食品部門統括室長
取締役
常勤監査等委員
戸川
雄介
1963年11月26日生
2018年4月旧不二製油株式会社(2025年4月当社に吸収合
併) 経営管理部長
2021年4月同社経営企画部門長
2024年6月当社取締役(常勤監査等委員)(現任)
1984年10月
司法試験合格
1987年4月
弁護士登録、大江橋法律事務所入所
1991年5月
バージニア大学ロースクール卒業
1991年9月
ニューヨーク市所在、Weil,Gotshal & Manges
法律事務所勤務
取締役
監査等委員
(注)1
池田
裕彦
1960年6月21日生
1992年6月
同州弁護士登録
1993年4月
大江橋法律事務所 パートナー(現任)
2010年4月
大阪大学法科大学院客員教授(現任)
2020年6月
当社監査役
2022年6月
当社社外取締役(監査等委員)(現任)
2023年6月
株式会社京都新聞ホールディングス
社外取締役(監査等委員)(現任)
1981年10月監査法人朝日会計社(現有限責任あずさ監査法
人)入社
1985年4月公認会計士登録
1986年4月公認会計士谷会計事務所代表(現任)
取締役
監査等委員
(注)1
谷
保廣
1956年10月11日生
2003年5月税理士登録
2004年9月北京中央財経大学院客員教授
2006年4月学校法人グロービス経営大学院教授(現任)
2020年6月 ロート製薬株式会社社外監査役(現任)
2021年3月株式会社ノーリツ 社外取締役(監査等委員)
2024年6月当社社外取締役(監査等委員)(現任)
2025年7月株式会社ノーリツ 筆頭社外取締役(監査等委
員)(現任)
計
(注)1.取締役
40
梅原俊志氏、辻智子氏、中川理惠氏、立川義大氏、十河哲也氏、池田裕彦氏及び谷保廣氏は、会社
法施行規則第2条第3項第5号に規定する社外役員に該当する社外取締役です。
2.2025年6月27日開催の定時株主総会の終結の時から1年間
3.2024年6月27日開催の定時株主総会の終結の時から2年間
4.2026年6月23日開催予定の第98回定時株主総会において、第2号議案「取締役(監査等委員である取締役を
除く。)8名選任の件」、第3号議案「監査等委員である取締役3名選任の件」が上程されております。上
記各議案が原案どおり承認可決された場合、取締役会は取締役11名(うち社外取締役7名、独立社外取締役
6名)で構成される予定であります。主な異動として、監査等委員である取締役の池田裕彦氏が任期満了
により退任し、新たに山口利昭氏が監査等委員である社外取締役(独立役員)として就任する予定です。な
お、取締役(監査等委員である取締役を除く。)8名については全員再任であり、取締役会全体の員数及び
独立社外取締役比率に変更はありません。
②
社外役員の状況
当社の社外取締役(監査等委員である取締役を除く)は5名(内、独立役員4名)、監査等委員である社外取締
役は2名(内、独立役員2名)です。
社外役員候補者の選定にあたっては、取締役会において期待される役割に応じた専門性と併せて、属性(独立
性)、在籍年数、ジェンダー、国際性等の多様性、経営環境の変化等を加味して、当社は継続的に取締役会の構成
について検討しております。各役員の専門性や経験及び期待される役割に照らしたスキルマトリクスは次の表のと
おりです。
<スキルマトリクス>
・取締役の多様性(独立社外役員比率54.5%、女性役員比率18.2%)
・特に専門性や経験の発揮が期待できる領域をあげています。
社外役員の独立性については、当社が上場している金融商品取引所の定める独立性の要件並びに当社が考える社
外役員の独立性判断基準に基づき独立役員候補者を選定しております。当社の考える独立性判断基準は次のとおり
です。なお、独立社外役員の在籍年数については、社外独立性保持の観点から、原則として取締役(監査等委員で
ある取締役を含む)は最長6年が妥当であると考えています。
<社外取締役の独立性判断基準>
当社は、以下の各要件の何れにも該当しないことを、社外取締役の独立性判断基準と定めています。
a.当社及び当社の子会社(以下総称して「当社グループ」という。)の取締役・監査役(社外役員除く)、執行
役員、使用人
b.当社グループの大株主(注)の取締役・監査役、執行役員、使用人
(注)就任時点における直近の株主名簿において上位10位以内の大株主(間接的に当社株式を保有する者を含
む)
c.当社グループを主要な取引先(注)とする者の取締役・監査役、執行役員、使用人
(注)取引先の直近事業年度における年間連結売上高の2%以上に相当する額の支払いを、当社グループから
受ける場合の取引先
d.当社グループの主要な取引先(注)の取締役・監査役、執行役員、使用人
(注)1.当社グループの直近事業年度における年間連結売上高の2%以上に相当する額の支払いを、当社に
対して行っている場合の取引先
2.直近事業年度末における当社グループの連結総資産の2%以上に相当する額の融資を、当社グルー
プに行っている場合の取引先
e.当社グループが取締役を派遣している会社の取締役・監査役、執行役員、使用人
f.当社グループから役員報酬以外に過去3年間の平均で年間1,000万円以上の金銭その他の財産上の利益を得て
いるコンサルタント、会計専門家または法律専門家
g.現在及び過去10年間に上記aに該当していた者
h.現在及び過去5年間において上記bからfの何れかに該当していた者
i.上記a~hに該当する者の配偶者、2親等内の親族、同居する親族
当社の社外役員選任基準は以下に記載のとおりです。
a.社外取締役(監査等委員である取締役を除く)の選任基準
(ⅰ) 社外取締役は取締役会議案審議に必要な豊富かつ幅広い知識と経験を有すること、もしくは経営の監督機能
発揮に必要な出身専門分野における実績と見識を有していることを選任基準とする。
(ⅱ) 広範な事業領域を有する当社として、個々の商取引において社外取締役又は社外取締役が所属する会社等と
利益相反等の問題が生じる可能性がありますが、個別案件での利益相反に対しては取締役会の運用・手続き
において適正に対処する。
(各社外取締役(監査等委員である取締役を除く)の選任理由)
社外取締役である梅原俊志氏を東京証券取引所の定めに基づく独立役員に指定しております。同氏と当社との
間には利害関係は無いことから、一般株主と利益相反の生じる恐れが無いものと判断しております。同氏はFPD
材料、自動車、メディカルその他の幅広い製品分野において多くのトップシェア製品を有する電子素材分野のメ
ーカーにて技術者、事業責任者として長年従事し、企業経営者として豊富な経験を有しているほか、技術分野、
情報分野について造詣が深く、当社の強みである技術経営及び強化領域である情報分野について高い見識を有し
ております。さらに、指名・報酬諮問委員会において、客観的・中立的立場から役員候補者の選定や役員報酬等
の決定過程を適切に監督するとともに、2023年度から2024年度までの2期にわたり委員長として同委員会の運営
を主導しました。このことから、同氏が社外取締役として職務を今後も適切に遂行することを期待し、選任しま
した。
社外取締役である辻智子氏を東京証券取引所の定めに基づく独立役員に指定しております。同氏と当社との間
には利害関係は無いことから、一般株主と利益相反の生じる恐れが無いものと判断しております。当社と同氏が
兼職している株式会社吉野家ホールディングスは、食品事業を展開しており両社の事業会社間において取引関係
がありますが、その取引金額は僅少(連結売上高の0.1%未満)です。同氏は国内大手食品メーカーに入社後、
農学博士号を取得し、米国の大学等で医薬シーズの研究に携わり、その後各社にて、食品の栄養・機能について
の研究と商品開発に長年にわたり従事するとともに国内大手健康食品メーカーで取締役を務めました。また、上
場会社において社外取締役を務められ、豊富な経験と高い見識を有しております。また、指名・報酬諮問委員会
の委員として客観的・中立的立場で当社の役員候補者の選定や役員報酬等の決定過程において、積極的な提言を
しております。このことから、同氏が社外取締役として職務を今後も適切に遂行することを期待し、選任しまし
た。
社外取締役である中川理惠氏を東京証券取引所の定めに基づく独立役員に指定しております。同氏と当社との
間には利害関係は無いことから、一般株主と利益相反の生じる恐れが無いものと判断しております。当社と同氏
が社外取締役を兼職している株式会社ダスキンは、食品事業を展開しており両社の事業会社間において取引関係
がありますが、その取引金額は僅少(連結売上高の0.2%未満)です。同氏は、機械・工業系EC企業においてFA
企業体、ユーザーサービスプラットフォーム、サステナビリティプラットフォームの要職を歴任し、代表執行役
員としてポートフォリオマネジメント、キャッシュマネジメント並びにサステナビリティについて豊富な経験を
有しております。2023年6月からは、当社指名・報酬諮問委員会の委員及びサステナビリティ委員会のアドバイ
ザーとして、客観的・中立的立場で当社の役員候補者の選定や役員報酬等の決定過程並びに当社が推進している
事業基盤の強化において適時適切な助言・提言により当社企業価値向上に寄与しております。このことから、同
氏が社外取締役として職務を今後も適切に遂行することを期待し、選任しました。
社外取締役である立川義大氏は、国内大手商社に入社し、1998年に同社を退社した後、外資系飼料素材メーカ
ーに勤務しました。2003年に国内大手商社に再入社し、その後機能性飼料製造販売会社に代表取締役社長として
出向し、その間に不二製油株式会社の酵素処理コプラミールの事業譲渡にも関わりました。2023年4月より同国
内大手商社の食糧部門長として、国内外の多数の事業責任者として活躍しています。また、原料調達、事業管理
等の分野において適時適切な助言・提言により当社企業価値向上に寄与しております。なお、当社と同氏が兼職
をしている伊藤忠商事株式会社は、当該会社及びグループ会社間において主に原材料や商品販売等の取引関係が
あります。また、伊藤忠商事株式会社及び同社の子会社である伊藤忠フードインベストメント合同会社は当社の
大株主であり、合わせて当社発行済株式の43.8%(自己株式控除後)を保有しております。上記理由により、同
氏を東京証券取引所の定めに基づく独立役員としての届出を行う予定はありません。
社外取締役である十河哲也氏を東京証券取引所の定めに基づく独立役員に指定しております。同氏と当社との
間には利害関係は無いことから、一般株主と利益相反の生じる恐れが無いものと判断しております。同氏は、国
内大手ベアリングメーカーで、経営企画・財務部門を中心に長年キャリアを積み、米国法人での勤務を含むグロ
ーバルな財務管理経験を有しています。また、ノースウエスタン大学ケロッグ経営大学院にてExecutive MBA を
取得し、米州地区総支配人、執行役CFO(最高財務責任者)を歴任、事業責任者及び財務統括責任者の双方の立
場において、組織の財務戦略の中核を担ってきました。これらの豊富な財務経験とグローバルな視点、そして経
営者としての見識が、事業管理基盤の強化、事業ポートフォリオ強化を進める上で大いに有益に働くことを期待
し、選任しました。
b.監査等委員である社外取締役の選任基準
(ⅰ) 監査等委員である社外取締役は監査・監督機能発揮に必要な出身分野における実績と見識を有し、取締役会
及び監査等委員会等への出席が可能である候補者から、監査等委員会の同意を得た上で選任する。
(ⅱ) 監査等委員である社外取締役選任の目的に適うよう、その独立性確保に留意し、中立かつ客観的な視点から
監査・監督を行うことにより、経営の健全性と透明性を確保する。
(監査等委員である各社外取締役の選任理由)
監査等委員である社外取締役の池田裕彦氏を東京証券取引所の定めに基づく独立役員に指定しており、かつ同
氏と当社との間には利害関係は無いことから、一般株主と利益相反の生じる恐れが無いものと判断しておりま
す。同氏は弁護士としての専門知識を有する企業法務の専門家であります。長年の弁護士経験を通じて、多くの
企業法務・M&A案件を取扱い、また米国での弁護士経験やアジア太平洋州の訴訟・監査制度研究等のグローバル
な法務経験を有しております。また、大学講師として若手の育成にも力を入れており、豊富な経験と高い見識を
有しております。企業法務に関する専門的な知見を活かし、独立した客観的な観点から取締役会及び監査等委員
会に出席し、経営を監視・監督することにより、客観・中立かつ公正な監査体制を維持できると考えておりま
す。
監査等委員である社外取締役の谷保廣氏を東京証券取引所の定めに基づく独立役員に指定しており、かつ同氏
と当社との間には利害関係は無いことから、一般株主と利益相反の生じる恐れが無いものと判断しております。
同氏は公認会計士及び税理士としての専門的知見に加え、米国テキサス大学にてMBAの取得、北京中央財経大学
院客員教授及び学校法人グロービス経営大学院教授としての経験からグローバルレベルの経営に関する高い見識
を有しております。財務・会計に関する専門的な知見を活かし、独立した客観的な観点から取締役会及び監査等
委員会に出席し、経営を監視・監督することにより、客観・中立かつ公正な監査体制を維持できると考えており
ます。
③ 社外取締役及び監査等委員である社外取締役による経営監督機能、監査等委員の会計監査人及び内部監査部門と
の連携による監査機能
企業経営に関し豊富な経験を持つ社外取締役と、高い専門性や見識をもつ弁護士、公認会計士で構成された監査
等委員である独立社外取締役が取締役会に出席し、助言・提言することにより、経営の健全性・透明性が確保さ
れ、かつ議決権の行使により、取締役会の適切な審議や取締役の職務執行の監督等に寄与することが期待されま
す。
また、監査等委員会では監査等委員の間で情報交換が行われるとともに、内部監査部門及び会計監査人との連絡
会等を開催し、意見交換や課題の共有を図る等の方法で相互連携を図ることによって、監査の実効性と効率性の向
上に努めてまいります。
(3)【監査の状況】
① 監査等委員監査の状況
a.組織・人員
監査等委員会の組織と人員は次のとおりです。
(ⅰ) 監査等委員の総員数:3名(常勤監査等委員1名、監査等委員(社外取締役)2名)
(ⅱ) 監査等委員会スタッフ
員数:2名
専任・兼任の別:兼任(兼任先:内部監査室)
専門性:当該スタッフは主に監査等委員の事務的な業務を補助する役割を担っております。今後、監査等委員
会としての活動拡充に伴い、監査の分野における専門性を発揮する役割を、この兼任の中で担う形も
検討したいと考えております。
(ⅲ) 財務及び会計に関する相当程度の知見を有する監査等委員
氏名:谷保廣
役職:監査等委員(社外取締役)
資格:公認会計士
経歴等:公認会計士として朝日会計社(現有限責任 あずさ監査法人)にて法定監査に従事したのち独立し、
谷会計事務所を設立。現在、所長として監査業務、税務業務、財務コンサルティング業務に携わる。
東証プライム市場上場製薬会社・社外監査役(現任)及び東証プライム市場上場住宅機器メーカー・
筆頭社外取締役監査等委員(現任)としての経験を有する他、日本公認会計士協会・理事、日本公認
会計士協会兵庫会・副会長、北京中央財経大学院・教授、財務会計基準機構・国際会計人材ネットワ
ーク登録メンバー等、財務会計の分野における重要ポストを歴任。2024年6月定時株主総会にて監査
等委員である取締役に選任されております。
b.当連結会計年度における監査等委員会設置会社としての監査等委員及び監査等委員会の活動状況
当連結会計年度におきましては、監査等委員3名(常勤監査等委員1名、監査等委員(社外取締役)2名)で
構成される監査等委員会を原則月1回開催し、取締役の職務執行の監査を行いました。監査等委員会の開催状況
及び個々の監査等委員の出席状況は以下のとおりです。
役
職
氏
名
開催回数
出席回数
出席率
常勤監査等委員
(取締役)
戸川
雄介
13回
13回
100%
監査等委員
(社外取締役)
池田
裕彦
13回
13回
100%
監査等委員
(社外取締役)
谷
保廣
13回
13回
100%
当連結会計年度における監査等委員会の具体的な検討内容及び報告事項は次のとおりです。
監査方針及び監査計画の策定、監査等委員及び補欠監査等委員選任議案に関する同意、
具体的な検討内容
監査報告書の作成、会計監査人の監査の相当性に関する意見形成、会計監査人の選任
(再任)に関する決定、会計監査人の監査報酬に関する同意等
監査活動(経営幹部に対するインタビューの内容、グループ各拠点への往査、会計監査
報告事項
人との意見交換の内容、指名・報酬諮問委員会での審議プロセスの状況、内部通報があ
った場合の通報内容と通報に対する会社の対応についてのモニタリング状況、その他取
締役の職務執行に関する重要事項等)
当連結会計年度における重点監査テーマ(に準ずるテーマ)及び監査活動の概要は以下の表に記載のとおりで
す。
2022年6月第94回定時株主総会決議に基づく監査等委員会設置会社への移行に伴い、内部監査部門との連携を
強化した組織監査を開始しておりますが、当連結会計年度もこうした方針に基づき内部監査部門とのいっそうの
連携を図りつつ、それぞれの役割と機能とに応じた監査活動を展開いたしました。取締役の職務執行及び取締役
の指名・報酬の決定プロセスのモニタリング等、監査等委員会としての本来の職務に加えて、「社外取締役等対
話会」「三様監査連絡会」といった活動を含む下記の監査活動を実施しました。
重点監査テーマ等
大株主と少数株主との間に生
じ得る利益相反による不利益
発生有無の確認
取締役会、ガバナンス実効性
向上に向けた取り組み
今年度計画、中期経営計画の
実行状況の確認
主要グループ会社(国内・海
外)、事業拠点における経営
管理状況の確認
会計監査人、内部監査部門と
の連携強化を図るための三様
監査の充実
監査等委員会としての実効性
評価の実施
会計監査人とのコミュニケー
ション
実施した主な監査活動
監査等委員による原料調達の実務を担う購買部門責任者へのインタビュー他
を実施、大株主との取引状況(原材料の購買状況他)について確認の上、当
該時点において利益相反による不利益が生じていないことを監査等委員会と
して確認。
社外取締役と監査等委員会による「社外取締役等対話会」を開催。「「稼ぐ
力」を強化する取締役会5原則」について外部専門家を招き聴講、執行取締
役を交えての意見交換等を実施。
モニタリング条件が整えられ実効性が確保された取締役会審議、グループ管
理体制(経営管理、リスク管理等)の強化、新規部門/会社の運営状況の確
認を実施。
監査等委員会としてグループ経営管理上、重要かつ優先的な監査が必要であ
ると判断する主要グループ会社、事業拠点の経営幹部へのヒアリング他によ
る実地監査を実施。代表的なものとしては、海外グループ会社拠点への訪問
(米国拠点)及びリモートインタビュー(米国、欧州拠点)等を実施。
三様間の連携強化、監査品質/レベルの向上に向けた情報/意見交換の場と
しての「三様監査連絡会」を開催。往査結果の共有と意見交換等を実施。
取締役会の実効性評価における監査等委員会の活動についての評価に加え、
別途、監査等委員会として実効性評価を実施。
評価にあたっては、16カテゴリー・57項目のチェック項目を設定し、それぞ
れの項目については5段階評価を実施。
定期、不定期開催の意見交換やディスカッションとして以下を実施。
①四半期毎の監査テーマに関する意見交換会
②会計監査人からの四半期決算毎の監査状況の報告会(監査上の主要な検討
事項に関する意見交換を含む)
③その他監査に関連する重要テーマについてのディスカッション
内部監査部門との連携による組織的監査体制構築に向けての取組みとして以
下を実施。
①年次監査計画の共同での策定、取締役会にて共同説明の実施
②内部監査部門長が月次開催の監査等委員会に陪席、内部監査部門の活動状
況を報告
③デュアル・レポーティングライン(注)による連携の強化
内部監査部門との連携
(注)デュアル・レポーティングライン
監査等委員会と内部監査部門が組織的な監査機能を発揮するために、内部監査部門がCEO等の経営者に加
えて、取締役会や監査等委員会に対して、適切に直接報告を行う仕組み
②
内部監査の状況
当社内部監査の状況は以下のとおりです。
a.組織
当社内部監査部門は、取締役会が直轄する組織として「内部監査室」を設置しております。従って、内部監査
の活動及び結果等については取締役会に報告しております。
b.員数:7名
c.活動
当社内部監査部門は、当社及び当社グループ会社を対象として、「内部監査規程」に基づき、業務の適正性を
監査するとともに、財務報告に係る内部統制を含めた内部統制システム・プロセスの整備、運用状況の監査を実
施しております。当連結会計年度、内部監査室は、海外個社、国内個社の業務監査の実施及び前年度実施しまし
た業務監査先のフォローアップ監査を実施いたしました。財務報告に係る内部統制の評価は、当社及び連結子会
社20社の計21社を対象として全社的な内部統制の評価を行い、連結子会社5社を対象として業務プロセスに係る
内部統制の評価を行いました。又、米国、欧州へ訪問し内部統制の整備・運用に関する支援を行いました。これ
ら内部監査の結果については、当社の取締役会及び経営会議のみならず、監査等委員会及び当社のグループ内部
統制機能を所轄する部署(各事業本部、コンプライアンス所管部門、経理部門、安全・品質・環境所管部門等)
へ報告するとともに、直接課題提起、改善提案を行うことで、内部統制システムの向上に努めております。ま
た、会計監査人有限責任 あずさ監査法人とは、主な内部監査結果及び改善の報告、監査等委員会とは連絡会を
随時実施、並びに、内部監査結果及び改善の報告を実施、等により相互連携を図りました。
③
会計監査の状況
a.監査法人の名称:有限責任 あずさ監査法人
b.継続監査期間:51年間
c.業務を執行した公認会計士
指定有限責任社員
業務執行社員
杉田
直樹(継続関与年数4年)
指定有限責任社員業務執行社員出口雅大(継続関与年数2年)
d.監査業務に係る補助者の構成
当社の会計監査業務に係る補助者は、公認会計士23名、その他61名です。
e.監査法人の選定方針と理由
監査法人の選定方針については、当社監査等委員会規則第8条に基づき、監査法人に関する情報を収集し選定
の妥当性を判断しております。具体的には、監査法人が担当している会社数や業界に関する情報、所属公認会計
士の数、会計監査についての監査法人内の審査体制、行政当局からの業務停止処分の有無等について検討を行う
とともに「監査に関する品質管理基準」(企業会計審議会公表)にもとづき監査体制が整備されていることを確
認の上で選定することを方針としております。
以上の方針に基づき、有限責任 あずさ監査法人を当社の会計監査人(監査法人)として再任することを監査
等委員会として決定いたしました。
f.監査等委員会による監査法人の評価
監査法人の監査の相当性を判断するにあたっては、監査法人からの直接の説明聴取、監査法人の監査状況の立
合のほか会計監査人と財務部門及び内部監査部門との連携等を勘案し、期末において当社監査等委員会で作成し
た「会計監査人監査の相当性判断のためのチェックシート」を活用し、監査等委員会にて会計監査人監査につい
て総合的な評価を実施の上、その相当性について検討及び審議した結果、当社会計監査人である有限責任 あず
さ監査法人の監査の方法と結果は相当であると判断いたしました。
④
監査報酬の内容等
a.監査公認会計士等に対する報酬
前連結会計年度
区分
当連結会計年度
監査証明業務に基づく
報酬(百万円)
非監査業務に基づく
報酬(百万円)
監査証明業務に基づく
報酬(百万円)
非監査業務に基づく
報酬(百万円)
提出会社
106
11
129
29
連結子会社
29
-
-
-
計
136
11
129
29
(前連結会計年度)
当社における監査証明業務に基づく報酬には、2026年3月期の国際財務報告基準(IFRS)の適用に備えた、
IFRS比較年度財務諸表に係る監査業務の報酬34百万円が含まれております。
当社における非監査業務の内容は、リファード業務及びコンフォートレター業務に対する対価です。
(当連結会計年度)
当社における非監査業務の内容は、リファード業務及びサステナビリティ対応支援業務等に対する対価です。
b.監査公認会計士等と同一のネットワーク(KPMG)に属する組織に対する報酬
前連結会計年度
区分
当連結会計年度
監査証明業務に基づく
報酬(百万円)
非監査業務に基づく
報酬(百万円)
監査証明業務に基づく
報酬(百万円)
非監査業務に基づく
報酬(百万円)
提出会社
-
-
-
-
連結子会社
63
14
88
53
計
63
14
88
53
(前連結会計年度)
連結子会社における非監査業務の内容は、主に税務アドバイザリー業務に対する対価です。
(当連結会計年度)
連結子会社における非監査業務の内容は、主に税務アドバイザリー業務に対する対価です。
c.その他の重要な監査証明業務に基づく報酬の内容
当社の連結子会社であるBlommer Chocolate Company, LLCは、Deloitte & Touche LLPに対して、監査証明業
務に基づく報酬を支払っております。
d.監査報酬の決定方法
会計監査人に対する報酬の額の決定に関する方針は、代表取締役が監査等委員会の同意を得て定める旨を定款
に定めております。
e.監査等委員会が会計監査人の報酬等に合意した理由
第98期会計監査人に関する監査報酬等について、当社監査等委員会規則第11条に基づき審議し、会計監査計画
の監査日数及び昨年の監査実績の検証と評価、会計監査人の監査の遂行状況の相当性、報酬の前提となる見積り
算出根拠を検討した結果、妥当性があると判断いたしました。以上の結果、会計監査人に関する監査報酬等の額
につき監査等委員会として同意いたしました。
(4)【役員の報酬等】
①
役員の報酬等の額又はその算定方法の決定に関する方針に係る事項
当社は、役員の報酬等の額又はその算定方法の決定に関する方針に係る事項を次のとおり定めております。
a.取締役(監査等委員である取締役を除く)の報酬等について
当社取締役(監査等委員である取締役を除く)の報酬制度は、取締役の報酬と当社の業績、及び株式価値との
連動性をより明確にし、取締役が株価の変動による利益・リスクを株主の皆様と共有することで、中長期的な業
績の向上と企業価値の増大に貢献する意識を高めることを目的とした業績連動型の報酬制度を導入しておりま
す。
<基本方針>
・株主をはじめステークホルダーと価値を共有する報酬体系とする
・中長期的な業績の向上と企業価値の増大に貢献する意識を高める報酬体系とする
提出日現在の事業年度における当社の役員の報酬等の額又はその算定方法の決定方法について、取締役の報酬
等は、株主総会で承認された総額の範囲内で、社外取締役を過半数とする「指名・報酬諮問委員会」への諮問・
答申を経て取締役会にて決定しております。「指名・報酬諮問委員会」では、取締役の報酬支給総額に関する事
項、報酬額算定方法に関する事項、業績連動の算定指標に関する事項等について審議し、取締役会に答申を行っ
ております。
<報酬構成>
取締役の役員報酬は、(ⅰ)基本報酬(固定報酬)、(ⅱ)業績連動型金銭報酬(賞与)、(ⅲ)業績連動型株式報
酬(株式交付信託)により構成することとしておりますが、社外取締役については、その役割と独立性の観点か
ら基本報酬(固定報酬)のみとしております。
なお、報酬の水準については外部専門機関による役員報酬調査データに基づき、当社と同じ業種、事業規模で
ある企業の水準を考慮し、「指名・報酬諮問委員会」において審議した上で、取締役会に答申を行っておりま
す。
(ⅰ) 基本報酬(固定報酬)は、役割に応じて定められた報酬額を月例報酬として支給するものとしております。
(ⅱ) 業績連動型金銭報酬(賞与)は、単年度会社業績として財務評価KPIである『親会社の所有者に帰属する当
期利益』、『連結事業利益』、『FUJI ROIC』(注)を、非財務評価KPIであるエンゲージメント調査の全社総
合スコアをKPIとして設定し、その達成度に応じて金銭報酬(賞与)が0%から200%の範囲で変動する設計
にしております。
(ⅲ) 業績連動型株式報酬(株式交付信託)は、中期経営計画における当期EPS(連結1株当たり当期利益)、及
びROE(自己資本利益率)をKPIとして設定し、その達成度に応じて株式報酬が0%から200%の範囲で変動
する設計にしております。また、取締役に対して株式が交付される時期は退任時であり、在任期間中の株価
変動により資産価値が変動する中長期的なインセンティブとなっております。
(注)FUJI ROIC=税引後事業利益 ÷(運転資本+固定資産+持分法投資)
各報酬の構成比率は、将来的に基本報酬:金銭報酬(賞与):株式報酬(株式交付信託)=1:1:1を指向
し、業績、企業価値の拡大とともに業績連動型報酬の比率を高めていく設計としております。
(2025年度業績連動型報酬:KPI実績)
KPI
項目
2025年度基準
2025年度実績
165億円
111.42億円
連結事業利益
295億円
360.48億円
FUJI ROIC
4.5%
5.1%
非財務
KPI
エンゲージメントスコア
(全社総合スコア)
70pt
69pt
財務KPI
EPS
(連結1株当たり当期利益)
191.92円
129.60円
連結ROE
5%超
5.0%
親会社の所有者に帰属する
金銭報酬
財務KPI
(賞与)
株式報酬
(株式交付信託)
当期利益
(注)連結ROEが5%以下のため、算出された業績連動係数に10%減を反映。
業績連動係数
0.77
0.33
(KPI選定理由)
KPI
金銭報酬
(賞与)
全社的な経営成果を表す税引後利益水準に対する結果責
当期利益
任の明確化
事業活動から得られる利益の追求を通じた収益力
連結事業利益
財務KPI
及び事業の健全性の向上、再投資原資の創出力強化
投資資本効率の向上を含めた中長期的な収益性改善の実
FUJI ROIC
非財務
エンゲージメントスコア
現
ESGマテリアリティに基づく全社一体化(DE&I)の推進に係
KPI
(全社総合スコア)
る成果の発現
財務KPI
(連結1株当たり当期利益)
EPS
株式報酬
(株式交
付信託)
選定理由
親会社の所有者に帰属する
基準報酬において掲げた目標に対する結果責任の明確化
連結ROE
b.監査等委員である取締役の報酬等について
監査等委員である取締役の報酬等は、その役割と独立性の観点から基本報酬のみで構成し、監査等委員会での
協議により、株主総会の決議による報酬総額の限度額内において決定しております。なお、監査等委員である取
締役の報酬水準は、外部専門機関の調査データを参考にしております。
②
役員区分ごとの報酬等の総額、報酬等の種類別の総額及び対象となる役員の員数
報酬等の種類別の総額(百万円)
役員区分
対象となる役
員の員数
(名)
報酬等の総額
(百万円)
業績連動型
基本報酬
(固定報酬)
金銭報酬
(賞与)
株式報酬
(株式交付信託)
取締役(監査等委員及び
社外取締役を除く)
4
114
52
20
187
監査等委員(社外取締役
を除く)
1
25
-
-
25
社外役員
8
70
-
-
70
合計
13
209
52
20
282
(注)1.上記員数には、2025年6月27日開催の第97回定時株主総会終結の時をもって退任した取締役2名を含ん
でおります。
2.上記取締役の報酬等の総額には、使用人兼務取締役の使用人分給与は含まれておりません。
3.取締役(監査等委員である取締役を除く)の報酬限度額は、2022年6月21日開催の第94回定時株主総会
において年額600百万円以内(うち社外取締役は年額100百万円以内)と決議いただいております。な
お、取締役(監査等委員である取締役及び社外取締役を除く)の報酬限度額には、取締役賞与を含むも
のとし、使用人分給与は含まないものとします。当該定時株主総会終結時点の取締役の員数は9名(う
ち社外取締役は5名)であります。
4.上記には当事業年度に係る業績連動型金銭報酬(賞与)を含んでおります。
5.非金銭報酬として取締役(監査等委員である取締役及び社外取締役を除く)に対して業績連動型株式報
酬(株式交付信託)を導入しております。業績連動型株式報酬(株式交付信託)の内容等は、2022年6
月21日開催の第94回定時株主総会において、取締役(監査等委員である取締役及び社外取締役を除く)
を対象に、当初3年間の信託期間(当該信託間は当社取締役会の決定により5事業年度以内の期間を都
度定めて延長できる)を定めたうえで、対象となる取締役に交付するために必要な当社株式の取得資金
として当社が拠出する金銭の上限を合計600百万円と決議いただいております。当該定時株主総会終結
時点の取締役(監査等委員である取締役及び社外取締役を除く)の員数は4名であります。
6.業績連動型株式報酬(株式交付信託)の金額は、2022年6月21日開催の第94回定時株主総会において決
議した株式報酬制度に基づき費用計上した額を記載しております。
7.監査等委員である取締役の報酬限度額は、2022年6月21日開催の第94回定時株主総会において年額100
百万円以内と決議いただいております。当該定時株主総会終結時点の監査等委員である取締役の員数は
3名であります。
③
2026年度における役員報酬制度
2026年度の役員業績連動報酬制度の対象となる取締役は3名となります。
(業績連動報酬)
変動報酬である業績連動型金銭報酬(賞与)及び業績連動型株式報酬(株式交付信託)の内容は以下のとおり
です。
a.業績連動型金銭報酬(賞与)
業績連動型金銭報酬(賞与)は、企業業績向上を軸にした業績指標として単年度の連結事業利益を採用し、連
結事業利益が決まれば自動的に基準報酬額が決定します。基準報酬額から個別支給額の算出においては、当該事
業年度の会社業績指標に対する達成度を加重平均して業績連動係数を算出します。算出時に用いる会社業績指標
は、財務評価KPIとして『親会社の所有者に帰属する当期利益』、『連結事業利益』、『FUJI ROIC』(注)を、非
財務評価KPIとしてエンゲージメント調査の全社総合スコアとします。尚、各KPIの評価ウェイトは『親会社の所
有者に帰属する当期利益』が50%、『連結事業利益』が20%、『FUJI ROIC』が20%、エンゲージメントスコア
が10%となります。
業績連動型金銭報酬(賞与)は、当該事業年度業績に基づいて報酬額を確定し、翌年度に支給いたしますの
で、2026年度業績に基づいて確定した報酬額を2027年度に支給いたします。
各取締役への個別支給額は、次の算定式により決定します。
(注)FUJI ROIC=税引後事業利益 ÷(運転資本+固定資産+持分法投資)
個別支給額=役位別基準報酬額(ⅰ)×業績連動係数(ⅱ)
(ⅰ) 役位別基準報酬額
2026年度の連結事業利益目標375億円に基づき、各KPI100%達成時の基準報酬額を以下といたします。
役員区分
基準報酬額(百万円)
対象となる役員の員数(名)
取締役社長
42
1
取締役
25.5
2
(ⅱ) 業績連動係数
<業績連動係数の計算方法>
※1:小数点第3位を切上げ
※2:賞与支給係数の下限は0、上限は2.0
KPI達成率=実績KPI÷基準KPI×100
実績KPI=当該事業年度における各KPI実績値
基準KPI=当該事業年度における各KPI基準値
<業績連動係数の変動イメージ>
(ⅲ) 対象期間中に取締役が新たに就任した場合の取扱い
対象期間中に新たに就任した取締役については、取締役への個別支給額を在任月数で按分して支給するものと
します。月の途中で新たに就任した場合には、1ヶ月在任したものとみなして計算します。
按分比率=対象期間中の在任合計月数÷対象期間の合計月数
(ⅳ) 対象期間中に取締役が退任(死亡を含む)した場合の取扱い
評価期間中に退任(死亡を含む)した取締役については、取締役の基準報酬額に80%を乗じた金額に対して、
在任月数で按分して支給するものとします。月の途中で退任した場合には、1ヶ月在任したものとみなして計算
します。なお、不正行為等による懲戒処分に基づく解任の場合は、支給割合は0%とします。
按分比率=対象期間中の在任合計月数÷対象期間の合計月数
(ⅴ) 対象期間中に役位の変更があった場合の取扱い
対象期間中において役員の役位の変更があった場合は、事業年度末(3月末)の役位に応じた個別支給額を支
給します。
b.業績連動型株式報酬(株式交付信託)
業績連動型株式報酬制度(以下「本制度」という。)は、取締役の報酬と当社の業績及び株式価値との連動性
をより明確にし、取締役が株価の変動による利益・リスクを株主の皆様と共有することで、中長期的な業績の向
上と企業価値の増大に貢献する意識を高めることを目的としております。また、事業年度毎の企業業績向上に対
する意識を高め、ステークホルダーとの一層の価値共有を行うため、KPIとして単年度のEPS(連結1株当たり当
期純利益)及び連結ROEを採用しております。
本制度は、当社が金銭を拠出することにより設定する信託(以下「本信託」という。)が当社株式を取得し、
当社が各取締役に付与するポイントの数に相当する数の当社株式が本信託を通じて各取締役に対して交付され
る、という株式報酬制度です。付与するポイントは、1ポイント=1株といたします。また、取締役が、付与さ
れたポイントに応じた当社株式の交付を受ける時期は、原則として取締役の退任時です。取締役に付与するポイ
ント数は、1事業年度の業績(連結EPS、連結ROE)によって決定いたしますが、退任時に取締役に付与するポイ
ント数が確定するのは、退任時における事業年度の業績連動指標確定日といたします。
なお、本信託の対象者に交付するために必要な当社株式の取得金額として当社が信託に拠出する金銭の上限
は、1事業年度あたり200百万円とします。また、本信託の対象者に付与されるポイントの総数は、1事業年度
あたり100,000ポイントを上限とし、各取締役への個別支給ポイントは、次の算定式により決定します。
個別支給ポイント=役位別基準報酬額(ⅰ)×業績連動係数(ⅱ)÷信託取得当社株価(ⅲ)
(小数点以下切り上げ)
(ⅰ) 役位別基準報酬額
2026年度においては、連結1株当たり当期利益業績目標値226.79円を基準KPIとして、基準KPI100%達成時の
基準報酬額を以下といたします。
役員区分
基準報酬額(百万円)
対象となる役員の員数(名)
取締役社長
33.8
1
取締役
20.6
2
(ⅱ) 業績連動係数
<業績連動係数の計算方法>
KPI達成率
業績連動係数
150%以上
2.0
50%超150%未満
(実績KPI÷基準KPI-0.5)×2.0
小数点第3位を切上げ
50%以下
0
KPI達成率=実績KPI÷基準KPI×100
実績KPI=当該事業年度における連結1株当たり当期利益実績値
基準KPI=当該事業年度における連結1株当たり当期利益基準値
連結ROEが5%以下の場合は算出された業績連動係数を10%減じて支給する株式報酬制度としております。
<業績連動係数の変動イメージ>
各取締役への個別支給ポイントの上限は、以下のとおりです。(1ポイント=1株)
取締役社長 25.0千ポイント
取締役
12.5千ポイント
(ⅲ) 信託取得当社株価
本信託に組入れる株式は、取得方法・組入れ株式数・組入れ株価を取締役会で決議を行い、同日社外開示する
ものといたします。株式の取得方法については、保有自己株式の処分及び取引所市場(立会外取引を含む)から
の取得する方法の2通りがありますが、株価については、以下の条件で信託に組み入れいたします。
保有自己株式を処分する場合
本制度にかかる第三者割当(株式交付信託への組み入れ)を決議する当社取
締役会開催の前営業日の東京証券取引所における当社株式終値の価格といた
取引所市場から取得する場合
します。
本制度にかかる株式取得についての当社取締役会決議後に取引所市場から買
い付ける当社株式の価格といたします。
なお、取締役への個別支給ポイントを算出する場合の株価は、本信託がポイントを付与する時点で保有する平
均保有株価で算出いたします。
(ⅳ) 対象期間中に取締役が新たに就任した場合の取扱い
対象期間中に新たに就任した取締役については、取締役への個別支給ポイントを在任月数で按分して支給する
ものとします。月の途中で新たに就任した場合には、1ヶ月在任したものとみなして計算します。
按分比率=対象期間中の在任合計月数÷対象期間の合計月数
(ⅴ) 対象期間中に取締役が退任(死亡を含む)した場合の取扱い
評価期間中に退任(死亡を含む)した取締役については、取締役の基準報酬額に80%を乗じた金額に基づいて
付与されるポイント数に対して、在任月数で按分して支給するものとします。月の途中で退任した場合には、1
ヶ月在任したものとみなして計算します。なお、不正行為等による懲戒処分に基づく解任の場合は、支給割合は
0%とします。
按分比率=対象期間中の在任合計月数÷対象期間の合計月数
(ⅵ) 対象期間中に役位の変更があった場合の取扱い
対象期間中において役員の役位の変更があった場合は、事業年度末(3月末)の取締役への役位に応じた個別
支給ポイントを支給します。
(ⅶ) 換価処分の取り扱い
非居住者である対象取締役が退任する場合及び対象取締役が死亡により退任した場合、当社株式の交付に代え
て、当該対象者に交付すべき数の株式の時価相当額の金銭を当該対象者に対して支給します。
c.報酬構成
2026年度基準KPIにおいて、その業績連動係数がいずれも1.0の場合における比率は以下のとおりとなります。
役員区分
基本報酬
(固定報酬)
業績連動型金銭報酬業績連動型株式報酬
(賞与)
(株式交付信託)
取締役社長
42%
32%
26%
取締役
42%
32%
26%
(5)【株式の保有状況】
①
投資株式の区分の基準及び考え方
当社は、保有目的に従って、保有する投資株式を純投資目的とそれ以外に区分しております。純投資目的とは、
専ら株式の価値変動又は株式に係る配当を受けることを目的とした投資株式です。
なお、当社は純投資目的の投資株式を保有しておりません。
② 保有目的が純投資目的以外の目的である投資株式
a.保有方針及び保有の合理性を検証する方法並びに個別銘柄の保有の適否に関する取締役会等における検証の内
容
当社は、「不二製油株式会社コーポレートガバナンス・ガイドライン」に則り、政策保有株式について、保有
の合理性を検証しております。保有目的に合理性が認められる場合であっても、資産効率の向上及び株式の価値
変動によるリスクを回避する目的で、政策保有株式の売却を進めております。取締役会における保有目的の合理
性の検証については年2回実施しており、政策保有株式の保有に伴う便益が、資本コストに見合ったものになっ
ているか等を検証し、当社の中長期的な企業価値の向上に資するものか保有の適否を判断しております。
なお、個別の政策保有株式の議決権行使については、当社の保有方針に適合していること及び発行会社の企業
価値の向上に資するものであることを総合的に勘案して実施しております。
b.投資株式のうち保有目的が純投資目的以外の目的であるものの銘柄数及び貸借対照表計上額の合計額
銘柄数
(銘柄)
貸借対照表計上額の
合計額(百万円)
非上場株式
13
488
非上場株式以外の株式
10
3,185
(当事業年度において株式数が増加した銘柄)
銘柄数
(銘柄)
株式数の増加に係る取得
価額の合計額(百万円)
非上場株式
-
-
-
非上場株式以外の株式
2
3
持株会による定期購買
株式数の増加の理由
(当事業年度において株式数が減少した銘柄)
銘柄数
(銘柄)
株式数の減少に係る売却
価額の合計額(百万円)
非上場株式
-
-
非上場株式以外の株式
3
344
(注)株式数が増加及び減少した銘柄には、株式の併合、株式の分割、株式移転、株式交換、合併等による変動を
含んでおりません。
(銘柄数及び貸借対照表計上額の合計額の推移)
(注)上記は、非上場株式と非上場株式以外の株式の合算値です。
c.保有目的が純投資目的以外の目的である投資株式の保有区分、銘柄、株式数、貸借対照表計上額及び保有目的
特定投資株式
銘柄
当事業年度
前事業年度
株式数(千株)
株式数(千株)
貸借対照表計上額
(百万円)
貸借対照表計上額
(百万円)
119
119
保有目的、業務提携等の概要、
定量的な保有効果
及び株式数が増加した理由
当社の
株式の保有
の有無
安定的な営業関係取引の維持・強化及び相
東洋水産㈱
1,315
1,051
互の取組による将来的な企業価値向上が保
有の目的です。保有効果については、取引
状況等を含めた総合的な判断により評価し
有
ています。
安定的な営業関係取引の維持・強化及び相
300
300
互の取組による将来的な企業価値向上が保
598
有の目的です。保有効果については、取引
状況等を含めた総合的な判断により評価し
㈱meito
893
有
ています。
安定的な営業関係取引の維持・強化及び相
100
100
互の取組による将来的な企業価値向上が保
287
241
有の目的です。保有効果については、取引
状況等を含めた総合的な判断により評価し
ています。
556
-
理研ビタミン㈱
有
主にPlant Based Food製品の販売拡大を目
㈱cotta
283
-
的とした資本業務提携に関する基本契約に
基づき保有しております。当事業年度にお
ける当社と連結子会社の吸収合併に伴い、
当社が株式を保有することになりました
が、連結ベースの保有株式数に変動はあり
無
ません。
80
80
161
162
17
17
㈱J-オイルミルズ
江崎グリコ㈱
102
78
28
28
㈱サトー商会
66
25
59
50
尾家産業㈱
63
99
主に植物性油脂事業における調達や物流の
効率化等を目的とした業務提携及び株式相
互保有に関する基本契約に基づき保有して
おります。
安定的な営業関係取引の維持・強化及び相
互の取組による将来的な企業価値向上が保
有の目的です。保有効果については、取引
状況等を含めた総合的な判断により評価し
有
無
ています。また、同社の取引先持株会に加
入していることから、保有株式数が増加し
ております。
安定的な営業関係取引の維持・強化及び相
互の取組による将来的な企業価値向上が保
有の目的です。保有効果については、取引
状況等を含めた総合的な判断により評価し
ています。
無
安定的な営業関係取引の維持・強化及び相
互の取組による将来的な企業価値向上が保
有の目的です。保有効果については、取引
状況等を含めた総合的な判断により評価し
ています。なお、総合的な判断に基づき、
当事業年度一部株式を売却しております。
有
銘柄
当事業年度
前事業年度
株式数(千株)
株式数(千株)
貸借対照表計上額
(百万円)
貸借対照表計上額
(百万円)
4
4
丸大食品㈱
10
7
0
0
㈱ブルボン
2
0
保有目的、業務提携等の概要、
定量的な保有効果
及び株式数が増加した理由
当社の
株式の保有
の有無
安定的な営業関係取引の維持・強化及び相
互の取組による将来的な企業価値向上が保
有の目的です。保有効果については、取引
状況等を含めた総合的な判断により評価し
ています。
無
安定的な営業関係取引の維持・強化及び相
互の取組による将来的な企業価値向上が保
有の目的です。保有効果については、取引
状況等を含めた総合的な判断により評価し
ています。また、同社の取引先持株会に加
入していることから、保有株式数が増加し
無
ております。
-
51
安定的な営業関係取引の維持・強化及び相
互の取り組みによる将来的な企業価値向上
210
が保有の目的です。なお、総合的な判断に
基づき、当事業年度に全株式を売却してお
正栄食品工業㈱
-
無
ります。
-
20
亀田製菓㈱
-
81
安定的な営業関係取引の維持・強化及び相
互の取り組みによる将来的な企業価値向上
が保有の目的です。なお、総合的な判断に
基づき、当事業年度に全株式を売却してお
無
ります。
(注)保有の合理性を検証した方法
当社の取締役会において、主要な政策保有株式について保有目的が適切か、保有に伴う便益やリスクが資本コス
トに見合っているか等を具体的に精査し、保有の適否を毎期検証しております。
5【従業員の状況等】
(1)【人材戦略に関する基本方針等】
①
不二製油グループ人材戦略
当社グループは、積極的な海外展開の結果、2026年3月31日現在、連結従業員の約7割を海外拠点で働く従業員
が占めています。16か国45社に展開し、多様な人材が活躍するグローバル体制を構築しています。
当社グループは、2015年度に純粋持株会社制に移行して以降、加速するグローバル展開に対応するため、人材戦
略として、各国・各社で多様な人材が活躍できる環境整備、DE&Iの推進、グループ会社マネジメント層の現地化等
を重視してきました。
一方で、グループ会社の拡大に伴い遠心力が高まり、各エリアでの最適化を重視した運営が進む中で、エリア制
では対処しきれないサプライチェーン全体に及ぶ課題が顕在化し、事業軸でのグループ対応力強化の必要性が高ま
りました。加えて、従来本社機能を有していた日本事業会社とグループ本社との間でも、コミュニケーションや役
割連携の強化が必要となりました。
そのような中、2025年4月に事業持株会社制へ移行し、グループ本社と日本事業会社を統合いたしました。新体
制においては、統合会社の融和はもちろん、海外を含むグループ全社の一体化を重要な経営方針として掲げていま
す。これを踏まえ、人材戦略についても、従来の各社・各エリアでの最適化を重視した運営から、グループ共通の
基盤強化とグループ横断的な連携を重視する運営へと転換しました。
新人材戦略においては、“Hataraki-Gai(働きがい)”をグループ共通の概念として定め、これを高めることを
グループ共通のゴールとしました。そして、全社一体化の旗頭として、グループ横断でHataraki-Gaiの向上に取り
組むことを人材重点方針に掲げています。多様な人材一人ひとりが強みを発揮できる環境と、自身を成長させるこ
とができる“おもろい”仕事によって、当社グループで働くことの価値を高めるべく、人材育成及び社内環境整備
を一体で推進しています。
また、国ごとに食文化や価値観が大きく異なる中で課題解決型ビジネスを展開する当社グループにおいて、多様
な国・地域に「食を愛し、協働と挑戦を楽しみ、人のために働く」人材がいることは強みです。この多様性を「組
織の力」へ転換することは、引き続き重要な経営課題の一つです。加えて、4つの事業を営む製造業として、企業
成長に必要な能力・職種は多岐にわたる一方、世界的な人材流動性や製造業への就業志向の変化等を背景に、人材
確保の重要性も高まっています。これらの強みと課題を踏まえ、Hataraki-Gai向上により、共創によるイノベーシ
ョンを創出し、グループと従業員の持続的な成長と笑顔の連鎖を生み出すことで、サステナブルな食の未来の共創
を実現していきます。
②
中期経営計画「United for Growth 2027」人材重点方針
中期経営計画期間における人材戦略は、次の3つの重点方針を柱として推進します。
イ.グループ全社のHataraki-Gai向上による一体化:
海外グループ会社横断の推進体制(Engagement Champions Team)の下、サーベイ結果を起点とした改善アク
ションの実効性を高め、全社一体化を促進します。
ロ.経営人材の育成と多様性の確保:
新体制における経営上の重要ポジションを明確化し、サクセションに取り組んでいます。指名・報酬諮問委員
会においてCEOサクセションを実行するとともに、CxOをメンバーとする人材育成会議において第2期次世代経営
層育成プログラムを実行しています。また、人材育成会議は進捗を適宜、指名・報酬諮問委員会へ報告し、助言
を受けながらサクセションプランとの整合を図っています。
ハ.事業戦略と連動した人材育成・最適人材配置:
高度専門性を持つグローバル人材等、事業戦略上のキーパーソンの国内外最適配置と、配置を見据えた計画的
育成を進めるとともに、将来の人材需給変化も踏まえた人材確保・育成に取り組みます。特に国内では生産年齢
人口の減少等を背景に、交替勤務者の確保が一層困難となることが想定されます。このため、人事部門・各生産
部門・労働組合代表等によるプロジェクト体制で、生産職におけるHataraki-Gai向上に向けた職務設計やキャリ
ア形成の在り方について検討を進めています。
これらの取り組みは、ESGマテリアリティの「DE&Iの推進」「人材の確保と育成」に関連する取組みとして位
置づけており、サステナビリティ委員会における審議・報告等を通じて、取締役会が適宜モニタリングしていま
す。ESGマテリアリティ及び関連する開示は、「第2 事業の状況 2 サステナビリティに関する考え方及び
取組」をご参照ください。
また、上記方針を支える基盤として、DE&Iの推進、従業員の心身の健康と安全・安心な就業環境の確保に努め
ています。中計重点方針に関する取組みの詳細、また、DE&Iの推進・健康経営に関する取組み、外部評価等の詳
細は、当社ウェブサイト及び今秋発行予定の統合報告書・サステナビリティレポートでご紹介しています。当社
ウェブサイトは以下のURLよりご参照ください。
https://www.fujioil.co.jp/about/health/
https://www.fujioil.co.jp/sustainability/humancapital/
③
不二製油株式会社における従業員給与等の決定方針
当社は、価値創造や生産性向上によって生み出された収益・成果をマルチステークホルダーへ適切に分配するこ
とが、経済の持続的発展及び持続的な企業価値向上につながると考え、「マルチステークホルダー方針」を制定し
ています。その中で、従業員に関しては、経済情勢や社会動向、生活賃金の観点並びに当社の経営環境を踏まえ、
公正な処遇を前提に、役割・能力の発揮及び成果に応じた適正な配分としての賃金の引上げを行う方針としていま
す。
基本給については、年齢等の属人的要素によらず、役割・成果との連動性を高めた報酬制度への転換を進めてき
ました。制度改定時には労使協議を行い、市場競争力を意識した報酬水準を設定しています。
2025年度は、物価動向等を踏まえ、すべての従業員に対してベースアップを実施しました。賞与月数の増加等も含
めた平均年間給与は前事業年度比6.8%の増加となりました。
(注)「マルチステークホルダー方針」は以下のURLよりご参照ください。
https://www.fujioil.co.jp/sustainability/policy/multistakeholder/
(2)【従業員の状況】
①
連結会社の状況
2026年3月31日現在
セグメントの名称
従業員数(名)
植物性油脂
1,036
(90)
業務用チョコレート
2,720
(186)
乳化・発酵素材
1,205
(75)
大豆加工素材
469
(36)
全社(共通)
461
(109)
5,891
(496)
合計
(注)従業員数は就業人員数であり、当社から外部への出向者を除き、外部から当社への出向受入者を含みます。臨時
雇用者数は、( )内に年間の平均人員を外数で記載しております。当事業年度より、雇用契約の実態に基づき
従業員区分の見直しを行い、再雇用嘱託社員等の一部を従業員数から臨時雇用者数へ、地域限定社員を従業員数
に区分しました。これらは雇用実態に基づく整理であり、就業実態に大きな変更はありません。
②
提出会社の状況
2026年3月31日現在
従業員数(名)
1,550
(212)
平均年齢
平均勤続年数(年)
平均年間給与(円)
平均年間給与の
対前事業年度増減率
(%)
41歳7ヶ月
16
8,332,205
6.8
(注)他社からの出向受入社員は従業員数に含めますが、平均年齢、平均勤続年数及び平均年間給与の算定対象には含
めていません。平均年間給与は賞与及び基準外賃金を含みます。
セグメントの名称
従業員数(名)
植物性油脂
244
(21)
業務用チョコレート
278
(26)
乳化・発酵素材
326
(27)
大豆加工素材
311
(34)
全社(共通)
391
(104)
1,550
(212)
合計
(注)1.従業員数は就業人員であり、臨時雇用者数は( )内に年間の平均人員を外数で記載しております。
2.平均年間給与は、賞与及び基準外賃金を含んでおります。
③
人的資本に関する指標及び目標
当社グループは、人材戦略の実行状況を定量的に把握し、改善につなげるため、Hataraki-Gaiをグループ共通の
中核概念として位置づけ、エンゲージメントサーベイ等の指標を用いてモニタリングしています。過年度のサーベ
イ分析の結果、ミッション・ビジョンへの共感や経営方針・事業戦略への理解、納得感といった「理念戦略」の項
目が相対的に低位であった点も踏まえ、役員報酬の非財務KPIに不二製油株式会社の総合スコアを設定し、経営層
のリーダーシップのもと、Hataraki-Gai向上を推進しています。
当該総合スコアは、2025年度1~2月実施の調査において69まで改善しました。特に、課題であった「理念戦
略」の関連項目は全項目が向上し、最大8ポイント改善しており、新体制の下での方針浸透・コミュニケーション
強化等の効果がみられます。例えば、2025年度は取締役が主要な国内事業所においてタウンホールミーティングを
実施し、従業員との質疑応答を通じた方針対話を行いました。なお、サーベイは、スコアのみならず、独自の匿名
のフリーコメントを設定し、テキスト分析等の定性情報も参照しながら、組織別・構成要素別の要因分析を行い、
改善の優先順位付けに活用しています。今後も更なる向上を目指し、引き続きエンゲージメント向上施策を推進し
てまいります。
役員報酬の詳細は、「第4
提出会社の状況
4
コーポレート・ガバナンスの状況等(4)役員の報酬等」に
記載のとおりです。
実績
指標名
2023年度
2024年度
2025年度
66
68
69
エンゲージメントサーベイスコア
補足説明
全社総合スコアを採用
(注)1.エンゲージメントサーベイは「Wevox」(従業員エンゲージメント測定・支援ツール)を使用しています
2.対象:提出会社、頻度:年2回。実績は1-2月実施の調査結果を記載しています。
3.海外グループ会社を対象とするグローバルエンゲージメントサーベイについては、比較可能性を担保する
観点から、2027年度の指標化に向けて対象範囲の整合を進めています。
また、経営人材育成においては、人材育成会議において、新体制で経営が横串でモニタリング・育成すべきKey
ポジションを特定し、サクセションプログラム(後任候補の育成)を実施しており、その進捗度を経営Keyポジシ
ョンにおける準備率や多様性指標によってモニタリングするしくみとすべく準備を行っています。指標は、サステ
ナビリティ委員会や指名・報酬諮問委員会により適切にモニタリングされる予定です。
④
人的資本の多様性に関する指標
当社では、Equityの観点で、将来的に意思決定層における女性の登用を着実に進めていくことを重要な経営課題の
一つと位置付けています。不二製油株式会社における管理職に占める女性労働者の割合は近年上昇傾向にある一方、
男女賃金差異は、手当等の受給構造差と管理職比率の差が主因であり、制度整備と登用の両面で是正に取り組みま
す。
イ.提出会社
当事業年度
管理職に占
める女性労
働者の割合
(%)
(注1)
男性労働者
の育児休業
取得率
(%)
(注2)
男性労働者
の一人あた
りの育児休
業の平均取
得日数
(日)
(注3)
16.3
89.5
33.3
労働者の男女の賃金の差異(%)
(注1)
補足説明
全労働者
正規雇用労
働者
パート・有
期労働者
75.3
76.1
57.9
-
ロ.連結子会社
当事業年度
名称
株式会社フジサニ
ーフーズ
管理職に占
める女性労
働者の割合
(%)
(注1)
男性労働者
の育児休業
取得率
(%)
(注2)
男性労働者
の一人あた
りの育児休
業の平均取
得日数
(日)
(注3)
16.0
0.0
0.0
労働者の男女の賃金の差異(%)
(注1)
全労働者
正規雇用労
働者
パート・有
期労働者
66.2
74.9
48.1
補足説明
-
(注)1.
「女性の職業生活における活躍の推進に関する法律」
(平成27年法律第64号)の規定に基づき算出しておりま
す。
2.
「育児休業、介護休業等育児又は家族介護を行う労働者の福祉に関する法律」
(平成3年法律第76号)の規定
に基づき、
「育児休業、介護休業等育児又は家族介護を行う労働者の福祉に関する法律施行規則」
(平成3年
労働省令第25号)第71条の6第1号における育児休業等の取得割合を算出したものです。
3.男性育児休業等に関わる一人あたりの取得日数は延べ日数です。
(労働者の男女の賃金の差異の要因と今後の対応)
従業員の基本給において、組合員・管理職ともに各等級の設定に男女差はありません。性別に関係なく、能力と
実績に応じた公正な評価と制度に基づく賃金の決定を行っております。
一方で、基本給以外の諸手当(役付手当・子ども手当・住宅手当)や、時間外・休日出勤等の手当(深夜業手
当・交替勤務手当含む)において男女差がみられました。その要因の一つとして、女性に比べて男性が世帯主とし
て住宅手当を受け、子を扶養するケースが多くみられます。また、交替勤務を行う従業員に男性が多いことも要因
の一つと考えております。
また、管理職に占める女性労働者の比率が男性労働者よりも低いことも男女の賃金差異の要因の一つと認識して
おります。これまでに、ライフイベントに応じた働き方の支援として、在宅勤務・フレックス勤務の導入、育児休
業取得の制度を拡充してまいりましたが、更なるポジティブアクションの必要性を認識しています。まずは、前提
となる「管理職として継続的に活躍できる環境」
「意思決定層への挑戦意欲を阻害しない企業風土」の整備を目的
とし、2026年4月に策定した女性活躍推進法に基づく一般事業主行動計画において、管理職層の働き方改革及び仕
事と介護の両立を含む多様なライフステージへの対応力強化に重点的に取り組みます。
⑤
労働組合の状況
労働組合との間に特記すべき事項はありません。
第5【経理の状況】
1.連結財務諸表及び財務諸表の作成方法について
(1)当社の連結財務諸表は、「連結財務諸表の用語、様式及び作成方法に関する規則」(昭和51年大蔵省令第28号。
以下「連結財務諸表規則」という。)第312条の規定により、国際財務報告基準(以下「IFRS」という。)に基づ
いて作成しております。
(2)当社の財務諸表は、「財務諸表等の用語、様式及び作成方法に関する規則」(昭和38年大蔵省令第59号。以下
「財務諸表等規則」という。)に基づいて作成しております。
また、当社は、特例財務諸表提出会社に該当し、財務諸表等規則第127条の規定により財務諸表を作成しており
ます。
2.監査証明について
当社は、金融商品取引法第193条の2第1項の規定に基づき、連結会計年度(2025年4月1日から2026年3月31日
まで)の連結財務諸表並びに事業年度(2025年4月1日から2026年3月31日まで)の財務諸表について、有限責任
あずさ監査法人による監査を受けております。
3.連結財務諸表等の適正性を確保するための特段の取組み及びIFRSに基づいて連結財務諸表等を適正
に作成することができる体制の整備について
当社は、連結財務諸表等の適正性を確保するための特段の取組み及びIFRSに基づいて連結財務諸表等を適正に作成
することができる体制の整備を行っております。その内容は、以下のとおりです。
(1)会計基準等の内容を適切に把握し、その変更等について的確に対応できる体制を整備するため、公益財団法人
財務会計基準機構へ加入し、同機構や監査法人等が主催するセミナー等に参加しております。
(2)IFRSの適用については、国際会計基準審議会が公表するプレスリリースや基準書を随時入手し、最新の基準の
把握を行っております。また、IFRSに基づく適正な連結財務諸表を作成するために、IFRSに準拠したグループ会
計方針書を作成し、これに基づいて会計処理を行っております。
1【連結財務諸表等】
(1)【連結財務諸表】
①【連結財政状態計算書】
(単位:百万円)
注記
移行日
(2024年4月1日)
前連結会計年度末
(2025年3月31日)
当連結会計年度末
(2026年3月31日)
資産
流動資産
現金及び現金同等物
6
28,499
70,840
46,811
営業債権
7
92,399
112,298
115,202
棚卸資産
8
109,349
160,718
182,031
その他の金融資産
16
2,888
1,304
2,736
その他の流動資産
17
13,427
10,197
12,270
売却目的で保有する資産
38
-
8,637
-
246,565
363,997
359,051
流動資産合計
非流動資産
有形固定資産
9
141,344
138,081
165,950
使用権資産
13
10,048
9,257
13,200
無形資産
10
33,605
32,572
41,317
のれん
10
21,907
20,763
26,632
持分法で会計処理されている投資
15
11,134
13,426
16,102
退職給付に係る資産
24
39
39
-
繰延税金資産
18
2,496
10,218
5,398
その他の金融資産
16
9,426
8,400
8,790
その他の非流動資産
17
624
319
488
230,628
233,079
277,881
477,193
597,076
636,933
非流動資産合計
資産合計
(単位:百万円)
注記
移行日
(2024年4月1日)
前連結会計年度末
(2025年3月31日)
当連結会計年度末
(2026年3月31日)
営業債務
19
41,013
46,538
68,082
借入金
20
64,373
195,284
158,541
1年内償還予定の社債
20
34,989
-
-
リース負債
13
2,410
2,062
2,615
未払法人所得税
18
4,316
7,566
4,712
その他の金融負債
21
6,148
10,093
8,140
その他の流動負債
22
15,589
14,063
15,231
売却目的で保有する資産に直接関連する
負債
38
-
259
-
168,842
275,867
257,324
負債
流動負債
流動負債合計
非流動負債
社債
20
5,978
30,811
30,859
長期借入金
20
43,496
57,625
78,980
リース負債
13
7,168
6,668
10,101
繰延税金負債
18
14,627
10,777
10,870
退職給付に係る負債
24
1,985
1,784
1,678
その他の非流動負債
22
2,526
2,613
2,640
75,781
110,282
135,131
244,624
386,150
392,455
非流動負債合計
負債合計
資本
資本金
26
13,208
13,208
13,208
資本剰余金
26
15,323
8,443
8,715
利益剰余金
26
151,046
150,944
157,829
自己株式
26
△1,947
△1,919
△2,154
その他の資本の構成要素
26
42,846
36,245
62,560
220,477
206,923
240,159
12,091
4,003
4,318
232,569
210,926
244,477
477,193
597,076
636,933
親会社の所有者に帰属する持分合計
非支配持分
14,39
資本合計
負債及び資本合計
②【連結損益計算書及び連結包括利益計算書】
【連結損益計算書】
(単位:百万円)
注記
前連結会計年度
(自 2024年4月1日
至 2025年3月31日)
当連結会計年度
(自 2025年4月1日
至 2026年3月31日)
売上高
5,28
671,207
772,288
売上原価
8,29
589,572
661,343
81,635
110,944
29,30
71,473
77,611
その他収益
31
2,008
1,957
その他費用
32
662
5,468
営業利益
5
11,508
29,822
金融収益
33
1,280
1,550
金融費用
33
7,579
8,182
持分法による投資損益
15
1,690
239
6,900
23,430
1,512
11,919
5,387
11,510
親会社の所有者
3,863
11,142
非支配持分
1,523
367
44.94
129.60
-
-
売上総利益
販売費及び一般管理費
税引前当期利益
法人所得税費用
18
当期利益
当期利益の帰属
1株当たり当期利益
34
基本的1株当たり当期利益(円)
希薄化後1株当たり当期利益(円)
【連結包括利益計算書】
(単位:百万円)
注記
前連結会計年度
(自 2024年4月1日
至 2025年3月31日)
当期利益
当連結会計年度
(自 2025年4月1日
至 2026年3月31日)
5,387
11,510
その他の包括利益(税効果控除後)
純損益に振り替えられることのない項目
その他の包括利益を通じて測定する金融資
産の公正価値の純変動
26
145
667
確定給付制度の再測定
26
118
49
持分法適用会社におけるその他の包括利益
に対する持分
26
△0
△1
263
716
純損益に振り替えられることのない項目合計
純損益に振り替えられる可能性のある項目
キャッシュ・フロー・ヘッジ
26
6
1,646
在外営業活動体の換算差額
26
△6,372
23,720
465
955
純損益に振り替えられる可能性のある項目合
計
△5,899
26,323
その他の包括利益(税効果控除後)合計
△5,636
27,039
△248
38,549
△1,543
38,010
1,294
539
持分法適用会社におけるその他の包括利益
に対する持分
15,26
当期包括利益
当期包括利益の帰属
親会社の所有者
非支配持分
③【連結持分変動計算書】
前連結会計年度(自 2024年4月1日
至
2025年3月31日)
(単位:百万円)
注記
2024年4月1日残高
当期利益
その他の包括利益
26
当期包括利益
自己株式
その他の
資本の
構成要素
親会社の
所有者に
帰属する
持分合計
非支配
持分
資本合計
151,046
△1,947
42,846
220,477
12,091
232,569
-
3,863
-
-
3,863
1,523
5,387
-
-
-
-
△5,407
△5,407
△229
△5,636
-
-
3,863
-
△5,407
△1,543
1,294
△248
資本金
資本
剰余金
利益
剰余金
13,208
15,323
-
剰余金の配当
27
-
-
△4,475
-
-
△4,475
△2,699
△7,174
自己株式の取得
26
-
-
-
△0
-
△0
-
△0
自己株式の処分
26
-
-
-
28
-
28
-
28
支配継続子会社に対
する持分の変動
39
-
△6,858
-
-
606
△6,252
△6,683
△12,936
その他の資本の構成
要素から利益剰余金
への振替
26
-
-
509
-
△509
-
-
-
株式報酬取引
25
-
△20
-
-
-
△20
-
△20
その他の増減
26
-
-
-
-
△1,290
△1,290
-
△1,290
-
△6,879
△3,965
27
△1,193
△12,011
△9,382
△21,394
13,208
8,443
150,944
△1,919
36,245
206,923
4,003
210,926
所有者との取引額合計
2025年3月31日残高
当連結会計年度(自
2025年4月1日
至
2026年3月31日)
(単位:百万円)
注記
2025年4月1日残高
当期利益
その他の包括利益
26
当期包括利益
自己株式
その他の
資本の
構成要素
親会社の
所有者に
帰属する
持分合計
非支配
持分
資本合計
150,944
△1,919
36,245
206,923
4,003
210,926
-
11,142
-
-
11,142
367
11,510
-
-
-
-
26,867
26,867
171
27,039
-
-
11,142
-
26,867
38,010
539
38,549
資本金
資本
剰余金
利益
剰余金
13,208
8,443
-
剰余金の配当
27
-
-
△4,479
-
-
△4,479
△329
△4,808
自己株式の取得
26
-
-
-
△421
-
△421
-
△421
自己株式の処分
26
-
259
-
186
-
446
-
446
支配継続子会社に対
する持分の変動
39
-
-
-
-
-
-
-
-
その他の資本の構成
要素から利益剰余金
への振替
26
-
-
221
-
△221
-
-
-
株式報酬取引
25
-
11
-
-
-
11
-
11
その他の増減
26
-
-
-
-
△331
△331
104
△226
-
271
△4,257
△235
△553
△4,774
△224
△4,999
13,208
8,715
157,829
△2,154
62,560
240,159
4,318
244,477
所有者との取引額合計
2026年3月31日残高
④【連結キャッシュ・フロー計算書】
(単位:百万円)
注記
前連結会計年度
(自 2024年4月1日
至 2025年3月31日)
当連結会計年度
(自 2025年4月1日
至 2026年3月31日)
営業活動によるキャッシュ・フロー
税引前当期利益
6,900
23,430
減価償却費及び償却費
19,337
21,356
退職給付に係る資産の増減(△は増加)
0
39
退職給付に係る負債の増減(△は減少)
18
△166
△1,060
△1,098
6,712
7,884
113
5,516
-
46
△1,690
△239
239
407
△291
-
営業債権の増減(△は増加)
△22,866
8,426
棚卸資産の増減(△は増加)
△53,458
△4,563
営業債務の増減(△は減少)
7,372
13,367
前渡金の増減額(△は増加)
4,240
△268
その他
△446
1,051
△34,878
75,189
1,478
1,103
利息の支払額
△6,285
△8,188
法人所得税の支払額又は還付額(△は支払)
△9,142
△13,229
保険金の受取額
-
8
災害損失の支払額
-
△43
△48,828
54,840
有形固定資産の取得による支出
△21,189
△26,408
有形固定資産の売却による収入
529
188
△3,165
△3,094
受取利息及び受取配当金
支払利息
減損損失
11
災害による損失
持分法による投資損益(△は益)
固定資産処分損益(△は益)
関係会社株式売却損益(△は益)
小計
利息及び配当金の受取額
営業活動によるキャッシュ・フロー
投資活動によるキャッシュ・フロー
無形資産の取得による支出
子会社株式の取得による支出
39
-
△16,726
子会社株式の売却による収入
36
1,819
-
関連会社株式の取得による支出
△583
△1,482
出資金の払込による支出
△82
△34
その他
919
710
△21,753
△46,847
投資活動によるキャッシュ・フロー
(単位:百万円)
注記
前連結会計年度
(自 2024年4月1日
至 2025年3月31日)
当連結会計年度
(自 2025年4月1日
至 2026年3月31日)
財務活動によるキャッシュ・フロー
短期借入金の純増減額(△は減少)
36
125,537
△88,581
コマーシャル・ペーパーの純増減額(△は減
少)
36
10,000
-
長期借入れによる収入
36
17,629
64,921
長期借入金の返済による支出
36
△6,635
△7,080
社債の発行による収入
36
25,000
-
社債の償還による支出
36
△35,000
-
リース負債の返済による支出
36
△2,942
△2,826
配当金の支払による支出
27
△4,475
△4,479
△2,699
△329
△12,936
-
△0
△0
△288
△213
113,188
△38,590
現金及び現金同等物に係る為替変動の影響額
△265
6,567
現金及び現金同等物の増減額(△は減少)
42,341
△24,029
非支配株主への配当金の支払額
非支配持分の取得による支出
39
自己株式の取得による支出
その他
財務活動によるキャッシュ・フロー
現金及び現金同等物の期首残高
6
28,499
70,840
現金及び現金同等物の期末残高
6
70,840
46,811
【連結財務諸表注記】
1.報告企業
不二製油株式会社(以下、「当社」という。)は、日本に所在する企業であり、日本の会社法に基づいて設立され
た株式会社です。登記されている本店及び主要な事業所の住所はホームページ(https://www.fujioil.co.jp/)で開
示しております。
当社の連結財務諸表は、当社及び子会社(以下、「当社グループ」という。)並びに関連会社及び共同支配企業に
対する持分により構成されています。当社グループの事業内容及び主要な活動は、注記「5.セグメント情報」に記
載しております。
当社は、2025年4月1日付で当社を吸収合併存続会社、当社の連結子会社であった旧不二製油株式会社を吸収合併
消滅会社とする吸収合併を実施し、同日付にて商号を「不二製油グループ本社株式会社」から「不二製油株式会社」
へ変更いたしました。
2.作成の基礎
(1)IFRSに準拠している旨及び初度適用に関する事項
当社グループの連結財務諸表は、連結財務諸表規則第1条の2に掲げる「指定国際会計基準特定会社」の要件を
すべて満たしているため、同第312条の規定により、IFRSに準拠して作成しております。
当社グループは2026年3月31日に終了する連結会計年度からIFRSを初めて適用しており、IFRSへの移行日(以
下、「移行日」という。)は2024年4月1日となります。また、当社グループはIFRSへの移行にあたり、IFRS第1
号「国際財務報告基準の初度適用」(以下「IFRS第1号」という。)を適用しています。IFRSへの移行が当社グル
ープの財政状態、経営成績及びキャッシュ・フローの状況に与える影響は注記「40. 初度適用(IFRSへの移行に
関する開示)」に記載しております。
当社グループの2026年3月31日に終了する年度の連結財務諸表は、2026年5月12日に取締役会によって承認され
ております。
(2)測定の基礎
当社グループの連結財務諸表は、「3.重要性がある会計方針」に記載している公正価値で測定する金融商品、
前連結会計年度まで実施していたガーナ・セディを機能通貨とする子会社における超インフレ経済下の会計上の調
整等を除き、取得原価を基礎として作成しております。
(3)機能通貨及び表示通貨
当社グループの連結財務諸表は、当社の機能通貨である日本円で表示しております。日本円で表示しているすべ
ての財務情報は、百万円未満を切り捨てて記載しております。
(4)未適用の新設、改訂されたIFRS基準書及び解釈指針
連結財務諸表の承認日までに主に以下の基準書及び解釈指針の新設又は改訂が公表されておりますが、当社グル
ープはこれらを早期適用しておりません。
なお、IFRS第9号改訂及びIFRS第7号改訂の適用による当社の連結財務諸表への影響に重要性はないと判断してい
ます。また、IFRS第18号の適用による当社の連結財務諸表への影響は検討中です。
IFRS
IFRS第9号
「金融商品の分類及
IFRS第7号
び測定の修正」
IFRS第18号
「財務諸表における
表示及び開示」
強制適用時期
(以降開始年度)
2026年1月1日
当社グループ
適用時期
新設・改訂の概要
2027年3月期
金融資産の分類の明確化、金融負債の認
識中止要件の追加及びその他の包括利益
を通じて公正価値で測定する金融資産に
関する開示規程の改訂
財務諸表における表示及び開示に関する
2027年1月1日
2028年3月期
現行の会計基準であるIAS第1号「財務
諸表の表示」を置き換える新基準
3.重要性がある会計方針
以下の会計方針は、本連結財務諸表(移行日の連結財政状態計算書を含む)に記載されているすべての期間に適用
しています。
(1)連結の基礎
当社グループの連結財務諸表は、当社及び子会社の財務諸表並びに関連会社・共同支配企業の持分相当額を含め
ております。
①
子会社
子会社とは、当社グループにより支配されている企業であります。支配とは、投資先に対するパワーを有し、
投資先への関与により生じるリターンの変動に晒され、かつ投資先に対するパワーを通じてリターンに影響を与
える能力を有する場合をいいます。
子会社の財務諸表は、当社グループが支配を獲得した日から支配を喪失する日まで、連結財務諸表に含まれて
おります。子会社に対する当社グループ持分の一部を処分した後も支配が継続する場合には、当社グループの持
分の変動を資本取引として会計処理しており、非支配持分の調整額と対価の公正価値との差額は、親会社の所有
者に帰属する持分として資本に直接認識されております。支配を喪失した場合には、支配の喪失から生じた利得
または損失は純損益で認識しております。
当社グループ内の債権債務残高及び取引、並びに当社グループ内取引によって発生した未実現損益は、連結財
務諸表の作成に際して消去しております。
②
関連会社
関連会社とは、当社グループがその財務及び経営方針に対して重要な影響力を有しているものの、支配または
共同支配をしていない企業であります。関連会社への投資は持分法によって会計処理しております。
関連会社に対する投資は当初取得原価で認識されております。当社の投資には、取得時に認識したのれんが含
まれております。また、重要な影響力を有することとなった日から重要な影響力を喪失する日までの関連会社の
損益及びその他の包括利益に対する当社グループの持分は、関連会社に対する投資額の変動として認識しており
ます。
持分法適用会社の会計方針は、当社グループが適用する会計方針と整合させるため、必要に応じて修正してお
ります。
連結財務諸表には、他の株主との関係等により決算日を当社の決算日と同じ日とすることが実務上不可能であ
るために決算日が異なる持分法適用会社に対する投資が含まれております。当該持分法適用会社の決算日の差異
はすべて3ヶ月以内であり、持分法適用会社の決算日と当社の決算日の間に生じた重要な取引又は事象の影響に
ついては調整を行っております。
損失に対する当社グループの持分が持分法適用会社に対する投資を上回った場合には、その投資の帳簿価額を
ゼロまで減額し、当社グループが被投資企業に代わって債務を負担し又は支払いを行う場合を除き、それ以上の
損失は認識しておりません。
関連会社に該当しなくなり、持分法の適用を中止した場合には、持分法の適用を中止したことから生じた利得
または損失を純損益として認識しております。
③
共同支配企業
共同支配企業とは、複数の当事者が共同支配する取決めを交わし、その取決めにおいて各々の当事者が当該取
決めの純資産に対する権利を有する場合であります。当社グループは、共同支配企業に対する持分について、関
連会社と同様に持分法を用いて会計処理しております。
共同支配企業に該当しなくなり、持分法の適用を中止した場合には、持分法の適用を中止したことから生じた
利得または損失を純損益として認識しております。
(2)企業結合
企業結合は、取得法を用いて会計処理をしております。取得対価は、被取得企業の支配と交換に譲渡した資産、
引き受けた負債及び当社が発行する資本性金融商品の取得日の公正価値の合計として測定されます。取得関連費用
は、発生した期間において費用として認識しております。
支払対価の公正価値、被取得企業の非支配持分の金額及び段階取得の場合には取得企業が以前より保有していた
被取得企業の支配獲得日の公正価値の合計が、取得日における識別可能資産及び引受負債の正味価額を上回る場合
に、その超過額をのれんとして認識しております。一方、この対価の総額が、識別可能資産及び負債の正味価額を
下回る場合、その差額を利得として損益に認識しております。
非支配持分を公正価値で測定するか、又は被取得企業の識別可能な純資産の比例持分で測定するかを、取得日に
個別の企業結合ごとに選択しております。
企業結合の当初の会計処理が、企業結合が発生した連結会計年度末までに完了していない場合には、完了してい
ない項目を暫定的な金額で計上しております。取得日時点に存在し、なおかつそれを知っていたならば取得日で認
識した金額の測定に影響したであろう事実と状況に関して、取得日当初に把握していたとするなら認識される金額
の測定に影響を与えていたと判断される期間(以下、測定期間)に入手した場合、その情報を反映して、取得日に
認識した暫定的な金額を遡及的に修正しております。新たに得た情報が、資産と負債の新たな認識をもたらす場合
には、追加の資産と負債を認識しております。測定期間は最長で1年間であります。
(3)外貨換算
① 外貨建取引
外貨建取引、すなわち各企業の機能通貨以外の通貨での取引は、取引日における直物為替レート又は当該期間
中の為替レートが著しく変動していない限り、それに近似するレートにより機能通貨に換算しております。外貨
建貨幣性資産及び負債は、連結決算日の為替レートにより機能通貨に換算し、また、公正価値で測定される外貨
建非貨幣性資産及び負債は、当該公正価値の算定日における為替レートで機能通貨に換算し、換算差額は、損益
として認識しております。
ただし、その他の包括利益を通じて公正価値で測定する資本性金融資産及びキャッシュ・フロー・ヘッジのヘ
ッジ手段から生じた換算差額のうちヘッジが有効な部分については、その他の包括利益として認識しておりま
す。
また、取得原価により測定されている外貨建非貨幣性項目は、取引日の為替レートを使用して換算しておりま
す。
②
在外営業活動体
在外営業活動体の資産及び負債は、連結決算日時点の為替レートで、損益及びキャッシュ・フローは、当該期
間中の為替レートが著しく変動していない限り、期中平均為替レートで表示通貨に換算しております。この結果
生じる換算差額はその他の包括利益で認識しております。
なお、在外営業活動体の持分全体の処分や支配の喪失を伴う持分の一部の処分といった事実が発生した場合、
処分した期に当該累積換算差額をその他の包括利益から純損益に振り替えております。
ただし、超インフレ経済下にある子会社の収益及び費用は、超インフレ会計の適用により、決算日の直物為替
相場レートで表示通貨に換算しております。
(4)金融商品
① 金融資産
金融資産はその当初認識時に、金融資産の管理に関する事業モデル及び金融資産の契約上のキャッシュ・フロ
ーの両方に基づき、償却原価で測定する金融資産、純損益を通じて公正価値で測定する金融資産及びその他の包
括利益を通じて公正価値で測定する金融資産に分類しております。当社グループでは、償却原価で測定する金融
資産については発生日に当初認識しており、それ以外の金融資産については契約の当事者となった時に当初認識
しております。
金融資産は、金融資産からのキャッシュ・フローに対する契約上の権利が消滅した場合、又は金融資産のキャ
ッシュ・フローを受け取る契約上の権利を譲渡し、当該金融資産の所有に係るリスクと経済価値のほとんどすべ
てが移転している場合において、認識を中止しております。
(a)償却原価で測定する金融資産
次の条件がともに満たされる金融資産を償却原価で測定する金融資産に分類しております。
・契約上のキャッシュ・フローを回収するために資産を保有することを目的とする事業モデルに基づいて、
資産が保有されている。
・金融資産の契約条件により、元本及び元本残高に対する利息の支払のみであるキャッシュ・フローが特定
の日に生じる。
償却原価で測定する金融資産は、当初認識時に公正価値にその取得に直接起因する取引コストを加算して測
定しております。ただし、重大な金融要素を含んでいない営業債権は取引価格で測定しております。また、当
初認識後は実効金利法に基づく償却原価で測定しております。必要な場合には、事後測定額の決定の過程で貸
倒引当金を控除しております。
(b)その他の包括利益を通じて公正価値で測定する金融資産
次の条件がともに満たされる負債性金融商品は、その他の包括利益を通じて公正価値で測定する負債性金
融商品に分類しております。
・契約上のキャッシュ・フローを回収するため及び売却するために資産を保有することを目的とする事業
モデルに基づいて、資産が保有されている。
・金融資産の契約条件により、元本及び元本残高に対する利息の支払のみであるキャッシュ・フローが特
定の日に生じる。
その他の包括利益を通じて公正価値で測定する負債性金融商品は、当初認識時に公正価値にその取得に直
接起因する取引コストを加算して測定しております。また、利息、為替差損益及び減損損失は、純損益とし
て認識し、これらを除いた公正価値の変動額をその他の包括利益として認識しております。
売買目的ではない資本性金融商品への投資については取引先との取引関係の維持又は強化を主な目的とし
て保有しており、当初認識時に、その公正価値の事後的な変動をその他の包括利益に表示するという取消不
能な選択を行うことが認められています。当社グループでは金融商品ごとに当該指定を行い、その他の包括
利益を通じて公正価値で測定する資本性金融商品に分類しております。
その他の包括利益を通じて公正価値で測定する資本性金融商品は、当初認識時に公正価値にその取得に直
接起因する取引コストを加算して測定しております。また、当初認識後は公正価値で測定し、その事後的な
変動をその他の包括利益として認識しております。その他の包括利益として認識した金額は、認識を中止し
た場合にその累積額を利益剰余金に振り替えており、純損益には振り替えておりません。なお、配当につい
ては純損益として認識しております。
(c)純損益を通じて公正価値で測定する金融資産
償却原価で測定する金融資産以外の金融資産は、公正価値で測定する金融資産に分類しております。公正価
値で測定する金融資産のうち、その他の包括利益を通じて公正価値で測定する金融資産に分類されたもの以外
の金融資産については、純損益を通じて公正価値で測定する金融資産に分類しております。
純損益を通じて公正価値で測定する金融資産は、当初認識時に公正価値により測定し、その取得に直接起因
する取引コストは、発生時に純損益で認識しております。また、当初認識後は公正価値で測定し、その事後的
な変動を純損益として認識しております。
②
金融資産の減損
当社グループは、償却原価で測定する金融資産について、予想信用損失に対する貸倒引当金を認識しておりま
す。期末日ごとに、当該資産に係る信用リスクが当初認識時点から著しく増加しているかどうかを判定し、信用
リスクの当初認識時点からの著しい増加の有無に応じて、次の金額を貸倒引当金として認識しております。金融
資産に係る貸倒引当金の繰入額及び戻入額は、純損益で認識しています。
(a)信用リスクが当初認識時点から著しく増加していない場合
12ヶ月の予想信用損失に等しい金額で貸倒引当金を測定
(b)信用リスクの著しい増大が見受けられるが、信用減損の証拠は見受けられない場合
全期間にわたる予想信用損失と同額
(c)信用リスクの著しい増大及び信用減損の証拠が共に顕在化している場合
全期間にわたる予想信用損失と同額
信用リスクの増大については、債務不履行の発生リスクの変化に基づいて判断しており、債務不履行の発生リ
スクに変化があるか否かの評価を行う際には、契約上の支払期日の経過情報や債務者の経営成績の悪化の情報等
を考慮しております。支払期日の経過があった場合、期日経過の理由や取引先の財務状況等の情報に基づいて反
証可能である場合には、信用リスクの著しい増大は生じていないと判断していますが、債務履行の不確実性が解
消されない場合は信用リスクが増大していると判断しております。
重大な金融要素を含んでいない営業債権等については、常に全期間の予想信用損失と等しい金額を貸倒引当金
として認識しております。この際、信用リスク特性ごとに、過去の貸倒実績率を考慮した引当率を帳簿価額に乗
じて予想信用損失を測定しております。
期末日時点で債務者の重大な財政的困難等に起因する支払遅延または支払期日延長の要請があった場合等、契
約上のキャッシュ・フローの回収可能性が懸念されるものであると判断された場合には、債務不履行とみなし、
信用減損が発生しているものと判定しております。
③
金融負債
金融負債はその当初認識時に純損益を通じて公正価値で測定する金融負債及び償却原価で測定する金融負債に
分類しております。当社グループでは、償却原価で測定する金融負債については、発生日に当初認識しており、
それ以外の金融負債については、契約の当事者となった時に当初認識しております。
金融負債は、金融負債が消滅した時、すなわち、契約中に特定された債務が免責、取消し又は失効となった時
に認識を中止しております。
(a)償却原価で測定する金融負債
純損益を通じて公正価値で測定する金融負債以外の金融負債は、償却原価で測定する金融負債に分類してお
ります。償却原価で測定する金融負債は、当初認識時に公正価値からその発行に直接起因する取引コストを減
算して測定しております。また、当初認識後は実効金利法に基づく償却原価で測定しております。
(b)純損益を通じて公正価値で測定する金融負債
純損益を通じて公正価値で測定する金融負債は、当初認識時に公正価値により測定し、その取引に直接起因
する取引コストは、発生時に純損益で認識しております。また、当初認識後は公正価値で測定し、その事後的
な変動を純損益として認識しております。
④
デリバティブ及びヘッジ会計
当社グループでは、為替変動リスク、金利変動リスク及び商品価格変動リスクをヘッジするために、先物為替
予約取引、金利スワップ取引、商品のコモディティスワップ先物等のデリバティブ取引を行っております。
当社グループでは、ヘッジ会計を適用するにあたって、ヘッジ開始時に、リスク管理目的、ヘッジ取引を実行
する際の戦略及びヘッジ関係の有効性の評価方法を含めたヘッジ手段とヘッジ対象の関係を正式に文書化してお
ります。また、ヘッジ対象期間において、ヘッジ手段と関連するヘッジ対象のキャッシュ・フローの変動に対し
て非常に高い相殺効果を有することが見込まれるかについて、ヘッジ開始時及びその後も継続的に評価を実施し
ております。
デリバティブは公正価値で当初認識しております。また、当初認識後は公正価値で測定し、その事後的な変動
は次のとおり処理しております。
(a)キャッシュ・フロー・ヘッジ
ヘッジ手段であるデリバティブの公正価値変動のうち有効なヘッジと判定される部分は、その他の包括利益
として認識しております。
その他の包括利益に認識した金額は、ヘッジ対象である取引が純損益に影響を与える会計期間においてその
他の資本の構成要素から純損益に振り替えております。ただし、予定取引のヘッジがその後において非金融資
産又は非金融負債の認識を生じさせるものである場合には、その他の包括利益に認識した金額を当該非金融資
産又は非金融負債の当初の帳簿価額の修正として処理しております。
ヘッジ手段が失効、売却、終結又は行使された場合、ヘッジ比率を調整してもなお、ヘッジの有効性の要件
を満たさなくなった場合には、ヘッジ会計を将来に向けて中止しております。予定取引の発生がもはや見込ま
れない場合には、その他の包括利益として認識した公正価値の変動額を直ちに純損益に振り替えております。
(b)ヘッジ指定されていないデリバティブ
デリバティブの公正価値の変動は純損益として認識しております。
⑤
金融資産と金融負債の相殺
金融資産と金融負債は、認識した金額を相殺する法的に強制力のある権利を有しており、かつ、純額で決済す
る又は資産の実現と負債の決済を同時に実行する意図を有している場合に、相殺して純額で表示しております。
(5)現金及び現金同等物
現金及び現金同等物は、手許現金、随時引き出し可能な預金及び容易に換金可能であり、かつ価値の変動につい
て僅少なリスクしか負わない取得日から3ヶ月以内に償還期限の到来する短期投資から構成されております。
(6)棚卸資産
棚卸資産は、取得原価と正味実現可能価額とのいずれか低い金額で測定しております。取得原価には、購入原
価、加工費及び棚卸資産が現在の場所及び状態に至るまでに発生したその他のコストのすべてを含んでおり、原価
の算定にあたっては、主として移動平均法を用いております。加工費には通常操業度に基づく製造間接費の配賦額
を含めております。正味実現可能価額は、通常の営業過程における見積売価から、完成までに要する見積原価及び
販売に要する見積費用を控除した額であります。
(7)有形固定資産
①
認識及び測定
有形固定資産の測定には原価モデルを採用し、取得原価から減価償却累計額及び減損損失累計額を控除した価
額で表示しております。2024年4月1日(当社グループのIFRS移行日)時点の特定の土地の取得原価は、IFRS第
1号の免除規定を適用し、移行日における有形固定資産項目の公正価値をみなし原価として使用することを選択
しております。
取得原価には資産の取得に直接関連する費用、資産の解体及び除去費用、原状回復費用の当初見積額、並びに
資産計上の要件を満たす借入コストが含まれております。有形固定資産の構成要素の耐用年数が構成要素ごとに
異なる場合は、それぞれ別個の有形固定資産項目として計上しております。
②
取得後の支出
有形固定資産の取得後に発生した支出のうち、通常の修繕及び維持については発生時に費用として処理し、主
要な取替及び改良に係る支出については、その支出により将来当社グループに経済的便益がもたらされることが
見込まれる場合に限り資産計上しております。
③
減価償却
土地、建設仮勘定以外の有形固定資産は、使用が可能となった時点から、それぞれの見積耐用年数にわたって
定額法で減価償却しております。
主要な有形固定資産の見積耐用年数は次のとおりであります。
・建物及び構築物
:5~60年
・機械装置及び運搬具:3~25年
・工具器具及び備品 :2~20年
なお、見積耐用年数、残存価額及び減価償却方法は、各年度末に見直しを行い、変更があった場合は、会計上
の見積りの変更として将来に向かって適用しております。
(8)のれん及び無形資産
① のれん
当初認識時におけるのれんの測定については、「(2)企業結合」に記載しております。当初認識後、のれんは
取得原価から減損損失累計額を控除した価額で表示しております。
のれんは償却を行わず、少なくとも年に1度、さらには減損の可能性を示す事象が生じた場合はその都度、資
金生成単位を基礎とした減損テストを実施しております。
②
無形資産
無形資産の測定には原価モデルを採用し、耐用年数を確定できる無形資産は取得原価から償却累計額及び減損
損失累計額を控除した価額で表示しております。
個別に取得した無形資産は、当初認識に際し取得原価で測定しており、企業結合により取得した無形資産の取
得原価は取得日時点の公正価値で測定しております。
耐用年数を確定できる無形資産は、使用可能となった時点からそれぞれの見積耐用年数にわたり、定額法で償
却しております。主要な無形資産の見積耐用年数は次のとおりであります。
・ソフトウェア:5年
・顧客関連資産:10~20年
耐用年数を確定できない無形資産及び未だ使用可能でない無形資産は償却を行わず、毎年同時期及び減損の兆
候が存在する場合にはその都度、減損テストを実施しております。
なお、見積耐用年数、残存価額及び償却方法は、各年度末に見直しを行い、変更があった場合は、会計上の見
積りの変更として将来に向かって適用しております。
(9)リース
当社グループは、借手としてのリース取引について、リース開始日に使用権資産及びリース負債を認識しており
ます。リース負債は未払リース料総額の現在価値で測定し、使用権資産は、リース負債の当初測定の金額に開始日
以前に支払ったリース料等、借手に発生した当初直接コスト及びリースの契約条件で要求されている原状回復義務
等のコストを調整した取得原価で測定しております。使用権資産は、耐用年数とリース期間のいずれか短い年数に
わたって、定額法で減価償却を行っております。
リース料は、実効金利法に基づき金融費用とリース負債の返済額に配分し、利息費用は連結損益計算書において
認識しております。
ただし、リース期間が12ヶ月以内の短期リース及び原資産が少額のリースについては、使用権資産及びリース負
債を認識せず、リース料をリース期間にわたって、定額法により費用として認識しております。また、実務上の便
法として、当社グループは非リース構成部分をリース構成部分と区別せず、リース構成部分及び関連する非リース
構成部分を単一のリース構成部分として会計処理することを選択しております。
なお、貸手としてのリース取引で重要なものはありません。
(10)非金融資産の減損
棚卸資産及び繰延税金資産及び売却目的で保有する資産等を除く非金融資産については、資産が減損している可
能性を示す兆候があるか否かを評価しております。
減損の兆候が存在する場合には減損テストを実施し、個別の資産又は資金生成単位ごとの回収可能価額を測定し
ております。なお、のれん、耐用年数を確定できない無形資産及び未だ使用可能でない無形資産は償却を行わず、
毎年同時期及び減損の兆候が存在する場合にはその都度、減損テストを実施しております。
減損テストにおいて、資産は、継続的な使用により他の資産または資金生成単位のキャッシュ・インフローから
概ね独立したキャッシュ・インフローを生み出す最小の資産グループに集約しています。企業結合から生じたのれ
んは、結合のシナジーが得られると期待される資金生成単位または資金生成単位グループに配分しています。当社
グループの全社資産は、独立したキャッシュ・インフローを生成しないため、全社資産に減損の兆候がある場合、
全社資産が帰属する資金生成単位の回収可能価額を見積もっております。
回収可能価額は、処分費用控除後の公正価値と適切な利率で割り引かれた当該資産の継続的使用及び最終的な処
分から発生すると見込まれる将来キャッシュ・フロー評価によって測定される使用価値のいずれか高い金額を用い
ております。
個別の資産又は資金生成単位の帳簿価額が回収可能価額を上回る場合には純損益にて減損損失を認識し、当該資
産の帳簿価額を回収可能価額まで減額しております。資金生成単位に関連して認識した減損損失は、まずその単位
に配分されたのれんの帳簿価額を減額するように配分し、次に資金生成単位内のその他の資産の帳簿価額を比例的
に減額しております。
のれんに係る減損損失は、戻入れを行っておりません。のれん以外の非金融資産に係る減損損失は、減損損失が
もはや存在しないか又は減少している可能性を示す兆候が存在する場合に当該資産の回収可能価額を見積もってお
り、回収可能価額が減損処理後の帳簿価額を上回った場合には減損損失の戻入れを行っております。なお、減損損
失の戻入れは過去の期間において当該資産に認識した減損損失がなかった場合の帳簿価額から必要な減価償却費ま
たは償却費を控除した後の帳簿価額を超えない範囲内で純損益にて認識しております。
(11)従業員給付
①
退職後給付
当社グループは、従業員の退職後給付制度として確定給付制度及び確定拠出制度を採用しております。
(a)確定給付制度
確定給付制度債務の現在価値及び関連する当期勤務費用並びに過去勤務費用は、予測単位積増方式を用いて
算定しております。
割引率は、将来の毎年度の給付支払見込日までの期間を基に割引期間を設定し、割引期間に対応した決算日
時点の優良社債の市場利回りに基づき算定しております。
確定給付制度債務の現在価値と制度資産の公正価値との純額を、負債又は資産として計上しております。た
だし、確定給付制度が積立超過である場合は、確定給付資産の純額は、制度からの返還又は制度への将来掛金
の減額の形で利用可能な経済的便益の現在価値を資産上限額としております。また、確定給付負債(資産)の
純額に係る利息純額は金融費用(金融収益)として純損益に認識しております。
確定給付制度の再測定により発生した増減額は、発生した期においてその他の包括利益に一括認識し、直ち
に利益剰余金に振り替えております。また過去勤務費用は発生時に全額純損益に認識しております。
(b)確定拠出制度
確定拠出制度については、確定拠出制度に支払うべき拠出額を、従業員が関連する勤務を提供した時に費用
として認識しております。
②
短期従業員給付
短期従業員給付については、割引計算を行わず、関連するサービスが提供された時点で費用として認識してお
ります。
賞与及び有給休暇費用については、それらを支払う法的もしくは推定的な債務を有し、信頼性のある見積りが
可能な場合に、それらの制度に基づいて支払われると見積られる額を負債として認識しております。
(12)引当金
過去の事象の結果として、現在の法的又は推定的義務を有しており、当該義務を履行するために経済的便益を有
する資源の流出が必要となる可能性が高く、その義務の金額について信頼性のある見積りができる場合に、引当金
を認識しております。
貨幣の時間的価値の影響が重要な場合には、引当金額は債務の決済に必要と見込まれる支出の現在価値で測定し
ております。
(13)株式報酬
当社は、持分決済型の株式に基づく報酬制度として、業績連動型株式報酬制度を導入しております。
持分決済型の株式報酬の付与日における公正価値は、付与日から権利が確定するまでの期間にわたり費用として
認識し、同額を資本の増加として認識しております。
(14)資本
① 普通株式
普通株式は、発行価額を資本金及び資本剰余金に認識しております。また、株式発行費用は発行価額から控除
しております。
②
自己株式
自己株式は取得原価で評価し、資本から控除しており、自己株式の購入、売却又は消却において利得又は損失
は認識しておりません。なお、帳簿価額と処分時の対価との差額は資本として認識しております。
(15)収益
下記の5ステップアプローチに基づいて、収益を認識しております。
ステップ1:顧客との契約を識別する。
ステップ2:契約における履行義務を識別する。
ステップ3:取引価格を算定する。
ステップ4:契約における履行義務に取引価格を配分する。
ステップ5:履行義務を充足した時にまたは充足するにつれて収益を認識する。
① 物品販売に係る収益認識
当社グループでは、主に植物性油脂や業務用チョコレート、乳化・発酵素材、大豆加工素材等の販売を行って
おり、このような物品販売は、物品を引渡した時点において、顧客が当該物品に対する支配を獲得することによ
り、当社グループの履行義務が充足され、上記収益認識の要件を満たすこととなります。そのため、顧客に物品
を引き渡した時点において収益を認識しております。
②
変動対価が含まれる取引に係る収益認識(リベート取引)
物品販売に係る収益のうち、取引高リベート並びに目標達成リベートについて、取引価格から減額しておりま
す。なお、顧客との契約における対価に変動対価が含まれている場合には、変動対価に関する不確実性がその後
に解消される際に、認識した収益の累計額の重大な戻入れが生じない可能性が非常に高い範囲でのみ、取引価格
に含めております。
③
原材料有償支給取引に係る収益認識
原材料有償支給取引について、支給品を買い戻す義務を負っている場合、当該支給品の消滅を認識しておりま
せん。
(16)金融収益及び金融費用
金融収益は、受取利息、受取配当金、為替差益等から構成されております。受取利息は、実効金利法を用いて発
生時に認識しております。受取配当金は、当社グループの受領権が確定した時点で認識しております。
金融費用は、支払利息、為替差損等から構成されております。支払利息は、実効金利法を用いて発生時に認識し
ております。
(17)法人所得税
法人所得税費用は、当期税金と繰延税金の合計として表示しております。
当期税金は、決算日において制定され又は実質的に制定されている税率を用いて、税務当局に対する納付又は税
務当局からの還付が予想される金額で算定しております。これらは、企業結合に関連するもの及び直接資本の部又
はその他の包括利益で認識される項目を除き、当期の純損益にて認識しております。
繰延税金資産及び負債は、決算日までに制定又は実質的に制定されている税率に基づいて、資産が実現する期又
は負債が決済される期に適用されると予想される税率で算定しております。繰延税金資産及び負債は、資産及び負
債の会計上の帳簿価額と税務基準額の差額である一時差異並びに、税務上の繰越欠損金及び繰越税額控除等に基づ
いて算定しております。繰延税金資産は、将来減算一時差異、税務上の繰越欠損金及び繰越税額控除等に対して、
それらを利用できる課税所得が生じる可能性が高い範囲で認識しております。
なお、企業結合ではなく、取引時に会計上の利益にも課税所得にも影響しない取引における当初認識から生じる
一時差異については、繰延税金資産及び負債を認識しておりません。さらにのれんの当初認識において生じる将来
加算一時差異についても、繰延税金負債を認識しておりません。
子会社・関連会社に対する投資に係る将来加算一時差異については、繰延税金負債を認識しております。ただ
し、一時差異を解消する時期をコントロールでき、かつ予測可能な期間内に一時差異が解消しない可能性が高い場
合には認識しておりません。また、子会社・関連会社に対する投資に係る将来減算一時差異については、一時差異
が予測し得る期間内に解消し、かつ課税所得を稼得する可能性が高い範囲でのみ繰延税金資産を認識しておりま
す。
繰延税金資産及び負債は、当期税金資産と当期税金負債を相殺する法律上強制力のある権利を有し、かつ同一の
税務当局によって同一の納税主体に対して課される法人所得税に関するものである場合に相殺しております。
法人所得税の不確実な税務ポジションについて、税法上の解釈に基づき税務ポジションが発生する可能性が高い
場合には,合理的な見積額を資産又は負債として認識しております。
当社及び一部の国内子会社では、グループ通算制度を適用しております。また、一部の在外子会社では、連結納
税制度を適用しております。
(18)1株当たり利益
基本的1株当たり当期利益は、親会社の所有者に帰属する当期利益を、その期間の自己株式を調整した発行済普
通株式の加重平均株式数で除して算定しております。
希薄化後1株当たり当期利益は、希薄化効果を有するすべての潜在的普通株式による影響を調整して算定してお
ります。
(19)政府補助金
政府補助金は、補助金交付のための付帯条件を満たし、かつ補助金を受領することに合理的な保証が得られた場
合に公正価値で認識しております。収益に関する補助金は、補助金で補填することが意図されている関連コストを
費用として認識する期間に純損益として認識し、関連する費用から控除しています。また、資産に関する政府補助
金は、関連する資産の取得原価から直接減額しています。
(20)売買目的で保有する非流動資産又は処分グループ
非流動資産又は処分グループの帳簿価額が、継続的使用ではなく、主として売却取引によって回収が見込まれる
場合に、売却目的保有に分類しています。
なお、現在の状態で直ちに売却可能であり、かつ買手との間で具体的な計画に着手し、その売却計画の実行を経
営者が確約しているなど、当該資産又は処分グループが1年以内に売却の可能性が非常に高い場合、上記要件に該
当するものとしています。売却目的保有に分類した非流動資産又は処分グループについては、帳簿価額又は売却費
用控除後の公正価値のいずれか低い金額で測定し、減価償却又は償却は行っていません。
売却目的で保有する資産又は処分グループに分類していた資産又は資産グループのうち、売却方針から継続的使
用方針へと変更を行った資産又は資産グループについては、売却目的で保有する資産又は処分グループへの分類を
中止しております。売却目的保有への分類を中止した資産又は処分グループは、当該資産又は処分グループが売却
目的保有に分類される前の帳簿価額を、当該資産又は処分グループが売却目的保有に分類されていなかったとした
場合に認識されていたであろう減価償却費又は償却費について修正した金額と、売却をしないという事後的な意思
決定の時点での回収可能価額のうち、いずれか低い金額で測定しております。
4.見積り及び判断の利用
IFRSに準拠した連結財務諸表の作成において、経営者は、会計方針の適用並びに資産、負債、収益及び費用の報告
額に影響を及ぼす判断、見積り及び仮定の設定をすることが義務付けられております。ただし、実際の業績はこれら
の見積りとは異なる場合があります。
見積り及びその基礎となる仮定は継続して見直しております。会計上の見積りの見直しは、見積りが改定された会
計期間及び影響を受ける将来の会計期間において認識されます。
連結財務諸表上で認識する金額に重要な影響を与える見積り及び判断項目は、以下のとおりです。
(1)非金融資産の減損
当社グループは、有形固定資産、無形資産、のれん等の非金融資産が減損している可能性を示す兆候の有無を確
認しており、減損の兆候が存在する場合、減損テストを実施しています。ただし、のれん、耐用年数が確定できな
い無形資産については減損の兆候の有無にかかわらず毎年同時期に減損テストを実施しています。
資金生成単位の回収可能価額は、使用価値と処分コスト控除後の公正価値のいずれか高い方として算定しており
ます。使用価値は、経営者が承認した事業計画及び成長率を基礎とした将来キャッシュ・フローの見積額を現在価
値に割り引くことによって算定しております。成長率は、各資金生成単位が属する市場の長期平均成長率を基礎と
して決定しております。また、割引率は税引後の加重平均資本コスト等を使用しております。
回収可能価額の算定にあたっては、将来キャッシュ・フローの見積りに際し、対象となる製品の需要動向及び販
売予測、原材料価格の予測、コスト削減効果の予測並びに割引率等に関する仮定を設定しております。これらの仮
定は経営者の最善の見積りと判断により決定していますが、将来の経済条件や事業計画等の変化によって影響を受
ける可能性があり、見直しが必要となった場合、翌連結会計年度以降の連結財務諸表において、認識する金額に重
要な影響を与える可能性があります。
関連する内容については注記「11.非金融資産の減損」に記載しております。
(2)繰延税金資産の回収可能性
当社グループでは、将来減算一時差異等を使用できる課税所得が生じる範囲を見積り、繰延税金資産を認識して
おります。課税所得が生じる可能性の判断において、事業計画に基づいて将来稼得しうる課税所得の時期及びその
金額を見積り算定しております。
課税所得が生じる時期及び金額は経営者の最善の見積りと判断により決定していますが、将来の経済条件や事業
計画の変化等によって影響を受ける可能性があり、見直しが必要となった場合、翌連結会計年度以降の連結財務諸
表において、認識する金額に重要な影響を与える可能性があります。
関連する内容については注記「18.法人所得税」に記載しております。
(3)退職後給付
当社グループでは、従業員の退職後給付制度として、確定給付制度と確定拠出制度を採用しております。確定給
付制度について、確定給付債務の現在価値や勤務費用等は様々な数理計算上の仮定に基づき算出しております。
これらの仮定は経営者による最善の見積りと判断により決定していますが、将来の不確実な事業環境の変動等の
結果や関連法令の改正・交付によって実際の結果と異なる可能性があり、見直しが必要となった場合、翌連結会計
年度以降の連結財務諸表において、認識する金額に重要な影響を与える可能性があります。
関連する内容については注記「24.従業員給付」に記載しております。
5.セグメント情報
(1)報告セグメント
当社の報告セグメントは、当社の構成単位のうち分離された財務情報が入手可能であり、取締役会が、経営資源
の配分の決定及び業績を評価するために、定期的に検討を行う対象となっているものであります。
当社グループは、植物性油脂製品、業務用チョコレート製品、乳化・発酵素材製品及び大豆加工素材製品の製造
販売を主として行っており、取り扱う製品群毎に国内外で事業活動を展開しております。
したがって、当社グループは、製品群を基礎とした事業別のセグメントから構成されており、「植物性油脂事
業」、「業務用チョコレート事業」、「乳化・発酵素材事業」及び「大豆加工素材事業」の4つを報告セグメント
としております。
各報告セグメントの事業内容は次のとおりであります。
報告セグメント
事業内容
植物性油脂
パーム油及びパーム核油等を基礎原料とした食用加工油脂、食用油及びチョコ
レート用油脂等の製造販売
業務用チョコレート
チョコレート、コンパウンド及びココア製品の製造販売
乳化・発酵素材
クリーム、マーガリン及びフィリング等の製造販売
大豆加工素材
大豆たん白素材、大豆たん白食品及び水溶性大豆多糖類等の製造販売
(2)報告セグメント情報
報告セグメントの会計処理の方法は、「3.重要性がある会計方針」で記載している当社グループの会計方針と
同一であります。報告セグメントの利益は、事業利益ベースの数値であります。セグメント間の内部売上高は市場
実勢価格に基づいております。
当社は、当連結会計年度より、従来「調整額」に含めていたセグメントに配分していない全社費用を、各報告セ
グメントに配分して記載しております。前連結会計年度のセグメント情報は、変更後の配分方法に基づき作成した
ものを記載しております。
移行日(2024年4月1日)
(単位:百万円)
報告セグメント
植物性油脂
セグメント資産
127,192
業務用
チョコ
レート
222,420
乳化・発酵
素材
大豆加工
素材
60,398
45,096
合計
調整額
(注1)
455,107
22,086
連結計
477,193
(注)1.セグメント資産の調整額22,086百万円は、報告セグメントに帰属しない全社資産であり、提出会社及び一部
の地域統括会社等における現金及び現金同等物、投資有価証券等の資産であります。
前連結会計年度(自
2024年4月1日
至
2025年3月31日)
(単位:百万円)
報告セグメント
植物性油脂
業務用
チョコ
レート
乳化・発酵
素材
大豆加工
素材
合計
調整額
(注1、
2)
連結計
売上高
外部顧客への売上高
207,329
334,684
94,252
34,941
671,207
-
671,207
27,509
3,877
5,594
199
37,181
△37,181
-
計
234,839
338,561
99,846
35,141
708,389
△37,181
671,207
事業利益(△損失)
(注3)
26,781
△14,168
1,700
△817
13,496
△235
13,261
5,086
7,465
3,862
2,923
19,337
-
19,337
-
-
-
113
113
-
113
持分法で会計処理され
ている投資
12,965
460
-
-
13,426
-
13,426
資本的支出(注4)
5,477
17,173
3,121
4,528
30,301
579
30,881
151,895
312,341
61,320
41,305
566,862
30,214
597,076
セグメント間の内部売
上高
その他の項目
減価償却費及び償却費
減損損失
セグメント資産
(注)1.事業利益(△損失)の調整額△235百万円には、セグメント間取引消去等が含まれております。
2.セグメント資産の調整額30,214百万円は、報告セグメントに帰属しない全社資産であり、提出会社及び一部
の地域統括会社等における現金及び現金同等物、投資有価証券等の資産であります。
3.事業利益(△損失)は、営業利益に持分法による投資損益を加算し、非経常的な要因により発生した損益を
除いて算出しております。
4.資本的支出には、使用権資産に係る金額を含めております。
当連結会計年度(自
2025年4月1日
至
2026年3月31日)
(単位:百万円)
報告セグメント
植物性油脂
業務用
チョコ
レート
乳化・発酵
素材
大豆加工
素材
調整額
(注1、
2)
合計
連結計
売上高
外部顧客への売上高
271,076
370,904
97,432
32,874
772,288
-
772,288
33,273
4,305
7,111
70
44,760
△44,760
-
計
304,350
375,209
104,543
32,945
817,048
△44,760
772,288
事業利益(△損失)
(注3)
33,394
2,391
1,144
△874
36,056
△8
36,048
6,327
8,313
3,865
2,850
21,356
-
21,356
204
4,260
226
825
5,516
-
5,516
持分法で会計処理され
ている投資
15,434
667
-
-
16,102
-
16,102
資本的支出(注4)
8,126
14,948
4,834
3,722
31,632
780
32,412
203,671
300,789
62,453
40,751
607,665
29,267
636,933
セグメント間の内部売
上高
その他の項目
減価償却費及び償却費
減損損失
セグメント資産
(注)1.事業利益(△損失)の調整額△8百万円には、セグメント間取引消去等が含まれております。
2.セグメント資産の調整額29,267百万円は、報告セグメントに帰属しない全社資産であり、提出会社及び一部
の地域統括会社等における現金及び現金同等物、投資有価証券等の資産であります。
3.事業利益(△損失)は、営業利益に持分法による投資損益を加算し、非経常的な要因により発生した損益を
除いて算出しております。
4.資本的支出には、使用権資産に係る金額を含めております。
事業利益から税引前当期利益への調整は、以下のとおりです。
前連結会計年度
(自 2024年4月1日
至 2025年3月31日)
事業利益
当連結会計年度
(自 2025年4月1日
至 2026年3月31日)
13,261
36,048
固定資産売却益
64
64
固定資産処分損
△303
△471
291
-
△113
△5,516
△1,690
△239
その他
0
△62
営業利益
11,508
29,822
金融収益
1,280
1,550
金融費用
△7,579
△8,182
1,690
239
6,900
23,430
関係会社株式売却益
減損損失
持分法による投資損益(△は利益)
持分法による投資損益(△は損失)
税引前当期利益
(3)製品及びサービスに関する情報
製品及びサービスの区分が報告セグメントと同一のため、記載を省略しております。
(4)地域別情報
外部顧客への売上高の地域別内訳は、次のとおりであります。
(単位:百万円)
(自
至
前連結会計年度
2024年4月1日
2025年3月31日)
(自
至
当連結会計年度
2025年4月1日
2026年3月31日)
日本
223,703
248,888
アジア
98,400
109,870
米国
213,390
220,269
欧州
50,227
94,432
その他
85,485
98,827
671,207
772,288
合計
(注)1.売上高は顧客の所在地を基礎とし、国又は地域に分類しております。
2.アジアに属する主な国または地域は、中国、インドネシア、マレーシアであります。
3.欧州に属する主な国または地域は、フランス、ドイツ、ベルギーであります。
非流動資産(金融資産、繰延税金資産、退職後給付資産及び保険契約から生じる権利を除く)の地域別内訳は以
下のとおりです。
(単位:百万円)
移行日
(2024年4月1日)
前連結会計年度末
(2025年3月31日)
当連結会計年度末
(2026年3月31日)
日本
62,709
68,168
72,152
アジア
35,463
37,073
41,870
米国
79,943
69,099
77,923
欧州
15,067
14,715
35,593
その他
25,454
25,336
36,120
218,638
214,392
263,661
合計
(注)非流動資産は所在地を基礎とし、国又は地域に分類しております。
(5)主要な顧客に関する情報
外部顧客への売上高のうち、連結損益計算書の売上高の10%以上を占める顧客がないため、記載を省略しており
ます。
6.現金及び現金同等物
現金及び現金同等物の内訳は、次のとおりであります。なお、移行日、前連結会計年度末及び当連結会計年度末の
連結財政状態計算書上における「現金及び現金同等物」の残高と連結キャッシュ・フロー計算書上における「現金及
び現金同等物」の残高は一致しております。
(単位:百万円)
移行日
(2024年4月1日)
前連結会計年度末
(2025年3月31日)
当連結会計年度末
(2026年3月31日)
現金及び預金
26,504
70,035
44,630
預入期間が3ヶ月以内の定期預金
1,995
804
2,180
28,499
70,840
46,811
合計
(注)1.現金及び現金同等物は償却原価で測定する金融資産に分類しております。
2.当社の連結子会社であるBlommer Chocolate Company, LLCは同社が保有する現金及び現金同等物の一部に利用
の一定の制限を受けており、その残高は移行日771百万円、前連結会計年度末760百万円、当連結会計年度末
49百万円となっております。
7.営業債権
営業債権の内訳は次のとおりであります。
(単位:百万円)
移行日
(2024年4月1日)
前連結会計年度末
(2025年3月31日)
当連結会計年度末
(2026年3月31日)
受取手形及び売掛金
92,643
112,504
115,487
貸倒引当金
△244
△206
△284
92,399
112,298
115,202
合計
(注)営業債権は償却原価で測定する金融資産に分類しております。
8.棚卸資産
棚卸資産の内訳は次のとおりであります。
(単位:百万円)
移行日
(2024年4月1日)
前連結会計年度末
(2025年3月31日)
当連結会計年度末
(2026年3月31日)
商品及び製品
55,294
72,622
79,026
原材料及び貯蔵品
54,054
88,095
103,004
109,349
160,718
182,031
合計
(注)期中に費用として認識された棚卸資産の金額は、注記「29.費用の性質別内訳」に記載しております。また、前
連結会計年度及び当連結会計年度における棚卸資産の評価減の金額はそれぞれ、54百万円及び5,424百万円で
す。
9.有形固定資産
(1)調整表及び内訳
有形固定資産の帳簿価額の増減、取得原価、減価償却累計額及び減損損失累計額は次のとおりであります。
①
帳簿価額の増減
(単位:百万円)
建物
及び構築物
機械装置
及び運搬具
工具器具
及び備品
47,809
62,907
3,133
17,649
9,844
141,344
-
-
-
-
25,355
25,355
建設仮勘定からの振替
2,629
8,485
1,365
901
△13,381
-
減価償却費(注1)
△3,076
△9,514
△1,156
△23
-
△13,771
△7
△104
△1
-
-
△113
△757
△839
△36
△778
△6
△2,418
△1,282
△2,456
-
△3,273
△1,711
△8,724
為替換算差額
△778
△1,133
△47
△95
△369
△2,424
連結除外による減少
△643
△278
△5
△422
△65
△1,415
200
124
△74
7
△7
250
44,091
57,189
3,177
13,965
19,657
138,081
-
-
-
-
24,628
24,628
建設仮勘定からの振替
6,142
12,618
1,709
129
△20,599
-
企業結合による取得
1,117
537
-
-
96
1,751
圧縮記帳(注3)
△91
△428
△11
-
-
△532
減価償却費(注1)
△3,412
△10,342
△1,198
△28
-
△14,981
減損損失(注2)
△522
△501
△5
△350
-
△1,379
売却又は処分
△71
△239
△66
△10
-
△387
売却目的で保有する資産からの振替
1,267
2,427
-
3,234
1,691
8,621
為替換算差額
2,713
5,350
200
620
1,474
10,359
△4
334
△316
△224
-
△211
51,230
66,947
3,487
17,335
26,949
165,950
移行日
(2024年4月1日)
取得
減損損失(注2)
売却又は処分
売却目的で保有する資産への振替
その他
前連結会計年度末
(2025年3月31日)
取得
その他
当連結会計年度末
(2026年3月31日)
土地
建設仮勘定
合計
(注)1.有形固定資産の減価償却費は、連結損益計算書の「売上原価」、「販売費及び一般管理費」及び「その他費
用」に含めております。
2.減損損失については、注記「11.非金融資産の減損」に記載しております。
3.当連結会計年度に行われた圧縮記帳は、省エネルギー投資促進に係る政府補助金です。
この政府補助金に付随する未履行の条件またはその他の偶発事象はありません。
②
取得原価
(単位:百万円)
建物
及び構築物
機械装置
及び運搬具
工具器具
及び備品
移行日
(2024年4月1日)
111,652
269,442
15,781
18,452
10,634
425,964
前連結会計年度末
(2025年3月31日)
106,601
252,303
16,427
14,782
19,694
409,810
当連結会計年度末
(2026年3月31日)
120,297
298,630
17,456
18,111
27,801
482,297
③
土地
建設仮勘定
合計
減価償却累計額及び減損損失累計額
(単位:百万円)
移行日
(2024年4月1日)
前連結会計年度末
(2025年3月31日)
当連結会計年度末
(2026年3月31日)
建物
及び構築物
機械装置
及び運搬具
工具器具
及び備品
63,843
206,535
12,648
803
790
284,620
62,510
195,114
13,250
817
36
271,729
69,066
231,683
13,969
775
851
316,346
土地
建設仮勘定
合計
10.のれん及び無形資産
(1)調整表及び内訳
①
のれん及び無形資産の帳簿価額の増減、取得原価、償却累計額及び減損損失累計額は次のとおりであります。
帳簿価額の増減
(単位:百万円)
無形資産
のれん
顧客関連資産
移行日
(2024年4月1日)
商標権
ソフトウェア
その他
(注1)
合計
21,907
19,209
9,341
2,236
2,817
33,605
取得
-
-
-
-
3,119
3,119
ソフトウェア仮勘定か
らの振替
-
-
-
2,873
△2,873
-
償却費(注2)
-
△1,451
△436
△1,323
△27
△3,239
売却目的で保有する資
産への振替
-
-
-
△9
-
△9
△1,144
△470
△483
△18
△3
△976
-
-
-
73
△1
72
20,763
17,287
8,421
3,832
3,030
32,572
取得
-
-
-
-
3,186
3,186
ソフトウェア仮勘定か
らの振替
-
-
-
1,424
△1,424
-
7,239
6,348
-
-
-
6,348
圧縮記帳(注3)
-
-
-
△44
-
△44
償却費(注2)
-
△2,108
△431
△1,430
△27
△3,998
△4,137
-
-
-
-
-
-
-
-
9
-
9
2,766
2,011
825
71
28
2,936
-
-
-
307
△1
306
26,632
23,538
8,815
4,170
4,794
41,317
為替換算差額
その他
前連結会計年度末
(2025年3月31日)
企業結合による取得
減損損失(注4)
売却目的で保有する資
産からの振替
為替換算差額
その他
当連結会計年度末
(2026年3月31日)
(注)1.「その他」の主な内容は、ソフトウェア仮勘定であります。
2.無形資産の償却費は、連結損益計算書の「売上原価」及び「販売費及び一般管理費」に含めております。
3.当連結会計年度に行われた圧縮記帳は、省エネルギー投資促進に係る政府補助金です。
この政府補助金に付随する未履行の条件またはその他の偶発事象はありません。
4.減損損失については、注記「11.非金融資産の減損」に記載しております。
②
取得原価
(単位:百万円)
無形資産
のれん
顧客関連資産
商標権
ソフトウェア
その他
合計
移行日
(2024年4月1日)
45,781
28,031
11,573
8,959
2,884
51,448
前連結会計年度末
(2025年3月31日)
43,724
27,039
11,053
9,432
3,120
50,645
当連結会計年度末
(2026年3月31日)
56,144
36,507
12,087
11,821
4,919
65,335
③
償却累計額及び減損損失累計額
(単位:百万円)
無形資産
のれん
顧客関連資産
商標権
ソフトウェア
その他
合計
移行日
(2024年4月1日)
23,873
8,821
2,232
6,722
66
17,843
前連結会計年度末
(2025年3月31日)
22,961
9,752
2,632
5,599
89
18,073
当連結会計年度末
(2026年3月31日)
29,512
12,968
3,272
7,651
125
24,017
(2)重要な無形資産
無形資産のうち、移行日、前連結会計年度末及び当連結会計年度末において重要なものは、Blommer Chocolate
Company, LLC及びPROVENCE HUILES S.A.Sの取得に伴い計上した顧客関連資産であります。
(単位:百万円)
移行日
前連結会計年度末当連結会計年度末
(2024年4月1日) (2025年3月31日) (2026年3月31日)
顧客関連資産
Blommer Chocolate
Company, LLC
PROVENCE HUILES
S.A.S
残存償却年数
16,956
15,616
15,491
13年
-
-
6,436
14年
(3)耐用年数を確定できない無形資産
耐用年数を確定できない無形資産の帳簿価額は以下のとおりです。
(単位:百万円)
移行日
(2024年4月1日)
前連結会計年度末
(2025年3月31日)
当連結会計年度末
(2026年3月31日)
商標権
2,924
2,512
2,955
合計
2,924
2,512
2,955
耐用年数を確定できない無形資産の主なものは、HARALD INDÚSTRIA E COMÉRCIO DE ALIMENTOS LTDAの買収時に
取得した商標権であり、事業が継続する限り存続することから、耐用年数を確定できないため、償却しておりませ
ん。
11.非金融資産の減損
(1)減損損失
減損損失の内訳は以下のとおりであります。
前連結会計年度
(自 2024年4月1日
至 2025年3月31日)
建物及び構築物
当連結会計年度
(自 2025年4月1日
至 2026年3月31日)
7
522
機械装置及び運搬具
104
501
工具器具及び備品
1
5
土地
-
350
のれん
-
4,137
前連結会計年度において、大豆加工素材セグメントにおける製造設備について、使用停止の決定に伴い、該当す
る資産の帳簿価額を回収可能価額まで減額し、当該減少額を減損損失として計上しております。その内訳は、建物
及び構築物7百万円、機械装置及び運搬具104百万円、その他1百万円です。減損損失の測定における回収可能価
額は、処分コスト控除後の公正価値により測定しており、当該公正価値のヒエラルキーはレベル3であります。な
お、当該資産は売却や他への転用が困難であるため、処分コスト控除後の公正価値を零として評価しております。
当該減損損失は、連結損益計算書の「売上原価」に含まれております。
当連結会計年度において、全社資産に該当し、各セグメントに配分をしている独身寮・研修所について、売却の
決定に伴い該当する資産の帳簿価額を回収可能価額まで減額し、当該減少額を減損損失として計上しております。
その内訳は、土地350百万円、建物及び構築物334百万円、その他1百万円であります。減損損失の測定における回
収可能価額は、処分コスト控除後の公正価値により測定しており、当該公正価値のヒエラルキーはレベル3であり
ます。処分コスト控除後の公正価値は譲渡契約に基づく予定売却額により算定しております。当該減損損失は、連
結損益計算書の「販売費及び一般管理費」に含まれております。
大豆加工素材セグメントにおける製造設備について、収益性の低下により回収可能性が認められなくなったた
め、該当する資産の帳簿価額を回収可能価額まで減額し、当該減少額を減損損失として計上しております。その内
訳は、建物及び構築物187百万円、機械装置及び運搬具420百万円、その他3百万円です。なお、減損損失の測定に
おける回収可能価額は使用価値により測定しており、将来キャッシュ・フローがマイナスであるため、回収可能価
額を零として評価しております。当該減損損失は、連結損益計算書の「売上原価」に含まれております。
(2)のれん及び耐用年数が確定できない無形資産を含む資金生成単位の減損テスト
のれん及び耐用年数が確定できない無形資産が配分されている資金生成単位については毎期同時期及び減損の兆
候がある場合にはその都度、減損テストを行っております。
各資金生成単位に配分されたのれん及び耐用年数を確定できない無形資産のうち、個別に重要なものは、業務用
チョコレートセグメントに帰属するBlommer Chocolate Company, LLCに係るのれんです。
移行日、前連結会計年度末、当連結会計年度末における当該資金生成単位に配分されたのれんの帳簿価額(減損
損失認識後)は、それぞれ14,444百万円、14,264百万円、10,865百万円です。
個別に重要なのれんが配分された資金生成単位の回収可能価額は、使用価値に基づき算定しております。
使用価値は、過去の経験及び外部からの情報を反映し、経営者が承認した5年間の事業計画を基礎とした見積将
来キャッシュ・フローを現在価値に割り引いて算定しております。
当該事業計画は、販売数量の拡大見込みや、原材料価格の変動及びそれに伴う販売価格の改定など、計画値に大
きな影響を与える主要な仮定に基づいて策定しております。
各資金生成単位に適用される割引率は、税引前加重平均資本コスト等を基礎に算定しており、当連結会計年度の
減損テストに使用した割引率は8.8%(前連結会計年度9.4%)です。
なお、事業計画を超える期間については、成長率に基づき、将来キャッシュ・フローの見積りを行っておりま
す。
成長率は、資金生成単位が属する市場の長期平均成長率を基礎として決定しております。当連結会計年度の使用
価値の測定に使用した成長率は2.2%(前連結会計年度2.1%)です。
当連結会計年度において、Blommer Chocolate Company, LLCに係るのれんについて、需要低迷の長期化による販
売数量の減少や管理強化に伴う固定費増加等を踏まえ、事業計画を見直したうえで減損テストを実施した結果、回
収可能価額が帳簿価額を下回ったため、4,137百万円の減損損失を計上しました。当該減損損失は、連結損益計算
書の「その他費用」に含まれております。
12.コミットメント
有形固定資産の取得に係る重要なコミットメントは、前連結会計年度末4,020百万円、当連結会計年度末4,020百万
円であります。
なお、移行日においては、有形固定資産の取得に係る重要なコミットメントはありません。
13.リース
(借手側)
当社グループは、主に資産の入替に係る柔軟性の確保、資産管理に係る事務負担の軽減や資金の効率的な運用等
を目的として、土地、建物(オフィス・スペース)、社宅施設、各種設備等の賃貸借契約を締結しております。こ
れらの契約のうち、特定された資産の使用を支配する権利を一定期間にわたり対価と交換に移転するものについて
は、リース又はリースを含んだものであると判断し、リースの開始日において使用権資産及びリース負債を認識し
ております。ただし、短期リース及び原資産の価値が少額であるリースについては、当該リースに関連したリース
料を、費用として処理しております。延長オプション及び解約オプションは、主に不動産のリースに含まれ、一部
の不動産賃貸借においては借手が繰り返し延長オプションを行使することが可能な契約となっています。当社はそ
れらの不動産を事業に活用する上で、必要に応じて延長オプションの行使を判断しています。なお、当社による行
使が合理的に確実でない場合には、オプション期間に関連した支払いはリース負債の測定に含めていません。
なお、当社グループにおいては、契約しているにもかかわらず、まだ開始していないリースに重要性はありませ
ん。
使用権資産の帳簿価額の内訳は、以下のとおりです。
(単位:百万円)
移行日
(2024年4月1日)
前連結会計年度末
(2025年3月31日)
当連結会計年度末
(2026年3月31日)
建物及び構築物
3,676
3,269
7,230
機械装置及び運搬具
2,531
2,041
1,412
土地
3,741
3,902
4,473
99
44
83
10,048
9,257
13,200
原資産の種類
その他
合計
前連結会計年度及び当連結会計年度における使用権資産の増加額、リースに関連する費用及びキャッシュ・アウ
ト・フローは、以下のとおりであります。
(単位:百万円)
前連結会計年度
(自 2024年4月1日
至 2025年3月31日)
当連結会計年度
(自 2025年4月1日
至 2026年3月31日)
使用権資産の減価償却費
建物及び構築物
1,064
1,505
機械装置及び運搬具
981
601
土地
249
242
その他
31
26
使用権資産の減価償却費合計
2,326
2,376
リース負債に係る支払利息
299
385
短期リースに係る費用
227
188
少額資産のリースに係る費用
1,589
982
リースに係るキャッシュ・アウト・フロー
5,057
4,382
使用権資産の増加額(注1)
2,406
7,462
(注)1.当連結会計年度における使用権資産の増加額には、企業結合による増加2,864百万円が含まれております。
2.移行日、前連結会計年度末及び当連結会計年度末におけるリース負債の満期分析は、「35.金融商品」に記載
のとおりであります。
14.主要な子会社
(1)主要な子会社に関する情報
当社の主要な子会社は「第1
企業の概況
4
関係会社の状況」に記載のとおりです。
(2)重要な非支配持分がある子会社に関する情報
前連結会計年度及び当連結会計年度において、当社の子会社のうち重要性のある非支配持分を有する会社はあり
ません。
15.持分法で会計処理されている投資
(1)関連会社
①
重要な関連会社
当社グループにとって個々に重要性のある関連会社はありません。
②
個々に重要性のない関連会社
個々に重要性のない関連会社に対する当社グループの投資の帳簿価額、並びに当期利益、その他の包括利益及
び当期包括利益に対する持分取込額は次のとおりであります。
(単位:百万円)
移行日
(2024年4月1日)
前連結会計年度末
(2025年3月31日)
当連結会計年度末
(2026年3月31日)
2,015
2,929
4,610
投資の帳簿価額
(単位:百万円)
前連結会計年度
(自 2024年4月1日
至 2025年3月31日)
当連結会計年度
(自 2025年4月1日
至 2026年3月31日)
当期利益に対する持分取込額
203
82
その他の包括利益に対する持分取込額
133
119
当期包括利益に対する持分取込額
336
201
(2)共同支配企業
①
重要な共同支配企業
当社グループにとって、重要性のある共同支配企業はRITO Partnershipです。
RITO Partnershipの主要な事業場所は米国であり、主要な事業は植物性油脂の製造販売であります。
同社の要約財務諸表と、同社に対する当社グループの投資の帳簿価額との調整表は次のとおりであります。な
お、当該要約財務諸表は、当社グループの会計方針に基づき、同社の財務諸表に調整を加え、作成しておりま
す。
(単位:百万円)
移行日
(2024年4月1日)
前連結会計年度末
(2025年3月31日)
当連結会計年度末
(2026年3月31日)
所有持分割合
50.0%
50.0%
50.0%
流動資産
2,076
1,987
914
637
842
357
非流動資産
2,068
2,253
2,587
流動負債
210
137
101
12
12
13
41
28
16
41
28
16
資本
3,892
4,075
3,383
資本の当社グループの持分
1,946
2,037
1,691
のれん及び連結調整
4,918
4,685
4,744
投資の帳簿価額
6,864
6,722
6,436
うち、現金及び現金同等物
うち、金融負債(営業債務及びその他の
債務並びに引当金を除く)
非流動負債
うち、金融負債(営業債務及びその他の
債務並びに引当金を除く)
(単位:百万円)
(自
至
前連結会計年度
2024年4月1日
2025年3月31日)
売上高
(自
至
当連結会計年度
2025年4月1日
2026年3月31日)
4,584
2,176
減価償却費及び償却費
748
771
金融収益
-
-
金融費用
-
-
法人所得税費用
-
-
当期利益(△は損失)
724
△1,418
△159
836
564
△582
当期利益(△は損失)
362
△709
その他の包括利益(△は損失)
△79
418
当期包括利益(△は損失)
282
△291
当社グループが受け取った配当金
419
-
その他の包括利益(△は損失)
当期包括利益(△は損失)
当社グループの持分:
②
個々に重要性のない共同支配企業
個々に重要性のない共同支配企業に対する当社グループの投資の帳簿価額、並びに当期利益、その他の包括利
益及び当期包括利益に対する持分取込額は次のとおりであります。
(単位:百万円)
移行日
(2024年4月1日)
前連結会計年度末
(2025年3月31日)
当連結会計年度末
(2026年3月31日)
2,253
3,773
5,054
投資の帳簿価額
(単位:百万円)
前連結会計年度
(自 2024年4月1日
至 2025年3月31日)
当期利益に対する持分取込額
その他の包括利益に対する持分取込額
当期包括利益に対する持分取込額
当連結会計年度
(自 2025年4月1日
至 2026年3月31日)
1,124
866
411
418
1,536
1,284
16.その他の金融資産
(1)その他の金融資産の内訳
(単位:百万円)
移行日
(2024年4月1日)
前連結会計年度末
(2025年3月31日)
当連結会計年度末
(2026年3月31日)
未収入金
484
865
540
その他
2,518
2,669
2,442
2,421
353
2,180
639
503
398
6,251
5,313
5,965
12,314
9,704
11,527
流動資産
2,888
1,304
2,736
非流動資産
9,426
8,400
8,790
償却原価で測定する金融資産に分類したもの
純損益を通じて公正価値で測定する金融資産
に分類したもの
デリバティブ資産
出資金
その他の包括利益を通じて公正価値で測定す
る金融資産に分類したもの
株式
合計
(2)その他の包括利益を通じて公正価値で測定するものとして指定した資本性金融商品
その他の金融資産に含まれる資本性金融商品は、当社グループが戦略的目的で長期にわたり保有することを意図
している株式であるため、すべてその他の包括利益を通じて公正価値で測定する金融資産(資本性金融商品)とし
て指定しております。当該金融資産の主な銘柄及び公正価値は次のとおりであります。
(単位:百万円)
移行日
(2024年4月1日)
前連結会計年度末
(2025年3月31日)
当連結会計年度末
(2026年3月31日)
1,132
1,051
1,315
㈱meito
534
598
893
理研ビタミン㈱
257
241
287
㈱cotta
274
225
283
㈱ヤクルト本社
679
-
-
3,371
3,195
3,186
6,251
5,313
5,965
銘柄
東洋水産㈱
その他
合計
(3)その他の包括利益を通じて公正価値で測定する資本性金融商品の認識の中止
保有資産の効率化及び有効活用を図るため、その他の包括利益を通じて公正価値で測定する金融資産の売却(認
識の中止)を行っております。
その他の包括利益を通じて公正価値で測定する金融資産の認識中止時点の公正価値、累積利得又は損失は、次の
とおりであります。
(単位:百万円)
(自
至
前連結会計年度
2024年4月1日
2025年3月31日)
認識中止時点の公正価値
累積利得又は損失
(自
至
当連結会計年度
2025年4月1日
2026年3月31日)
1,111
344
541
286
なお、上記累積利得又は損失は、税効果考慮前の金額であり、前連結会計年度及び当連結会計年度において、処
分に伴って利益剰余金へ振り替えた税効果考慮後のその他の包括利益の累積利得又は損失は、それぞれ408百万円
(利得)及び198百万円(利得)です。
17.その他の資産
その他の資産の内訳は、次のとおりであります。
(単位:百万円)
移行日
(2024年4月1日)
前連結会計年度末
(2025年3月31日)
当連結会計年度末
(2026年3月31日)
前渡金
5,763
1,516
1,886
前払費用
1,690
2,352
2,311
未収法人税等
3,091
2,816
3,345
未収消費税等
691
1,474
2,685
2,814
2,357
2,529
14,051
10,517
12,759
13,427
10,197
12,270
624
319
488
14,051
10,517
12,759
その他
合計
流動資産
非流動資産
合計
18.法人所得税
(1)繰延税金資産及び繰延税金負債
繰延税金資産及び繰延税金負債の発生の主な原因別の内訳及び増減内容は次のとおりであります。
前連結会計年度(自
2024年4月1日
至
2025年3月31日)
(単位:百万円)
2024年
4月1日
残高
純損益を
通じて認識
その他の包括
利益を通じて
認識
2025年
3月31日
残高
その他
(注)
繰延税金資産
未払賞与
625
100
-
△9
716
税務上の繰越欠損金
4,783
8,434
-
△228
12,989
棚卸資産未実現利益
325
569
-
-
895
減損損失
1,674
△555
-
△10
1,108
リース負債
2,281
△95
-
△37
2,148
その他
4,825
1,881
246
△149
6,803
14,517
10,335
246
△436
24,662
減価償却費及び償却費
△6,701
299
-
113
△6,288
時価評価による評価差額
△8,417
309
-
225
△7,883
在外子会社等の留保利益
△1,973
△5
-
△57
△2,037
使用権資産
△2,291
147
-
36
△2,108
その他
△7,263
△81
392
48
△6,904
繰延税金負債合計
△26,648
669
392
364
△25,221
繰延税金資産(負債)の純額
△12,131
11,004
638
△71
△559
繰延税金資産合計
繰延税金負債
(注)
その他の内訳は、主として企業結合・在外営業活動体による換算差額が含まれております。
当連結会計年度(自
2025年4月1日
至
2026年3月31日)
(単位:百万円)
2025年
4月1日
残高
その他の包括
利益を通じて
認識
純損益を
通じて認識
2026年
3月31日
残高
その他
(注)
繰延税金資産
未払賞与
716
253
-
3
974
税務上の繰越欠損金
12,989
△6,973
-
485
6,501
棚卸資産未実現利益
895
△3
-
-
892
減損損失
1,108
1
-
57
1,167
リース負債
2,148
495
-
539
3,183
その他
6,803
245
△227
459
7,281
24,662
△5,980
△227
1,545
19,999
減価償却費及び償却費
△6,288
447
-
△487
△6,329
時価評価による評価差額
△7,883
527
-
△2,431
△9,786
在外子会社等の留保利益
△2,037
△423
-
△215
△2,676
使用権資産
△2,108
△572
-
△511
△3,192
その他
△6,904
4,260
△642
△200
△3,487
△25,221
4,239
△642
△3,847
△25,472
△559
△1,741
△870
△2,301
△5,472
繰延税金資産合計
繰延税金負債
繰延税金負債合計
繰延税金資産(負債)の純額
(注)
その他の内訳は、主として企業結合・在外営業活動体による換算差額が含まれております。
連結財政状態計算書上の繰延税金資産及び繰延税金負債は次のとおりであります。
(単位:百万円)
移行日
(2024年4月1日)
前連結会計年度末
(2025年3月31日)
当連結会計年度末
(2026年3月31日)
繰延税金資産
2,496
10,218
5,398
繰延税金負債
△14,627
△10,777
△10,870
繰延税金資産(負債)の純額
△12,131
△559
△5,472
繰延税金資産を認識していない将来減算一時差異、税務上の繰越欠損金の金額は次のとおりであります。
(単位:百万円)
移行日
(2024年4月1日)
前連結会計年度末
(2025年3月31日)
当連結会計年度末
(2026年3月31日)
将来減算一時差異
1,971
2,045
1,271
税務上の繰越欠損金
8,229
4,503
26,808
繰延税金資産を認識していない税務上の繰越欠損金の繰越期限は次のとおりであります。
(単位:百万円)
移行日
(2024年4月1日)
前連結会計年度末
(2025年3月31日)
当連結会計年度末
(2026年3月31日)
947
-
-
1年超5年以内
2,780
904
-
5年超
4,500
3,599
26,808
8,229
4,503
26,808
1年以内
合計
繰延税金負債を認識していない将来加算一時差異は次のとおりであります。
(単位:百万円)
移行日
(2024年4月1日)
前連結会計年度末
(2025年3月31日)
当連結会計年度末
(2026年3月31日)
13,095
12,371
19,169
子会社等に対する投資に係る一時差異の合計
額
(注)当社は子会社等に対する投資に係る将来加算一時差異については、報告期間末において配当することが予定され
ている未分配利益に係るものを除き、繰延税金負債を認識しておりません。これは、当社グループが一時差異を
解消する時期をコントロールでき、かつ予測可能な期間内に当該一時差異が解消しない可能性が高いためです。
(2)法人所得税費用
法人所得税費用の内訳は、次のとおりです。
(単位:百万円)
(自
至
前連結会計年度
2024年4月1日
2025年3月31日)
当期税金費用
(自
至
当連結会計年度
2025年4月1日
2026年3月31日)
12,517
10,178
△10,181
△2,865
税率変更に伴う調整額
△26
△313
繰延税金資産の回収可能性の評価
△796
4,919
繰延税金費用合計
△11,004
1,741
法人所得税費用合計
1,512
11,919
繰延税金費用
一時差異等の発生及び解消
(3)法定実効税率の調整
各連結会計年度における法定実効税率と平均実際負担税率との調整は次のとおりです。平均実際負担税率は税引
前当期利益に対する法人所得税の負担割合を表示しております。
(単位:%)
前連結会計年度末
(自 2024年4月1日
至 2025年3月31日)
法定実効税率
当連結会計年度末
(自 2025年4月1日
至 2026年3月31日)
30.6
30.6
受取配当金等一時差異でない項目
△28.0
△10.5
試験研究費等の税額控除
△12.4
△5.1
未認識の繰延税金資産の増減等
△10.3
20.9
海外子会社との税率差
△8.4
△9.8
受取配当金の相殺消去
43.6
19.0
関係会社株式売却損益の連結調整
7.0
-
のれんの減損損失
-
5.4
△0.4
0.3
21.9
50.9
(調整)
その他
法人所得税費用の平均実際負担税率
(注)当社グループは日本における法人税、住民税及び事業税に基づき、前連結会計年度及び当連結会計年度の法定実
効税率を主に30.6%として算出しております。ただし、在外子会社については、その所在地における法人税等が
課されております。
(4)グローバル・ミニマム課税
日本においては令和5年度税制改正において、グローバル・ミニマム課税に対応する法人税が創設され、それに
係る規定を含めた税制改正法(「所得税法等の一部を改正する法律」(令和5年法律第3号))(以下「改正法人
税法」という。)が2023年3月28日に成立しております。改正法人税法では、BEPSのグローバル・ミニマム課税ル
ールのうち、所得合算ルール(IIR)が導入されており、2024年4月1日以後開始事業年度より、日本に所在する
親会社の子会社等の税負担が最低税率(15%)に至るまで、日本に所在する親会社に対して追加で上乗せ課税され
ることになります。これらの法制による当連結会計年度の当社の連結財務諸表への影響は軽微です。
なお、当社グループは、第2の柱の法人所得税に係る繰延税金資産及び繰延税金負債について、IAS第12号「法
人所得税」が要求する一時的な例外規定を適用しており、認識及び開示を行っておりません。
19.営業債務
営業債務の内訳は次のとおりであります。
(単位:百万円)
移行日
(2024年4月1日)
前連結会計年度末
(2025年3月31日)
当連結会計年度末
(2026年3月31日)
134
123
108
40,879
46,415
67,974
41,013
46,538
68,082
支払手形
買掛金
合計
(注)営業債務は償却原価で測定する金融負債に分類しております。
20.社債及び借入金
(1)社債及び借入金の内訳
借入金の内訳は、以下のとおりです。
(単位:百万円)
移行日
前連結会計年度末当連結会計年度末平均利率
(2024年4月1日) (2025年3月31日) (2026年3月31日) (%)
返済期限
短期借入金
48,592
172,944
97,393
3.2
-
コマーシャル・ペーパー
10,000
20,000
20,000
1.1
-
1年内返済予定の長期借入金
5,781
2,339
41,147
2.3
-
1年内償還予定の社債
34,989
-
-
-
-
長期借入金
(1年内返済予定を除く)
43,496
57,625
78,980
2.0 2027年~2054年
社債
(1年内償還予定を除く)
5,978
30,811
30,859
-
-
合計
148,837
283,721
268,381
-
-
流動負債
99,362
195,284
158,541
非流動負債
49,474
88,437
109,840
148,837
283,721
268,381
合計
(注)1.社債及び借入金は償却原価で測定する金融負債に分類しております。
2.社債及び借入金の期日別残高については、注記「35 金融商品」をご参照ください。
3.平均利率については、借入金の当連結会計年度の期末残高に対する加重平均利率を記載しております。
4.連結財政状態計算書における短期借入金はコマーシャル・ペーパーを含んだ金額で表示しております。
社債の内訳は、次のとおりであります。なお、(
)内の金額は1年以内に償還予定の金額であります。
(単位:百万円)
会社名
銘柄
不二製
油(株)
第6回無担保普通社債
不二製
油(株)
不二製
油(株)
合計
発行
移行日
前連結会計年度末当連結会計年度末利率
担保償還期限
年月日 (2024年4月1日) (2025年3月31日) (2026年3月31日) (%)
2022年
7月20日
第1回利払繰延条項・
2019年
期限前償還条項付無担
6月13日
保社債(劣後特約付)
第2回利払繰延条項・
2024年
期限前償還条項付無担
4月25日
保社債(劣後特約付)
-
-
5,978
34,989
(34,989)
-
40,967
(34,989)
5,984
5,991
0.4
無
-
-
0.8
無
24,826
24,868
1.6
無
30,811
30,859
-
-
2027年
7月20日
2024年
6月13日
2054年
4月25日
-
(2)担保提供資産
移行日、前連結会計年度末及び当連結会計年度末における担保提供資産は、次のとおりであります。
(単位:百万円)
移行日
(2024年4月1日)
前連結会計年度末
(2025年3月31日)
当連結会計年度末
(2026年3月31日)
建物及び構築物
2,860
-
494
機械装置及び運搬具
1,029
-
-
土地
1,301
-
-
5,191
-
494
合計
移行日、前連結会計年度末及び当連結会計年度末における被担保債務は、以下のとおりであります。
(単位:百万円)
移行日
(2024年4月1日)
前連結会計年度末
(2025年3月31日)
当連結会計年度末
(2026年3月31日)
短期借入金
332
-
-
1年内返済予定の長期借入金
-
-
28
長期借入金
593
-
477
925
-
506
合計
21.その他の金融負債
その他の金融負債の内訳は次のとおりであります。
(単位:百万円)
移行日
(2024年4月1日)
前連結会計年度末
(2025年3月31日)
当連結会計年度末
(2026年3月31日)
未払金
2,068
1,771
2,257
設備未払金
3,476
6,193
4,562
505
830
760
97
1,297
559
6,148
10,093
8,140
6,148
10,093
8,140
-
-
-
6,148
10,093
8,140
償却原価で測定する金融負債に分類したもの
その他
純損益を通じて公正価値で測定する金融負債
に分類したもの
デリバティブ負債
合計
流動負債
非流動負債
合計
22.その他の負債
その他の負債の内訳は、次のとおりであります。
(単位:百万円)
移行日
(2024年4月1日)
前連結会計年度末
(2025年3月31日)
当連結会計年度末
(2026年3月31日)
未払費用
3,630
3,743
4,054
未払賞与
3,444
3,987
5,329
未払消費税等
2,617
1,070
1,287
未払有給休暇
2,234
2,216
2,559
その他
6,186
5,659
4,640
18,115
16,677
17,871
流動負債
15,589
14,063
15,231
非流動負債
2,526
2,613
2,640
18,115
16,677
17,871
合計
合計
23.偶発事象
(保証債務)
当社グループは、以下の関係会社による銀行借入等に関し、次のとおり債務保証を行っております。
(単位:百万円)
移行日
(2024年4月1日)
前連結会計年度末
(2025年3月31日)
当連結会計年度末
(2026年3月31日)
1,948
790
206
499
440
97
2,447
1,230
303
UNIFUJI SDN. BHD.(注1)
FREYBADI(THAILAND) CO.,LTD.(注2)
合計
(注)1.移行日残高のうち833百万円は当社の保証に対し他社から再保証を受けており、281百万円は他社の保証に対
し当社から再保証を行っております。
前連結会計年度末残高のうち200百万円は当社の保証に対し他社から再保証を受けており、389百万円は他社
の保証に対し当社から再保証を行っております。
当連結会計年度末残高のうち71百万円は当社の保証に対し他社から再保証を受けており、63百万円は他社の
保証に対し当社から再保証を行っております。
2.移行日残高のうち249百万円は当社の保証に対し他社から再保証を受けております。
前連結会計年度末残高のうち220百万円は当社の保証に対し他社から再保証を受けております。
当連結会計年度末残高のうち48百万円は当社の保証に対し他社から再保証を受けております。
24.従業員給付
(退職後給付)
(1) 制度の概要
当社及び連結子会社は、従業員の退職給付に充てるため、積立型、非積立型の確定給付制度及び確定拠出制度を
採用しております。
確定給付企業年金制度はすべて積立型制度であり、従業員の勤続年数や職能・職務等級、給与水準等に基づいた
一時金及び年金を支給しております。
退職一時金制度では、退職給付として、従業員の勤続年数や職能・職務等級、給与水準等に基づいた一時金を支
給しております。
当社及び一部の連結子会社は、確定給付制度の一部について選択制の確定拠出制度を設けております。
日本では、確定給付企業年金法に基づき確定給付制度を運用しております。確定給付企業年金制度は、法令に従
い、従業員の同意を得て、受給資格、給付内容、掛金負担等年金制度の内容を規定した年金規約を定め、厚生労働
大臣の承認を受けております。規約に基づき、掛金の払込や制度資産の運用等に関して、年金運用受託機関と契約
を締結し、制度を運営しております。年金運用受託機関は、契約に基づいて制度資産の運用等を行う受託責任を負
っております。
確定給付企業年金制度における制度資産は健全な運用を基礎としておりますが、金融商品に係る投資リスクに晒
されております。また、確定給付制度債務は割引率等の様々な年金数理計算上の仮定に基づき測定されているた
め、それらの仮定の変動によるリスクに晒されております。
確定拠出制度は、雇用主が一定額の掛金を他の独立した企業に拠出し、その拠出額以上の支払について法的又は
推定的義務を負わない退職後給付制度であります。
また、一部の連結子会社は、中小企業退職金共済制度に加入しております。
(2) 確定給付制度
①
連結財政状態計算書において認識した金額
連結財政状態計算書で認識した金額は、次のとおりです。
(単位:百万円)
移行日
(2024年4月1日)
前連結会計年度末
(2025年3月31日)
当連結会計年度末
(2026年3月31日)
15,547
13,706
12,373
△22,358
△21,225
△22,014
△6,810
△7,518
△9,641
8,264
8,806
10,803
非積立型の確定給付制度債務の現在価値(制
度資産なし)
491
457
515
連結財政状態計算書に認識した確定給付に係
る負債(資産)の純額
1,945
1,745
1,678
退職給付に係る負債
1,985
1,784
1,678
退職給付に係る資産
△39
△39
-
積立型の確定給付制度債務の現在価値(制度
資産あり)
制度資産の公正価値
積立状況
資産上限額の影響
②
確定給付負債の純額
確定給付負債の純額及びその構成要素の期首及び期末残高の調整表は次のとおりです。
(単位:百万円)
確定給付制度債務
2024年4月1日
残高
制度資産
確定給付負債の純額
16,039
22,358
△6,318
当期勤務費用
504
-
504
利息費用(収益)
295
169
125
過去勤務費用
-
-
-
-
△563
563
数理計算上の差異(人口統計上の仮定)
△17
-
△17
数理計算上の差異(財務上の仮定)
△846
-
△846
実績修正
△271
-
△271
為替換算差額
△41
△21
△19
-
637
△637
制度からの支払額
△1,354
△1,251
△103
連結範囲の異動
△144
△103
△41
14,163
21,225
△7,061
当期勤務費用
637
-
637
利息費用(収益)
354
510
△155
過去勤務費用
△85
-
△85
-
659
△659
数理計算上の差異(人口統計上の仮定)
△13
-
△13
数理計算上の差異(財務上の仮定)
△962
-
△962
実績修正
△215
-
△215
為替換算差額
235
158
77
事業主による制度への拠出額
-
640
△640
△1,262
△1,180
△82
37
-
37
12,889
22,014
△9,125
確定給付負債の純額の再測定
制度資産に係る収益
事業主による制度への拠出額
2025年3月31日
残高
確定給付負債の純額の再測定
制度資産に係る収益
制度からの支払額
連結範囲の異動
2026年3月31日
残高
③
制度資産の種類別の公正価値
制度資産の主な種類別における、制度資産の公正価値は次のとおりです。
(単位:百万円)
移行日
(2024年4月1日)
前連結会計年度末
(2025年3月31日)
当連結会計年度末
(2026年3月31日)
活発な市場での市場価格
活発な市場での市場価格
活発な市場での市場価格
あり
合計
あり
合計
あり
なし
なし
なし
合計
株式
4,752
-
4,752
4,168
-
4,168
4,432
-
4,432
債券
7,859
-
7,859
7,435
-
7,435
7,395
-
7,395
現金及び現金同等物
884
-
884
888
-
888
897
-
897
生命保険一般勘定
-
3,892
3,892
-
4,310
4,310
-
4,664
4,664
その他
-
4,969
4,969
-
4,423
4,423
-
4,624
4,624
13,496
8,861
22,358
12,491
8,734
21,225
12,725
9,289
22,014
制度資産合計
制度資産の運用は、年金給付等の支払を将来にわたり確実に行うため、許容されるリスクのもとで必要とされ
る総合収益を長期的に確保することを目的としております。この目的を達成するため、投資対象としてふさわし
い資産を選択するとともに、その期待収益率及びリスク等を考慮した上で、将来にわたる最適な資産の組み合わ
せである基本資産配分を策定しております。また、基本資産配分は、必要に応じて見直しを行うものとしており
ます。
事業主は、各従業員の標準給与に一定の割合を乗じた掛金を確定給付企業年金制度に拠出しております。掛金
は、年金や一時金支給のための標準掛金、過去勤務債務を償却するための特別掛金及び確定給付企業年金制度運
営のための事務費掛金等から構成されております。事業主は確定給付企業年金制度へ掛金を納付する義務を負っ
ております。
確定給付企業年金制度は法令及び規約に基づき、将来に渡って財政の均衡を保つことができるように、少なく
とも5年ごとに掛金の額を再計算しております。また、確定給付企業年金制度は制度資産が計画どおり積み立て
られているかの検証や、過去勤務期間の給付に見合う制度資産が積み立てられているかの検証を毎年行っており
ます。検証の結果、積立不足が生じた場合には、特別掛金の拠出等により積立不足の解消に努めております。
なお、翌連結会計年度における制度資産への拠出予定額は、636百万円であります。
④
資産上限額の影響
資産上限額の影響の変動は、次のとおりです。
(単位:百万円)
前連結会計年度
(自 2024年4月1日
至 2025年3月31日)
期首における影響額
利息収益
当連結会計年度
(自 2025年4月1日
至 2026年3月31日)
8,264
8,806
128
201
414
1,795
8,806
10,803
確定給付制度の再測定
資産上限額の影響の変動
期末における影響額
⑤
重要な数理計算上の仮定
確定給付制度債務の測定に用いられる主な数理計算上の仮定は、次のとおりです。
移行日
(2024年4月1日)
前連結会計年度末
(2025年3月31日)
当連結会計年度末
(2026年3月31日)
2.0%
2.6%
3.5%
割引率
(加重平均値)
⑥
数理計算上の仮定の感応度分析
他の仮定に変更がないとして、以下に示された割合で割引率が変動した場合、確定給付制度債務は次のとおり
変動します。感応度分析はその他の仮定に変更がないことを前提としておりますが、実際には他の仮定の変化が
感応度分析に影響する可能性があります。
(単位:百万円)
前連結会計年度末
(2025年3月31日)
当連結会計年度末
(2026年3月31日)
割引率
0.5%上昇した場合
△582
△475
0.5%下落した場合
552
482
⑦
確定給付制度の満期構成に関する情報
前連結会計年度及び当連結会計年度における確定給付制度債務の加重平均デュレーションは、それぞれ14.3年
及び14.4年です。
(3) 確定拠出制度
前連結会計年度及び当連結会計年度における確定拠出制度への要拠出額等に係る費用は、それぞれ870百万円及
び959百万円です。
25.株式報酬
当社グループは中長期の業績及び企業価値を向上させることを目的として、当社グループの取締役等に対する株式
報酬制度「株式給付信託(BBT(=Board Benefit Trust))」を導入しております。
(1)制度の概要
本制度は、当社が金銭を拠出することにより設定する信託(以下「本信託」という。)が当社株式を取得し、当
社が取締役及び執行役員に付与するポイントの数に相当する数の当社株式が本信託を通じて取締役及び執行役員に
対して交付されるという株式報酬制度です。
また、本制度においては、2026年3月31日に終了する事業年度から2028年3月31日に終了する事業年度までの3
事業年度の間に在任する当社取締役及び執行役員に対して当社株式を交付するもので、当社株式の給付を受ける時
期は、原則として対象役員の退任時となります。なお、本制度は株式を交付するものであるため、権利行使価格は
ありません。
(2)株式報酬費用
前連結会計年度及び当連結会計年度において当該株式報酬制度に関して計上された費用は、それぞれ4百万円及
び36百万円であります。株式報酬費用は「販売費及び一般管理費」に計上されております。
(3)付与されたポイントの公正価値
付与日における公正価値は観察可能な市場価格を基礎として測定しております。
(単位:円)
項目
前連結会計年度
(自 2024年4月1日
至 2025年3月31日)
当連結会計年度
(自 2025年4月1日
至 2026年3月31日)
加重平均公正価値
2,907
-
(4)ポイント数の期中増減
各連結会計年度における、ポイント増減内容は次のとおりです。
(単位:ポイント)
項目
前連結会計年度
(自 2024年4月1日
至 2025年3月31日)
当連結会計年度
(自 2025年4月1日
至 2026年3月31日)
期首残高
14,994
10,048
ポイント付与による増加
4,805
-
ポイント失効による減少
-
-
ポイント行使による減少
9,751
8,640
期末残高
10,048
1,408
26.資本及びその他の資本項目
(1)資本金
当社の授権株式数、発行済株式数は次のとおりであります。なお、当社が発行する株式はすべて無額面の普通株
式であり、発行済株式は全額払込済みです。
(単位:株)
前連結会計年度末
(2025年3月31日)
授権株式数
当連結会計年度末
(2026年3月31日)
357,324,000
357,324,000
87,569,383
87,569,383
-
-
87,569,383
87,569,383
発行済株式数
期首:
期中増減:
期末:
(単位:株)
株式の種類
前連結会計年度末
(2025年3月31日)
当連結会計年度末
(2026年3月31日)
自己株式(普通株式)
自己株式(普通株式)
期首:
期中増減(注1):
期末:
1,604,957
1,595,432
△9,525
△8,536
1,595,432
1,586,896
(注)1.期中増減の主な要因は、業績連動型株式報酬制度に係る信託からの株式交付による減少であります。
(2)資本剰余金
日本における会社法(以下「会社法」という。)では、株式の発行に対しての払込み又は給付の2分の1以上を
資本金に組み入れ、残りは資本剰余金に含まれている資本準備金に組み入れることが規定されております。また、
会社法では、資本準備金は株主総会の決議により、資本金に組み入れることができます。
(3)利益剰余金
会社法では、剰余金の配当として支出する金額の10分の1を、資本準備金及び利益準備金の合計額が資本金の4
分の1に達するまで資本準備金又は利益準備金として積み立てることが規定されております。積み立てられた利益
準備金は、欠損填補に充当できます。また、株主総会の決議をもって、利益準備金を取り崩すことができます。
(4)その他の資本の構成要素
その他の資本の構成要素の内容は次のとおりであります。
①
確定給付制度の再測定
確定給付制度債務に係る数理計算上の差異、制度資産に係る収益(利息収益に含まれる金額を除く)及び資産
上限額の影響(利息収益に含まれる金額を除く)の変動額であります。
②
その他の包括利益を通じて公正価値で測定する金融資産の公正価値の純変動
その他の包括利益を通じて公正価値で測定する金融資産の公正価値の純変動の累積額であります。
③
キャッシュ・フロー・ヘッジ
キャッシュ・フロー・ヘッジにおけるヘッジ手段に係る利得又は損失の有効部分のうち、純損益への組替調整
又は棚卸資産などヘッジ対象取引の下で取得された非金融資産の帳簿価額に振り替えられていないものの残額で
あります。
④
在外営業活動体の換算差額
在外営業活動体の財務諸表の換算から生じる為替換算差額であります。
その他の資本の構成要素の内訳及び増減内容は、次のとおりであります。
(単位:百万円)
純損益に振り替えられる
ことのない項目
純損益に振り替えられる
可能性のある項目
確定給付制度の
再測定
その他の包括利
益を通じて公正
価値で測定する
資本性金融資産
の公正価値の純
変動
-
2,695
726
39,425
42,846
税効果調整前
156
138
94
△6,372
△5,982
組替調整額
-
-
△54
-
△54
税効果額
△38
6
△33
-
△65
税効果調整後
118
145
6
△6,372
△6,101
持分法適用会社におけるその
他の包括利益に対する持分
△0
-
-
465
465
非支配持分への帰属
△16
-
△3
248
229
-
-
△1,290
-
△1,290
△101
△408
-
-
△509
非支配持分との資本取引
-
-
-
606
606
2025年3月31日残高
-
2,432
△560
34,373
36,245
税効果調整前
55
992
2,156
23,720
26,925
組替調整額
-
-
207
-
207
税効果額
△5
△325
△717
-
△1,048
税効果調整後
49
667
1,646
23,720
26,085
持分法適用会社におけるその
他の包括利益に対する持分
△1
-
-
955
954
非支配持分への帰属
△24
-
-
△147
△171
-
-
△331
-
△331
利益剰余金への振替
△23
△198
-
-
△221
2026年3月31日残高
-
2,902
754
58,903
62,560
2024年4月1日残高
合計
キャッシュ
・フロー・
ヘッジ
在外営業活動体
の換算差額
当期発生額
ヘッジ対象の非金融資産への
振替
利益剰余金への振替
当期発生額
ヘッジ対象の非金融資産への
振替
27.配当金
(1)配当金支払額
前連結会計年度(自
決議
2024年4月1日
株式の種類
至
2025年3月31日)
配当金の総額
(単位:百万円)
1株当たり配当額
(単位:円)
基準日
効力発生日
2024年6月27日
定時株主総会
普通株式
2,237
26.00
2024年3月31日
2024年6月28日
2024年11月11日
取締役会
普通株式
2,237
26.00
2024年9月30日
2024年12月10日
(注)1.2024年6月27日定時株主総会決議による配当金の総額には、株式報酬信託が保有する当社株式に対する配当
金2百万円が含まれております。
2.2024年11月11日取締役会決議による配当金の総額には、株式報酬信託が保有する当社株式に対する配当金2
百万円が含まれております。
当連結会計年度(自
決議
2025年6月27日
定時株主総会
2025年11月11日
取締役会
2025年4月1日
至
2026年3月31日)
配当金の総額
(単位:百万円)
1株当たり配当額
(単位:円)
普通株式
2,237
普通株式
2,241
株式の種類
基準日
効力発生日
26.00
2025年3月31日
2025年6月30日
26.00
2025年9月30日
2025年12月10日
(注)1.2025年6月27日定時株主総会決議による配当金の総額には、株式報酬信託が保有する当社株式に対する配当
金2百万円が含まれております。
2.2025年11月11日取締役会決議による配当金の総額には、株式報酬信託が保有する当社株式に対する配当金6
百万円が含まれております。
(2)基準日が当連結会計年度に属する配当のうち、配当の効力発生日が翌連結会計年度となるもの
前連結会計年度(自 2024年4月1日至 2025年3月31日)
決議
2025年6月27日
定時株主総会
株式の種類
配当金の総額
(単位:百万円)
1株当たり配当額
(単位:円)
2,237
26.00
普通株式
基準日
効力発生日
2025年3月31日
2025年6月30日
(注)1.2025年6月27日定時株主総会決議による配当金の総額には、株式報酬信託が保有する当社株式に対する配当
金2百万円が含まれております。
当連結会計年度(自
決議
2026年6月23日
定時株主総会
2025年4月1日
株式の種類
普通株式
至
2026年3月31日)
配当金の総額
(単位:百万円)
1株当たり配当額
(単位:円)
2,241
26.00
基準日
効力発生日
2026年3月31日
2026年6月24日
(注)1.2026年6月23日開催の定時株主総会の議案として付議する予定であります。
2.配当金の総額には、株式報酬信託が保有する当社株式に対する配当金6百万円が含まれております。
28.売上収益
(1)収益の分解
当社グループは、「植物性油脂」、「業務用チョコレート」、「乳化・発酵素材」、「大豆加工素材」の報告セ
グメントごとに、各地域のグループ会社が地域ごとの市場や顧客の特性に合わせて食品の製造・販売を行う事業展
開をしております。そのため、各報告セグメントについて、当社グループの「日本」、「欧米」、「アジア」の所
在地区分ごとに顧客との契約から生じる収益を分解しています。
なお、当連結会計年度に地域別の区分の見直しを行っております。「米州」と「欧州」を合計して「欧米」、
「東南アジア」と「中国」を合計して「アジア」として表示しています。当該区分変更により、前連結会計年度の
情報を変更後の区分に集計し表示しております。当社グループでは物品を引渡した時点において、顧客が当該物品
に対する支配を獲得することにより、当社グループの履行義務が充足され、上記収益認識の要件を満たすこととな
ります。そのため、顧客に物品を引き渡した時点において収益を認識しております。
いずれのセグメントの取引においても、履行義務に対する対価は請求から主として1年以内に受領しており、重
要な金融要素は含まれておりません。
前連結会計年度(自
2024年4月1日
至
2025年3月31日)
(単位:百万円)
植物性油脂
業務用
チョコレート
乳化・発酵
素材
大豆加工素材
日本
65,473
57,953
61,183
34,360
218,970
欧米
96,485
234,275
-
0
330,761
アジア
45,371
42,455
33,068
580
121,476
207,329
334,684
94,252
34,941
671,207
合計
売上高
合計
当連結会計年度(自
2025年4月1日
至
2026年3月31日)
(単位:百万円)
植物性油脂
業務用
チョコレート
乳化・発酵
素材
大豆加工素材
日本
77,547
68,804
63,526
32,266
242,144
欧米
142,256
252,655
-
34
394,946
アジア
51,273
49,444
33,906
573
135,197
271,076
370,904
97,432
32,874
772,288
合計
売上高
合計
(2)契約残高
顧客との契約から生じた債権については、注記「7.営業債権」をご参照ください。また、当社グループにおい
て、契約資産はなく、契約負債に重要性はありません。
(3) 残存履行義務に配分した取引価格
当社グループにおいては、当初に予想される契約期間が1年を超える重要性がある契約がないため、残存履行義
務に配分した取引価格の記載を省略しています。また、顧客との契約から生じる対価の中に、取引価格に含まれて
いない重要性がある金額はありません。
29.費用の性質別内訳
売上原価及び販売費及び一般管理費の主な内訳は、以下のとおりです。
(単位:百万円)
前連結会計年度
(自 2024年4月1日
至 2025年3月31日)
当連結会計年度
(自 2025年4月1日
至 2026年3月31日)
材料費及び商品等払出原価
486,255
559,174
従業員給付費用
50,919
56,354
減価償却費及び償却費
18,344
19,700
発送費及び倉庫料
30,670
33,180
30.研究開発費
前連結会計年度及び当連結会計年度において期中に費用として認識した研究開発支出は、それぞれ6,421百万円及
び7,077百万円です。これらは、連結損益計算書の「販売費及び一般管理費」に含まれています。
31.その他収益
その他収益の内訳は、以下のとおりです。
(単位:百万円)
前連結会計年度
(自 2024年4月1日
至 2025年3月31日)
当連結会計年度
(自 2025年4月1日
至 2026年3月31日)
為替差益
799
785
関係会社株式売却益
291
-
補助金収入
-
262
その他
917
910
2,008
1,957
合計
32.その他費用
その他費用の内訳は、以下のとおりです。
(単位:百万円)
前連結会計年度
(自 2024年4月1日
至 2025年3月31日)
当連結会計年度
(自 2025年4月1日
至 2026年3月31日)
のれんに係る減損損失
-
4,137
寄付金
123
108
控除対象外消費税等
154
54
その他
385
1,167
662
5,468
合計
33.金融収益及び金融費用
(1)金融収益
金融収益の内訳は次のとおりであります。
(単位:百万円)
前連結会計年度
(自 2024年4月1日
至 2025年3月31日)
当連結会計年度
(自 2025年4月1日
至 2026年3月31日)
受取利息
償却原価で測定する金融資産:
預金
894
945
その他
67
69
75
75
22
8
為替差益
-
446
その他
219
5
1,280
1,550
受取配当金
その他の包括利益を通じて公正価値で測定するも
のとして指定した金融資産:
期末時点において保有している金融資産からの
受取配当金
期中において認識を中止した金融資産からの受
取配当金
合計
(2)金融費用
金融費用の内訳は次のとおりであります。
(単位:百万円)
前連結会計年度
(自 2024年4月1日
至 2025年3月31日)
当連結会計年度
(自 2025年4月1日
至 2026年3月31日)
支払利息
償却原価で測定する金融負債:
借入金
5,818
6,731
社債
501
464
リース負債
299
385
為替差損
655
-
216
197
88
402
7,579
8,182
公正価値の評価損及び実現損
純損益を通じて公正価値で測定する金融資産
出資金
その他
合計
34.1株当たり利益
(1)基本的1株当たり利益
基本的1株当たり当期利益及び算定上の基礎は以下のとおりであります。
なお、希薄化後1株当たり当期利益については、希薄化効果を有する潜在株式が存在しないため記載しておりま
せん。
前連結会計年度
(自 2024年4月1日
至 2025年3月31日)
基本的1株当たり当期利益(円)
当連結会計年度
(自 2025年4月1日
至 2026年3月31日)
44円94銭
129円60銭
親会社の所有者に帰属する当期利益(百万円)
3,863
11,142
普通株式の加重平均株式数(千株)
85,970
85,979
(算定上の基礎)
(注)
当社は、当社取締役(社外取締役及び監査等委員である取締役を除く)並びに執行役員に対し、信託を用いた
株式報酬制度を導入しております。「基本的1株当たり当期利益」の算定上の基礎となる加重平均株式数に
は、その計算において控除する自己株式に当該信託が保有する当社株式を含めております。基本的1株当たり
当期利益の算定上、控除した当該自己株式の加重平均株式数は当連結会計年度183,308株(前連結会計年度
103,709株)です。
35.金融商品
(1)資本管理方針
当社グループは、持続的な成長と企業価値を最大化することを目指した資本管理を行っております。
当社グループが資本管理において用いる主な指標は以下のとおりです。
なお、当社グループが適用を受ける重要な資本規制はありません。
前連結会計年度
(自 2024年4月1日
至 2025年3月31日)
当連結会計年度
(自 2025年4月1日
至 2026年3月31日)
ROE
1.8%
5.0%
FUJI ROIC(投下資本利益率)(注)
2.1%
5.1%
115.7%
40.1%
株主還元
配当性向
(注)FUJI ROIC=税引後事業利益÷(運転資本+固定資産+持分法投資)
当社グループでは各事業で把握・管理可能な項目とすべく、分母となる投下資本を運転資本、固定資産(有形固
定資産及び無形資産)並びに持分法投資に置き換えて使用しております。
(2)財務上のリスク管理
当社グループは、事業活動を行う過程において生じる財務上のリスクを軽減するために、リスク管理を行ってお
ります。リスク管理にあたっては、リスク発生要因の根本からの発生を防止することでリスクを回避し、回避でき
ないリスクについてはその低減を図るようにしております。
デリバティブ取引は、後述するリスクを回避するために利用しており、投機的な取引は行わない方針でありま
す。
(3)財務上のリスク
当社グループの事業活動は、事業環境・金融市場環境による影響を受けます。事業活動の過程で保有する金融商
品は固有のリスクに晒されます。リスクには、主に①市場リスク((ⅰ)為替変動リスク、(ⅱ)価格変動リス
ク、(ⅲ)金利変動リスク、(ⅳ)株価変動リスク)、②信用リスク、③流動性リスクが含まれます。
①
市場リスク
(ⅰ)為替変動リスク
(a)為替変動リスクの内容及び管理方針
当社グループは、外貨建の輸出入取引・外国間取引を主要な事業活動として行っており、外貨建債権債務
については、為替相場の為替変動リスクに晒されております。この為替変動リスクへの対応として、先物為
替予約を利用してヘッジしております。為替予約取引は担当部門ごとに、取引権限及び取引限度額等に関す
る社内ルールに基づき行っております。ポジション管理はそれぞれの部門ごとに行っておりますが、経理部
門において取引状況、残高及び評価損益をチェックする体制をとっております。
(b)為替変動リスクへのエクスポージャー
当社グループの為替変動リスクに対するエクスポージャーの純額は次のとおりであります。なお、エクス
ポージャーの金額は、デリバティブ取引により為替変動リスクがヘッジされている金額を除いております。
(単位:百万円)
米ドル
移行日
(2024年4月1日)
前連結会計年度末
(2025年3月31日)
当連結会計年度末
(2026年3月31日)
△13,901
△27,276
△17,080
(c)為替変動リスクの感応度分析
当社グループが連結会計年度末において保有する金融商品について、日本円に対し米ドルがそれぞれ1%
円高になった場合の税引前当期利益に与える影響額は次のとおりであります。なお、当該分析は他のすべて
の変数が一定であると仮定しております。
(単位:百万円)
前連結会計年度
(自 2024年4月1日
至 2025年3月31日)
当連結会計年度
(自 2025年4月1日
至 2026年3月31日)
税引前当期利益
米ドル
272
170
(ⅱ)価格変動リスク
当社グループは、天候や自然災害等の影響により原材料価格が変動するリスクに晒されております。これ
らの価格変動リスクに対応するため、原材料の価格変動に連動した販売契約の締結及び商品先物取引等を行
うことで、原材料価格変動の影響の低減に努めております。
(ⅲ)金利変動リスク
(a)金利変動リスクの内容及び管理方針
当社グループは、運転資金確保、固定資産取得などのため金融機関からの借入又はリース取引などを通
じて資金調達を行っており、資金の調達や運用などに伴う金利変動リスクに晒されております。当社グル
ープは、このような金利変動リスクに対して、固定金利と変動金利のバランスを考慮しつつ必要に応じて
金利スワップをヘッジ手段として利用しています。
(b)金利変動リスクの感応度分析
当社グループが各連結会計年度末において保有する変動金利の有利子負債について、他のすべての変数
が一定であると仮定したうえで期末日における金利が1%上昇した場合の連結損益計算書の税引前当期利
益に与える影響は次のとおりであります。
(単位:百万円)
前連結会計年度
(自 2024年4月1日
至 2025年3月31日)
税引前当期利益
当連結会計年度
(自 2025年4月1日
至 2026年3月31日)
△74
△538
(ⅳ)株価変動リスク
(a)株価変動リスクの内容及び管理方針
当社グループは、市場性のある有価証券を保有しており、市場価格の変動リスクに晒されております。当
該リスクに対しては、定期的に把握された時価が取締役会等に報告されております。
(b)株価変動リスクの感応度分析
当社グループが連結会計年度末において保有する上場株式について、株価が1%下落した場合のその他の
包括利益(税効果調整前)に与える影響額は次のとおりであります。なお、当該分析は他のすべての変数が
一定であると仮定しております。
(単位:百万円)
前連結会計年度
(自 2024年4月1日
至 2025年3月31日)
その他の包括利益
②
当連結会計年度
(自 2025年4月1日
至 2026年3月31日)
△30
△34
信用リスク
営業債権(受取手形及び売掛金)は、顧客の信用リスクに晒されております。当社グループは、営業債権につ
いて、主要な取引先の状況を定期的にモニタリングし、取引相手ごとに期日及び残高を管理するとともに、財務
状況の悪化等による回収懸念の早期把握に努め、信用リスクの軽減を図っております。
決算日における、信用リスクに対する最大エクスポージャーは、連結財政状態計算書に表示されている帳簿価
額になります。なお、特定の取引先について、重要な信用リスクのエクスポージャーはなく、特段の管理を有す
る信用リスクの過度の集中はありません。
なお、債務保証の信用リスクに係る最大エクスポージャーは、「23.偶発事象」に記載の保証債務の金額であ
り、そのリスクは僅少であります。
貸倒引当金の算定に際しては、金融商品の信用リスクの程度に応じて次の3つのステージに区分し、ステージ
ごとに予想信用損失を見積っております。
・ステージ1:当初認識以降、信用リスクが著しく増大していない金融商品
・ステージ2:当初認識以降、信用リスクが著しく増大している金融商品
・ステージ3:信用減損している金融商品
期末日時点で30日超の支払遅延があった場合や、信用不安事象が発生した場合には、その原因が一時的なもの
であり、債務不履行のリスクが低く、近い将来に契約上のキャッシュ・フローを支払う能力を有していると判断
される場合を除き、信用リスクが著しく増大したものと判定し、ステージ2に区分しております。また、期末日
時点で債務者の重大な財政的困難等に起因する90日超の支払遅延または支払期日延長の要請があった場合等、契
約上のキャッシュ・フローの回収可能性が懸念されるものであると判断された場合には、債務不履行とみなし、
信用減損が発生しているものと判定し、ステージ3に区分しております。
ステージ1に区分される金融商品については、信用リスク格付けごとの貸倒実績、債務者の現在の財政状態、
債務者特有の要因等に将来予測を勘案した引当率に基づき、12ヶ月の予想信用損失により貸倒引当金の額を算定
しております。ステージ2に区分される金融商品については、信用リスク格付けごとの貸倒実績、債務者の現在
の財政状態、債務者特有の要因等に将来予測を勘案した引当率に基づき、全期間の予想信用損失により貸倒引当
金の額を算定しております。ステージ3に区分される金融資産の予想信用損失は、取引相手先の財務状況に将来
の経済状況の予測等を加味した上で個別に評価しております。
ただし、営業債権については、ステージ1とステージ2を区分せず、常に全期間の予想信用損失により貸倒引
当金の額を算定しております。
なお、金融商品の全部または一部が回収不能であると判断される場合には、直接償却を行っております。
前連結会計年度末及び当連結会計年度末の営業債権に係る信用リスクエクスポージャーは、次のとおりです。
(単位:百万円)
前連結会計年度末
(2025年3月31日)
ステージ1及び2
営業債権
当連結会計年度末
(2026年3月31日)
ステージ3
112,441
ステージ1及び2
63
ステージ3
115,350
137
前連結会計年度及び当連結会計年度の営業債権に係る貸倒引当金の増減は次のとおりです。
(単位:百万円)
ステージ1及び2
2024年4月1日残高
ステージ3
179
64
増加
1
26
減少
△26
△27
その他の増減
△2
△9
2025年3月31日残高
151
54
増加
73
81
減少
△62
△35
その他の増減
△8
30
2026年3月31日残高
153
131
なお、いずれの資産についても、前連結会計年度及び当連結会計年度において、貸倒引当金の変動に影響を与
えるような総額での帳簿価額の著しい増減はありません。また、担保として保有する物件及びその他の信用補完
をするものはありません。
③
流動性リスク
流動性リスクとは、当社グループが期限の到来した金融負債の返済義務を履行するにあたり、支払期日にその
支払を実行できなくなるリスクです。
営業債務、社債及び借入金、その他の金融負債は流動性リスクに晒されておりますが、当社グループでは、金
融機関との間で資金調達枠を確保すると共に、各社が月次資金繰計画を作成する等キャッシュ・フローの計画と
実績をモニタリングし、当該リスクを管理しております。
金融負債の期日別残高は以下のとおりであります。
移行日(2024年4月1日)
(単位:百万円)
帳簿価額
契約上の
キャッシュ・
フロー
1年以内
1年超
5年以内
5年超
非デリバティブ金融負債
営業債務
41,013
41,013
41,013
-
-
社債
40,967
41,137
35,074
6,063
-
借入金
97,869
98,812
54,605
41,683
2,523
リース負債
9,578
9,828
2,496
3,763
3,567
コマーシャル・ペーパー
10,000
10,000
10,000
-
-
その他の金融負債
6,051
6,051
6,051
-
-
205,481
206,843
149,241
51,510
6,090
デリバティブ負債
97
97
97
-
-
デリバティブ資産
△2,408
△2,408
△2,408
-
-
合計
前連結会計年度末(2025年3月31日)
(単位:百万円)
帳簿価額
契約上の
キャッシュ・
フロー
1年以内
1年超
5年以内
5年超
非デリバティブ金融負債
営業債務
46,538
46,538
46,538
-
-
社債
30,811
48,723
242
7,733
40,747
借入金
232,910
241,517
177,225
46,497
17,794
リース負債
8,731
9,353
2,213
3,800
3,340
コマーシャル・ペーパー
20,000
20,000
20,000
-
-
その他の金融負債
8,796
8,796
8,768
27
-
347,787
374,929
254,987
58,059
61,881
デリバティブ負債
1,297
1,297
1,297
-
-
デリバティブ資産
△322
△322
△322
-
-
合計
当連結会計年度末(2026年3月31日)
(単位:百万円)
帳簿価額
契約上の
キャッシュ・
フロー
1年以内
1年超
5年以内
5年超
非デリバティブ金融負債
営業債務
68,082
68,082
68,082
-
-
社債
30,859
48,307
244
7,958
40,104
借入金
217,521
226,010
140,720
57,897
27,392
リース負債
12,716
13,806
2,922
6,409
4,474
コマーシャル・ペーパー
20,000
20,000
20,000
-
-
その他の金融負債
7,580
7,580
7,549
31
-
356,761
383,787
239,519
72,296
71,971
デリバティブ負債
559
559
559
-
-
デリバティブ資産
△2,170
△2,170
△2,170
-
-
合計
(4)公正価値
①
公正価値のヒエラルキー
公正価値で測定する金融商品について、測定に用いたインプットの観察可能性に応じて、次のとおり分類して
おります。
レベル1: 活発な市場における同一の資産又は負債の(無調整の)相場価格
レベル2: レベル1に分類される相場価格以外で、資産又は負債について直接又は間接的に観察可能なイン
プット
レベル3: 観察可能でないインプット
公正価値ヒエラルキーのレベル間の振替は、報告期間の末日において認識しております。前連結会計年度及び
当連結会計年度において、レベル間の重要な振替が行われた金融商品はありません。
②
償却原価で測定する金融商品
償却原価で測定する主な金融商品の帳簿価額及び公正価値は、以下のとおりです。なお、帳簿価額が公正価値
の合理的な近似値となっている金融商品及び重要性の乏しい金融商品は、下表に含めておりません。
(単位:百万円)
移行日
(2024年4月1日)
前連結会計年度末
(2025年3月31日)
当連結会計年度末
(2026年3月31日)
帳簿価額
公正価値
帳簿価額
公正価値
帳簿価額
公正価値
長期借入金
49,277
47,944
59,965
58,778
120,128
118,096
社債
40,967
40,956
30,811
30,352
30,859
30,150
償却原価で測定する金融負債
償却原価で測定する金融商品の公正価値は、以下のとおり算定しております。
(現金及び現金同等物、営業債権、営業債務、その他の金融資産、その他の金融負債)
流動項目は短期間で決済されるため、帳簿価額が公正価値の合理的な近似値となっております。
(借入金)
短期借入金は、短期間で決済されるものであり、公正価値が帳簿価額と近似しているため、公正価値は帳簿価
額と同額とみなしております。
長期借入金のうち変動金利によるものは、短期間で市場金利が反映されるため、公正価値は帳簿価額と同額と
みなしております。長期借入金のうち固定金利によるものは、元利金の合計額を同様の新規借入を行った場合に
想定される利率で割り引いて算定する方法によっており、レベル2に分類しております。
コマーシャル・ペーパーは、短期間で決済されるものであり、公正価値が帳簿価額と近似しているため、公正
価値は帳簿価額と同額とみなしております。
(社債)
当社が発行している社債は、活発な市場における市場価格が認められないため、店頭売買統計資料を参考値と
して公正価値を算定しており、レベル2に分類しております。
③
公正価値で測定する金融商品
公正価値で測定する金融商品の内訳は、以下のとおりです。
移行日(2024年4月1日)
(単位:百万円)
レベル1
レベル2
レベル3
合計
金融資産
純損益を通じて公正価値で測定する
金融資産:
デリバティブ資産
-
2,421
-
2,421
出資金
-
-
639
639
4,292
-
1,958
6,251
4,292
2,421
2,598
9,311
デリバティブ負債
-
97
-
97
合計
-
97
-
97
その他の包括利益を通じて公正価値
で測定する金融資産:
株式
合計
金融負債
純損益を通じて公正価値で測定する
金融負債:
前連結会計年度末(2025年3月31日)
(単位:百万円)
レベル1
レベル2
レベル3
合計
金融資産
純損益を通じて公正価値で測定する
金融資産:
デリバティブ資産
-
353
-
353
出資金
-
-
503
503
3,019
-
2,293
5,313
3,019
353
2,796
6,170
デリバティブ負債
-
1,297
-
1,297
合計
-
1,297
-
1,297
その他の包括利益を通じて公正価値
で測定する金融資産:
株式
合計
金融負債
純損益を通じて公正価値で測定する
金融負債:
当連結会計年度末(2026年3月31日)
(単位:百万円)
レベル1
レベル2
レベル3
合計
金融資産
純損益を通じて公正価値で測定する
金融資産:
デリバティブ資産
-
2,180
-
2,180
出資金
-
-
398
398
3,485
-
2,479
5,965
3,485
2,180
2,878
8,544
デリバティブ負債
-
559
-
559
合計
-
559
-
559
その他の包括利益を通じて公正価値
で測定する金融資産:
株式
合計
金融負債
純損益を通じて公正価値で測定する
金融負債:
(ⅰ)公正価値で測定する金融資産及び金融負債の公正価値の算定
(その他の金融資産(流動)、その他の金融負債(流動))
デリバティブ取引については、期末日の先物為替相場等に基づいて算定しており、レベル2に分類してお
ります。
(その他の金融資産(非流動))
その他の包括利益を通じて公正価値で測定する金融資産及び純損益を通じて公正価値で測定する金融資産
のうち、上場株式は、市場価格に基づき公正価値を算定しており、レベル1に分類しております。非上場株
式は、類似企業の市場価格に基づく評価技法、純資産価値に基づく評価技法、及びその他の評価技法を用い
て公正価値を算定しており、レベル3に分類しております。レベル3に分類された出資金等は投資先の直近
の入手可能な将来の収益性の見通しや純資産価額等の情報を総合的に考慮した適切な技法により公正価値を
算定しております。
(ⅱ)各金融商品の公正価値の評価技法とインプット情報の説明
レベル1に分類されている金融資産は、主に上場株式等により構成されており、当該活発な市場価格(取
引所の市場価格)によって公正価値を評価しております。
レベル2に分類されている金融資産及び金融負債は、主にデリバティブにより構成されております。
デリバティブ取引については、期末日の先物為替相場等に基づいて公正価値を評価しております。
レベル3に分類されている金融資産は、主に非上場株式により構成されております。
非上場株式の公正価値の測定にあたり、類似企業の市場価格に基づく評価技法、純資産価値に基づく評価
技法、及びその他の評価技法を用いて計算しております。
レベル3に分類されている金融資産の経常的及び非経常的な公正価値は、グループ会計方針の定めに従い
測定しており、金融商品の個々の資産性質、特徴並びにリスクを最も適切に反映できる評価方法及びインプ
ットを決定しております。また、公正価値の測定結果については、上位役職者によるレビューと承認を行っ
ております。
なお、レベル3に区分される金融商品のインプットについて、それぞれ合理的と考えられる代替的な仮定
に変更した場合に、公正価値の金額に重要な変動はないと考えております。
④
レベル3に分類された金融商品の期首残高から期末残高への調整表
(単位:百万円)
(自
至
前連結会計年度
2024年4月1日
2025年3月31日)
期首残高
(自
至
当連結会計年度
2025年4月1日
2026年3月31日)
2,598
2,796
99
△21
△213
△207
313
186
取得
111
36
処分
△8
-
その他
△4
66
期末残高
2,796
2,878
利得及び損失合計
純損益
その他の包括利益
(注)
その他の包括利益に含まれている利得及び損失は、連結包括利益計算書の「その他の包括利益を通じて測定す
る金融資産の公正価値の純変動」に含まれております。
(5)金融資産と金融負債の相殺
当社では、デリバティブ資産及びデリバティブ負債について、マスターネッティング契約またはそれに類似す
る契約に基づいて取引を行っており、契約当事者間で決済の不履行が起きた場合は、当該取引先に対する債権債
務を純額で決済することとなっております。
前連結会計年度及び当連結会計年度において同一の取引相手先に対して認識した金融資産及び金融負債のう
ち、金融資産と金融負債の相殺の要件に従って相殺された金融商品はありません。また、強制可能なマスターネ
ッティング契約または類似の契約の対象であるが、金融資産と金融負債の相殺の要件の一部または全部を満たさ
ないため相殺していない金融商品の金額はそれぞれ311百万円及び50百万円です。
(6)デリバティブ及びヘッジ会計
当社グループは、通常の営業活動において、金利変動、為替変動及び商品相場変動などの市場リスクに晒されて
おります。
これらのリスクを管理するため、当社グループは、原則として、リスクの純額を把握し、リスクを相殺する効果
を有する取引を活用して市場リスクの軽減を図っております。さらに、リスク管理戦略に則ってデリバティブ取引
を締結し、当社グループが晒されている市場リスクの軽減を図っております。リスク管理戦略の詳細については
「(3)財務上のリスク①市場リスク」に記載しております。
ヘッジ会計の適用にあたっては、ヘッジされているリスクに起因するヘッジ対象のキャッシュ・フローの変動
が、ヘッジ手段のキャッシュ・フローの変動により相殺される経済的関係にあることを確認するために、原則とし
て、ヘッジ対象とヘッジ手段の重要な条件が一致しているか又は密接に合致しているかどうかの定性的な評価及び
ヘッジ対象とヘッジ手段の価値が同一のリスクにより価値変動が相殺し合う関係にあることの定量的評価を通じ
て、ヘッジ対象とヘッジ手段の間の経済的関係の存在を確認しております。なお、当社は有効性の高いヘッジを行
っているため、通常、重要なヘッジの非有効部分が発生しないと想定しております。
また、ヘッジ手段とヘッジ対象の経済的関係性及びリスク管理戦略に照らして適切なヘッジ比率を設定しており
ます。
① キャッシュ・フロー・ヘッジ
(ⅰ)ヘッジ指定されている重要なデリバティブ
移行日(2024年4月1日)
ヘッジ手段
想定元本
(単位:百万円)
ヘッジ手段の帳簿価額
(単位:百万円)
平均レート
デリバティブ
資産
デリバティブ
負債
892
7
46
7
為替リスク
為替予約
(円売USD買)
為替予約
(BRL売USD買)
為替予約
(円売GBP買)
30,864
5,161
USD/円
143.79
USD/BRL
4.99
5,346
GBP/円
183.77
80
18
1,168
1.28%
78
-
金利リスク
金利スワップ
デリバティブ資産又はデリバティブ負債は、連結財政状態計算書の「その他の金融資産(流動・非流
動)」、又は「その他の金融負債(流動)」にそれぞれ含めております。当社が為替変動リスクによるキ
ャッシュ・フローの変動をヘッジしている期間は、為替予約については最長で約1年、金利スワップは最
長で約1年です。
前連結会計年度末(2025年3月31日)
ヘッジ手段
想定元本
(単位:百万円)
ヘッジ手段の帳簿価額
(単位:百万円)
平均レート
デリバティブ
資産
デリバティブ
負債
98
727
3
397
201
44
4
-
為替リスク
為替予約
(円売USD買)
為替予約
USD/円
149.51
USD/BRL
38,154
7,975
(BRL売USD買)
為替予約
(円売GBP買)
6.05
GBP/円
188.99
18,950
金利リスク
金利スワップ
241
2.72%
デリバティブ資産又はデリバティブ負債は、連結財政状態計算書の「その他の金融資産(流動)」又は
「その他の金融負債(流動)」にそれぞれ含めております。当社が為替変動リスクによるキャッシュ・フロ
ーの変動をヘッジしている期間は為替予約については最長で約1年、金利スワップは最長で約1年です。
当連結会計年度末(2026年3月31日)
ヘッジ手段
想定元本
(単位:百万円)
ヘッジ手段の帳簿価額
(単位:百万円)
平均レート
デリバティブ
資産
デリバティブ
負債
1,493
8
2
342
為替リスク
為替予約
(円売USD買)
為替予約
(BRL売USD買)
37,158
12,500
為替予約
(円売GBP買)
USD/円
151.91
USD/BRL
5.47
6,891
GBP/円
203.20
186
24
35
2.3%
0
-
金利リスク
金利スワップ
デリバティブ資産又はデリバティブ負債は、連結財政状態計算書の「その他の金融資産(流動)」又は
「その他の金融負債(流動)」にそれぞれ含めております。当社が為替変動リスクによるキャッシュ・フロ
ーの変動をヘッジしている期間は、為替予約については最長で約1年、金利スワップは最長で約1年で
す。
(ⅱ)ヘッジ指定されているヘッジ対象に関するキャッシュ・フロー項目
移行日(2024年4月1日)
(単位:百万円)
キャッシュ・フロー・ヘッジ
剰余金の残高
リスク区分
為替リスク
644
金利リスク
81
前連結会計年度末(2025年3月31日)
(単位:百万円)
キャッシュ・フロー・ヘッジ
剰余金の残高
リスク区分
為替リスク
△564
金利リスク
4
当連結会計年度末(2026年3月31日)
(単位:百万円)
キャッシュ・フロー・ヘッジ
剰余金の残高
リスク区分
為替リスク
754
金利リスク
0
(ⅲ)連結損益計算書及び連結包括利益計算書における影響
前連結会計年度(自
2024年4月1日
至
2025年3月31日)
(単位:百万円)
その他の包括
利益に認識した
ヘッジ損益
その他の資本の
構成要素から
純損益への組替
調整額
為替リスク
113
-
金利リスク
△19
△54
リスク区分
当連結会計年度(自
2025年4月1日
至
組替調整額を
ヘッジ対象の
含んでいる
資産の取得価額に
連結損益計算書
振り替えた金額
の表示科目
-
金融収益・金融
費用
△1,859
-
2026年3月31日)
(単位:百万円)
その他の包括
利益に認識した
ヘッジ損益
その他の資本の
構成要素から
純損益への組替
調整額
為替リスク
2,157
211
その他収益・
その他費用
△394
金利リスク
△0
△3
金融収益・
金融費用
-
リスク区分
組替調整額を
ヘッジ対象の
含んでいる
資産の取得価額に
連結損益計算書
振り替えた金額
の表示科目
ヘッジの中止等による組替調整額はありません。また、純損益に認識したヘッジの非有効部分の金額に
重要性はないため、ヘッジ非有効部分を認識する基礎として用いたヘッジ対象の公正価値の変動の記載を
省略しています。
②
ヘッジ会計が適用されていないデリバティブ取引
ヘッジ会計が適用されていないデリバティブ取引の契約額等及び公正価値は以下のとおりであります。
(単位:百万円)
移行日
(2024年4月1日)
前連結会計年度末
(2025年3月31日)
当連結会計年度末
(2026年3月31日)
契約額等
公正価値
契約額等
公正価値
契約額等
公正価値
6,148
△42
6,317
23
8,838
△168
-
-
-
-
52
0
3,611
50
4,757
△115
3,335
66
円
2
0
2
0
2
△0
ユーロ
-
-
0
△0
0
0
シンガポールドル
-
-
0
△0
-
-
9,762
8
11,077
△92
12,229
△100
為替予約取引
売建
米ドル
英ポンド
買建
米ドル
合計
(単位:百万円)
移行日
(2024年4月1日)
前連結会計年度末
(2025年3月31日)
当連結会計年度末
(2026年3月31日)
契約額等
公正価値
契約額等
公正価値
契約額等
公正価値
売建
2,366
891
-
-
-
-
買建
14,986
297
-
-
-
-
17,352
1,188
-
-
-
-
商品先物取引
合計
(単位:百万円)
移行日
(2024年4月1日)
前連結会計年度末
(2025年3月31日)
当連結会計年度末
(2026年3月31日)
契約額等
公正価値
契約額等
公正価値
契約額等
公正価値
510
67
730
13
1,175
417
510
67
730
13
1,175
417
商品スワップ取引
変動受取・固定支払
合計
36.キャッシュ・フロー情報
(1)子会社株式の売却による収支
前連結会計年度において、株式の売却により子会社でなくなった会社に関する支配喪失時の資産及び負債の主な
内訳並びに受取対価と売却による収支の関係は次のとおりであります。
(単位:百万円)
前連結会計年度
(自 2024年4月1日
至 2025年3月31日)
支配喪失時の資産の内訳
流動資産
65
非流動資産
1,800
支配喪失時の負債の内訳
流動負債
241
非流動負債
41
(単位:百万円)
前連結会計年度
(自 2024年4月1日
至 2025年3月31日)
受取対価
1,874
支配喪失時の資産のうち現金及び現金同等物
△54
(差引)子会社株式の売却による収支
1,819
(2)財務活動に係る負債の変動
財務活動から生じた負債の変動は以下のとおりです。
前連結会計年度(自
2024年4月1日
至
2025年3月31日)
(単位:百万円)
期首残高
キャッシュ
・フローを
伴う変動
キャッシュ・フローを伴わない変動
期末残高
連結範囲の
異動
為替変動
新規リース
その他
短期借入金(注1)
58,592
135,537
-
△1,185
-
-
192,944
長期借入金(注2)
49,277
10,993
-
△240
-
△65
59,965
社債(注2)
40,967
△10,000
-
-
-
△155
30,811
リース負債
9,578
△2,942
-
△139
2,037
196
8,731
158,416
133,588
-
△1,565
2,037
△24
292,452
合計
(注)1.コマーシャル・ペーパーの残高を含んでおります。
2.1年内返済及び償還予定の残高を含んでおります。
当連結会計年度(自
2025年4月1日
至
2026年3月31日)
(単位:百万円)
期首残高
キャッシュ
・フローを
伴う変動
キャッシュ・フローを伴わない変動
期末残高
連結範囲の
異動
為替変動
新規リース
その他
短期借入金(注1)
192,944
△88,581
2,885
10,145
-
-
117,393
長期借入金(注2)
59,965
57,840
475
2,005
-
△159
120,128
社債(注2)
30,811
-
-
-
-
48
30,859
リース負債
8,731
△2,826
1,441
814
4,596
△39
12,716
292,452
△33,567
4,801
12,965
4,596
△150
281,098
合計
(注)1.コマーシャル・ペーパーの残高を含んでおります。
2.1年内返済及び償還予定の残高を含んでおります。
(3)非資金取引
リースにより取得した使用権資産は、非資金取引に該当します。詳細は、「13.リース」をご参照ください。
37.関連当事者
(1)関連当事者との取引
移行日(2024年4月1日)
(単位:百万円)
種類
会社等の名称
取引の内容
科目
未決済残高
製品の販売
営業債権
742
原材料等の購入
営業債務
951
重要な影響力を有する企業伊藤忠商事㈱
重要な影響力を有する企業 ITOCHU International Inc. 原材料等の購入
営業債務
その他の流動資産
294
4,592
(注)1.記載金額のうち、未決済残高には消費税等が含まれております。
2.原材料等の購入及び製品販売等の取引については、市場価格等を勘案した当社希望価格を提示し、価格交渉の
上決定しております。おおむね、市場価格どおりです。
前連結会計年度(自
2024年4月1日
至
2025年3月31日)
(単位:百万円)
種類
会社等の名称
取引の内容
取引金額
科目
未決済残高
製品の販売
9,416 営業債権
867
原材料等の購入
49,224 営業債務
1,999
重要な影響力を有する企業 ITOCHU International Inc. 原材料等の購入
126,690 営業債務
1,417
重要な影響力を有する企業伊藤忠商事㈱
(注)1.記載金額のうち、取引金額には消費税等が含まれておらず、未決済残高には消費税等が含まれております。
2.原材料等の購入及び製品販売等の取引については、市場価格等を勘案した当社希望価格を提示し、価格交渉の
上決定しております。おおむね、市場価格どおりです。
当連結会計年度(自
2025年4月1日
至
2026年3月31日)
(単位:百万円)
種類
会社等の名称
重要な影響力を有する企業伊藤忠商事㈱
取引の内容
科目
未決済残高
製品の販売
9,755 営業債権
839
原材料等の購入
52,351 営業債務
2,641
株式の取得
12,852
重要な影響力を有する企業 ITOCHU International Inc. 原材料等の購入
重要な影響力を有する企業 ITOCHU France S.A.S.
取引金額
株式の取得
-
-
101,198 営業債務
4,864
4,284
-
-
(注)1.記載金額のうち、取引金額には消費税等が含まれておらず、未決済残高には消費税等が含まれております。
2.原材料等の購入及び製品販売等の取引については、市場価格等を勘案した当社希望価格を提示し、価格交渉の
上決定しております。おおむね、市場価格どおりです。
3.株式の取得については、独立した第三者機関により算定された価格を基礎として協議の上、合理的に決定して
おります。また、上表の取引金額はPROVENCE HUILES S.A.Sの株式の75%を伊藤忠商事株式会社、残りの25%を
ITOCHU France S.A.S.より取得した際の金額です。
(2)主要な経営幹部に対する報酬
主要な経営幹部に対する報酬は次のとおりであります。
(単位:百万円)
(自
至
前連結会計年度
2024年4月1日
2025年3月31日)
報酬及び賞与
株式報酬
合計
(自
至
当連結会計年度
2025年4月1日
2026年3月31日)
197
262
0
20
197
282
38.売却目的で保有する資産
売却目的で保有する資産及びそれに直接関連する負債の内訳は、以下のとおりです。
(単位:百万円)
移行日
(2024年4月1日)
前連結会計年度末
(2025年3月31日)
当連結会計年度末
(2026年3月31日)
営業債権
-
16
-
有形固定資産
-
8,549
-
使用権資産
-
29
-
無形資産
-
9
-
その他
-
33
-
-
8,637
-
営業債務
-
74
-
リース負債
-
16
-
その他
-
168
-
-
259
-
売却目的で保有する資産
合計
売却目的で保有する資産に直接関連する負債
合計
前連結会計年度である2024年5月、業務用チョコレート事業を展開する連結子会社 Blommer Chocolate Company,
LLC は、経営資源の適正な配分を目的として、米国シカゴ工場を閉鎖し、売却手続きを開始いたしました。これに伴
い、当該土地及びそれに直接関連する負債は、同連結会計年度において「売却目的で保有する資産及びそれに直接関
連する負債」に分類しておりました。しかしながら、米国内の金利の高止まりによる不動産市況の悪化の影響等によ
り、売却完了まで一定の期間を要する見込みとなったため、当連結会計年度において当該資産及び負債の「売却目的
で保有する資産及びそれに直接関連する負債」への分類を中止しております。
なお、当該分類の変更が当社グループの業績に及ぼす影響は軽微であります。
39.企業結合及び非支配持分の取得
前連結会計年度(自
2024年4月1日
至
2025年3月31日)
(非支配持分の取得に伴う親会社の所有持分の変動)
(1)取引の概要
当社は、Fuji Oil International Inc.の非支配株主が所有する20%の株式を2025年3月14日に追加取得しま
した。当該取引によりFuji Oil International Inc.に対する議決権比率は80%から100%となりました。
(2)取得原価及び対価の種類ごとの内訳
取得の対価現金
12,936百万円
取得原価
12,936百万円
(3)非支配株主との取引に係る当社の持分変動に関する事項
①
資本剰余金の主な変動要因
②
子会社株式の追加取得
非支配株主との取引によって減少した資本剰余金の金額
6,858百万円
当連結会計年度(自 2025年4月1日
(取得による企業結合)
至
2026年3月31日)
(1)企業結合の概要
① 被取得企業の名称及び事業の内容
被取得企業の名称 PROVENCE HUILES S.A.S
②
③
④
他1社
事業の内容
植物性油脂の製造販売
取得日
2025年4月28日
取得した議決権付資本持分の割合
100%
企業結合を行った主な理由
同社は、当社の油脂事業戦略上重要な位置づけである高オレイン酸ひまわり油等の機能性の高い植物油を主
に取り扱っております。今回、同社の株式を取得することで、グループ製品ポートフォリオに新たな付加価値
製品が追加され、また、高品質なフランス産の高オレイン酸ひまわり油のグループ内サプライチェーン構築が
可能となり、今後の高付加価値油脂の安定供給に貢献することとなります。当社グループとのシナジーを最大
化することに努め、グローバルに多様化するニーズへの対応を図るとともに油脂事業の更なる拡大を目指しま
す。
⑤
被取得企業の支配の獲得方法
現金を対価とする株式取得
(2)取得日現在における支払対価、取得資産及び引受負債の公正価値
(単位:百万円)
金額
支払対価の公正価値(現金)
17,137
取得資産及び引受負債の公正価値
現金及び現金同等物
413
営業債権
2,991
棚卸資産
5,387
有形固定資産
1,751
使用権資産
1,346
顧客関連資産
6,348
営業債務
△1,947
借入金
△2,885
長期借入金
△475
リース負債
△1,441
繰延税金負債
△1,546
その他
△46
取得資産及び引受負債の公正価値(純額)
9,897
のれん
7,239
のれんの主な内容は今後の事業展開によって期待される超過収益力であり、税務上損金算入可能な金額はあり
ません。
当該企業結合に係る取得関連費用は63百万円であり、すべて連結損益計算書の「販売費及び一般管理費」に計
上しております。
(3)企業結合に係る取得日以降の被取得企業の収益及び純損益
売上高
22,304百万円
当期利益(△損失)
△490百万円
(4)企業結合に係る取得日が連結会計年度の期首であったとした場合の結合後企業の収益及び純損益
上記の企業結合に係る取得日が連結会計年度の期首であったとした場合の影響額に重要性が乏しいため、記載
を省略しております。
(5)取得原価の配分
2025年4月28日に株式を取得したPROVENCE HUILES S.A.Sについて、取得日時点では取得原価の配分が完了して
いないため、暫定的な会計処理を行っておりましたが、当連結会計年度に確定しております。この結果、暫定的
に算定されたのれんの金額12,000百万円は、会計処理の確定により4,761百万円減少し、7,239百万円となってお
ります。のれんの減少は顧客関連資産が6,348百万円、繰延税金負債が1,587百万円それぞれ増加したことによる
ものであります。
40.初度適用(IFRSへの移行に関する開示)
当連結会計年度の連結財務諸表は、IFRSに準拠して作成する最初の連結財務諸表であります。日本において一般に
公正妥当と認められる会計基準(以下「日本基準」という。)に準拠して作成された直近の連結財務諸表は、2025年
3月31日に終了する連結会計年度に関するものであり、日本基準からIFRSへの移行は、2024年4月1日を移行日とし
て行われました。
(1)IFRS第1号の免除規定
IFRSでは、IFRSを初めて適用する会社に対して、原則的にIFRSで要求される基準を遡及して適用することを求め
ております。ただし、IFRS第1号はIFRSで要求される基準の一部について、強制的に免除規定を適用しなければな
らないものと、任意に免除規定を適用するものを定めております。これらの規定の適用に基づく影響は、移行日に
おいて利益剰余金又はその他の資本の構成要素において調整しております。
当社グループが適用した主な任意の免除規定は以下のとおりです。
・企業結合
IFRS第1号では、過去の企業結合についてIFRS第3号「企業結合」(以下「IFRS第3号」という。)を遡及適用
しないことが選択可能となっております。遡及適用する場合、その後の企業結合はすべてIFRS第3号に基づいて修
正されます。
当社グループは、移行日前に行われた企業結合に対してIFRS第3号を遡及適用しないことを選択しております。
この結果、移行日前の企業結合から生じたのれんの金額並びに関連会社及び共同支配企業におけるのれん相当額に
ついては、日本基準に基づいた帳簿価額のまま調整しておりません。なお、当該のれんについては、減損の兆候の
有無にかかわらず移行日時点で減損テストを実施しております。
・みなし原価の使用
IFRS第1号では、有形固定資産について移行日現在の公正価値を当該日現在のみなし原価として使用することが
認められております。当社グループは、一部の有形固定資産について、移行日現在の公正価値を当該日における
IFRS上のみなし原価として使用しております。
・移行日前に認識された金融商品の指定
IFRS第1号では、移行日時点で存在する事実及び状況に基づき、IFRS第9号「金融商品」(以下「IFRS第9号」
という。)に従って金融資産の指定を行うことができます。当社グループは移行日時点で保有している資本性金融
資産について、その他の包括利益を通じて公正価値で測定する金融商品(資本性金融資産)として、移行日時点の
状況に基づき指定しております。
・リース(借手)
IFRS第1号では、初度適用企業は契約にリースが含まれているかどうかについて、移行日時点で存在する事実及
び状況に基づいて判断することが認められております。借手のリースにおけるリース負債及び使用権資産を認識す
る際に、すべてのリースについてリース負債及び使用権資産を移行日現在で測定することが認められております。
当社グループは、リース負債を移行日現在で測定しており、当該リース負債について、残りのリース料を移行日現
在の借手の追加借入利子率で割り引いた現在価値としております。また、使用権資産は移行日現在で測定してお
り、リース負債と同額(当該リースに関して移行日直前の財政状態計算書に認識していた前払リース料又は未払リ
ース料の金額で調整後) としております。
・株式報酬取引
IFRS第1号では、移行日前に権利確定した株式報酬に対して、IFRS第2号「株式に基づく報酬」(以下「IFRS第
2号」という。)を適用しないことを選択することが認められております。当社グループは、当該免除規定を適用
し、移行日前に権利確定した株式報酬に対して、IFRS第2号を遡及適用しないことを選択しております。
(2)IFRS第1号の遡及適用に対する強制的な例外規定
IFRS第1号では、「見積り」、「金融資産及び金融負債の認識の中止」、「ヘッジ会計」、「非支配持分」及び
「金融資産の分類及び測定」等について、IFRSの遡及適用を禁止しております。当社グループはこれらの項目につ
いて移行日より将来に向かって適用しております。
(3)調整表
IFRS第1号において求められる調整表は次のとおりであります。なお、調整表の「決算期の変更」には決算日が
連結決算日と異なる連結子会社をIFRSにおいて変更したことによる影響を含めて表示しております。「表示組替」
には利益剰余金及び包括利益に影響を及ぼさない調整を、「認識及び測定の差異」には利益剰余金及び包括利益に
影響を及ぼす調整を含めております。
移行日(2024年4月1日)の資本に対する調整
(単位:百万円)
日本基準表示科目
日本基準
決算期の
変更
表示組替
認識及び
測定の
差異
IFRS
注記
資産の部
流動資産
資産
流動資産
現金及び預金
受取手形及び売掛金
27,490
90,024
829
2,614
△10
△238
189
△1
28,499
92,399
商品及び製品
原材料及び貯蔵品
その他
51,724
57,277
10,579
509
-
-
57,277
△57,277
△10,579
△161
-
-
109,349
-
-
貸倒引当金
△238
-
-
1,092
238
1,621
-
173
流動資産合計
固定資産
有形固定資産
建物及び構築物(純額)
機械装置及び運搬具(純
額)
土地
IFRS表示科目
現金及び現金同等物
営業債権
a
棚卸資産
-
2,888
b
その他の金融資産
c
その他の流動資産
-
4,260
9,006
160
13,427
236,858
9,307
38
360
246,565
-
-
143,868
△2,524
141,344
47,780
28
△47,809
-
-
62,851
93
△62,945
-
-
流動資産合計
e,E
非流動資産
有形固定資産
20,057
124
△20,182
-
-
使用権資産(純額)
建設仮勘定
その他(純額)
無形固定資産
7,655
9,273
3,131
-
△63
571
34
-
82
△9,844
△3,165
33,605
2,374
-
-
-
10,048
-
-
33,605
F
使用権資産
f
無形資産
のれん
顧客関連資産
その他
投資その他の資産
21,840
19,035
14,345
67
174
53
-
△19,209
△14,398
-
-
-
21,907
-
-
B
のれん
-
-
11,224
△89
11,134
g
持分法で会計処理されて
いる投資
16,002
7,064
669
3,683
-
-
-
-
△16,002
-
-
△3,683
-
△7,024
1,827
-
-
39
2,496
-
D
C
退職給付に係る資産
繰延税金資産
△60
-
60
-
-
-
-
18
-
7,873
527
1,533
96
9,426
624
h,A
i
その他の金融資産
その他の非流動資産
233,332
1,103
-
△3,806
230,628
30
-
-
△30
-
30
-
-
△30
-
470,221
10,410
38
△3,476
477,193
投資有価証券
退職給付に係る資産
繰延税金資産
その他
貸倒引当金
固定資産合計
非流動資産合計
繰延資産
社債発行費
繰延資産合計
資産合計
資産合計
(単位:百万円)
日本基準表示科目
負債の部
流動負債
支払手形及び買掛金
短期借入金
1年内償還予定の社債
日本基準
決算期の
変更
表示組替
認識及び
測定の
差異
IFRS
42,321
33,151
35,000
△1,441
21,222
-
-
10,000
-
134
-
△10
41,013
64,373
34,989
コマーシャル・ペーパー
10,000
-
-
△5
△10,000
1,721
-
693
-
2,410
未払法人税等
賞与引当金
4,310
3,354
-
58
-
△3,412
6
-
4,316
-
-
役員賞与引当金
注記
k
j,F
IFRS表示科目
負債
流動負債
営業債務
借入金
1年内償還予定の社債
リース負債
未払法人所得税
40
-
△40
-
18,758
-
△18,758
-
-
-
237
△659
5,904
14,573
7
1,675
6,148
l
15,589 m,G,H
その他の金融負債
その他の流動負債
146,936
19,412
△12
2,506
168,842
流動負債合計
社債
長期借入金
6,000
46,135
-
△2,639
-
-
△21
-
5,978
43,496
リース債務
繰延税金負債
退職給付に係る負債
その他
5,110
17,223
2,022
2,500
△57
△1,327
-
-
-
-
-
△2,500
2,115
△1,268
△37
-
7,168
14,627
1,985
-
F
C
リース負債
繰延税金負債
退職給付に係る負債
-
25
2,500
-
2,526
n
その他の非流動負債
78,993
△3,998
-
787
75,781
225,929
15,413
△12
3,294
244,624
負債合計
資本
資本金
資本剰余金
その他
流動負債合計
-
固定負債
固定負債合計
負債合計
非流動負債
社債
長期借入金
非流動負債合計
純資産の部
株主資本
資本金
資本剰余金
13,208
14,757
-
-
-
51
-
514
13,208
15,323
利益剰余金
自己株式
その他の包括利益累計額
その他有価証券評価差額
金
163,810
△1,947
-
△6,359
-
-
-
-
43,714
△6,403
-
△867
151,046
△1,947
42,846
1,868
-
△1,868
-
-
繰延ヘッジ損益
為替換算調整勘定
退職給付に係る調整累計
726
39,122
-
1,356
△726
△40,479
-
-
-
-
639
-
△639
-
-
-
-
-
-
220,477
12,105
-
-
△14
12,091
純資産合計
244,291
△5,002
51
△6,770
232,569
資本合計
負債純資産合計
470,221
10,410
38
△3,476
477,193
負債及び資本合計
額
非支配株主持分
L
o,A
利益剰余金
自己株式
その他の資本の構成要素
親会社の所有者に帰属す
る持分合計
非支配持分
前連結会計年度(2025年3月31日)の資本に対する調整
(単位:百万円)
日本基準表示科目
日本基準
表示組替
認識及び
測定の
差異
IFRS
注記
資産の部
流動資産
資産
流動資産
現金及び預金
受取手形及び売掛金
70,616
112,520
△10
△222
234
0
70,840
112,298
商品及び製品
原材料及び貯蔵品
その他
72,946
88,081
10,871
88,081
△88,081
△10,871
△309
-
-
160,718
-
-
貸倒引当金
△206
-
206
1,169
-
134
-
-
9,924
8,637
354,830
8,833
流動資産合計
固定資産
有形固定資産
建物及び構築物(純額)
IFRS表示科目
現金及び現金同等物
営業債権
a
棚卸資産
-
1,304
b
その他の金融資産
273
-
10,197
8,637
c
d
その他の流動資産
売却目的で保有する資産
333
363,997
流動資産合計
e,E
非流動資産
有形固定資産
F
使用権資産
32,572
20,763
-
-
f
B
無形資産
のれん
313
13,426
g
持分法で会計処理されてい
る投資
△16,631
-
-
-
△6,598
2,881
-
39
10,218
D
C
退職給付に係る資産
繰延税金資産
3,299
△3,299
-
-
△47
-
47
6,547
-
1,853
-
8,400
h,A
その他の金融資産
-
224
95
319
i
その他の非流動資産
241,550
△8,588
117
233,079
社債発行費
183
-
△183
-
繰延資産合計
183
-
△183
-
596,564
245
267
597,076
-
45,349
140,606
△45,349
△2,525
-
138,081
-
機械装置及び運搬具(純
額)
59,628
△59,628
-
-
土地
使用権資産(純額)
建設仮勘定
その他(純額)
19,705
7,287
21,334
3,200
△19,705
33
△21,334
△3,200
-
1,936
-
-
-
9,257
-
-
-
18,602
17,287
15,295
32,572
-
△17,287
△15,295
-
2,161
-
-
-
13,112
投資有価証券
退職給付に係る資産
繰延税金資産
16,631
6,638
7,336
その他
貸倒引当金
無形固定資産
のれん
顧客関連資産
その他
投資その他の資産
固定資産合計
非流動資産合計
繰延資産
資産合計
資産合計
(単位:百万円)
日本基準表示科目
負債の部
流動負債
支払手形及び買掛金
短期借入金
コマーシャル・ペーパー
日本基準
表示組替
認識及び
測定の
差異
IFRS
注記
46,075
175,284
20,000
△74
20,000
△20,000
537
-
-
46,538
195,284
-
未払法人税等
-
7,571
1,376
-
685
△5
2,062
7,566
賞与引当金
役員賞与引当金
3,941
47
△3,941
△47
-
-
-
-
その他
20,284
△20,284
-
-
-
10,213
△120
-
12,718
-
273,204
流動負債合計
固定負債
社債
k
IFRS表示科目
負債
流動負債
営業債務
借入金
j,F
リース負債
未払法人所得税
10,093
l
その他の金融負債
1,345
14,063
m,G,H
259
-
259
220
2,443
275,867
d
その他の流動負債
売却目的で保有する資産に
直接関連する負債
流動負債合計
非流動負債
社債
31,000
-
△188
30,811
長期借入金
リース債務
繰延税金負債
退職給付に係る負債
57,691
4,805
10,873
1,851
-
△5
-
-
△65
1,868
△96
△66
57,625
6,668
10,777
1,784
その他
2,613
-
△2,613
2,613
-
-
-
2,613
108,835
△5
1,452
110,282
負債合計
382,040
214
3,895
386,150
負債合計
純資産の部
株主資本
資本金
13,208
-
-
13,208
資本
資本金
資本剰余金
利益剰余金
自己株式
その他の包括利益累計額
その他有価証券評価差額金
8,503
155,205
△1,919
-
1,305
30
-
-
35,499
△1,305
△91
△4,260
-
746
-
8,443
150,944
△1,919
36,245
-
繰延ヘッジ損益
為替換算調整勘定
退職給付に係る調整累計額
△560
34,898
△143
560
△34,898
143
-
-
-
-
-
-
-
-
-
206,923
4,025
-
△22
4,003
固定負債合計
非支配株主持分
F
C
長期借入金
リース負債
繰延税金負債
退職給付に係る負債
n
その他の非流動負債
非流動負債合計
L
o,A
資本剰余金
利益剰余金
自己株式
その他の資本の構成要素
親会社の所有者に帰属する
持分合計
非支配持分
純資産合計
214,524
30
△3,628
210,926
資本合計
負債純資産合計
596,564
245
267
597,076
負債及び資本合計
前連結会計年度(自
2024年4月1日
至
2025年3月31日)に係る損益及び包括利益に対する調整
(単位:百万円)
日本基準
表示組替
認識及び
測定の
差異
IFRS
注記
売上高
売上原価
671,211
591,984
-
446
△3
△2,858
671,207
589,572
p,I
売上総利益
79,227
△446
2,855
81,635
販売費及び一般管理費
69,332
171
1,969
71,473
B,I
販売費及び一般管理費
-
-
1,398
523
609
138
2,008
662
p
p
その他収益
その他費用
営業利益
9,895
256
1,356
11,508
営業外収益
3,267
△3,267
-
-
営業外費用
7,858
△7,858
-
-
特別利益
特別損失
990
443
-
-
△990
△443
1,914
7,530
-
-
△633
48
-
-
1,280
7,579
p
p
金融収益
金融費用
-
1,315
375
1,690
p,B
持分法による投資損益
日本基準表示科目
税金等調整前当期純利益
法人税、住民税及び事業税
法人税等調整額
当期純利益
5,850
-
1,049
6,900
12,654
△10,586
△10,586
10,586
△554
-
1,512
-
3,783
-
1,604
5,387
IFRS表示科目
売上高
売上原価
売上総利益
営業利益
税引前当期利益
q
法人所得税費用
当期利益
その他の包括利益(税効果控
その他の包括利益
除後)
その他有価証券評価差額金
△563
-
709
145
A
退職給付に係る調整額
△783
-
901
118
D
-
-
△0
△0
繰延ヘッジ損益
△1,283
-
1,290
6
為替換算調整勘定
△6,254
-
△117
△6,372
純損益に振り替えられること
のない項目
その他の包括利益を通じて
測定する金融資産の公正価
値の純変動
持分法適用会社に対する持
分相当額
その他の包括利益合計
包括利益
J
確定給付制度の再測定
持分法適用会社におけるそ
の他の包括利益に対する持
分
純損益に振り替えられる可能
性のある項目
キャッシュ・フロー・ヘッ
ジ
在外営業活動体の換算差額
420
-
45
465
持分法適用会社におけるそ
の他の包括利益に対する持
分
△8,464
-
2,828
△5,636
その他の包括利益(税効果
控除後)合計
△4,681
-
4,432
△248
当期包括利益
調整に関する注記
(1)表示組替
a.棚卸資産
日本基準において区分掲記している商品及び製品、原材料及び貯蔵品を、IFRSにおいては「棚卸資産」と
して一括表示しております。
b.その他の金融資産(流動資産)
日本基準においてその他(流動資産)に含めている為替予約等を、IFRSにおいては「その他の金融資産」
(流動資産)として表示しております。
c.その他の流動資産
日本基準においてその他(流動資産)に含めている前渡金、仮払法人税及び未収法人税等を、IFRSにおい
ては「その他の流動資産」として表示しております。
d.売却目的で保有する資産、売却目的で保有する資産に直接関連する負債
IFRSにおいては売却目的で保有する資産又は処分グループを「売却目的で保有する資産」及び「売却目的
で保有する資産に直接関連する負債」として表示しております。
e.有形固定資産
日本基準において区分掲記している建物及び構築物、機械装置及び運搬具、土地等を、IFRSにおいては
「有形固定資産」として表示しております。
f.無形資産
日本基準において区分掲記している顧客関連資産、その他(無形固定資産)に含めている商標権及びソフ
トウェア等を、IFRSにおいては「無形資産」として表示しております。
g.持分法で会計処理されている投資
日本基準において投資有価証券に含めている持分法で会計処理されている投資を、IFRSにおいては「持分
法で会計処理されている投資」として表示しております。
h.その他の金融資産(非流動資産)
日本基準において投資有価証券に含めている上場株式及び非上場株式、その他(投資その他の資産)に含
めている差入保証金及び出資金等を、IFRSにおいては「その他の金融資産」(非流動資産)として表示して
おります。
i.その他の非流動資産
日本基準においてその他(投資その他の資産)に含めている長期前払費用等を、IFRSにおいては「その他
の非流動資産」として表示しております。
j.リース負債
日本基準においてその他(流動負債)に含めているリース債務を、IFRSにおいては「リース負債」(流動
負債)として表示しております。
k.借入金
日本基準において区分掲記しているコマーシャル・ペーパーを、IFRSにおいては「借入金」に含めて表示
しております。
l.その他の金融負債(流動負債)
日本基準においてその他(流動負債)に含めている設備未払金及び未払金等を、IFRSにおいては「その他
の金融負債」(流動負債)として表示しております。
m.その他の流動負債
日本基準において区分掲記している賞与引当金、その他(流動負債)に含めている未払費用等を、IFRSに
おいては「その他の流動負債」として表示しております。
n.その他の非流動負債
日本基準においてその他(固定負債)に含めている長期預り金等を、IFRSにおいては「その他の非流動負
債」として表示しております。
o.その他の資本の構成要素
日本基準において区分掲記している為替換算調整勘定、退職給付に係る調整累計額、その他有価証券評価
差額金、繰延ヘッジ損益を、IFRSにおいては「その他の資本の構成要素」として表示しております。
p.営業外損益、特別損益
日本基準では営業外収益、営業外費用、特別利益及び特別損失に表示していた収益及び費用について、
IFRSでは、財務関連項目を「金融収益」及び「金融費用」、減損損失等を「売上原価」、それ以外の項目を
「その他収益」及び「その他費用」又は「持分法による投資損益」に含めて表示しております。
q.法人所得税費用
日本基準では「法人税、住民税及び事業税」、「法人税等調整額」を区分掲記しておりましたが、IFRSで
は「法人所得税費用」として一括して表示しております。
(2)認識及び測定の差異
A.非上場株式
日本基準では、非上場株式について取得原価で計上しておりました。IFRSでは、IFRS第9号に基づきその
他の包括利益を通じて公正価値で測定する資本性金融商品に分類しており、市場性の有無に関係なく公正価
値で測定し、その変動額はその他の包括利益を通じて認識しております。
B.のれん
日本基準では合理的に見積もられたのれんの効果が及ぶ期間にわたって定額法によりのれんを償却してお
りましたが、IFRSでは企業結合により発生したのれんは、償却せずに毎期減損テストを行っております。
C.繰延税金資産及び負債
日本基準では、棚卸資産のグループ内の取引に係る未実現損益に係る繰延税金資産を売却元の実効税率を
用いて計算していましたが、IFRSでは、売却先の実効税率を用いて計算しております。また、日本基準から
IFRSへの調整に伴い一時差異が発生したこと及び繰延税金資産の回収可能性を再検討したこと等により、繰
延税金資産及び繰延税金負債の金額を調整しております。
D.従業員給付
日本基準では、確定給付制度による退職給付について、勤務費用、利息費用及び期待運用収益を純損益と
して認識していました。また、当該制度から生じた数理計算上の差異及び過去勤務費用のうち費用処理され
ない部分については、その他の包括利益累計額として認識し、その後、将来の一定期間にわたり純損益とし
て認識していました。
一方、IFRSでは、確定給付制度による退職後給付について、当期勤務費用及び過去勤務費用は純損益とし
て認識し、純利息費用は確定給付負債(資産)の純額に割引率を乗じた金額を純損益として認識しておりま
す。また、確定給付負債(資産)の純額の再測定はその他の包括利益として認識し、発生時にその他の資本の
構成要素から、純損益を通さずに、直接利益剰余金に振り替えております。なお、再測定は、確定給付制度
債務に係る数理計算上の差異、制度資産に係る収益(制度資産に係る利息収益の金額を除く)により構成され
ております。
また、確定給付制度が積立超過となる場合には、制度からの返還又は将来掛金の減額という利用可能な将
来の経済的便益の現在価値が資産上限額となります。
E.みなし原価
IFRS適用にあたってIFRS第1号にあるみなし原価の免除規定を適用し、一部の有形固定資産について移行
日現在の公正価値をみなし原価としております。
当該有形固定資産の移行日現在の公正価値は2,901百万円であり、日本基準の帳簿価額に対して2,532百万
円を減額しております。
F.リース負債及び使用権資産
日本基準では、借手のリースについてファイナンス・リースとオペレーティング・リースに分類し、オペ
レーティング・リースについては通常の賃貸借取引に係る方法に準じた会計処理を行っておりました。IFRS
では、借手のリースについてファイナンス・リース又はオペレーティング・リースに分類せず、リース取引
について使用権資産及びリース負債を認識しております。
G.有給休暇引当金
日本基準では認識が要求されていなかった未消化の有給休暇について、IFRSでは引当金を認識していま
す。
H.賦課金
日本基準では、納付義務の発生した固定資産税等の賦課金に該当する項目について、会計年度にわたり費
用処理していましたが、IFRSでは納付義務の発生した時期に全額費用処理しています。
I.棚卸資産
日本基準では、一部の子会社において、顧客へ製品を運送するための費用及び流通費を、棚卸資産の原価
に含めていましたが、IFRSでは棚卸資産が現在の場所又は状態に至るために発生した費用以外は、「販売費
及び一般管理費」として発生時費用処理しています。
J.金融商品(為替予約)
日本基準では、為替予約に係るヘッジ会計の適用について、一部の子会社では、振当処理を行っておりま
した。IFRSでは、キャッシュ・フロー・ヘッジの方法により処理をしております。
K.連結範囲の変更
日本基準では、重要性の乏しい子会社及び関連会社について、原価法により評価していましたが、IFRSで
は、子会社及び持分法適用会社として連結範囲に含めております。
L.利益剰余金に対する調整
上記調整による利益剰余金の影響は次のとおりであります。(△:損失)
(単位:百万円)
移行日
(2024年4月1日)
前連結会計年度
(2025年3月31日)
非上場株式(注記A参照)
193
115
のれん(注記B参照)
-
2,285
繰延税金資産及び負債(注記C参照)
368
608
従業員給付(注記D参照)
△4,207
△4,621
みなし原価(注記E参照)
△1,908
△1,908
リース負債及び使用権資産(注記F参照)
△60
△46
有給休暇引当金(注記G参照)
△789
△862
賦課金(注記H参照)
△388
△381
棚卸資産(注記I参照)
△253
△309
金融商品(為替予約)(注記J参照)
-
13
連結範囲の変更(注記K参照)
37
239
その他
604
606
△6,403
△4,260
利益剰余金調整額
前連結会計年度(自
2024年4月1日
至
2025年3月31日)に係るキャッシュ・フローに対する調整
日本基準に準拠し開示していた連結キャッシュ・フロー計算書と、IFRSに準拠し開示している連結キャッシ
ュ・フロー計算書に、重要な差異はありません。
(2)【その他】
当連結会計年度における半期情報等
中間連結会計期間当連結会計年度
売上高
(百万円)
375,696
772,288
税引前中間(当期)利益
(百万円)
11,179
23,430
親会社の所有者に帰属する中間(当期)利益
(百万円)
8,539
11,142
(円)
99.32
129.60
基本的1株当たり中間(当期)利益
2【財務諸表等】
(1)【財務諸表】
①【貸借対照表】
(単位:百万円)
前事業年度
(2025年3月31日)
資産の部
流動資産
現金及び預金
受取手形
売掛金
商品及び製品
原材料及び貯蔵品
前渡金
前払費用
短期貸付金
その他
貸倒引当金
流動資産合計
固定資産
有形固定資産
建物
構築物
機械及び装置
車両及び運搬具
工具、器具及び備品
土地
建設仮勘定
有形固定資産合計
無形固定資産
ソフトウェア
ソフトウェア仮勘定
その他
無形固定資産合計
投資その他の資産
投資有価証券
関係会社株式
関係会社出資金
長期貸付金
長期前払費用
前払年金費用
その他
貸倒引当金
投資その他の資産合計
固定資産合計
繰延資産
社債発行費
繰延資産合計
資産合計
当事業年度
(2026年3月31日)
12,678
-
-
-
-
-
179
※1 85,153
※1 1,953
△9
99,955
1,738
973
※1 39,655
25,894
26,811
210
572
※1 55,366
※1 3,689
△10
154,903
59
4
76
0
226
10,604
-
10,972
※3 19,024
1,528
2,663
11
4,203
※3 3,224
3,050
166,485
11,411
※1 182
0
34
100
△1
181,264
196,440
3,674
157,650
11,411
※1 7,992
247
6,890
636
△34
188,469
256,159
183
183
296,579
134
134
411,197
※3 5,893
※3 14,692
29
※3 1,642
10,579
8,107
59,971
4,459
34
7,719
(単位:百万円)
前事業年度
(2025年3月31日)
負債の部
流動負債
支払手形
買掛金
短期借入金
コマーシャル・ペーパー
未払金
未払費用
未払法人税等
未払消費税等
預り金
賞与引当金
役員賞与引当金
その他
流動負債合計
固定負債
社債
長期借入金
繰延税金負債
長期未払法人税等
退職給付引当金
その他
固定負債合計
負債合計
純資産の部
株主資本
資本金
資本剰余金
資本準備金
その他資本剰余金
資本剰余金合計
利益剰余金
利益準備金
その他利益剰余金
買換資産積立金
配当準備積立金
別途積立金
繰越利益剰余金
利益剰余金合計
自己株式
株主資本合計
評価・換算差額等
その他有価証券評価差額金
繰延ヘッジ損益
評価・換算差額等合計
純資産合計
負債純資産合計
当事業年度
(2026年3月31日)
-
-
122,435
20,000
※1 765
※1 318
9
-
※1 3,748
202
7
13
147,501
13
※1 16,113
96,085
20,000
※1 4,207
※1 1,104
2,033
3
※1 6,009
2,863
73
42
148,549
31,000
41,000
244
67
-
※1 9
72,321
219,822
31,000
77,534
1,985
-
130
125
110,774
259,324
13,208
13,208
18,324
214
18,539
18,324
474
18,798
2,017
2,017
301
2,250
32,000
9,124
45,693
△1,919
75,521
301
2,250
32,000
83,004
119,573
△2,154
149,426
1,236
-
1,236
76,757
296,579
1,482
964
2,447
151,873
411,197
②【損益計算書】
(単位:百万円)
(自
至
売上高
売上原価
売上総利益
販売費及び一般管理費
営業収益
営業費用
営業利益
営業外収益
受取配当金
受取利息
その他
営業外収益合計
営業外費用
支払利息
その他
営業外費用合計
経常利益
特別利益
投資有価証券売却益
固定資産売却益
抱合株式消滅差益
その他
特別利益合計
特別損失
関係会社株式評価損
関係会社事業再構築損失
投資有価証券売却損
固定資産売却損
固定資産処分損
減損損失
特別損失合計
税引前当期純利益又は税引前当期純損失(△)
法人税、住民税及び事業税
法人税等調整額
法人税等合計
当期純利益又は当期純損失(△)
前事業年度
2024年4月1日
2025年3月31日)
(自
至
-
-
-
-
※1 10,139
※1,※2 5,800
4,339
※1,※3 24,846
※1 224,110
※1 179,381
44,728
-
-
19,882
87
※1 6,484
※1 2,602
※1 3,698
※1 93
※1 987
2,783
11,170
※1 2,585
※1 4,745
※1 957
※1 1,224
3,542
3,579
5,970
25,082
※4 634
※4 286
-
-
-
634
当事業年度
2025年4月1日
2026年3月31日)
3
※5 61,068
8
61,366
※6 33,976
※6 1,521
125
8
-
1
-
34,112
△29,897
※8 △424
198
△226
△29,671
-
-
8
341
※7 1,475
3,347
83,102
4,819
△76
4,742
78,359
③【株主資本等変動計算書】
前事業年度(自 2024年4月1日
至
2025年3月31日)
(単位:百万円)
株主資本
資本剰余金
利益剰余金
その他利益剰余金
資本金
資本準備金
その他資本
剰余金
18,324
214
資本剰余
利益準備金
買換資産
金合計
積立金
利益剰余
金合計
配当準備
積立金
別途
積立金
繰越利益
剰余金
2,250
32,000
43,270
79,839
0
0
43,271
79,840
剰余金の配当
△4,475
△4,475
当期純損失(△)
△29,671
△29,671
当期首残高
会計方針の変更によ
る累積的影響額
会計方針の変更を反
映した当期首残高
13,208
13,208
18,324
18,539
214
2,017
18,539
301
2,017
301
2,250
32,000
当期変動額
自己株式の取得
自己株式の処分
株主資本以外の項
目の当期変動額
(純額)
当期変動額合計
当期末残高
-
-
-
-
-
-
-
-
△34,147
△34,147
13,208
18,324
214
18,539
2,017
301
2,250
32,000
9,124
45,693
株主資本
当期首残高
会計方針の変更によ
る累積的影響額
会計方針の変更を反
映した当期首残高
評価・換算差額等
自己株式
株主資本
合計
その他有価
証券評価差
額金
△1,947
109,640
1,768
繰延ヘッジ 評価・換算
損益
差額等合計
-
1,768
0
△1,947
109,640
純資産合計
111,408
0
1,768
-
1,768
111,409
当期変動額
剰余金の配当
△4,475
△4,475
当期純損失(△)
△29,671
△29,671
自己株式の取得
△0
△0
△0
自己株式の処分
28
28
28
株主資本以外の項
目の当期変動額
(純額)
当期変動額合計
当期末残高
△532
△532
△532
27
△34,119
△532
-
△532
△34,651
△1,919
75,521
1,236
-
1,236
76,757
当事業年度(自
2025年4月1日
至
2026年3月31日)
(単位:百万円)
株主資本
資本剰余金
利益剰余金
その他利益剰余金
資本金
資本準備金
その他資本
剰余金
18,324
214
資本剰余
利益準備金
買換資産
金合計
積立金
利益剰余
金合計
配当準備
積立金
別途
積立金
繰越利益
剰余金
2,250
32,000
9,124
45,693
剰余金の配当
△4,479
△4,479
当期純利益
78,359
78,359
当期首残高
13,208
18,539
2,017
301
当期変動額
自己株式の取得
自己株式の処分
259
259
株主資本以外の項
目の当期変動額
(純額)
当期変動額合計
当期末残高
-
-
259
259
-
-
-
-
73,880
73,880
13,208
18,324
474
18,798
2,017
301
2,250
32,000
83,004
119,573
株主資本
当期首残高
評価・換算差額等
自己株式
株主資本
合計
その他有価
証券評価差
額金
△1,919
75,521
1,236
繰延ヘッジ 評価・換算
損益
差額等合計
-
1,236
純資産合計
76,757
当期変動額
剰余金の配当
△4,479
△4,479
当期純利益
78,359
78,359
自己株式の取得
△421
△421
△421
自己株式の処分
186
446
446
株主資本以外の項
目の当期変動額
(純額)
当期変動額合計
当期末残高
246
964
1,211
1,211
△235
73,904
246
964
1,211
75,116
△2,154
149,426
1,482
964
2,447
151,873
【注記事項】
(重要な会計方針)
1.有価証券の評価基準及び評価方法
(1) 子会社株式及び関連会社株式
移動平均法による原価法
(2) その他有価証券
市場価格のない株式等以外のもの
時価法(評価差額は全部純資産直入法により処理し、売却原価は移動平均法により算定)
市場価格のない株式等
移動平均法による原価法
2.棚卸資産の評価基準及び評価方法
移動平均法に基づく原価法(貸借対照表価額は収益性の低下による簿価切下げの方法により算定)
3.デリバティブの評価基準及び評価方法
時価法
4.固定資産の減価償却の方法
(1) 有形固定資産(リース資産を除く)
定額法によっております。なお、取得価額が10万円以上20万円未満の一括償却資産については、法人税法の規定
に基づき3年間で均等償却しております。
(2) 無形固定資産(リース資産を除く)
定額法によっております。ただし、自社利用のソフトウェアについては、社内における利用可能期間(5年)に
基づく定額法によっております。
(3) リース資産
リース期間を耐用年数とし、残存価額を零とする定額法を採用しております。
5.外貨建の資産及び負債の本邦通貨への換算基準
外貨建金銭債権債務は、決算日の直物為替相場により円貨に換算し、換算差額は損益として処理しております。
6.引当金の計上基準
(1) 貸倒引当金
債権の貸倒れによる損失に備えるため、一般債権については貸倒実績率により、貸倒懸念債権等特定の債権につ
いては個別に回収可能性を考慮し、回収不能見込額を計上しております。
(2) 賞与引当金
従業員に対する賞与の支給に備えるため、支給見込額を計上しております。
(3) 役員賞与引当金
役員賞与の支給に備えるため、支給見込額を計上しております。
(4) 退職給付引当金
従業員の退職給付に備えるため、当事業年度末における退職給付債務及び年金資産の見込額に基づき計上してお
ります。
①
退職給付見込額の期間帰属方法
退職給付債務の算定にあたり、退職給付見込額を当事業年度までの期間に帰属させる方法については、給付算
定式基準によっております。
②
数理計算上の差異及び過去勤務費用の費用処理方法
過去勤務費用については、その発生時の従業員の平均残存勤務期間以内の一定の年数(5年)による定額法に
より費用処理しております。
数理計算上の差異については、各事業年度の発生時における従業員の平均残存勤務期間以内の一定の年数(15
年)による定額法により按分した額をそれぞれ発生の翌事業年度から費用処理しております。
7.収益及び費用の計上基準
下記の5ステップアプローチに基づいて、収益を認識しております。
ステップ1:顧客との契約を識別する。
ステップ2:契約における履行義務を識別する。
ステップ3:取引価格を算定する。
ステップ4:契約における履行義務に取引価格を配分する。
ステップ5:履行義務を充足した時に又は充足するにつれて収益を認識する。
(1) 物品販売に係る収益認識
当社では、主に植物性油脂や業務用チョコレート、乳化・発酵素材、大豆加工素材等の販売を行っており、この
ような物品販売は、物品を引き渡した時点において、顧客が当該物品に対する支配を獲得することにより、当社の
履行義務が充足され、上記収益認識の要件を満たすこととなります。そのため、顧客に物品を引き渡した時点にお
いて収益を認識しております。
(2) 変動対価が含まれる取引に係る収益認識(リベート取引)
物品販売に係る収益のうち、取引高リベート並びに目標達成リベートについて、取引価格から減額しておりま
す。
(3) 原材料有償支給取引に係る収益認識
原材料有償支給取引について、支給品を買い戻す義務を負っている場合、当該支給品の消滅を認識しておりませ
ん。
8.ヘッジ会計の方法
(1) ヘッジ会計の方法
繰延ヘッジ処理によっております。また、金利スワップについては、特例処理の要件を満たしている場合、特例
処理を採用し、一体処理(特例処理・振当処理)の要件を満たす金利通貨スワップについては、一体処理を採用し
ております。
(2) ヘッジ手段とヘッジ対象
① ヘッジ手段…為替予約取引
②
③
ヘッジ対象…外貨建取引(金銭債権債務及び予定取引)
ヘッジ手段…金利スワップ
ヘッジ対象…借入金利息
ヘッジ手段…金利通貨スワップ
ヘッジ対象…外貨建借入金
(3) ヘッジ方針及びヘッジ有効性評価の方法
外貨建取引に係る将来の為替相場の変動リスクを回避する目的で、外貨建債権債務の残高及び成約高の範囲内で
為替予約取引を利用する方針であり、それぞれの部署ごとにその有効性の評価を行い、経理部門においてチェック
を行う体制をとっております。また、借入金利息及び外貨建借入金に係る将来の金利及び為替相場の変動リスクを
回避する目的で、特定の約定に基づく借入金利息及び外貨建借入金について、金利スワップ及び金利通貨スワップ
を利用することとしております。
なお、特例処理によっている金利スワップ及び一体処理(特例処理・振当処理)によっている金利通貨スワップ
については、有効性の評価を省略しております。
9.その他財務諸表作成のための基本となる重要な事項
(1) グループ通算制度の適用
グループ通算制度を適用しております。
(2) 退職給付に係る会計処理
退職給付に係る未認識数理計算上の差異及び未認識過去勤務費用の未処理額の会計処理の方法は、連結財務諸表
におけるこれらの会計処理の方法と異なっております。
(重要な会計上の見積り)
会計上の見積りは、財務諸表作成時に入手可能な情報に基づいて合理的な金額を算出しております。当事業年度の財
務諸表に計上した金額が会計上の見積りによるもののうち、翌事業年度の財務諸表に重要な影響を及ぼすリスクがある
項目は以下のとおりです。
(関係会社株式の評価)
(1) 当事業年度の財務諸表に計上した金額
当事業年度末の貸借対照表における「関係会社株式」の計上金額は、157,650百万円(前事業年度166,485百万
円)です。このうち超過収益力を反映して取得し、市場価格のない株式などとしてPROVENCE HUILES S.A.S(以下
「PROVENCE HUILES」)株式が17,201百万円含まれております。
(2) 会計上の見積りの内容について財務諸表利用者の理解に資するその他の情報
当事業年度末におけるPROVENCE HUILESに対する投資の実質価額は、実際の経営成績及び経営者が承認した5年
間の事業計画に基づいて算定しております。また、事業計画の見積期間を超える期間の将来キャッシュ・フロー
は、5年目までの事業計画に基づく趨勢を踏まえた一定の成長率により算定しております。投資の実質価額の算定
に用いる将来キャッシュ・フローは、経営者が作成した5年間の事業計画を基礎として見積りを行っており、販売
数量の拡大見込み及び原材料価格高騰の影響に対する顧客への転嫁見込みに加え、設備投資に伴う製造工程の内製
化によるコスト削減など一定の仮定を設定しております。これらの仮定は経営者の最善の見積りにより決定してい
ますが、将来の経済条件や事業計画などの変化によって影響を受ける可能性があり、見直しが必要となった場合、
関係会社株式の減損処理が必要となり、翌事業年度の財務諸表に重要な影響を与える可能性があります。
(会計方針の変更)
(ヘッジ会計)
従来、デリバティブ取引のうち、振当処理の要件を満たしている為替予約は振当処理を採用していましたが、当事
業年度より、繰延ヘッジ処理に変更しました。
この変更は、当社グループの連結決算において当連結会計年度から国際財務報告基準(IFRS)の適用を開始したこ
とを契機として、為替予約取引に係る管理体制及び会計処理の在り方について見直しを行った結果、当社単体の財務
諸表においても繰延ヘッジ処理を適用することが、財務諸表の表示をより適切なものとすると判断したことによるも
のです。
なお、当該会計方針の変更は、遡及適用され、前事業年度については遡及適用後の財務諸表となっています。ま
た、この変更による当事業年度の財務諸表への影響は軽微であります。
(未適用の会計基準等)
「リース取引に関する会計基準」(企業会計基準第34号 2024年9月13日)
「リース取引に関する会計基準の適用指針」(企業会計基準適用指針第33号
(1) 概要
2024年9月13日)
同基準は、借手の会計処理として、借手のリースの費用配分の方法については、IFRS第16号と同様に、リースが
ファイナンス・リースであるかオペレーティング・リースであるかにかかわらず、全てのリースについて使用権資
産に係る減価償却費及びリース負債に係る利息相当額を計上する単一の会計処理モデルが適用されます。
(2) 適用予定日
2027年4月1日に開始する事業年度から適用する予定であります。
(3) 当該会計基準等の適用による影響
当該会計基準等の適用が財務諸表に与える影響については、現在検討中であります。
(表示方法の変更)
(貸借対照表)
(1) 構築物・機械及び装置・車両及び運搬具に係る表示方法の変更
従来、有形固定資産の「その他」に含めていた「構築物」「機械及び装置」「車両及び運搬具」は、金額的重要
性が増したため、当事業年度より独立掲記しております。この表示方法の変更を反映させるため、前事業年度の財
務諸表の組替を行っております。この結果、従来「その他」に表示していた82百万円は、「構築物」4百万円、
「機械及び装置」76百万円、「車両及び運搬具」0百万円として組み替えております。
(2) ソフトウェア仮勘定に係る表示方法の変更
従来、無形固定資産の「その他」に含めていた「ソフトウェア仮勘定」は、金額的重要性が増したため、当事業
年度より独立掲記しております。この表示方法の変更を反映させるため、前事業年度の財務諸表の組替を行ってお
ります。この結果、従来「その他」に表示していた2,675百万円は、「ソフトウェア仮勘定」2,663百万円、「その
他」11百万円として組み替えております。
(3) 長期前払費用・前払年金費用に係る表示方法の変更
従来、投資その他の資産の「その他」に含めていた「長期前払費用」「前払年金費用」は、金額的重要性が増し
たため、当事業年度より独立掲記しております。この表示方法の変更を反映させるため、前事業年度の財務諸表の
組替を行っております。この結果、従来「その他」に表示していた136百万円は、「長期前払費用」0百万円、
「前払年金費用」34百万円、「その他」100百万円として組み替えております。
(損益計算書)
営業外収益及び営業外費用に係る表示方法の変更
「営業外収益」の「受取配当金」「受取利息」は、金額的重要性が増したため、当事業年度より独立掲記するこ
ととしました。この表示方法の変更を反映させるため、前事業年度の財務諸表の組替を行っております。この結
果、従来「営業外収益」と表示していた2,783百万円を「受取配当金」87百万円、「受取利息」2,602百万円、「そ
の他」93百万円として組み替えております。
「営業外費用」の「支払利息」は、金額的重要性が増したため、当事業年度より独立掲記することとしました。
この表示方法の変更を反映させるため、前事業年度の財務諸表の組替を行っております。この結果、従来「営業外
費用」と表示していた3,542百万円を「支払利息」2,585百万円、「その他」957百万円として組み替えておりま
す。
(追加情報)
(取締役に対する株式報酬制度)
当社は、2022年6月21日開催の第94回定時株主総会決議に基づき、当社取締役(社外取締役及び監査等委員である
取締役を除く)を対象に、取締役の報酬と当社の株式価値との連動性をより明確にし、取締役が株価の変動による利
益・リスクを株主の皆様と共有することで、中長期的な業績の向上と企業価値の増大に貢献する意識を高めることを
目的として、業績連動型株式報酬(株式交付信託)制度(以下「本制度」)を導入しております。
本制度にかかる会計処理については、「従業員等に信託を通じて自社の株式を交付する取引に関する実務上の取
扱い」(実務対応報告第30号 2015年3月26日)に準じております。
(1) 取引の概要
本制度は、当社が金銭を拠出することにより設定する信託(以下「本信託」)が当社株式を取得し、当社が各
取締役に付与するポイントの数に相当する数の当社株式が本信託を通じて各取締役に対して交付されるという株
式報酬制度です。取締役が当社株式の交付を受ける時期は、原則として取締役の退任時です。
(2) 信託に残存する自社の株式
信託に残存する当社株式を、信託における帳簿価額(付随費用の金額を除く)により純資産の部に自己株式と
して計上しております。当連結会計年度末における当該自己株式の帳簿価額及び株式数は、687百万円、239千株
です。
(事業持株会社への移行に伴う表示区分の変更)
(損益計算書)
当社は2025年4月1日付で純粋持株会社から事業持株会社に移行しました。これに伴い、前事業年度において
「営業収益」、「営業費用」と区分していましたが、当事業年度からは「売上高」、「売上原価」、「販売費及び
一般管理費」の区分も追加しております。さらに「営業収益」と表示しておりましたグループ会社からの受取配当
金は営業活動に該当しないと判断し、当事業年度においては「営業外収益」として表示しております。なお、前事
業年度の損益計算書における表示区分は変更しておりません。
(貸借対照表関係)
※1
関係会社に係る注記
独立掲記されたもの以外で関係会社に対する金銭債権又は金銭債務の金額は、以下のとおりです。
前事業年度
(2025年3月31日)
※2
当事業年度
(2026年3月31日)
短期金銭債権
長期金銭債権
短期金銭債務
86,513百万円
182百万円
3,727百万円
61,284百万円
7,992百万円
9,095百万円
長期金銭債務
9百万円
-百万円
保証債務
保証債務は以下のとおりです。
前事業年度
(2025年3月31日)
当事業年度
(2026年3月31日)
金融機関からの借入金に対する保証
金融機関からの借入金に対する保証
Blommer Chocolate Company, LLC
48,594百万円
Blommer Chocolate Company, LLC
15,988百万円
FUJI OIL EUROPE
INDUSTRIAL FOOD SERVICES PTY
11,684百万円
FUJI OIL EUROPE
INDUSTRIAL FOOD SERVICES PTY
10,835百万円
LIMITED
FUJI GLOBAL CHOCOLATE (M) SDN.
2,725百万円
LIMITED
4,387百万円
2,149百万円
PROVENCE HUILES S.A.S
2,751百万円
FUJI VEGETABLE OIL, INC.
1,906百万円
FUJI GLOBAL CHOCOLATE (M) SDN.
BHD.
2,531百万円
Fuji Brandenburg GmbH
BHD.
1,296百万円
Fuji Brandenburg GmbH
1,650百万円
UNIFUJI SDN. BHD.
HARALD INDÚSTRIA E COMÉRCIO DE
ALIMENTOS LTDA
FREYABADI (THAILAND) CO., LTD.
790百万円
FUJI OIL ASIA PTE. LTD.
1,614百万円
520百万円
FUJI VEGETABLE OIL, INC.
1,120百万円
440百万円
UNIFUJI SDN. BHD.
206百万円
FUJI OIL (THAILAND) CO., LTD.
228百万円
FREYABADI (THAILAND) CO., LTD.
97百万円
FUJI OIL (THAILAND) CO., LTD.
48百万円
取引保証
取引保証
㈱フジサニーフーズ
計
43百万円
70,379百万円
㈱フジサニーフーズ
計
(注)1.上記の債務保証に対して、他社から再保証を受けている金額は以下のとおりです。
前事業年度(2025年3月31日)
UNIFUJI SDN. BHD.
200百万円
FREYABADI (THAILAND) CO., LTD.
220百万円
当事業年度(2026年3月31日)
UNIFUJI SDN. BHD.
71百万円
FREYABADI (THAILAND) CO., LTD.
48百万円
2.上記の債務保証に対して、当社が再保証を行っている金額は以下のとおりです。
前事業年度(2025年3月31日)
UNIFUJI SDN. BHD.
389百万円
当事業年度(2026年3月31日)
UNIFUJI SDN. BHD.
63百万円
39百万円
41,271百万円
※3
圧縮記帳
国庫補助金の受入れにより、取得価額から控除している圧縮記帳累計額は次のとおりであります。
前事業年度
(2025年3月31日)
当事業年度
(2026年3月31日)
建物
構築物
-百万円
-百万円
0百万円
91百万円
機械及び装置
工具、器具及び備品
-百万円
-百万円
428百万円
11百万円
ソフトウェア
-百万円
44百万円
計
-百万円
576百万円
大阪府新規事業促進補助金の受入れにより、取得価額から控除している圧縮記帳累計額は次のとおりでありま
す。
前事業年度
(2025年3月31日)
機械及び装置
当事業年度
(2026年3月31日)
-百万円
64百万円
保険差益により、取得価額から控除している圧縮記帳累計額は次のとおりであります。
前事業年度
(2025年3月31日)
当事業年度
(2026年3月31日)
建物
-百万円
2百万円
構築物
機械及び装置
-百万円
-百万円
1百万円
924百万円
計
-百万円
928百万円
(損益計算書関係)
※1
関係会社との取引に係る注記
関係会社との取引に係るものが次のとおり含まれております。
(自
至
前事業年度
2024年4月1日
2025年3月31日)
売上高
仕入高
販売費及び一般管理費
※2
22,736百万円
70,264百万円
454百万円
営業収益
営業費用
10,139百万円
771百万円
-百万円
-百万円
営業取引以外の収益
営業取引以外の費用
2,689百万円
127百万円
10,122百万円
8百万円
営業費用のうち主要な費目及び金額は、以下のとおりです。
前事業年度
2024年4月1日
2025年3月31日)
(自
至
当事業年度
2025年4月1日
2026年3月31日)
研究開発費
1,325百万円
-百万円
諸手数料
1,866百万円
-百万円
従業員給料及び手当
975百万円
-百万円
貸倒引当金繰入額
賞与引当金繰入額
役員賞与引当金繰入額
減価償却費
△150百万円
139百万円
7百万円
619百万円
-百万円
-百万円
-百万円
-百万円
販売費及び一般管理費のうち主要な費目及び金額は、以下のとおりです。
(自
至
※4
当事業年度
2025年4月1日
2026年3月31日)
-百万円
-百万円
-百万円
(自
至
※3
(自
至
前事業年度
2024年4月1日
2025年3月31日)
(自
至
当事業年度
2025年4月1日
2026年3月31日)
研究開発費
諸手数料
従業員給料及び手当
貸倒引当金繰入額
-百万円
-百万円
-百万円
-百万円
5,751百万円
3,415百万円
3,503百万円
△3百万円
賞与引当金繰入額
役員賞与引当金繰入額
-百万円
-百万円
738百万円
73百万円
減価償却費
製品発送費
-百万円
-百万円
1,100百万円
5,637百万円
退職給付費用
-百万円
87百万円
おおよその割合
販売費
-%
37%
一般管理費
-%
63%
投資有価証券売却益
前事業年度(自
2024年4月1日
至
2025年3月31日)
政策保有株式の一部売却により、634百万円を計上しております。
当事業年度(自
2025年4月1日
至
2026年3月31日)
政策保有株式の一部売却により、286百万円を計上しております。
※5
抱合株式消滅差益
前事業年度(自
2024年4月1日
至
2025年3月31日)
該当事項はありません。
当事業年度(自 2025年4月1日至 2026年3月31日)
2025年4月1日付で、当社の完全子会社であった旧不二製油株式会社を吸収合併したことにより抱合株式消滅
差益61,068百万円を計上しております。
※6
関係会社株式評価損
前事業年度(自
2024年4月1日
至
2025年3月31日)
当社の連結子会社であるBlommer Chocolate Company, LLCの株式について、超過収益力が減少したために実質
価額が著しく低下したことから関係会社株式評価損33,976百万円を計上しております。
当事業年度(自 2025年4月1日至 2026年3月31日)
当社の連結子会社であるFuji Brandenburg GmbHの株式について、実質価額が著しく低下したことから関係会
社株式評価損1,521百万円を計上しております。
※7
減損損失
前事業年度(自 2024年4月1日
該当事項はありません。
至
2025年3月31日)
当事業年度(自
至
2026年3月31日)
2025年4月1日
用途
種類
場所
減損損失
独身寮・研修所
建物、土地、構築物等
大阪府泉佐野市
865百万円
大豆たん白食品製造設備
建物、機械及び装置等
大阪府泉佐野市
610百万円
当社は、事業の種類別セグメントを主な基準に独立の最小のキャッシュ・フロー単位に基づき、資産をグルー
プ化して減損の検討を行っています。
独身寮・研修所については、売却の決定に伴い該当資産の帳簿価額を回収可能価額まで減額し、当該減少額を
減損損失として計上しております。その内訳は、土地528百万円、建物259百万円、構築物74百万円、その他1百
万円であります。減損損失の測定における回収可能価額は正味売却価額により算定しております。正味売却価額
は譲渡契約に基づく予定売却額により算定しております。
大豆たん白食品製造設備につきましては、収益性の低下により回収可能性が認められなくなったため、該当す
る資産の帳簿価額を回収可能価額まで減額し、当該減少額を減損損失として計上しております。その内訳は建物
及び構築物187百万円、機械装置及び運搬具420百万円、その他3百万円です。なお、減損損失の測定における回
収可能価額は使用価値により測定しており、将来キャッシュ・フローがマイナスであるため、回収可能価額を零
として評価しております。
※8
法人税、住民税及び事業税
前事業年度(自 2024年4月1日
至
2025年3月31日)
グローバル・ミニマム課税制度から生じる国際最低課税額67百万円を計上しております。
当事業年度(自
2025年4月1日
至
2026年3月31日)
該当事項はありません。
(有価証券関係)
子会社株式及び関連会社株式
前事業年度(2025年3月31日)
市場価格のない株式等の貸借対照表計上額
区分
子会社株式
関連会社株式
前事業年度
166,485百万円
-百万円
当事業年度(2026年3月31日)
市場価格のない株式等の貸借対照表計上額
区分
子会社株式
関連会社株式
当事業年度
157,650百万円
-百万円
(税効果会計関係)
1.繰延税金資産及び繰延税金負債の発生の主な原因別の内訳
前事業年度
(2025年3月31日)
当事業年度
(2026年3月31日)
繰延税金資産
関係会社株式評価損
15,272百万円
15,971百万円
会社分割に伴う子会社株式
減損損失
455百万円
42百万円
-百万円
331百万円
税務上の繰越欠損金
462百万円
-百万円
未払賞与
上場株式評価損
その他
61百万円
30百万円
64百万円
861百万円
38百万円
428百万円
繰延税金資産小計
16,388百万円
17,630百万円
評価性引当額
△15,948百万円
△16,056百万円
439百万円
1,574百万円
その他有価証券評価差額金
537百万円
650百万円
買換資産積立金
136百万円
136百万円
繰延ヘッジ損益
前払年金費用
-百万円
10百万円
456百万円
2,171百万円
繰延税金資産合計
繰延税金負債
0百万円
143百万円
繰延税金負債合計
その他
684百万円
3,559百万円
繰延税金負債の純額
244百万円
1,985百万円
(表示方法の変更)
前事業年度において、「繰延税金負債」の「その他」に含めておりました「前払年金費用」は、金額的重要性が
増したため、当事業年度より独立掲記しております。この表示方法の変更を反映させるため、前事業年度の注記の
組替を行っております。
この結果、前事業年度の注記において、「繰延税金負債」の「その他」に表示しておりました11百万円は、「前
払年金費用」10百万円、「その他」0百万円として組み替えております。
2.法定実効税率と税効果会計適用後の法人税等の負担率との間に重要な差異がある時の、当該差異の原因となった主
要な項目別の内訳
前事業年度
(2025年3月31日)
法定実効税率
(調整)
当事業年度
(2026年3月31日)
30.6%
30.6%
受取配当金等永久に益金に算入されない項目
交際費等一時差異でない項目
みなし外国税額控除
7.7%
△1.3%
-%
△24.5%
0.9%
△0.1%
住民税均等割
△0.0%
0.0%
評価性引当額
その他
△35.1%
△1.1%
△0.3%
△0.9%
0.8%
5.7%
税効果会計適用後の法人税等の負担率
3.法人税及び地方法人税の会計処理又はこれらに関する税効果会計の会計処理
当社は、グループ通算制度を適用しており、「グループ通算制度を適用する場合の会計処理及び開示に関する取扱
い」(実務対応報告第42号
示を行っております。
2021年8月12日)に従って、法人税及び地方法人税並びに税効果会計の会計処理及び開
(企業結合等関係)
(連結子会社の吸収合併)
当社は、2024年5月23日開催の取締役会において、当社を吸収合併存続会社、当社の完全子会社である不二製油株
式会社を吸収合併消滅会社とする吸収合併(以下「本合併」という。)を実施することを決議し、2025年4月1日付
で本合併を実施しております。また、同日付にて当社の商号を「不二製油グループ本社株式会社」から「不二製油株
式会社」へ変更いたしました。
(1) 取引の概要
① 被結合企業の名称及びその事業の内容
被結合企業の名称不二製油株式会社
事業の内容
植物性油脂、業務用チョコレート、乳化・発酵素材、大豆加工素材の事業における開発
及び製造販売
② 企業結合日
2025年4月1日
③ 企業結合の方法
当社を存続会社、不二製油株式会社を消滅会社とする吸収合併
④ 結合後企業の名称
不二製油株式会社(FUJI OIL CO., LTD.)
2025年4月1日付で商号を「不二製油グループ本社株式会社」から「不二製油株式会社」へ変更いたしました。
⑤ 企業結合の目的
事業環境の変化に対し、これまでに培った財務経理やESG等の機能軸による事業管理の強化を継続しつつ、事業
軸において人材をはじめとする経営資源の一元管理・最適配分を行い、事業戦略を推進・強化することを目的
に、本合併により事業持株会社制に移行することとしました。
⑥ 本合併に係る割当ての内容
本合併は、当社の完全子会社との吸収合併のため、株式その他の金銭等の割当ては行いません。
(2) 実施した会計処理の概要
「企業結合に関する会計基準」(企業会計基準第21号 2019年1月16日)及び「企業結合会計基準及び事業分離
等会計基準に関する適用指針」(企業会計基準適用指針第10号 2024年9月13日)に基づき、共通支配下の取引等
として会計処理を行っております。
(取得による企業結合)
当社は、2025年4月28日付でPROVENCE HUILES S.A.Sの株式を取得いたしました。詳細は、連結財務諸表注記
「39.企業結合及び非支配持分の取得」をご参照ください。
(収益認識関係)
顧客との契約から生じる収益を理解するための基礎となる情報は、「(重要な会計方針)7.収益及び費用の計上基
準」に記載の通りであります。
④【附属明細表】
【有形固定資産等明細表】
資産の種類
期首
帳簿価額
(百万円)
当期増加額
(百万円)
59
20,622
当期減少額
(百万円)
当期償却額
(百万円)
期末
帳簿価額
(百万円)
減価償却
累計額
(百万円)
期末
取得原価
(百万円)
487
1,168
19,024
24,414
43,439
454
5,893
10,866
16,760
3,069
14,692
77,327
92,020
11
29
157
187
629
1,642
6,984
8,626
10,579
16
10,596
有形固定資産
建物
(432)
91
(88)
487
(420)
0
(0)
14
構築物
4
6,434
機械及び装置
76
18,172
車両及び運搬具
0
41
226
2,059
10,604
514
17,550
9,442
(-)
8,107
8,107
10,972
65,395
11,063
5,333
59,971
119,767
179,738
工具、器具及び備品
土地
建設仮勘定
有形固定資産計
(4)
538
(528)
(1,475)
無形固定資産
ソフトウェア
1,528
2,671
(-)
975
3,224
ソフトウェア仮勘定
2,663
3,090
4,459
11
25
1,294
(-)
(-)
1
34
4,203
5,787
977
7,719
その他
無形固定資産計
1,294
(-)
(注)1 当期増加の主な要因は、2025年4月1日付で当社の完全子会社であった旧不二製油株式会社を吸収合併したこと
によるものであります。
建物
18,450百万円
土地
514百万円
構築物
4,584百万円
建設仮勘定
機械及び装置
14,180百万円
ソフトウェア
車両及び運搬具
19百万円
ソフトウェア仮勘定
工具、器具及び備品 1,193百万円
その他
2 当期減少額欄の( )は内数で、減損損失計上額であります。
9,293百万円
1,421百万円
234百万円
25百万円
3 減価償却累計額には、減損損失累計額が含まれております。
【引当金明細表】
区分
当期首残高
(百万円)
当期増加額
(百万円)
当期減少額
(百万円)
当期末残高
(百万円)
貸倒引当金
10
37
3
44
賞与引当金
202
2,863
202
2,863
役員賞与引当金
7
73
7
73
退職給付引当金
183
53
130
(2)【主な資産及び負債の内容】
連結財務諸表を作成しているため、記載を省略しております。
(3)【その他】
該当事項はありません。
第6【提出会社の株式事務の概要】
事業年度
4月1日から3月31日まで
定時株主総会
6月中
基準日
3月31日
剰余金の配当の基準日
1単元の株式数
9月30日
3月31日
100株
単元未満株式の買取り
取扱場所
株主名簿管理人
(特別口座)
大阪市中央区北浜四丁目5番33号三井住友信託銀行株式会社証券代行部
(特別口座)
東京都千代田区丸の内一丁目4番1号三井住友信託銀行株式会社
取次所
買取手数料
──────
無料
当社の公告方法は、電子公告とします。ただし、事故その他のやむを得ない事由に
よって電子公告による公告をすることができない場合は、日本経済新聞に掲載して
公告掲載方法
公告します。
なお、電子公告は当社のホームページに掲載しており、そのアドレスは次のとおり
であります。
https://www.fujioil.co.jp/
(1) 対象株主
株主に対する特典
同年度の9月末日及び3月末日を基準日とする株主名簿に同一株主番号・100
株以上保有で記載された株主
(2) 優待内容
①
②
③
100株以上200株未満保有株主
200株以上1,000株未満保有株主
1,000株以上
1,000円相当の優待品
3,000円相当の優待品
4,500円相当の優待品
第7【提出会社の参考情報】
1【提出会社の親会社等の情報】
当社には、金融商品取引法第24条の7第1項に規定する親会社等はありません。
2【その他の参考情報】
当事業年度の開始日から有価証券報告書提出日までの間に次の書類を提出しております。
(1) 有価証券報告書及びその添付書類並びに確認書
事業年度(第97期)(自
2024年4月1日
至
2025年3月31日)2025年6月27日関東財務局長に提出。
(2) 内部統制報告書及びその添付書類
2025年6月27日関東財務局長に提出。
(3) 半期報告書及び確認書
(第98期中)(自 2025年4月1日
至
2025年9月30日)2025年11月11日関東財務局長に提出。
(4) 臨時報告書
2025年6月30日関東財務局長に提出。
金融商品取引法第24条の5第4項及び企業内容等の開示に関する内閣府令第19条第2項第9号の2の規定(株主総
会における議決権行使の結果)に基づく臨時報告書です。
2025年8月8日関東財務局長に提出。
金融商品取引法第24条の5第4項及び企業内容等の開示に関する内閣府令第19条第2項第2号の2の規定に基づく
臨時報告書です。
2025年9月25日関東財務局長に提出。
金融商品取引法第24条の5第4項及び企業内容等の開示に関する内閣府令第19条第2項第12号の4の規定に基づく
臨時報告書です。
2026年4月24日関東財務局長に提出。
金融商品取引法第24条の5第4項及び企業内容等の開示に関する内閣府令第19条第2項第19号の規定に基づく臨時
報告書です。
第二部【提出会社の保証会社等の情報】
該当事項はありません。
独立監査人の監査報告書及び内部統制監査報告書
2026年6月22日
不二製油株式会社
取締役会
御中
有限責任 あずさ監査法人
大阪事務所
指定有限責任社員
業務執行社員
公認会計士
杉田
直樹
指定有限責任社員
業務執行社員
公認会計士
出口
雅大
<連結財務諸表監査>
監査意見
当監査法人は、金融商品取引法第193条の2第1項の規定に基づく監査証明を行うため、「経理の状況」に掲げられて
いる不二製油株式会社の2025年4月1日から2026年3月31日までの連結会計年度の連結財務諸表、すなわち、連結財政状
態計算書、連結損益計算書、連結包括利益計算書、連結持分変動計算書、連結キャッシュ・フロー計算書、連結財務諸表
作成のための基本となる重要な事項及びその他の注記について監査を行った。
当監査法人は、上記の連結財務諸表が、「連結財務諸表の用語、様式及び作成方法に関する規則」第312条により規定
された国際会計基準に準拠して、不二製油株式会社及び連結子会社の2026年3月31日現在の財政状態並びに同日をもって
終了する連結会計年度の経営成績及びキャッシュ・フローの状況を、全ての重要な点において適正に表示しているものと
認める。
監査意見の根拠
当監査法人は、我が国において一般に公正妥当と認められる監査の基準に準拠して監査を行った。監査の基準における
当監査法人の責任は、「連結財務諸表監査における監査人の責任」に記載されている。当監査法人は、我が国における職
業倫理に関する規定(社会的影響度の高い事業体の財務諸表監査に適用される規定を含む。)に従って、会社及び連結子
会社から独立しており、また、監査人としてのその他の倫理上の責任を果たしている。当監査法人は、意見表明の基礎と
なる十分かつ適切な監査証拠を入手したと判断している。
監査上の主要な検討事項
監査上の主要な検討事項とは、当連結会計年度の連結財務諸表の監査において、監査人が職業的専門家として特に重要
であると判断した事項である。監査上の主要な検討事項は、連結財務諸表全体に対する監査の実施過程及び監査意見の形
成において対応した事項であり、当監査法人は、当該事項に対して個別に意見を表明するものではない。
Blommer Chocolate Company, LLCに係るのれんの評価の妥当性
監査上の主要な検討事項の内容及び決定理由
監査上の対応
不二製油株式会社の連結財政状態計算書において、のれ
当監査法人は、Blommerに係るのれんの評価の妥当性を
ん26,632百万円が計上されており、総資産の4.1%を占め
る。連結財務諸表注記「11.非金融資産の減損」に記載の
とおり、これにはBlommer Chocolate Company, LLC(以
検討するため、主に以下の監査手続を実施した。
下、Blommer) に係るのれん10,865百万円が含まれてお
り、当連結会計年度に、Blommerに係るのれんについて、
のれんの減損テストにおける使用価値の測定に関連する
内部統制の整備及び運用状況の有効性について、特に将来
減損損失4,137百万円を計上している。
連結財務諸表注記「3.重要性がある会計方針(10)非
金融資産の減損」に記載のとおり、のれんについては、減
キャッシュ・フローの見積り、割引率の見積りに関連する
内部統制に焦点を当てて評価を実施した。
損の兆候の有無にかかわらず、毎期減損テストが実施され
る。減損テストに当たっては、回収可能価額が帳簿価額を
下回る場合、帳簿価額が回収可能価額まで減額され、帳簿
(2)使用価値の見積りの合理性の検討
将来キャッシュ・フローの見積りの基礎となるBlommer
の事業計画の作成に当たって採用された主要な仮定の適切
価額の減少額は減損損失として認識される。なお、回収可
能価額は使用価値と処分コスト控除後の公正価値のいずれ
性を評価するため、その根拠について、経営者に対して質
問したほか、主に以下の手続を実施した。
か高い方として算定される。
当連結会計年度において不二製油株式会社は、Blommer
に係るのれんの減損テストにおける回収可能価額として使
・過年度の事業計画と実績の比較による将来計画の見積り
の精度の評価
・主要な仮定である販売数量の拡大見込みについて、施策
用価値を用いている。使用価値は、経営者が承認した
Blommerの事業計画を基礎として見積もられるが、販売数
量の拡大見込みを含む計画には高い不確実性を伴うため、
これらの経営者による判断が将来キャッシュ・フローの見
積りに重要な影響を及ぼす。
また、使用価値の測定に用いる割引率の見積りにおいて
は、計算手法及びインプットデータの選択に当たり、評価
に関する高度な専門知識を必要とする。
以上から、当監査法人は、Blommerに係るのれんの評価
の妥当性が、当連結会計年度の連結財務諸表監査において
特に重要であり、監査上の主要な検討事項の一つに該当す
ると判断した。
内容の把握、過去実績からの趨勢分析、外部機関が公表
している今後の市場予測との比較による適切性の評価
(1)内部統制の評価
加えて、割引率について、当監査法人が属する国内ネッ
トワークファームの評価の専門家を利用して、主に以下の
手続を実施した。
・割引率の計算手法について、対象とする評価項目、会計
基準の定めを踏まえた適切性の評価
・割引率の計算に用いられたインプットデータについて、
評価の専門家が独自に入手した外部機関が公表している
データと照合することによる適切性の評価
PROVENCE HUILES S.A.S株式の取得取引の妥当性
監査上の主要な検討事項の内容及び決定理由
監査上の対応
連結財務諸表注記「39.企業結合及び非支配持分の取
得」に記載のとおり、不二製油株式会社はPROVENCE
HUILES S.A.S(以下、PH)の株式の100%を取得し、PHを連
結子会社とした。PH株式の取得価額は17,137百万円であ
当監査法人は、PH株式の取得取引の妥当性を検討するた
め、主に以下の監査手続を実施した。
り、取得時に発生したのれんは7,239百万円である。
PH株式はその他の関係会社である伊藤忠商事株式会社及
株式の取得に関連する内部統制の整備及び運用状況の有
効性について、特に取得価額の算定に用いる将来キャッシ
びその子会社のITOCHU France S.A.S.から取得しているこ
とから、関連当事者との取引に該当し、取引の経済的合理
性を慎重に検討する必要がある。また、PH株式の取得価額
は、PHの事業計画を基礎とする将来キャッシュ・フローの
割引現在価値に基づいて算定された株式価値を踏まえて決
定されており、主に以下の理由から、経営者による判断が
重要な影響を及ぼす。
・株式価値の算定に用いられる将来キャッシュ・フローの
ュ・フローの見積り、割引率の見積りに関連する内部統制
に焦点を当てて評価を実施した。
見積りは、PHの事業とその将来性についての理解や予測
に基づいて作成された事業計画を基礎としている。当該
事業計画は販売数量の拡大見込み及び設備投資に伴う製
造工程の内製化によるコスト削減に関する主要な仮定を
含んでおり、不確実性を伴う。
・将来キャッシュ・フローの割引現在価値の測定に用いる
割引率の見積りにおいて、計算手法及びインプットデー
タの選択に当たり、評価に関する高度な専門知識を必要
とする。
以上から、当監査法人は、PH株式の取得取引の妥当性
が、当連結会計年度の連結財務諸表監査において特に重要
であり、監査上の主要な検討事項の一つに該当すると判断
した。
フローの見積りの基礎となる事業計画の作成に当たって採
用された主要な仮定の適切性を評価するため、その根拠に
ついて、経営者に対して質問したほか、主に以下の手続を
実施した。
・販売数量の拡大見込みについて、過去実績からの趨勢分
析、外部機関が公表している今後の市場予測との比較に
よる適切性の評価
・設備投資に伴う製造工程の内製化によるコスト削減につ
いて、設備投資計画の把握、過去実績との比較、関連資
料の閲覧による適切性の評価
(1)内部統制の評価
(2)PH株式の取得取引の妥当性の評価
取引の経済的合理性を検討するために、取引の目的を経
営者に質問するとともに、契約書及び取締役会議事録の閲
覧により取引条件を確認した。
また、取得価額の算定に用いられた、将来キャッシュ・
加えて、割引率について、当監査法人が属する国内ネッ
トワークファームの評価の専門家を利用して、主に以下の
手続を実施した。
・割引率の計算手法について、対象とする評価項目を踏ま
えた適切性の評価
・割引率の計算に用いられたインプットデータについて、
評価の専門家が独自に入手した外部機関が公表している
データと照合することによる適切性の評価
その他の記載内容
その他の記載内容は、有価証券報告書に含まれる情報のうち、連結財務諸表及び財務諸表並びにこれらの監査報告書以
外の情報である。経営者の責任は、その他の記載内容を作成し開示することにある。また、監査等委員会の責任は、その
他の記載内容の報告プロセスの整備及び運用における取締役の職務の執行を監視することにある。
当監査法人の連結財務諸表に対する監査意見の対象にはその他の記載内容は含まれておらず、当監査法人はその他の記
載内容に対して意見を表明するものではない。
連結財務諸表監査における当監査法人の責任は、その他の記載内容を通読し、通読の過程において、その他の記載内容
と連結財務諸表又は当監査法人が監査の過程で得た知識との間に重要な相違があるかどうか検討すること、また、そのよ
うな重要な相違以外にその他の記載内容に重要な誤りの兆候があるかどうか注意を払うことにある。
当監査法人は、実施した作業に基づき、その他の記載内容に重要な誤りがあると判断した場合には、その事実を報告す
ることが求められている。
その他の記載内容に関して、当監査法人が報告すべき事項はない。
連結財務諸表に対する経営者及び監査等委員会の責任
経営者の責任は、国際会計基準に準拠して連結財務諸表を作成し適正に表示することにある。これには、不正又は誤謬
による重要な虚偽表示のない連結財務諸表を作成し適正に表示するために経営者が必要と判断した内部統制を整備及び運
用することが含まれる。
連結財務諸表を作成するに当たり、経営者は、継続企業の前提に基づき連結財務諸表を作成することが適切であるかど
うかを評価し、国際会計基準に基づいて継続企業に関する事項を開示する必要がある場合には当該事項を開示する責任が
ある。
監査等委員会の責任は、財務報告プロセスの整備及び運用における取締役の職務の執行を監視することにある。
連結財務諸表監査における監査人の責任
監査人の責任は、監査人が実施した監査に基づいて、全体としての連結財務諸表に不正又は誤謬による重要な虚偽表示
がないかどうかについて合理的な保証を得て、監査報告書において独立の立場から連結財務諸表に対する意見を表明する
ことにある。虚偽表示は、不正又は誤謬により発生する可能性があり、個別に又は集計すると、連結財務諸表の利用者の
意思決定に影響を与えると合理的に見込まれる場合に、重要性があると判断される。
監査人は、我が国において一般に公正妥当と認められる監査の基準に従って、監査の過程を通じて、職業的専門家とし
ての判断を行い、職業的懐疑心を保持して以下を実施する。
・不正又は誤謬による重要な虚偽表示リスクを識別し、評価する。また、重要な虚偽表示リスクに対応した監査手続を立
案し、実施する。監査手続の選択及び適用は監査人の判断による。さらに、意見表明の基礎となる十分かつ適切な監査
証拠を入手する。
・連結財務諸表監査の目的は、内部統制の有効性について意見表明するためのものではないが、監査人は、リスク評価の
実施に際して、状況に応じた適切な監査手続を立案するために、監査に関連する内部統制を検討する。
・経営者が採用した会計方針及びその適用方法の適切性、並びに経営者によって行われた会計上の見積りの合理性及び関
連する注記事項の妥当性を評価する。
・経営者が継続企業を前提として連結財務諸表を作成することが適切であるかどうか、また、入手した監査証拠に基づ
き、継続企業の前提に重要な疑義を生じさせるような事象又は状況に関して重要な不確実性が認められるかどうか結論
付ける。継続企業の前提に関する重要な不確実性が認められる場合は、監査報告書において連結財務諸表の注記事項に
注意を喚起すること、又は重要な不確実性に関する連結財務諸表の注記事項が適切でない場合は、連結財務諸表に対し
て除外事項付意見を表明することが求められている。監査人の結論は、監査報告書日までに入手した監査証拠に基づい
ているが、将来の事象や状況により、企業は継続企業として存続できなくなる可能性がある。
・連結財務諸表の表示及び注記事項が、国際会計基準に準拠しているかどうかとともに、関連する注記事項を含めた連結
財務諸表の表示、構成及び内容、並びに連結財務諸表が基礎となる取引や会計事象を適正に表示しているかどうかを評
価する。
・連結財務諸表に対する意見表明の基礎となる、会社及び連結子会社の財務情報に関する十分かつ適切な監査証拠を入手
するために、連結財務諸表の監査を計画し実施する。監査人は、連結財務諸表の監査に関する指揮、監督及び査閲に関
して責任がある。監査人は、単独で監査意見に対して責任を負う。
監査人は、監査等委員会に対して、計画した監査の範囲とその実施時期、監査の実施過程で識別した内部統制の重要な
不備を含む監査上の重要な発見事項、及び監査の基準で求められているその他の事項について報告を行う。
監査人は、監査等委員会に対して、独立性についての我が国における職業倫理に関する規定を遵守したこと、並びに監
査人の独立性に影響を与えると合理的に考えられる事項、及び阻害要因を除去するための対応策を講じている場合又は阻
害要因を許容可能な水準にまで軽減するためのセーフガードを適用している場合はその内容について報告を行う。
監査人は、監査等委員会と協議した事項のうち、当連結会計年度の連結財務諸表の監査で特に重要であると判断した事
項を監査上の主要な検討事項と決定し、監査報告書において記載する。ただし、法令等により当該事項の公表が禁止され
ている場合や、極めて限定的ではあるが、監査報告書において報告することにより生じる不利益が公共の利益を上回ると
合理的に見込まれるため、監査人が報告すべきでないと判断した場合は、当該事項を記載しない。
<内部統制監査>
監査意見
当監査法人は、金融商品取引法第193条の2第2項の規定に基づく監査証明を行うため、不二製油株式会社の2026年3
月31日現在の内部統制報告書について監査を行った。
当監査法人は、不二製油株式会社が2026年3月31日現在の財務報告に係る内部統制は有効であると表示した上記の内部
統制報告書が、我が国において一般に公正妥当と認められる財務報告に係る内部統制の評価の基準に準拠して、財務報告
に係る内部統制の評価結果について、全ての重要な点において適正に表示しているものと認める。
監査意見の根拠
当監査法人は、我が国において一般に公正妥当と認められる財務報告に係る内部統制の監査の基準に準拠して内部統制
監査を行った。財務報告に係る内部統制の監査の基準における当監査法人の責任は、「内部統制監査における監査人の責
任」に記載されている。当監査法人は、我が国における職業倫理に関する規定(社会的影響度の高い事業体の財務諸表監
査に適用される規定を含む。)に従って、会社及び連結子会社から独立しており、また、監査人としてのその他の倫理上
の責任を果たしている。当監査法人は、意見表明の基礎となる十分かつ適切な監査証拠を入手したと判断している。
内部統制報告書に対する経営者及び監査等委員会の責任
経営者の責任は、財務報告に係る内部統制を整備及び運用し、我が国において一般に公正妥当と認められる財務報告に
係る内部統制の評価の基準に準拠して内部統制報告書を作成し適正に表示することにある。
監査等委員会の責任は、財務報告に係る内部統制の整備及び運用状況を監視、検証することにある。
なお、財務報告に係る内部統制により財務報告の虚偽の記載を完全には防止又は発見することができない可能性があ
る。
内部統制監査における監査人の責任
監査人の責任は、監査人が実施した内部統制監査に基づいて、内部統制報告書に重要な虚偽表示がないかどうかについ
て合理的な保証を得て、内部統制監査報告書において独立の立場から内部統制報告書に対する意見を表明することにあ
る。
監査人は、我が国において一般に公正妥当と認められる財務報告に係る内部統制の監査の基準に従って、監査の過程を
通じて、職業的専門家としての判断を行い、職業的懐疑心を保持して以下を実施する。
・内部統制報告書における財務報告に係る内部統制の評価結果について監査証拠を入手するための監査手続を実施する。
内部統制監査の監査手続は、監査人の判断により、財務報告の信頼性に及ぼす影響の重要性に基づいて選択及び適用さ
れる。
・財務報告に係る内部統制の評価範囲、評価手続及び評価結果について経営者が行った記載を含め、全体としての内部統
制報告書の表示を検討する。
・内部統制報告書における財務報告に係る内部統制の評価結果に関する十分かつ適切な監査証拠を入手するために、内部
統制の監査を計画し実施する。監査人は、内部統制報告書の監査に関する指揮、監督及び査閲に関して責任がある。監
査人は、単独で監査意見に対して責任を負う。
監査人は、監査等委員会に対して、計画した内部統制監査の範囲とその実施時期、内部統制監査の実施結果、識別した
内部統制の開示すべき重要な不備、その是正結果、及び内部統制の監査の基準で求められているその他の事項について報
告を行う。
監査人は、監査等委員会に対して、独立性についての我が国における職業倫理に関する規定を遵守したこと、並びに監
査人の独立性に影響を与えると合理的に考えられる事項、及び阻害要因を除去するための対応策を講じている場合又は阻
害要因を許容可能な水準にまで軽減するためのセーフガードを適用している場合はその内容について報告を行う。
<報酬関連情報>
当監査法人及び当監査法人と同一のネットワークに属する者に対する、会社及び子会社の監査証明業務に基づく報酬及
び非監査業務に基づく報酬の額は、「提出会社の状況」に含まれるコーポレート・ガバナンスの状況等 (3)【監査の状
況】に記載されている。
利害関係
会社及び連結子会社と当監査法人又は業務執行社員との間には、公認会計士法の規定により記載すべき利害関係はな
い。
以
(注)1.上記の監査報告書の原本は当社(有価証券報告書提出会社)が別途保管しております。
2.XBRLデータは監査の対象には含まれていません。
上
独立監査人の監査報告書
2026年6月22日
不二製油株式会社
取締役会
御中
有限責任 あずさ監査法人
大阪事務所
指定有限責任社員
業務執行社員
公認会計士
杉田
直樹
指定有限責任社員
業務執行社員
公認会計士
出口
雅大
<財務諸表監査>
監査意見
当監査法人は、金融商品取引法第193条の2第1項の規定に基づく監査証明を行うため、「経理の状況」に掲げられて
いる不二製油株式会社の2025年4月1日から2026年3月31日までの第98期事業年度の財務諸表、すなわち、貸借対照表、
損益計算書、株主資本等変動計算書、重要な会計方針、その他の注記及び附属明細表について監査を行った。
当監査法人は、上記の財務諸表が、我が国において一般に公正妥当と認められる企業会計の基準に準拠して、不二製油
株式会社の2026年3月31日現在の財政状態及び同日をもって終了する事業年度の経営成績を、全ての重要な点において適
正に表示しているものと認める。
監査意見の根拠
当監査法人は、我が国において一般に公正妥当と認められる監査の基準に準拠して監査を行った。監査の基準における
当監査法人の責任は、「財務諸表監査における監査人の責任」に記載されている。当監査法人は、我が国における職業倫
理に関する規定(社会的影響度の高い事業体の財務諸表監査に適用される規定を含む。)に従って、会社から独立してお
り、また、監査人としてのその他の倫理上の責任を果たしている。当監査法人は、意見表明の基礎となる十分かつ適切な
監査証拠を入手したと判断している。
監査上の主要な検討事項
監査上の主要な検討事項とは、当事業年度の財務諸表の監査において、監査人が職業的専門家として特に重要であると
判断した事項である。監査上の主要な検討事項は、財務諸表全体に対する監査の実施過程及び監査意見の形成において対
応した事項であり、当監査法人は、当該事項に対して個別に意見を表明するものではない。
(PROVENCE HUILES S.A.S株式の取得取引の妥当性)
財務諸表の監査報告書で記載すべき監査上の主要な検討事項「PROVENCE HUILES S.A.S株式の取得取引の妥当性」は、
連結財務諸表の監査報告書に記載されている監査上の主要な検討事項「PROVENCE HUILES S.A.S株式の取得取引の妥当
性」と実質的に同一の内容である。このため、財務諸表の監査報告書では、これに関する記載を省略する。
その他の記載内容
その他の記載内容は、有価証券報告書に含まれる情報のうち、連結財務諸表及び財務諸表並びにこれらの監査報告書以
外の情報である。経営者の責任は、その他の記載内容を作成し開示することにある。また、監査等委員会の責任は、その
他の記載内容の報告プロセスの整備及び運用における取締役の職務の執行を監視することにある。
当監査法人の財務諸表に対する監査意見の対象にはその他の記載内容は含まれておらず、当監査法人はその他の記載内
容に対して意見を表明するものではない。
財務諸表監査における当監査法人の責任は、その他の記載内容を通読し、通読の過程において、その他の記載内容と財
務諸表又は当監査法人が監査の過程で得た知識との間に重要な相違があるかどうか検討すること、また、そのような重要
な相違以外にその他の記載内容に重要な誤りの兆候があるかどうか注意を払うことにある。
当監査法人は、実施した作業に基づき、その他の記載内容に重要な誤りがあると判断した場合には、その事実を報告す
ることが求められている。
その他の記載内容に関して、当監査法人が報告すべき事項はない。
財務諸表に対する経営者及び監査等委員会の責任
経営者の責任は、我が国において一般に公正妥当と認められる企業会計の基準に準拠して財務諸表を作成し適正に表示
することにある。これには、不正又は誤謬による重要な虚偽表示のない財務諸表を作成し適正に表示するために経営者が
必要と判断した内部統制を整備及び運用することが含まれる。
財務諸表を作成するに当たり、経営者は、継続企業の前提に基づき財務諸表を作成することが適切であるかどうかを評
価し、我が国において一般に公正妥当と認められる企業会計の基準に基づいて継続企業に関する事項を開示する必要があ
る場合には当該事項を開示する責任がある。
監査等委員会の責任は、財務報告プロセスの整備及び運用における取締役の職務の執行を監視することにある。
財務諸表監査における監査人の責任
監査人の責任は、監査人が実施した監査に基づいて、全体としての財務諸表に不正又は誤謬による重要な虚偽表示がな
いかどうかについて合理的な保証を得て、監査報告書において独立の立場から財務諸表に対する意見を表明することにあ
る。虚偽表示は、不正又は誤謬により発生する可能性があり、個別に又は集計すると、財務諸表の利用者の意思決定に影
響を与えると合理的に見込まれる場合に、重要性があると判断される。
監査人は、我が国において一般に公正妥当と認められる監査の基準に従って、監査の過程を通じて、職業的専門家とし
ての判断を行い、職業的懐疑心を保持して以下を実施する。
・不正又は誤謬による重要な虚偽表示リスクを識別し、評価する。また、重要な虚偽表示リスクに対応した監査手続を立
案し、実施する。監査手続の選択及び適用は監査人の判断による。さらに、意見表明の基礎となる十分かつ適切な監査
証拠を入手する。
・財務諸表監査の目的は、内部統制の有効性について意見表明するためのものではないが、監査人は、リスク評価の実施
に際して、状況に応じた適切な監査手続を立案するために、監査に関連する内部統制を検討する。
・経営者が採用した会計方針及びその適用方法の適切性、並びに経営者によって行われた会計上の見積りの合理性及び関
連する注記事項の妥当性を評価する。
・経営者が継続企業を前提として財務諸表を作成することが適切であるかどうか、また、入手した監査証拠に基づき、継
続企業の前提に重要な疑義を生じさせるような事象又は状況に関して重要な不確実性が認められるかどうか結論付け
る。継続企業の前提に関する重要な不確実性が認められる場合は、監査報告書において財務諸表の注記事項に注意を喚
起すること、又は重要な不確実性に関する財務諸表の注記事項が適切でない場合は、財務諸表に対して除外事項付意見
を表明することが求められている。監査人の結論は、監査報告書日までに入手した監査証拠に基づいているが、将来の
事象や状況により、企業は継続企業として存続できなくなる可能性がある。
・財務諸表の表示及び注記事項が、我が国において一般に公正妥当と認められる企業会計の基準に準拠しているかどうか
とともに、関連する注記事項を含めた財務諸表の表示、構成及び内容、並びに財務諸表が基礎となる取引や会計事象を
適正に表示しているかどうかを評価する。
監査人は、監査等委員会に対して、計画した監査の範囲とその実施時期、監査の実施過程で識別した内部統制の重要な
不備を含む監査上の重要な発見事項、及び監査の基準で求められているその他の事項について報告を行う。
監査人は、監査等委員会に対して、独立性についての我が国における職業倫理に関する規定を遵守したこと、並びに監
査人の独立性に影響を与えると合理的に考えられる事項、及び阻害要因を除去するための対応策を講じている場合又は阻
害要因を許容可能な水準にまで軽減するためのセーフガードを適用している場合はその内容について報告を行う。
監査人は、監査等委員会と協議した事項のうち、当事業年度の財務諸表の監査で特に重要であると判断した事項を監査
上の主要な検討事項と決定し、監査報告書において記載する。ただし、法令等により当該事項の公表が禁止されている場
合や、極めて限定的ではあるが、監査報告書において報告することにより生じる不利益が公共の利益を上回ると合理的に
見込まれるため、監査人が報告すべきでないと判断した場合は、当該事項を記載しない。
<報酬関連情報>
報酬関連情報は、連結財務諸表の監査報告書に記載されている。
利害関係
会社と当監査法人又は業務執行社員との間には、公認会計士法の規定により記載すべき利害関係はない。
以
(注)1.上記の監査報告書の原本は当社(有価証券報告書提出会社)が別途保管しております。
2.XBRLデータは監査の対象には含まれていません。
上
【表紙】
【提出書類】
内部統制報告書
【根拠条文】
金融商品取引法第24条の4の4第1項
【提出先】
関東財務局長
【提出日】
2026年6月22日
【会社名】
不二製油株式会社
【英訳名】
FUJI OIL CO., LTD.
【代表者の役職氏名】
代表取締役社長CEO
【最高財務責任者の役職氏名】
取締役上席執行役員CFO
【本店の所在の場所】
大阪府泉佐野市住吉町1番地
【縦覧に供する場所】
不二製油株式会社東京支社
大森
達司
前田
淳
(東京都港区東新橋1丁目9番1号(東京汐留ビルディング内))
株式会社東京証券取引所
(東京都中央区日本橋兜町2番1号)
1【財務報告に係る内部統制の基本的枠組みに関する事項】
当社代表取締役社長大森達司及び当社最高財務責任者前田淳は、当社の財務報告に係る内部統制の整備及び運
用に責任を有しており、企業会計審議会の公表した「財務報告に係る内部統制の評価及び監査の基準並びに財務報告
に係る内部統制の評価及び監査に関する実施基準の改訂について(意見書)」に示されている内部統制の基本的枠組
みに準拠して財務報告に係る内部統制を整備及び運用しております。
なお、内部統制は、内部統制の各基本的要素が有機的に結びつき、一体となって機能することで、その目的を合理
的な範囲で達成しようとするものです。このため、財務報告に係る内部統制により財務報告の虚偽の記載を完全には
防止又は発見することができない可能性があります。
2【評価の範囲、基準日及び評価手続に関する事項】
財務報告に係る内部統制の評価は、当事業年度の末日である2026年3月31日を基準日として行われており、評価に
あたっては、一般に公正妥当と認められる財務報告に係る内部統制の評価の基準に準拠しております。
本評価においては、連結ベースでの財務報告全体に重要な影響を及ぼす内部統制(全社的な内部統制)の評価を行
った上で、その結果を踏まえて、評価対象とする業務プロセスを選定しております。当該業務プロセスの評価におい
ては、選定された業務プロセスを分析した上で、財務報告の信頼性に重要な影響を及ぼす統制上の要点を識別し、当
該統制上の要点について整備及び運用状況を評価することによって、内部統制の有効性に関する評価を行いました。
財務報告に係る内部統制の評価の範囲は、当社並びに連結子会社及び持分法適用会社について、財務報告の信頼性
に及ぼす影響の重要性の観点から必要な範囲を決定しております。財務報告の信頼性に及ぼす影響の重要性は、金額
的及び質的影響並びにその発生可能性を考慮して決定しており、当社及び連結子会社20社の計21社を対象として行っ
た全社的な内部統制の評価結果を踏まえ、業務プロセスに係る内部統制の評価範囲を合理的に決定しました。なお、
連結子会社15社及び持分法適用関連会社5社については、金額的及び質的重要性の観点から僅少であると判断し、全
社的な内部統制の評価範囲に含めておりません。
業務プロセスに係る内部統制の評価範囲については、各事業拠点の規模を表す指標として連結売上高が適切と判断
し、前連結会計年度の連結売上高の概ね70%となる5事業拠点を「重要な事業拠点」としました。当社グループは植
物性油脂、業務用チョコレート、乳化・発酵素材、大豆加工素材の製造販売活動を主として展開する事業体であるこ
とから、選定した重要な事業拠点においては、企業の事業目的に大きく関わる勘定科目として売上高、売掛金、及び
棚卸資産に至る業務プロセスを評価の対象としました。さらに、選定した重要な事業拠点にかかわらず、それ以外の
事業拠点をも含めた範囲について、重要な虚偽記載の発生可能性が高く、見積りや予測を伴う重要な勘定科目に係る
業務プロセスやリスクが大きい取引を行っている事業又は業務に係る業務プロセスを財務報告への影響を勘案して重
要性の大きい業務プロセスとして、固定資産の評価に係る業務プロセスや関係会社投融資の評価に係る業務プロセス
を評価対象に追加しております。
3【評価結果に関する事項】
上記の評価の結果、当事業年度末日時点において、当社の財務報告に係る内部統制は有効であると判断しました。
4【付記事項】
該当事項はありません。
5【特記事項】
該当事項はありません。





 Co-create a sustainable food future
 Chocolate Happiness


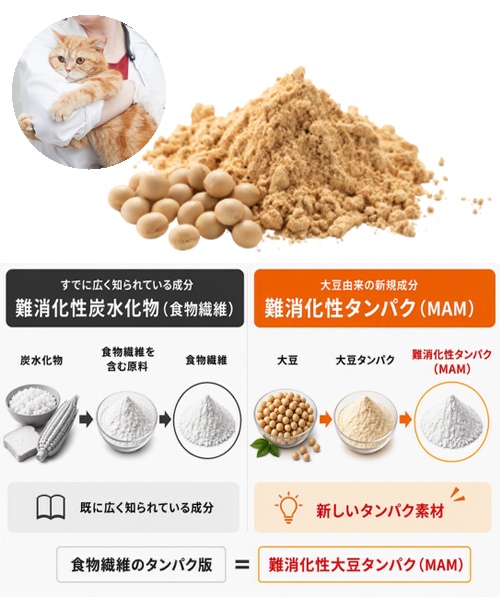
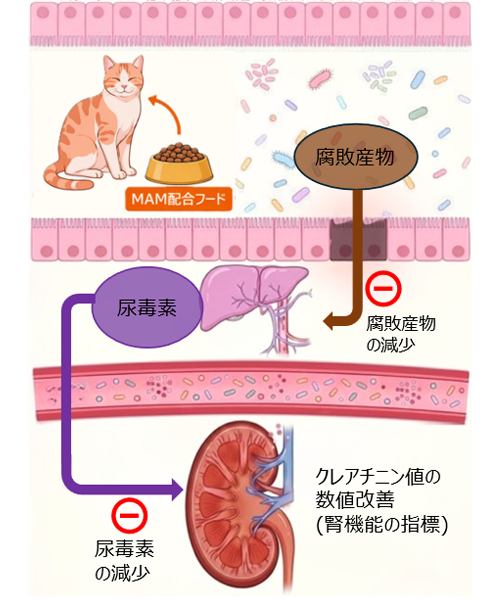
 (252.33KB)
 (ソワイユショコラFLの原体、使用例 / ソワイユショコラBSも同じ形状)


