2026.09.10 商品 ダイドードリンコ株式会社 PDFダウンロード(1.1 MB) TOP ニュースリリース 新商品ブランド「dydo」、共創アクションを本格始動。 新商品ブランドCM公開、共創商品の発売、産学連携プロジェクトなど…
2026.09.10
ダイドードリンコ株式会社
PDFダウンロード(1.1 MB)
0
INDEX
1.新商品ブランドCMを公開
■CM概要
2.共創から生まれた商品を発売
3.自販機の商品見本に英字・アレルゲン情報などを表示
4.武庫川女子大学との共創プロジェクトを推進
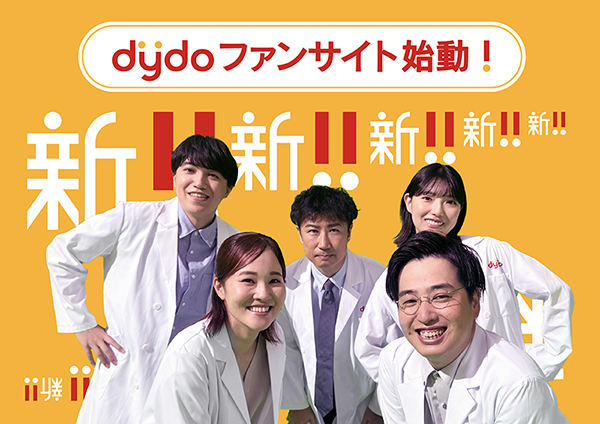
5.ファンサイト「dydoいっしょにラボ」の本格始動および共創企画の開始
■新商品体験モニター概要
6.公式Xアカウント「dydo|商品ブランド【公式】」フォロー&リポストキャンペーン
ダイドードリンコ株式会社(本社:大阪市北区、代表取締役社長:中島 孝徳、以下「当社」)は、商品ブランド刷新に伴い掲げた「共創SPAモデル」の実現に向け、新商品ブランド「dydo」の価値観を体現する「共創アクション」を本格的に始動しますので、お知らせいたします。
当社は2026年7月、創業以来初となる商品ブランドの全面刷新を発表し、従来の「飲料SPAモデル」から、顧客やパートナーとともに商品や体験を創り上げる「共創SPAモデル」への進化を掲げました。
今回、その取り組みの一環として、ブランドコンセプトを伝える新商品ブランドCMの公開や、誰もが安心して商品を選べる環境づくり、多様なパートナーとの共創による商品・体験価値の創出など、「共創アクション」を順次展開してまいります。
本取り組みの概要は、以下の通りです。
### 1.新商品ブランドCMを公開
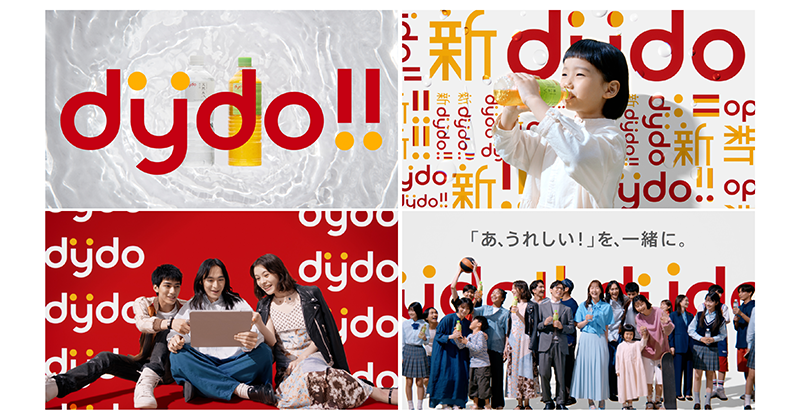
新商品ブランド「dydo」のブランドコンセプトを伝えるCMを、2026年9月11日(金)より各種オウンドメディアでの公開を開始し、全国で配信・放映いたします。
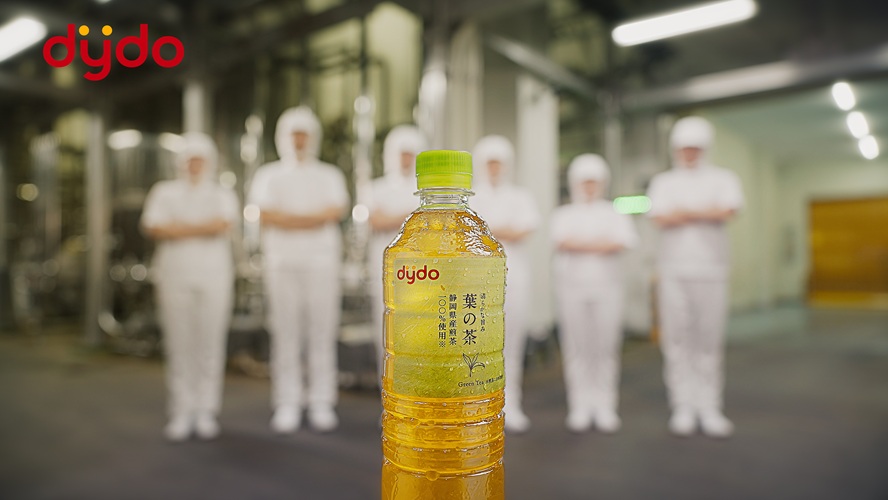
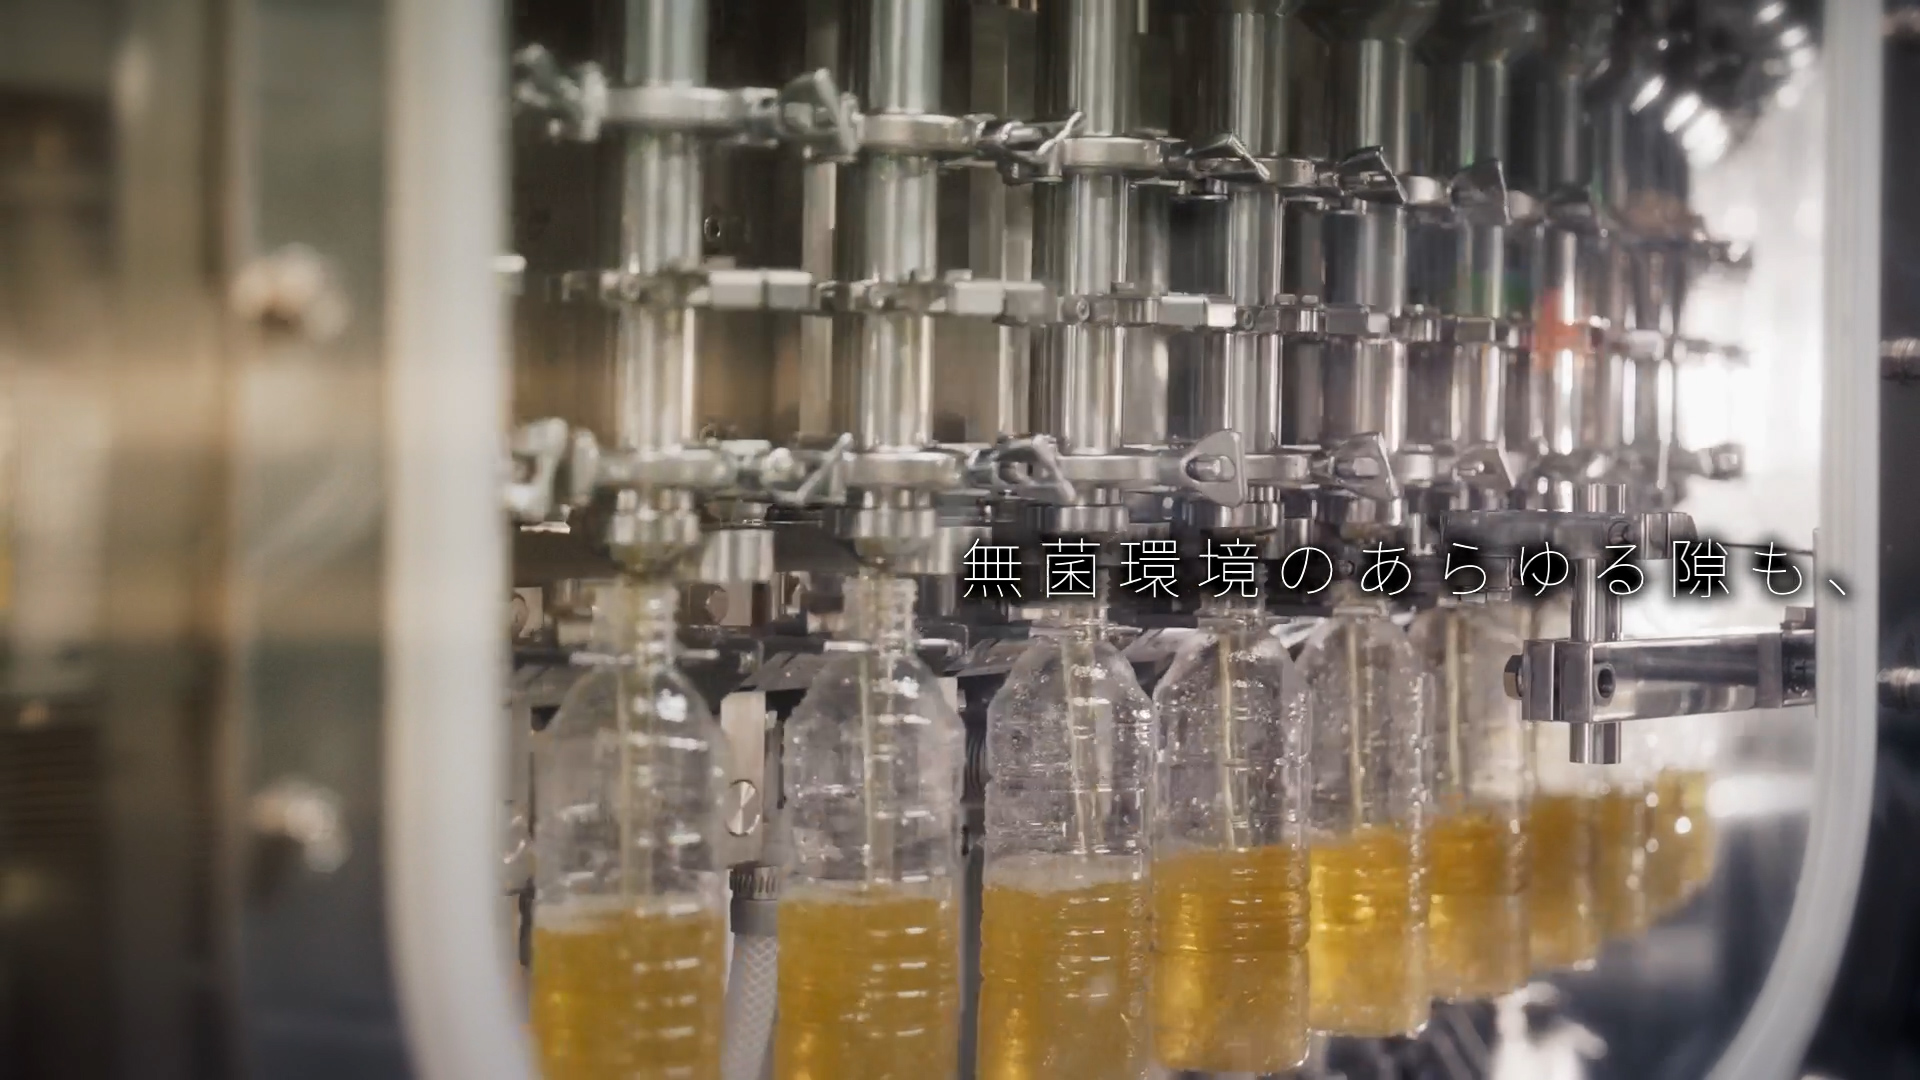
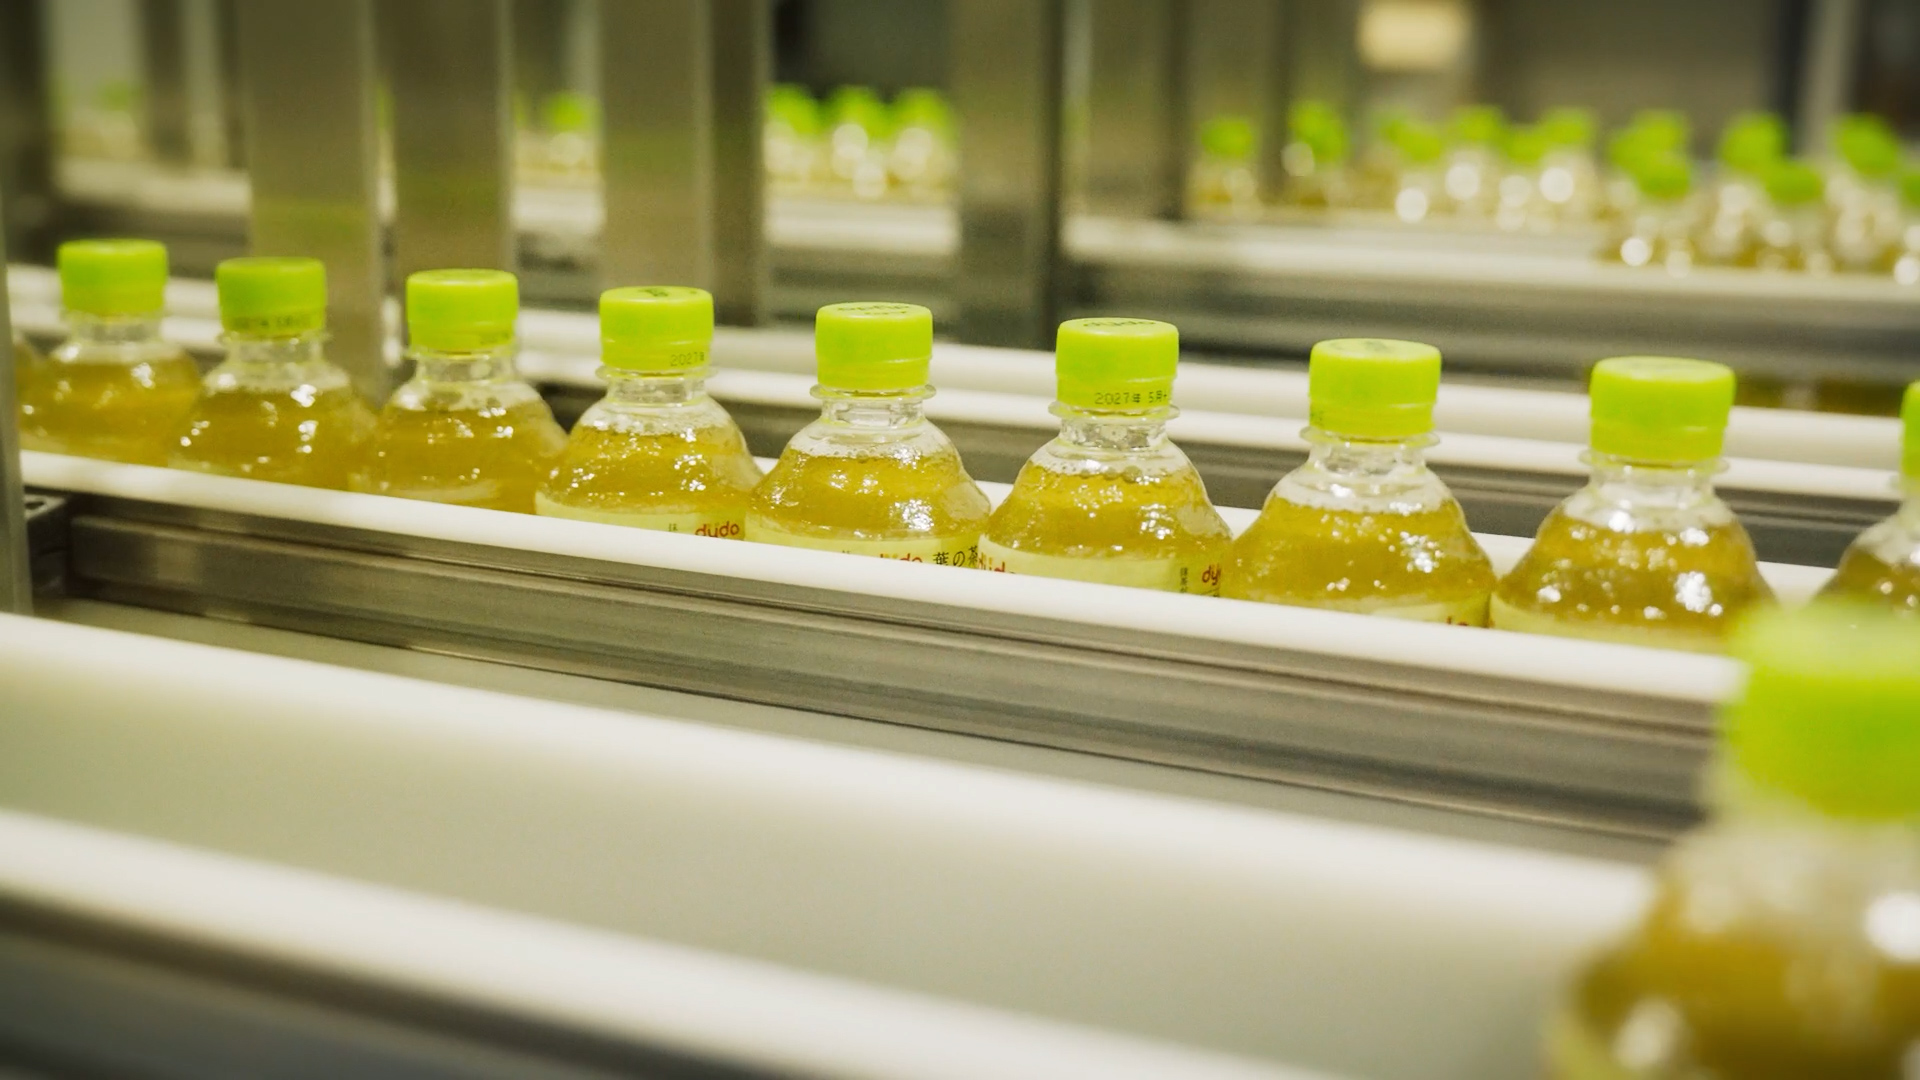
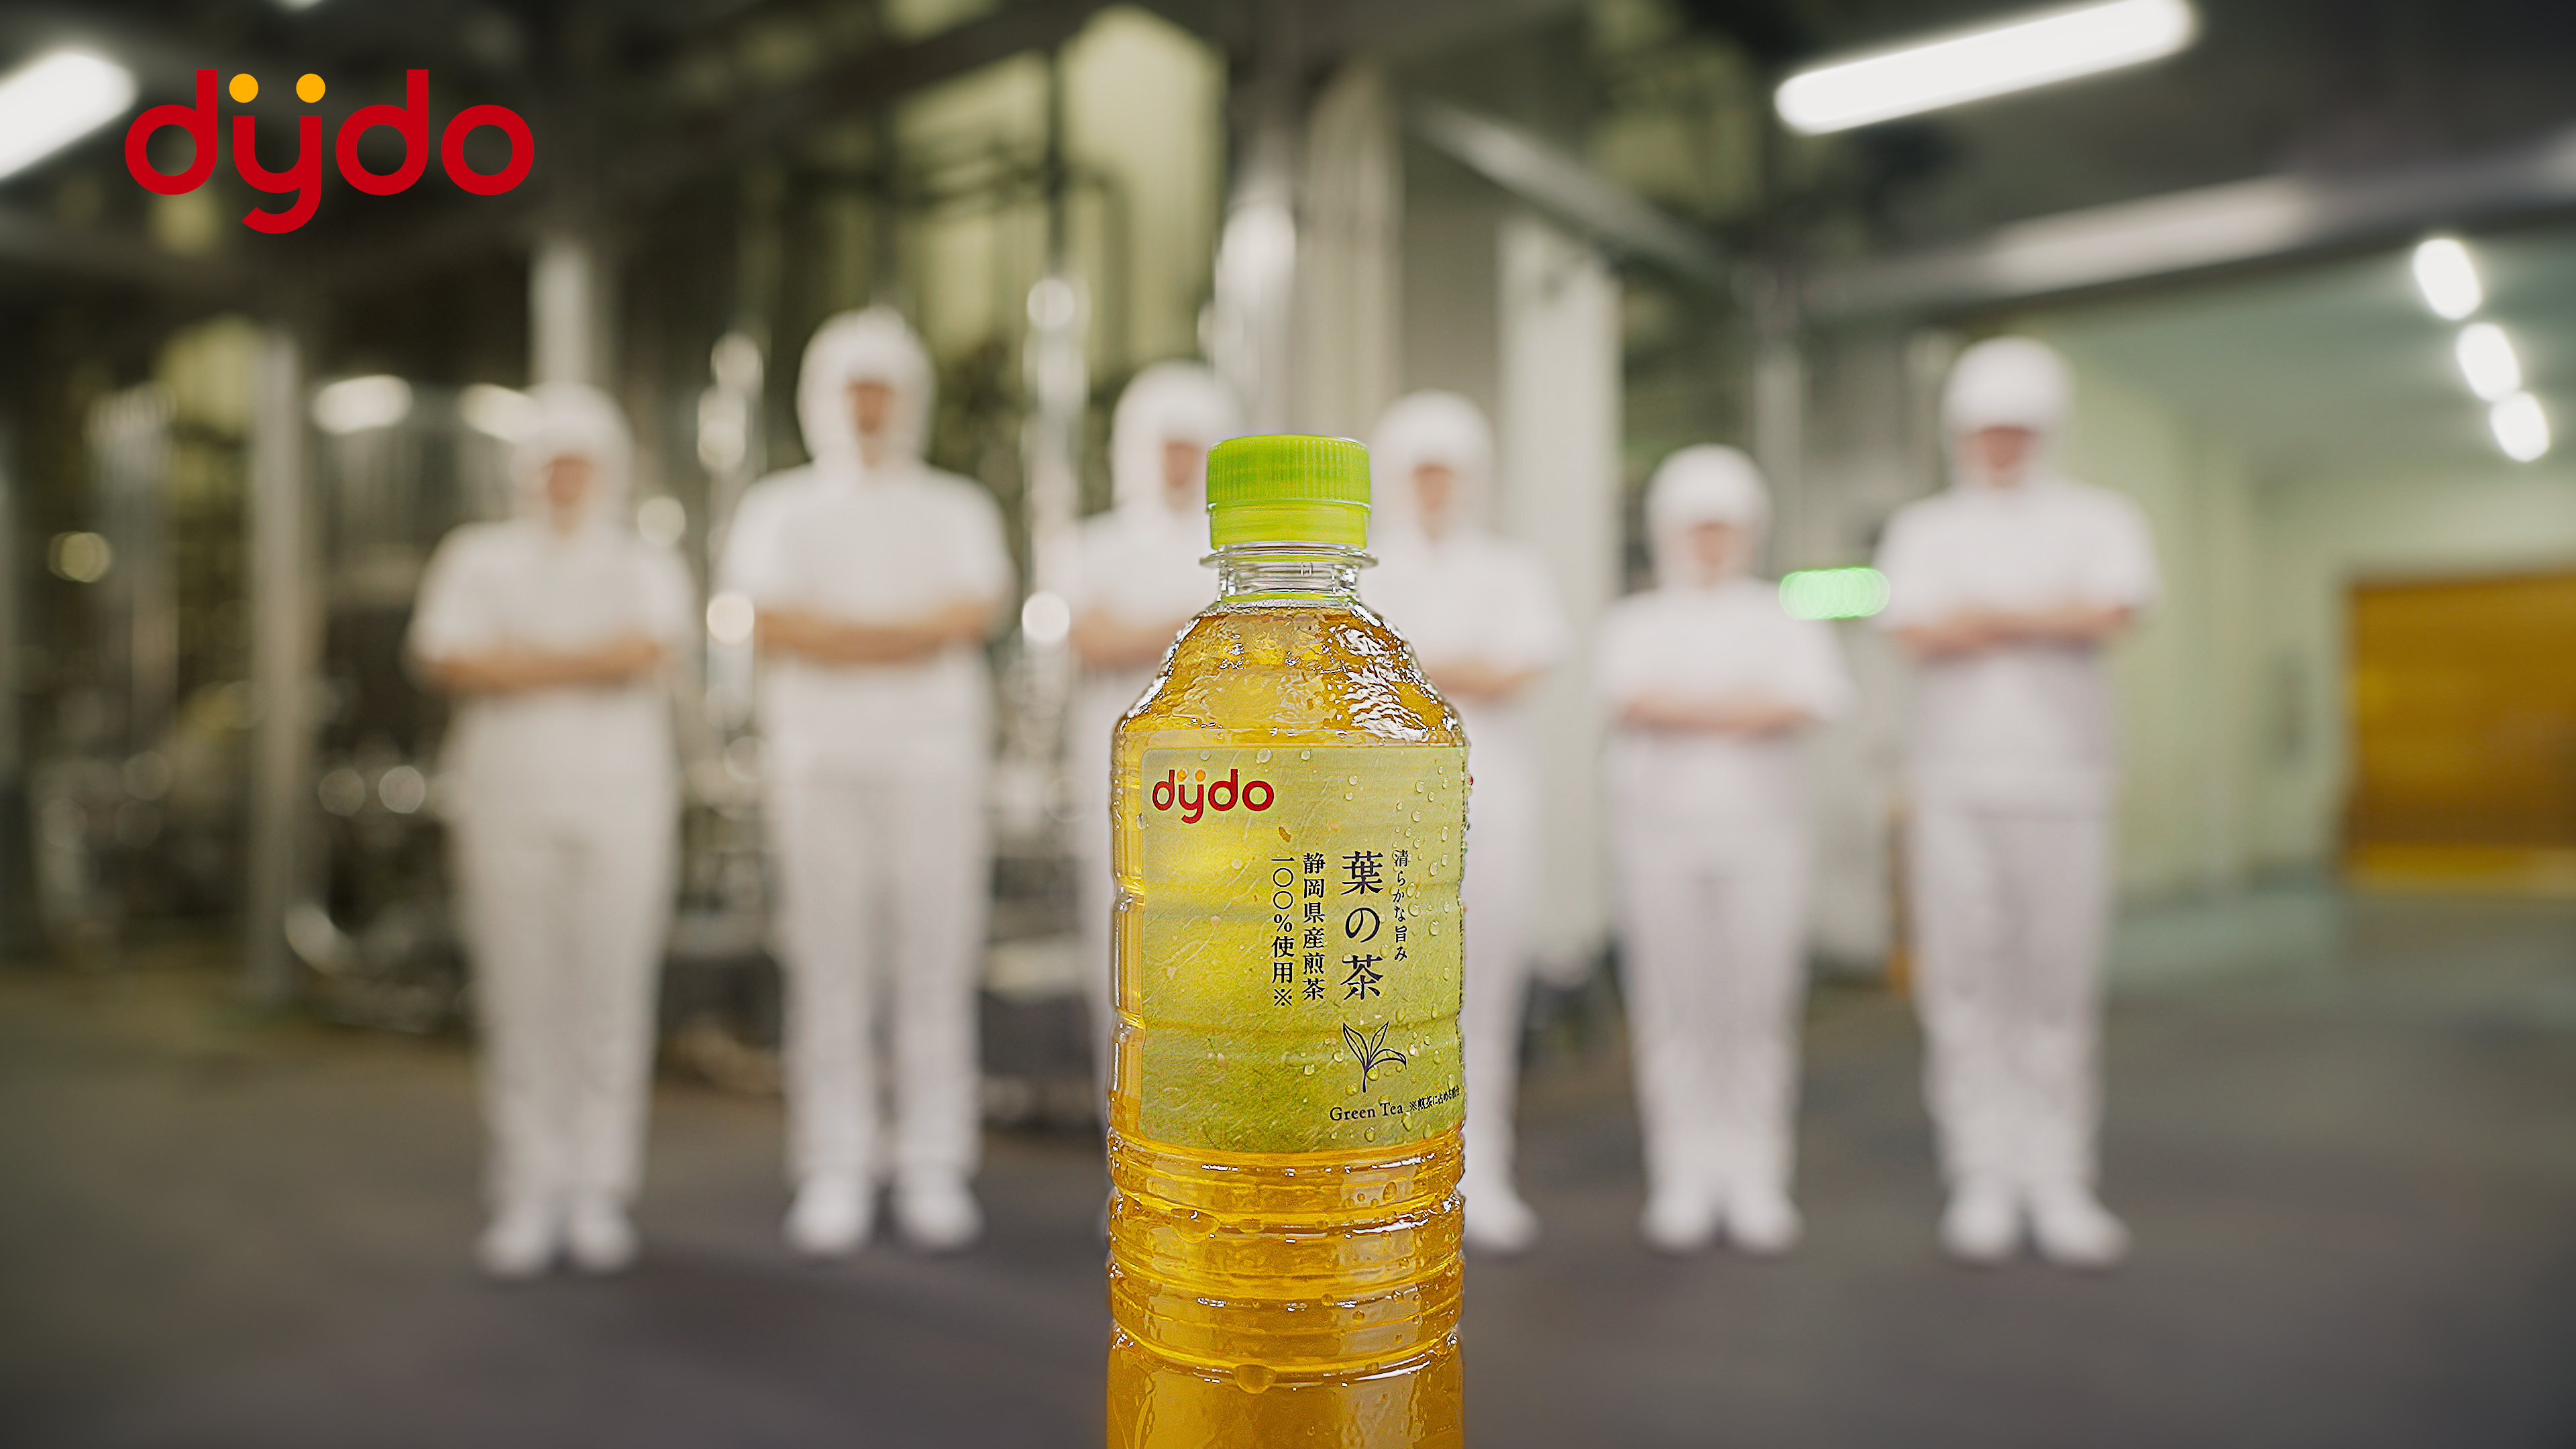
本CMでは、まず、新商品ブランドの代表的な商品である「ダイドー 日本のおいしい天然水」「ダイドー 葉の茶」が登場し、新商品ブランド「dydo」の誕生を宣言します。続いて、新商品ブランドロゴ「dydo」とともに、品質へのこだわりや、生活者・パートナーなどの多様な方々との関わりを通じて、日常の中に「あ、うれしい!」瞬間を生み出していきたいというブランドの姿勢を伝えます。
また、本CM内には実際に商品開発に携わっている社員も出演し、多くの声に耳を傾けながら、新しいアイデアを形にする喜びを表現しています。
本CMを通じて、新商品ブランド「dydo」のブランド提供価値やこれからの共創の取り組みをお伝えし、今後の活動への期待感を高めてまいります。
### ■CM概要
・タイトル :「新dydo登場」篇
・出稿開始日:2026年9月11日(金)
・出稿媒体 :TV、YouTubeなど
・URL :30秒 https://youtu.be/rPdOk_c8w7Q
15秒 https://youtu.be/KgnNNPmPx40
### 2.共創から生まれた商品を発売
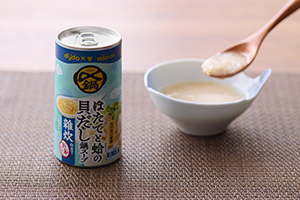
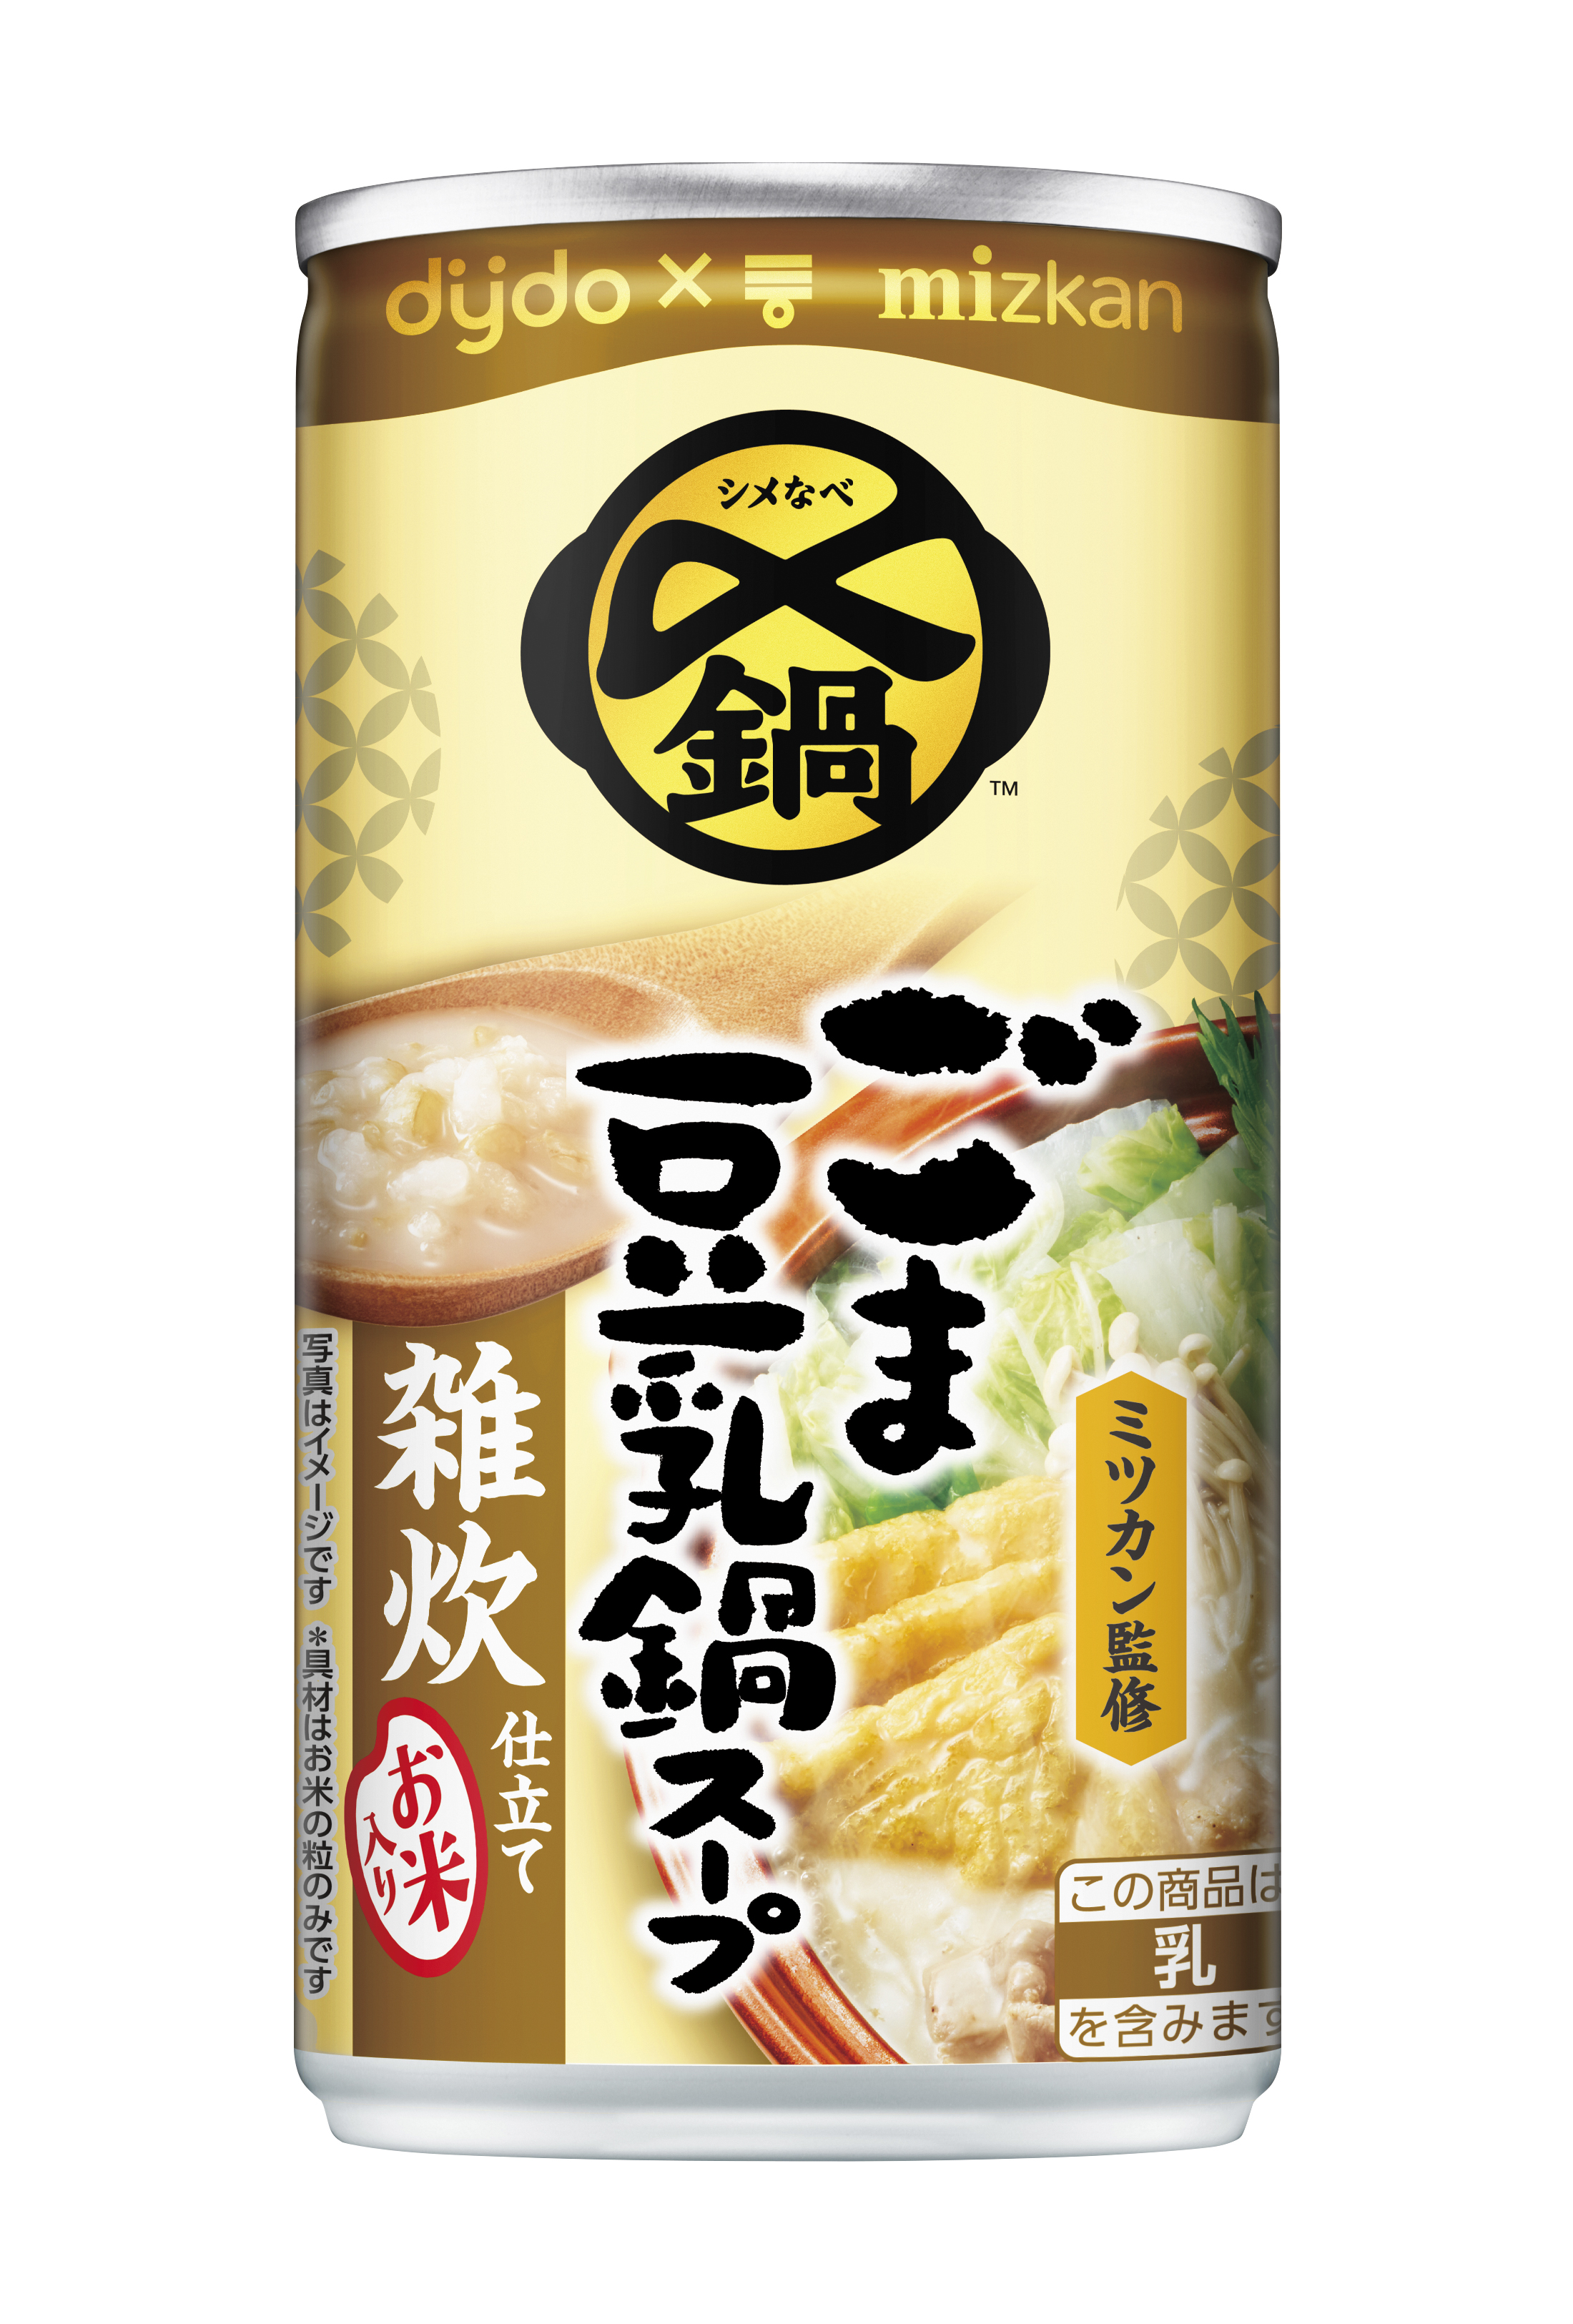
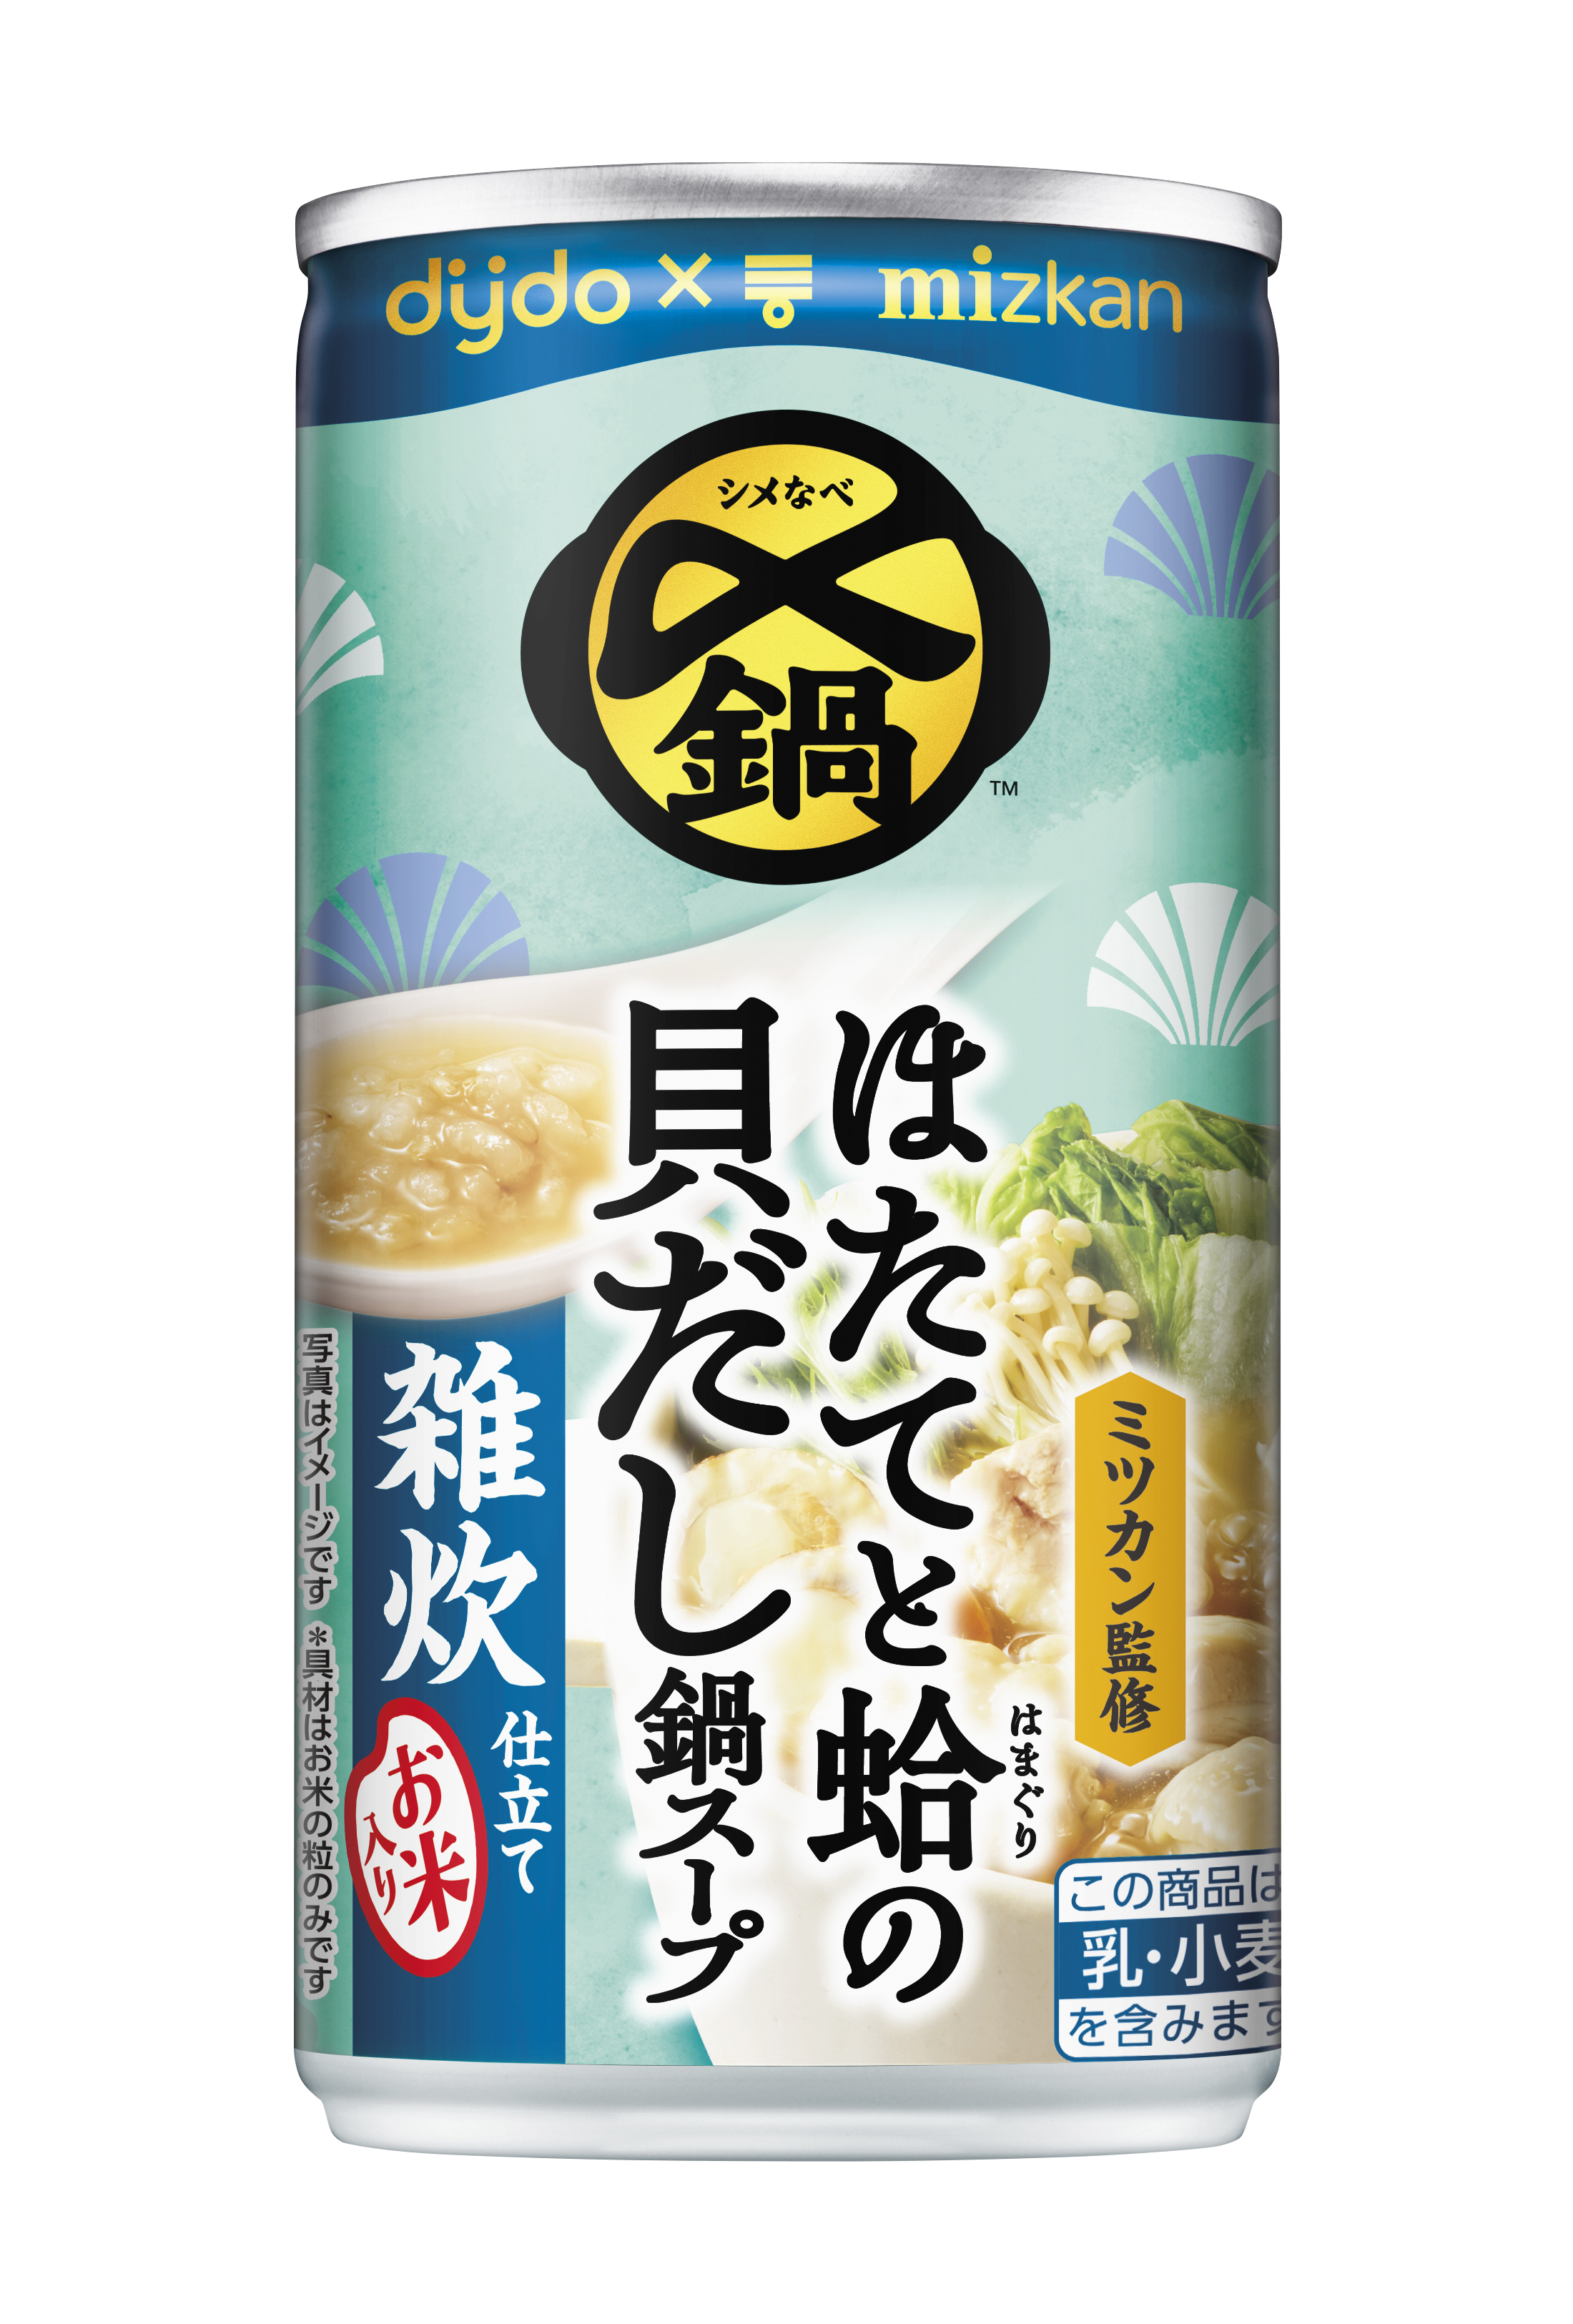
当社は、「共創SPAモデル」の実現に向けた取り組みの一環として、多様なパートナーとの共創から生まれた新商品**「ダイドー グッドラテ2050」「ダイドー×ミツカン 〆鍋 ごま豆乳鍋スープ 雑炊仕立て」「ダイドー×ミツカン 〆鍋 ほたてと蛤の貝だし鍋スープ 雑炊仕立て」**を発売します。
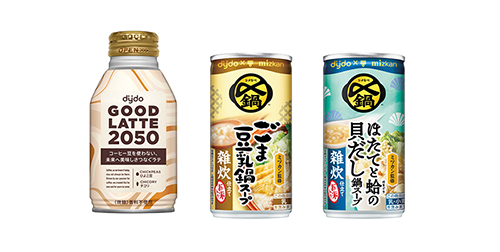
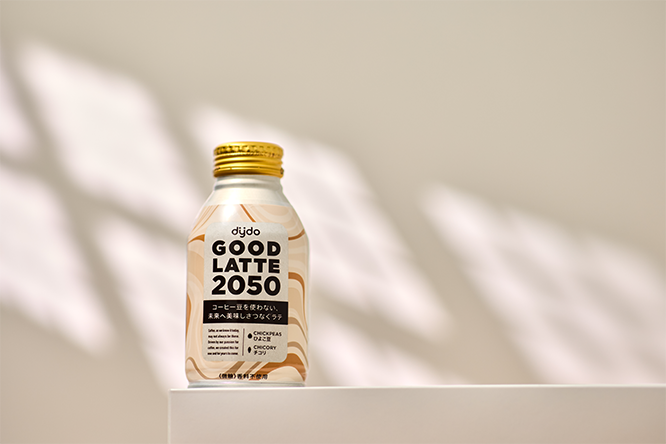
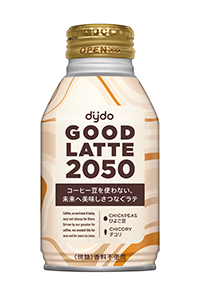
コーヒーの未来を見据えて開発した**「ダイドー グッドラテ2050」は、原料メーカーや製造パートナーとの共創により、コーヒー豆や香料を使用せずにコーヒーらしい香りと味わいを実現した商品です。
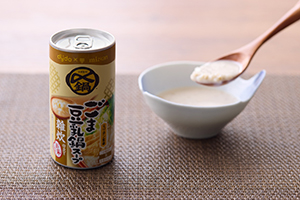
株式会社Mizkanとの共創により開発した「ダイドー×ミツカン 〆鍋 ごま豆乳鍋スープ 雑炊仕立て」「ダイドー×ミツカン 〆鍋 ほたてと蛤の貝だし鍋スープ 雑炊仕立て」**は、人気シリーズ「〆鍋™」と当社の飲料開発技術を掛け合わせた、「鍋の〆」ならではのおいしさを手軽に楽しめる缶スープ飲料です。
当社は今後も、お客様やパートナーとの共創を通じて、新たな商品価値・体験価値の創出に取り組んでまいります。
「ダイドー グッドラテ2050」発売リリース:
URL:https://www.dydo.co.jp/news/detail/20260910123005.html
「ダイドー×ミツカン 〆鍋 ごま豆乳鍋スープ 雑炊仕立て」「ダイドー×ミツカン 〆鍋 ほたてと蛤の貝だし鍋スープ 雑炊仕立て」発売リリース:
URL:https://www.dydo.co.jp/news/detail/20260910123004.html
### 3.自販機の商品見本に英字・アレルゲン情報などを表示
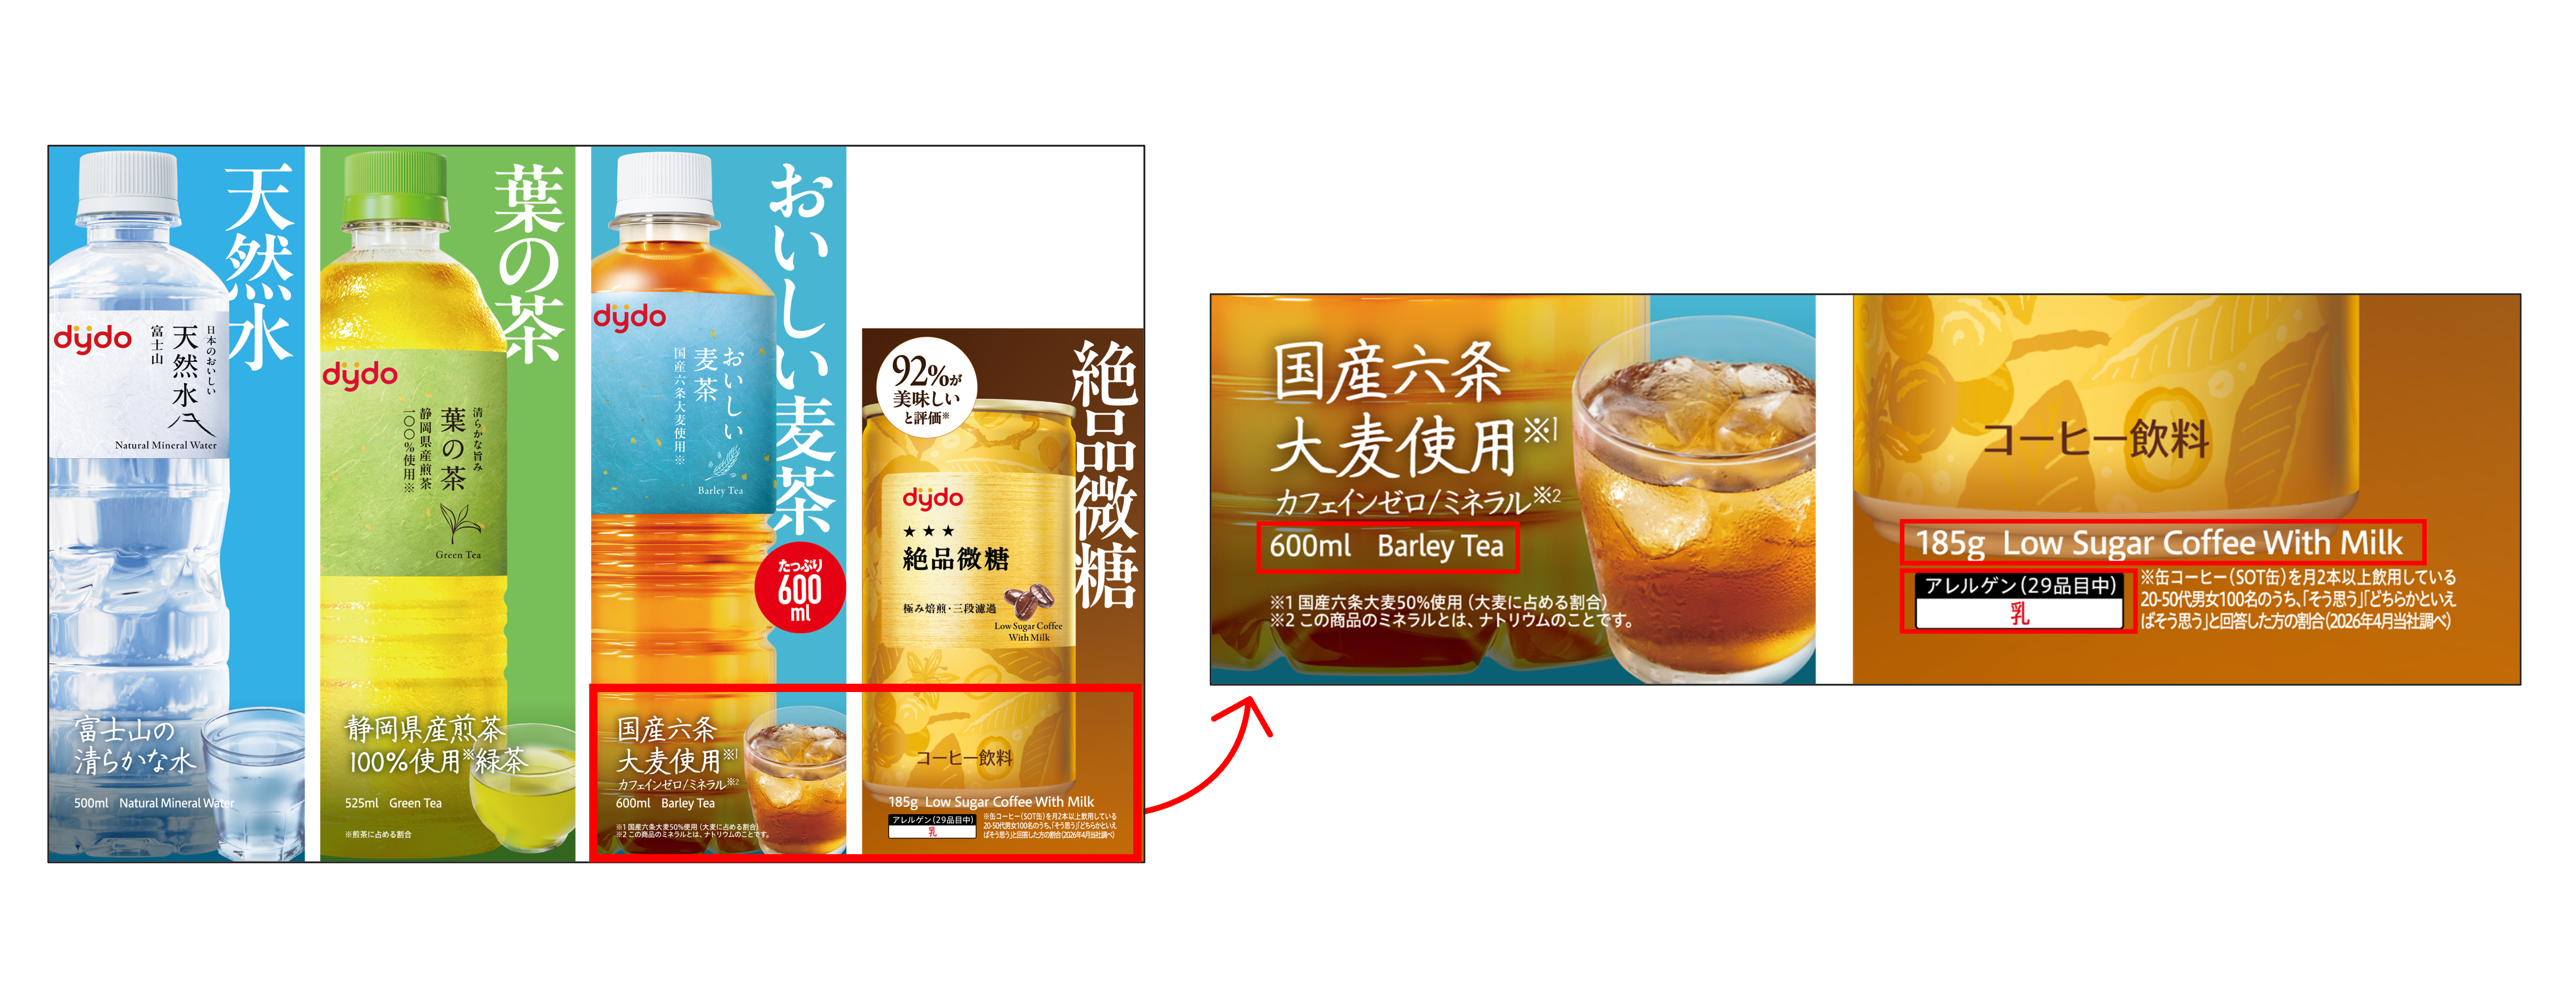
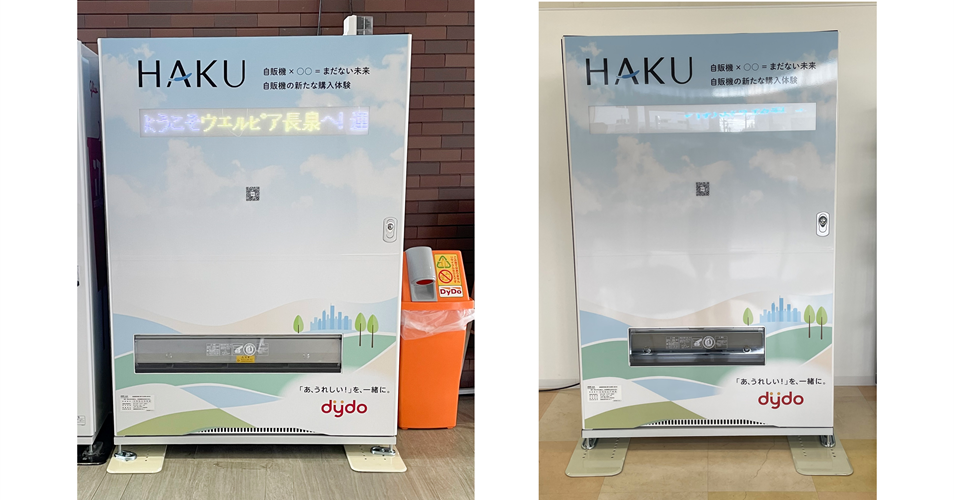
当社は、「誰でも安心して商品を選べる環境づくり」をめざし、自販機における情報提供の充実を進めます。その取り組みとして、当社自販機の商品見本に、容量、英字カテゴリ、アレルゲン情報(特定原材料/特定原材料に準ずるもの)を一括して確認できるよう表示する取り組みを開始します。加えて、商品情報をより詳しく確認できるWebページへの導線整備や、外国語での商品情報提供の拡充を進め、訪日外国人や在住外国人、アレルギーを持つ方をはじめ、お客様により安心して商品を手に取っていただける環境づくりに取り組みます。
今後は対象商品・対象自販機を順次拡大し、より多くのお客様が安心して利用できる自販機体験の実現をめざします。
### 4.武庫川女子大学との共創プロジェクトを推進
当社は、武庫川女子大学(本部:兵庫県西宮市)との共創プロジェクトを推進し、学生ならではの自由な発想や生活者視点を生かした商品開発に挑戦します。本プロジェクトでは、経営学部の学生とワークショップや授業を通じて、新たな商品価値や体験価値の創出に取り組んでまいります。
### 5.ファンサイト「dydoいっしょにラボ」の本格始動および共創企画の開始
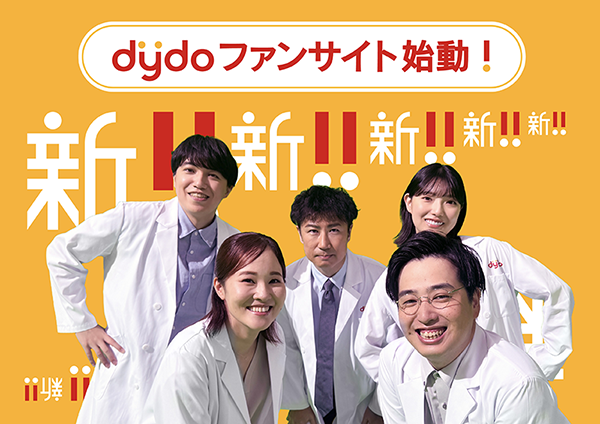
当社は、2026年9月1日(火)に開設したファンサイトの名称を「dydoいっしょにラボ」とし、参加型企画「一緒に!プロジェクト」として、新商品体験モニターの募集を開始します。
「dydoいっしょにラボ」は、新商品ブランドが掲げる「共創」の考え方のもと、お客様と共に商品や体験価値を育てていくためのコミュニティです。どなたでも気軽に参加いただけるよう、シンプルで親しみやすい名称としました。
参加型企画「一緒に!プロジェクト」においてモニターを募集する対象商品は、いずれもパートナー企業などとの「共創」によって生まれた新商品です。商品を通じて当社の活動に触れていただき、お客様から寄せられた率直な感想やご意見を、今後の商品開発や体験価値の向上に反映することで、より良いブランドの育成につなげてまいります。
ファンサイト「dydoいっしょにラボ」は、開設から1日でユーザー登録者数が1,000名を超えるなど、多くのお客様にご参加いただいています。今後も、商品への投票企画やファンサイトの活性化施策など、ブランド活動に参加いただける機会を創出してまいります。
### ■新商品体験モニター概要
ファンサイト「dydoいっしょにラボ」内にある「一緒に!プロジェクト」のモニター募集投稿から応募いただけます。当選された方にはDM(ダイレクトメッセージ)にてご連絡の上、後日商品をお送りします。商品の飲用後は、ファンサイト内で感想やご意見を投稿いただけます。
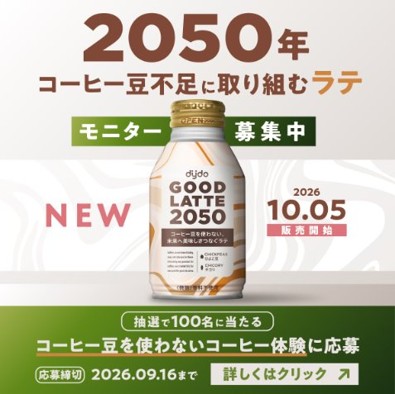 <モニター第1弾>
・対象商品 :ダイドー グッドラテ2050
・募集期間 :2026年9月10日(木)12時30分~9月16日(水)23時59分
・募集人数 :100名
・提供内容 :対象商品2本セット
・募集投稿 :https://dydo-to-fan.commmune.com/view/post/0/3030337
<モニター第2弾>
・対象商品 :ダイドー×ミツカン 〆鍋 ごま豆乳鍋スープ 雑炊仕立て
ダイドー×ミツカン 〆鍋 ほたてと蛤の貝だし鍋スープ 雑炊仕立て
・募集期間 :2026年9月10日(木)12時30分~9月25日(金)23時59分
・募集人数 :100名
・提供内容 :対象商品2本セット(各1本)
・募集投稿 :https://dydo-to-fan.commmune.com/view/post/0/3030998
■ファンサイト「dydoいっしょにラボ」概要
・URL:https://dydo-to-fan.commmune.com
・ご利用方法:内容はどなたでもご覧いただけます。商品レビューの投稿や各種企画への応募など、一部機能をご利用いただく場合は、LINEアカウントによる会員登録(無料)が必要です。
### 6.公式Xアカウント「dydo|商品ブランド【公式】」フォロー&リポストキャンペーン
新商品ブランドの本格始動を記念して、当社公式X(旧Twitter)アカウント「dydo|商品ブランド【公式】」をフォローして、キャンペーン対象の投稿をリポストした方に抽選で、新デザインパッケージ商品6本セットをお届けする『dydo』フォロリポキャンペーンを実施します。
プレゼントキャンペーン概要
|
|
| ■名称 |
『dydo』フォロリポキャンペーン |
| ■応募期間 |
2026年9月10日(木)13時00分~9月24日(木)14時59分 |
| ■応募方法 |
「dydo|商品ブランド【公式】」アカウント(@drink_dydo)をフォローして、キャンペーン対象の投稿をリポストしてください。 当選者には自動でDM(ダイレクトメッセージ)にて通知いたします。 URL:https://x.com/drink_dydo |
| ■景品 |
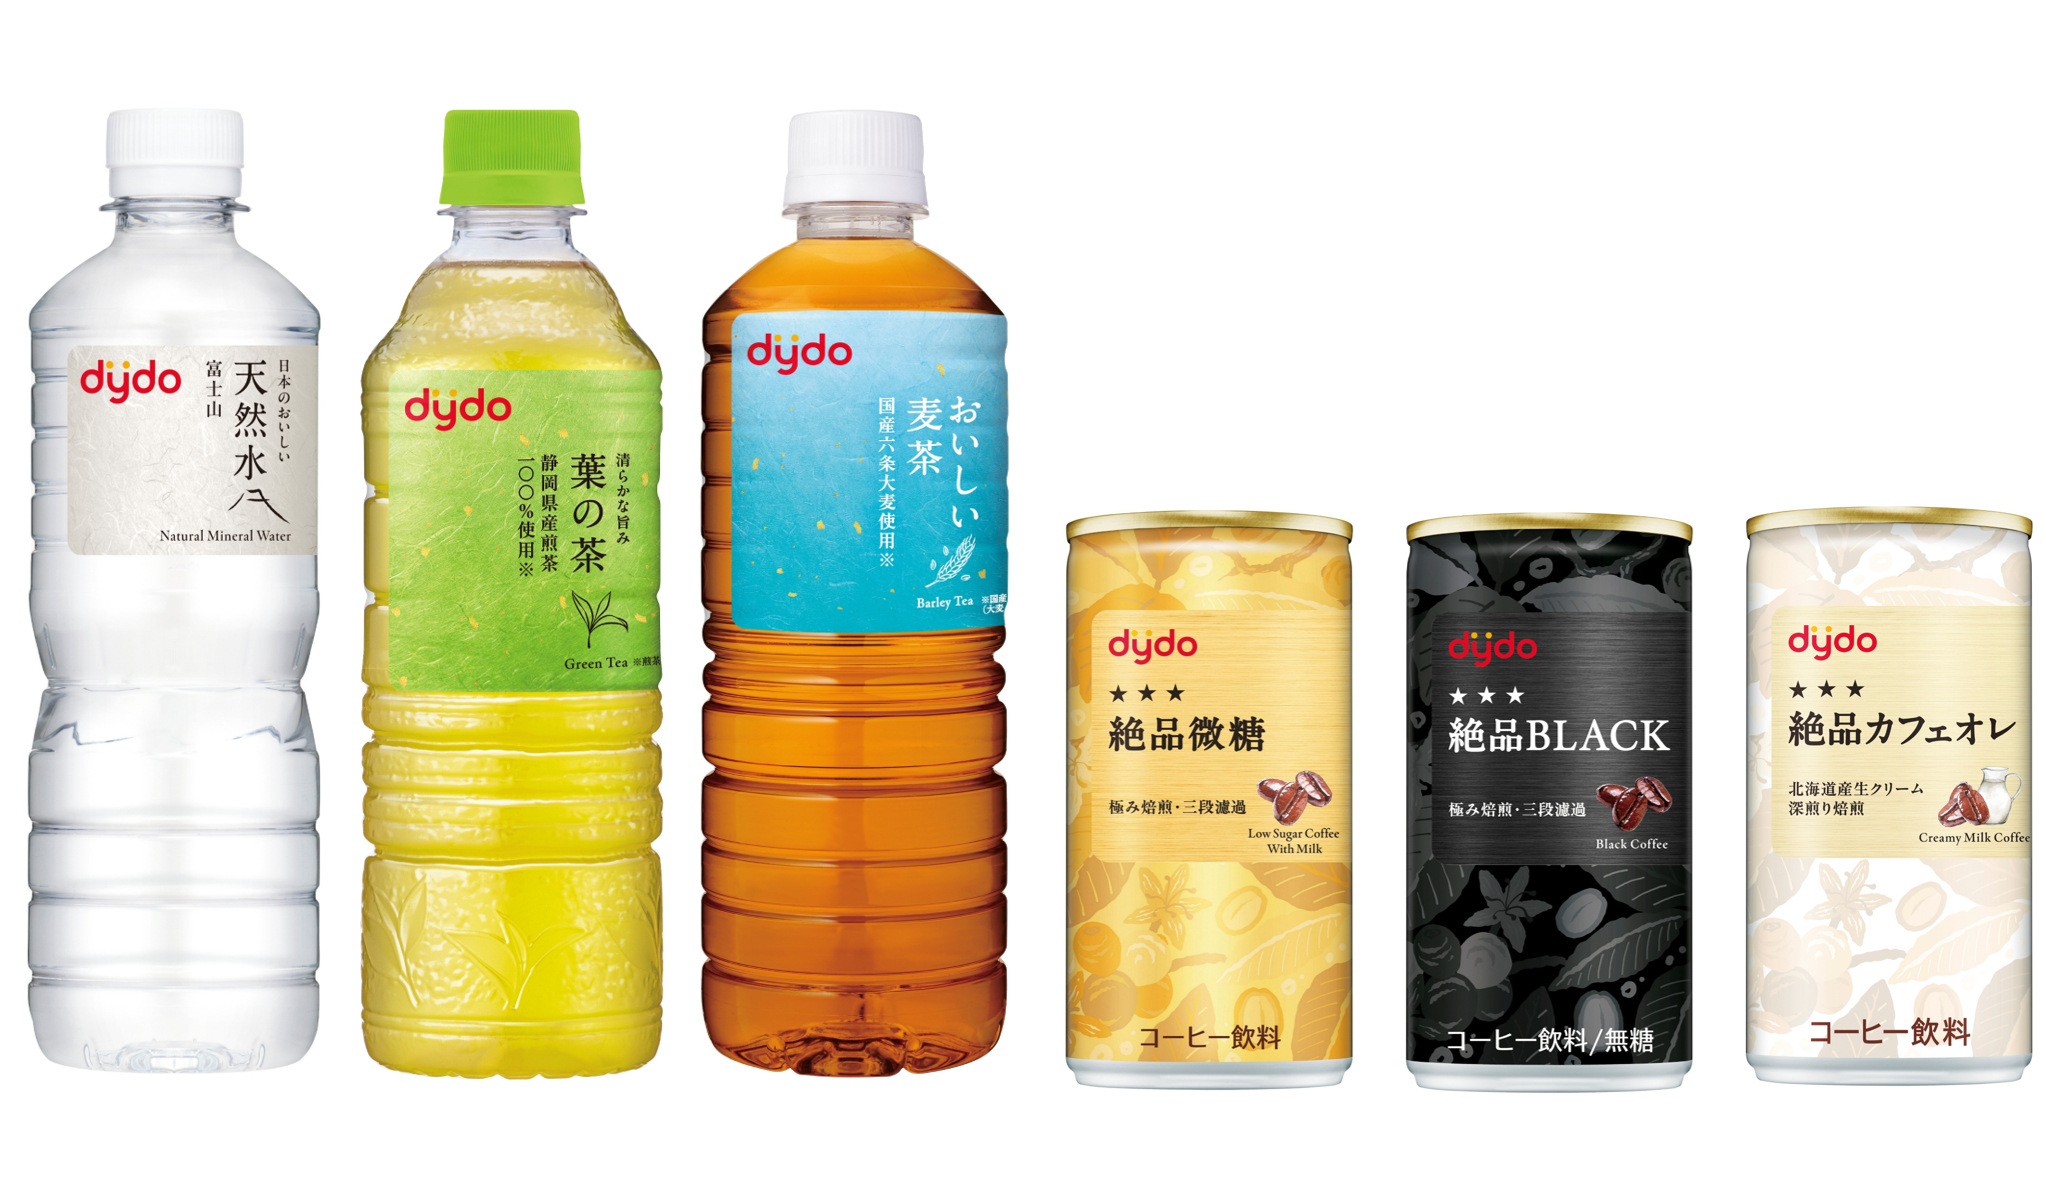 新デザインパッケージ商品6本セット ・ダイドー 日本のおいしい天然水 ・ダイドー 葉の茶 ・ダイドー おいしい麦茶 ・ダイドー 絶品微糖 ・ダイドー 絶品ブラック ・ダイドー 絶品カフェオレ |
| ■当選者数 |
100名様 |
(ご参考)
新商品ブランドについて
 ダイドードリンコは、2026年秋冬商品より、商品ブランドを刷新します。今回の刷新は、従来の商品ごとの訴求から、商品ブランド総体で価値を伝えていく方向へ転換し、品質、おいしさ、価格を通じて信頼されるブランドをめざすものです。
また、“「あ、うれしい!」を、一緒に。”を商品ブランドのスローガンに掲げ、オープンなモノづくりを通じて、お客様や様々なパートナーの皆様と新たな価値の共創をめざしています。
新商品ブランドロゴ「dydo」は、水・お茶・コーヒーなど、様々な飲料カテゴリに自然に調和するデザインとしています。
ロゴの「y」とその上の2つの●には、協力会社や生活者、地域社会などとの相互尊重と支え合いの想いを込め、共創・調和・つながりを表現しています。
詳細は、ニュースリリースをご覧ください。
(https://www.dydo.co.jp/news/detail/20260728130007.html)
DyDoグループは、
「こころとからだに、おいしいものを。」をブランドメッセージに、
高い品質にいつもサプライズを添えて、
「オンリーDyDo」のおいしさと健康をお客様にお届けします。


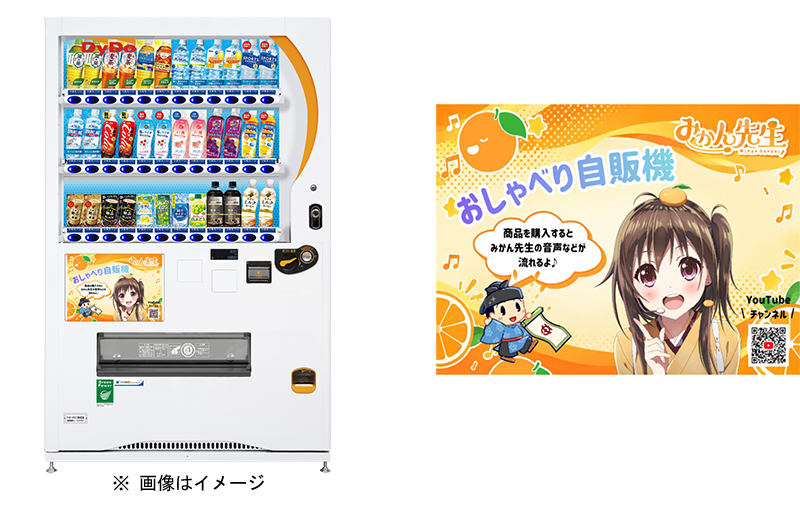
 ボイトレVTuberのみかん先生は、「みかんとボーカルノート」というチャンネル名でYouTube上で活動し、チャンネル登録者数は20.6万人を超えています(2026年10月時点)。
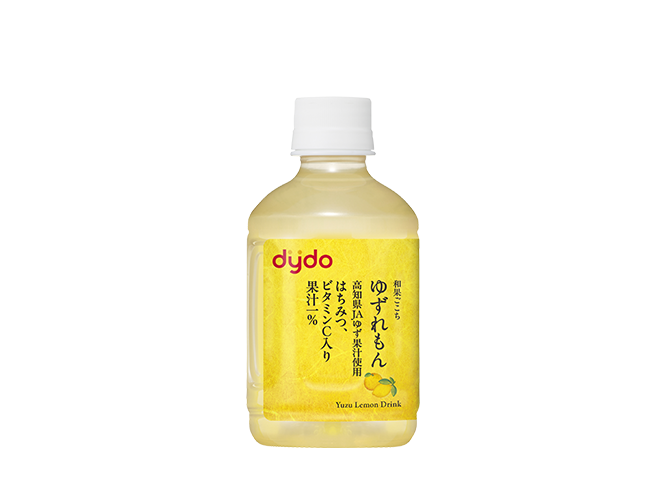
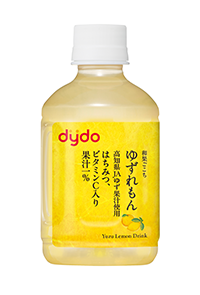
 を採用するとともに、「高知県JAゆず果汁使用」の文言、ゆずとレモンのアイコンをあしらうことで、素材本来のおいしさや安心感、モノづくりへのこだわりを表現しました。
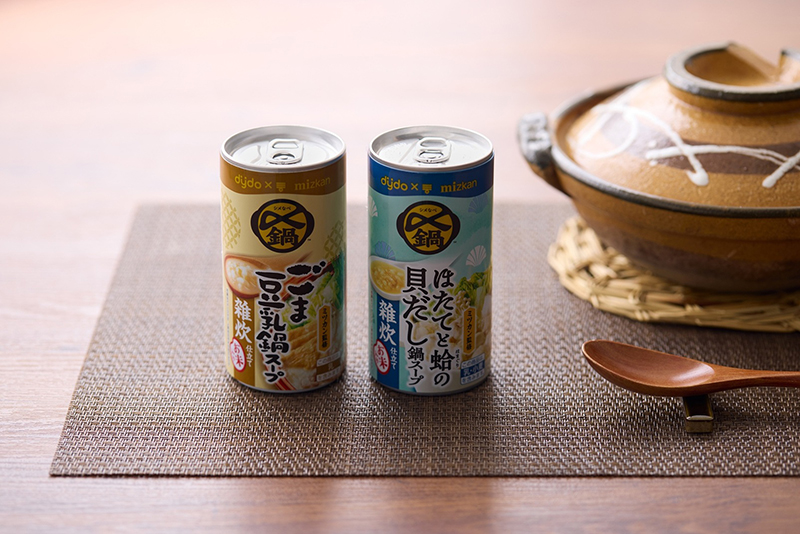
 「野菜をたくさん入れると味が薄くなってしまう」「家族の好みが合わない」「いつもの鍋がマンネリ化してしまう」「どれを選べばよいかわからない」――そんな鍋にまつわる様々なお悩みに応えるのが、ミツカン「〆鍋」ブランドです。「〆鍋」は、60年以上にわたる鍋つゆの研究とノウハウを活かし、どんな具材や食べ方でも、家族みんなで最後のひと口までおいしく楽しめる鍋つゆを開発・発売しています。これからも「〆鍋を選んでおけば間違いない!」と思っていただける安心のおいしさをお届けし、最後のひとくちまで満足できる、しあわせな食卓時間をつくります。
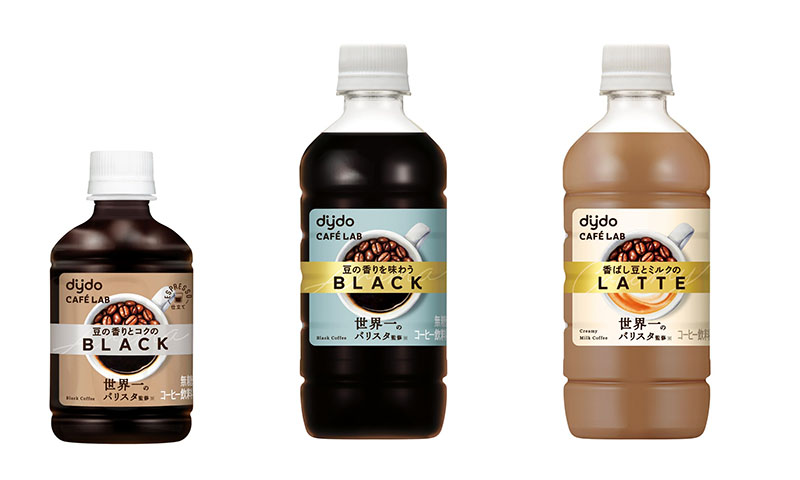
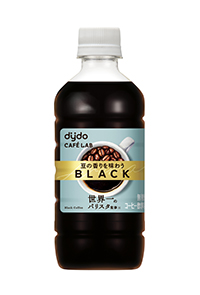
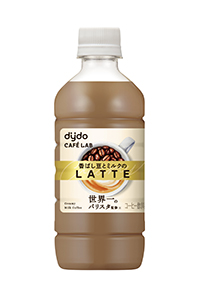
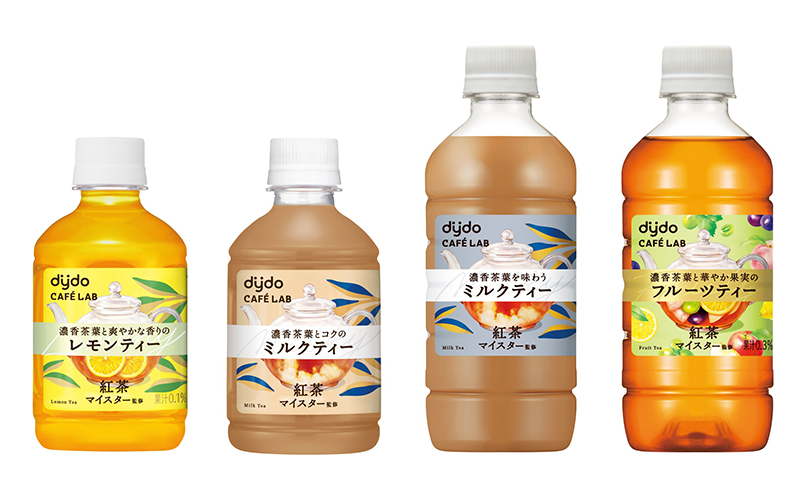
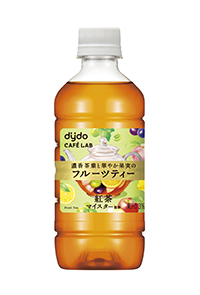
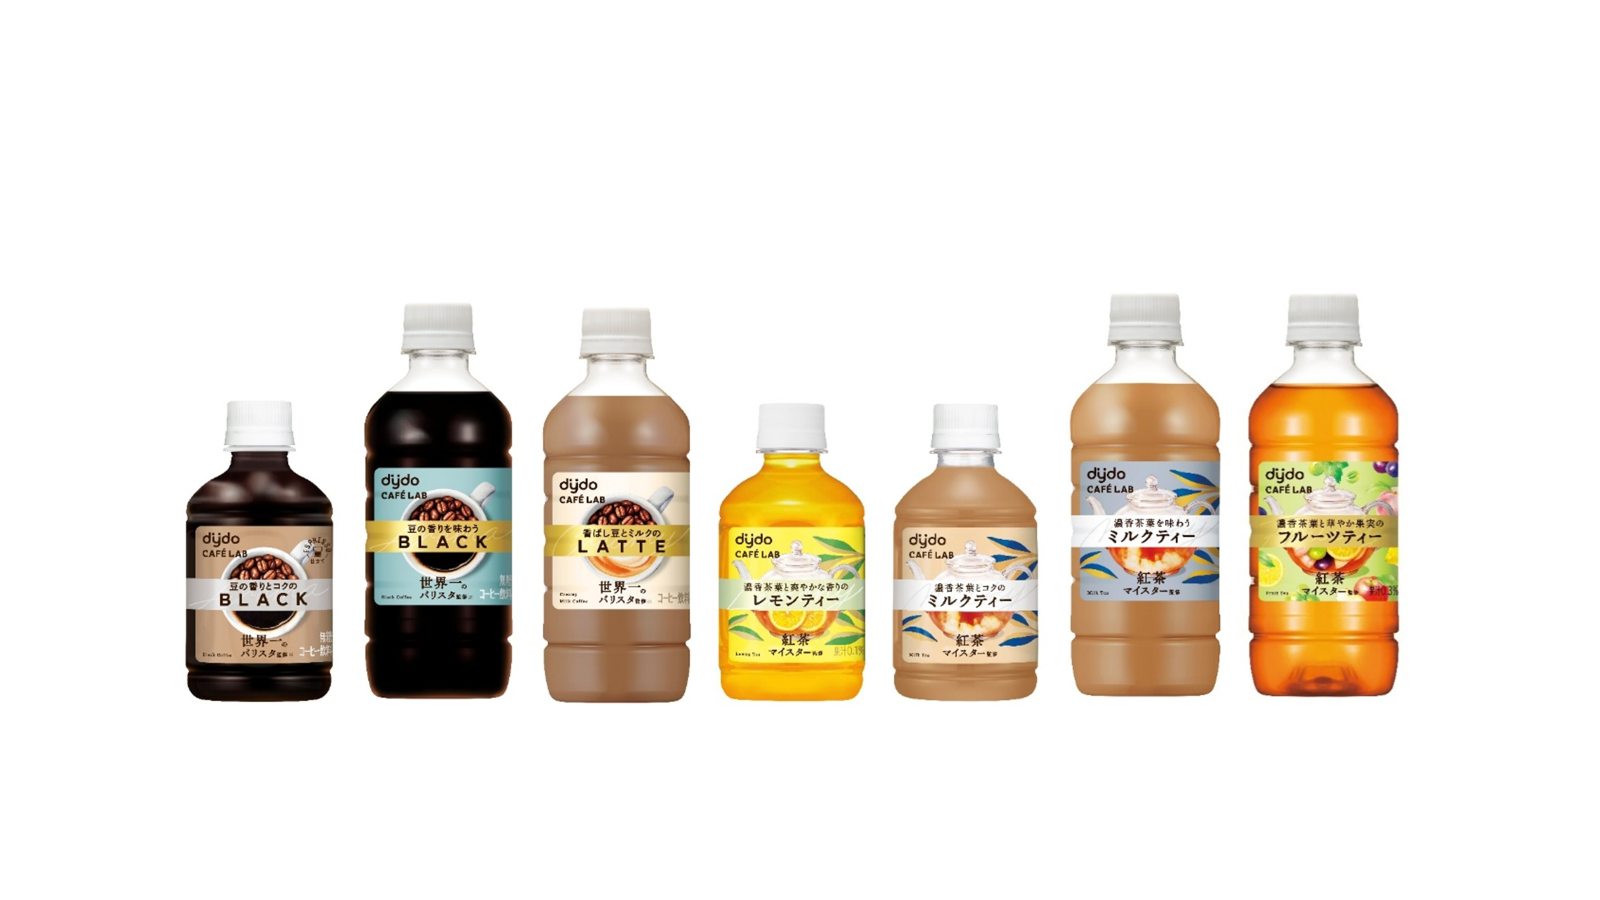 「dydo CAFÉ LAB」シリーズ 2026年秋冬新商品ラインアップ