2026年度 第3四半期 決算説明会
Bull 1
Bear 3
Results
|
Suntory Beverage & Food Limited is the core operating company for the beverage and food segment of the Suntory Group. The company manages a global portfolio of non-alcoholic beverages, including mineral water, coffee, tea, carbonated drinks, sports drinks, and health foods. Its business is organized into four regional segments: Japan, Asia Pacific, Europe, and the Americas. In Japan, the group manufactures and sells products through subsidiaries such as Suntory Products, Suntory Foods, and Suntory Beverage Solution. In Asia Pacific, operations include the production of health foods like BRAND'S Essence of Chicken in Thailand and Southeast Asia, energy drinks like Sting in Vietnam, and Pepsi-branded carbonated beverages. The European segment focuses on brands such as Orangina, Schweppes, Oasis, Ribena, and Lucozade across France, the UK, and Spain. In the Americas, the company manufactures and sells beverages in North America, primarily in North Carolina, through Pepsi Bottling Ventures. The group also operates in Australia, New Zealand, Malaysia, and Singapore, distributing brands like V, JUST JUICE, and Ribena. Suntory Beverage & Food Limited functions as the strategic hub for the group, overseeing business development, quality assurance, and M&A activities to support its international expansion. Summarised from the annual report, fiscal year ended Dec 2025 |
Industry Beverages - Non-Alcoholic | Homepage suntory.co.jp/softdrink |
| Sector Consumer Defensive | IR page suntory.co.jp/softdrink | |
|
Tags
mineral water, coffee beverages, tea beverages, carbonated drinks, sports drinks, energy drinks, health foods, juice beverages, vending machine sales, beverage manufacturing, Suntory Products, Suntory Foods, Suntory Beverage Solution, Japan Beverage Holdings, Suntory Foods Okinawa, Suntory Beverage & Food International (Thailand) Co. Ltd., Suntory PepsiCo Vietnam Beverage Co. Ltd., Suntory PepsiCo Beverage (Thailand) Co. Ltd., SUNTORY BEVERAGE & FOOD NEW ZEALAND LIMITED, SUNTORY BEVERAGE & FOOD AUSTRALIA PTY LTD, Orangina Schweppes Holding B.V., Lucozade Ribena Suntory Limited, Pepsi Bottling Ventures LLC, BRAND'S Essence of Chicken, Sting, TEA+, PEPSI, V, JUST JUICE, Ribena, Lucozade, Orangina, Schweppes, Oasis
|
Press page — |
Metrics
| Valuation | |
|---|---|
| Market cap | ¥ 1.382T |
| Market cap (USD) | $ 8.675B |
| P/E | 15.29 |
| PEG | 6.04 |
| P/BV | 0.95 |
| P/S | 0.75 |
| P/OCF | 8.67 |
| P/FCF | 21.16 |
| Dividend yield | 2.7% |
| Turnover / mcap | — |
| Returns | |
|---|---|
| ROE | 6.5% |
| ROI | 6.2% |
| ROIC | 7.7% |
| Profit margin | 5.2% |
| Growth | |
|---|---|
| Revenue growing | Yes |
| Profits growing | No |
| Revenue up 3y | Yes |
| Revenue up 5y | Yes |
| Earnings growth 3y (net profit CAGR) | 2.5% |
| Quality | |
|---|---|
| Profitable | Yes |
| Margin expanding | No |
| Buying back stock | No |
| Diluting (TTM) | No |
| Debt/Equity | — |
| Podcast bulls (TTM) | Sign up |
| Podcast bears (TTM) | Sign up |
| Podcast sentiment (TTM) | Sign up |
| Podcast sentiment % (TTM) | Sign up |
| News sentiment (TTM) | 0 |
| Quality score | 11.1% |
| Insiders | |
|---|---|
| Buys, 1w | Sign up |
| Buys, 1m | Sign up |
| Buys, 1y | Sign up |
| Sells, 1w | Sign up |
| Sells, 1m | Sign up |
| Sells, 1y | Sign up |
Sign up to see this company's insider trades
| Figure | FY 2025 | FY 2024 | FY 2023 | FY 2022 | FY 2021 | FY 2020 | FY 2019 | FY 2018 | FY 2017 | FY 2016 | FY 2015 | FY 2014 | FY 2013 | FY 2012 |
|---|---|---|---|---|---|---|---|---|---|---|---|---|---|---|
| Revenue | 1.715T | 1.697T | 1.592T | 1.45T | 1.269T | 1.178T | 1.299T | 1.294T | 1.452T | 1.411T | 1.381T | 1.257T | 1.121T | 992.16B |
| Net profit | 88.723B | 93.495B | 82.743B | 82.317B | 68.676B | 52.212B | 68.888B | 80.024B | 47.395B | 46.056B | 42.462B | 36.239B | 31.196B | 23.385B |
| Free cash flow | 65.301B | 85.423B | 79.056B | 90.281B | 102.058B | 71.534B | 111.781B | — | — | 110.067B | 86.652B | — | — | — |
| Figure | FY 2025 | FY 2024 | FY 2023 | FY 2022 | FY 2021 | FY 2020 | FY 2019 | FY 2018 | FY 2017 | FY 2016 | FY 2015 | FY 2014 | FY 2013 | FY 2012 |
|---|---|---|---|---|---|---|---|---|---|---|---|---|---|---|
| Share price | 4.727K | 5.013K | 4.651K | 4.5K | 4.16K | 3.65K | 4.545K | 4.959K | 5.01K | 4.855K | 5.32K | 4.17K | 3.355K | — |
| Price performance 12m | -0.06 | 0.08 | 0.03 | 0.08 | 0.14 | -0.2 | -0.08 | -0.01 | 0.03 | -0.09 | 0.28 | 0.24 | — | — |
Filed figures
Lines the statements and their notes report beside the headline figures, read from the filings' XBRL as filed (no restatement applied), with figures computed from one filing's own lines. Cash-flow lines carry their cash direction: an outflow is negative. Each period links to its filing; a figure's period, report date and tag are in its tooltip.
| Figure | Dec 2016 | Dec 2017 | Dec 2018 | Dec 2019 | Dec 2020 | Dec 2021 | Dec 2022 | Dec 2023 | Dec 2024 | Dec 2025 |
|---|---|---|---|---|---|---|---|---|---|---|
| Balance sheet detail | ||||||||||
| Trade receivables (JPY) | 161B | — | — | — | — | — | — | — | — | — |
| ↳ YoY growth | +2.6% | |||||||||
| Borrowings, current (JPY) | 72.2B | — | 75.4B | 74.7B | 83.4B | 55.8B | 58B | 49.4B | 26.7B | 15B |
| Borrowings, non-current (JPY) | 239B | — | 195B | 133B | 120B | 110B | 64.8B | 25B | 550M | 506M |
| Bonds payable (JPY) | 40B | — | — | — | — | — | — | — | — | — |
| Lease liabilities (JPY) | 18.7B | — | — | — | — | — | — | — | — | — |
| Cash and deposits (JPY) | 84.1B | 117B | 147B | 144B | 167B | 177B | 201B | 172B | 160B | 149B |
| Intangible assets (JPY) | 622B | — | 419B | 411B | 405B | 430B | 452B | 495B | 531B | 565B |
| Right-of-use assets (JPY) | — | — | — | 47.4B | 50.8B | 52.3B | 48.8B | 51.9B | 61.5B | 67.6B |
| Net debt (borrowings + leases - cash) (JPY) | 246B | — | 124B | 63.8B | 36.2B | -11.3B | -77.9B | -97.3B | -133B | -133B |
| Cash flow detail | ||||||||||
| Operating cash flow (JPY) | 162B | 149B | 146B | 171B | 134B | 158B | 151B | 158B | 194B | 159B |
| Purchases of property, plant and equipment (JPY) | -51.8B | — | -56.9B | -58.8B | -62.5B | -56.1B | -60.2B | -79.2B | -108B | -94B |
| Change in receivables (cash effect) (JPY) | -9.9B | — | — | — | — | — | — | — | — | — |
| Change in inventories (cash effect) (JPY) | 5.59B | — | -4.86B | 439M | 5.06B | -5.5B | -19.2B | -4.68B | 2.13B | -14.5B |
| Change in payables (cash effect) (JPY) | 1.38B | — | — | — | — | — | — | — | — | — |
| Dividends paid (cash effect) (JPY) | -21.3B | — | -23.8B | -24.1B | -24.1B | -24.1B | -24.1B | -25B | -29.4B | -38.6B |
| Interest paid (cash effect) (JPY) | -4.83B | — | -2.41B | -2.78B | -1.97B | -2.93B | -2.03B | -2.06B | -4.53B | -3.98B |
| Income taxes paid (cash effect) (JPY) | -24.7B | — | — | — | — | — | — | — | — | — |
| Operating cash flow before change in receivables (JPY) | 172B | — | — | — | — | — | — | — | — | — |
| Free cash flow (OCF - PPE - intangibles) (JPY) | 110B | — | 89.4B | 112B | 71.5B | 102B | 90.3B | 79.1B | 85.4B | 65.3B |
| Income detail | ||||||||||
| Research and development expense (JPY) | 9.42B | — | — | 8.7B | 8.1B | 8.5B | 9.1B | 9.8B | 11.3B | 11.3B |
| ↳ 5y CAGR | +5.4% | +6.9% | ||||||||
| Total comprehensive income (JPY) | 6.65B | 73.2B | 56.1B | 78.6B | 57.4B | 123B | 157B | 175B | 181B | 167B |
| Comprehensive income to owners (JPY) | 21.4B | 106B | 48.2B | 66.6B | 49.2B | 103B | 129B | 147B | 148B | 145B |
| Segments | ||||||||||
| Americas · Segment revenue (JPY) | — | — | 85B | 87.8B | 90.1B | 108B | 145B | 173B | 195B | 196B |
| ↳ YoY growth | +3.2% | +2.7% | +20.3% | +34.1% | +18.8% | +12.7% | +0.6% | |||
| Americas · Segment operating income (JPY) | — | — | 8.49B | 8.24B | 9.1B | 13.3B | 18.2B | 21B | 23.7B | 23.5B |
| Asia · Segment revenue (JPY) | — | — | 208B | 233B | 213B | — | — | — | — | — |
| ↳ YoY growth | +11.7% | -8.5% | ||||||||
| Asia · Segment operating income (JPY) | — | — | 29.2B | 25.2B | 27.9B | — | — | — | — | — |
| Asia Pacific · Segment revenue (JPY) | — | — | — | — | 266B | 297B | 361B | 371B | 402B | 394B |
| ↳ YoY growth | +11.7% | +21.4% | +3.0% | +8.2% | -2.0% | |||||
| Asia Pacific · Segment operating income (JPY) | — | — | — | — | 34.4B | 39.7B | 56.4B | 43.1B | 45.4B | 42.5B |
| Europe · Segment revenue (JPY) | — | — | 240B | 223B | 191B | 236B | 294B | 340B | 369B | 391B |
| ↳ YoY growth | -7.0% | -14.5% | +23.6% | +24.3% | +15.9% | +8.5% | +5.8% | |||
| Europe · Segment operating income (JPY) | — | — | 29.1B | 33B | 27.2B | 35.7B | 43.4B | 51.7B | 60.4B | 61.6B |
| Japan · Segment revenue (JPY) | — | — | 709B | 704B | 633B | 630B | 653B | 708B | 732B | 735B |
| ↳ YoY growth | -0.6% | -10.1% | -0.5% | +3.7% | +8.4% | +3.3% | +0.5% | |||
| Japan · Segment operating income (JPY) | — | — | 52.7B | 53.5B | 37B | 40.9B | 33.4B | 40.5B | 49.1B | 47B |
| Oceania · Segment revenue (JPY) | — | — | 54.2B | 53.2B | 53B | — | — | — | — | — |
| ↳ YoY growth | -1.8% | -0.4% | ||||||||
| Oceania · Segment operating income (JPY) | — | — | 6.37B | 6.14B | 6.46B | — | — | — | — | — |
| Reported | Mar 30, 2018 | Mar 30, 2018 | Mar 30, 2020 | Mar 29, 2021 | Mar 28, 2022 | Mar 28, 2022 | Mar 27, 2023 | Mar 28, 2024 | Mar 27, 2025 | Mar 23, 2026 |
Sign up to see institutional holdings
Sign UpPodcast Mentions
Sign up to see podcast mentions and sentiment
Sign UpTimely disclosures published on TDnet, newest first, titles as filed in Japanese. The link opens the disclosure on TDnet. Filings with EDINET (periodic reports, extraordinary reports, offerings, holding and buy-back reports), newest first, titles as filed in Japanese. The link opens the filing on EDINET. Press releases from the company's own website, newest first.
 |
 |

 |
 |
 |
 |
 中谷(マユリカ) 2010年NSC大阪校33期生。2011年、阪本と「マユリカ」を結成。 趣味は絵を描くこと(イラスト、マンガ、似顔絵)。 特技は絵を描くこと(イラスト、マンガ、似顔絵)、口笛、バク転、バク宙。 |
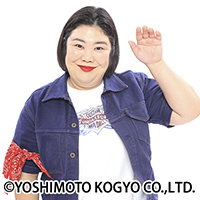 熊元プロレス(紅しょうが) 1990年11月30日生まれ、兵庫県出身。 吉本興業に所属し、お笑いコンビ「紅しょうが」のボケ担当。 2014年に稲田美紀とコンビを結成。「女子~!」というフレーズで知られ、お互いのキャラクターを活かした漫才を展開する。 2023年活動拠点を大阪から東京へ移籍。同年、「女芸人No.1決定戦 THE W」で7代目女王となり、現在はテレビ、ラジオ、ライブなど幅広く活躍している。 |
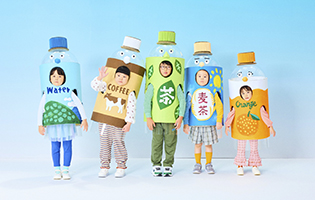 ペットボトル姿の子どもたち(左から順に) エリオット咲那 七星ここみ 夏目翔向 飯塚愛叶 宮島るか |
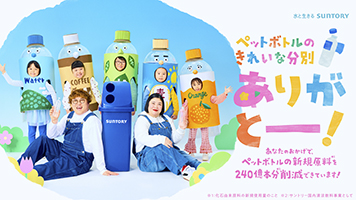
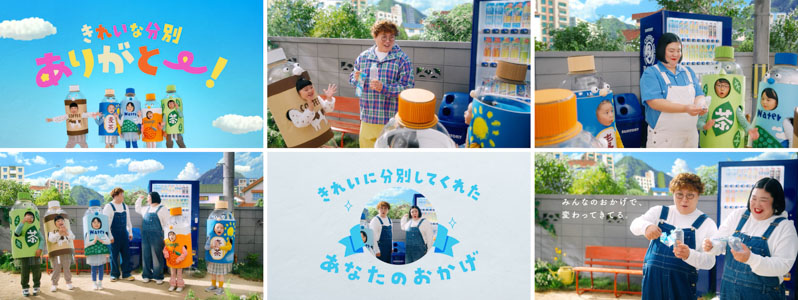
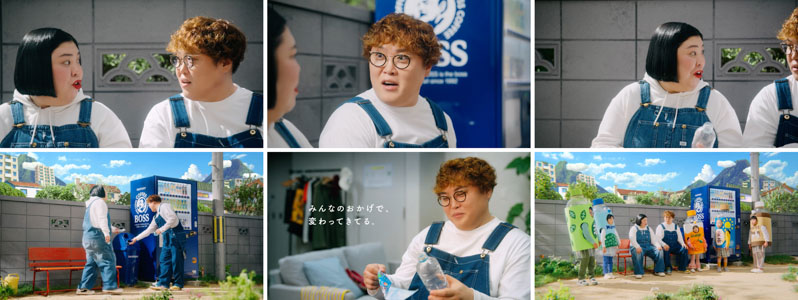
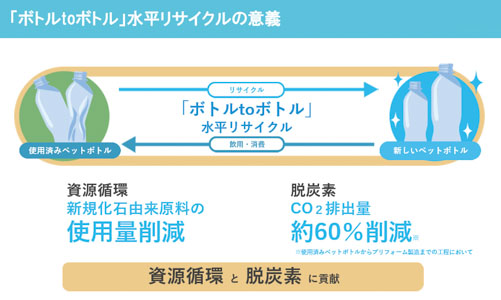
 今回、使用済みペットボトルが資源として回収され、再び新しいペットボトルへと生まれ変わる循環を、生活者にわかりやすく伝えるための言葉・グラフィックとして「リサイクルクル」を展開しています。「リサイクルクル」を通じて、「ボトルtoボトル」水平リサイクルの考え方や、ペットボトルを資源として何度も循環させる大切さを伝えています。 |
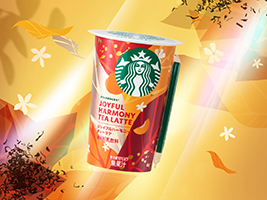
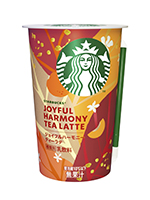
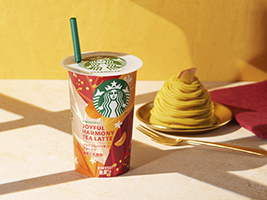
 ドリンクと相性の良いフードは、組み合わせることでそれぞれの味わいを引き立たせるだけでなく、そのドリンク体験を新たな高みに引き上げる可能性も秘めています。そこで、米国 シアトルのスターバックス本社で商品開発を行っている担当者による、「スターバックス ジョイフルハーモニーティーラテ」と一緒に楽しめる、おすすめの組み合わせをご紹介します。 (スターバックス・コーヒー・カンパニー グローバルチャネルデベロップメントR&D ケニー・バレンタ) |
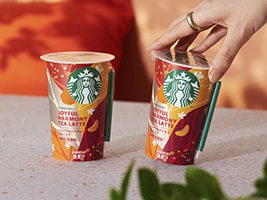

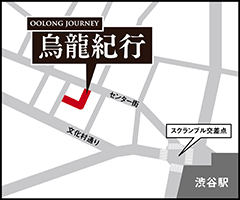 ■タイトル:『烏龍紀行』by「サントリー烏龍茶」 ■開催日時:10月9日(金)~10月12日(月)12:00~20:00 (最終日のみ18:00まで) ■入場方法:事前予約なし ※混雑時は整理券をお渡しします ■開催場所:渋谷Lストリート(渋谷区宇田川町26-7) ■料金:入場無料(サントリー烏龍茶OTPP600mlペットボトル・トラベルノート・限定ステッカー(先着)) 肉まん(税込150円)のみ有料 ※お支払いはクレジットカード・各種キャッシュレス決済対応 ※肉まんのご購入は任意です |
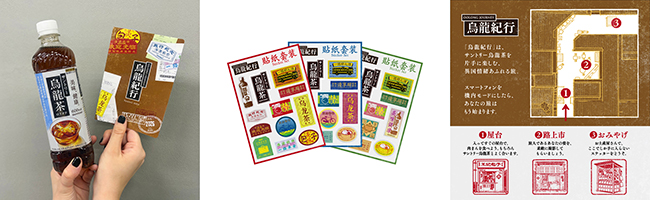
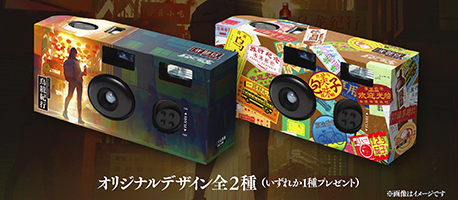
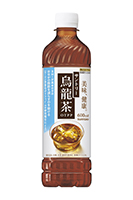 「サントリー烏龍茶」は、1981年に缶入り烏龍茶として発売して以来45年間、多くのお客様から日々の水分補給として、また食事のお供としてご好評いただいているロングセラーブランドです。2022年、「機能性表示食品」としてリニューアルし、たいへんご好評をいただいています。「美味、健康」という「サントリー烏龍茶」を象徴するキーワードで、お茶としての美味しさと健康的なイメージの両方をストレートに訴求しています。中味は独自のブレンド・製法技術によって、スッキリ感を維持しながら、烏龍茶らしい味わい深いコクをお楽しみいただけます。おいしく、おなかの脂肪を減らすのを助ける※機能性表示食品として、お客様の食事のひとときに寄り添います。 |
 ニッセイ基礎研究所 生活研究部 上席研究員。専門は消費者行動。家計消費や生活者の行動・価値観の変化を、統計データから分析している。総務省統計委員会委員など、政府の委員を務める。メディア出演や講演も多数。 |
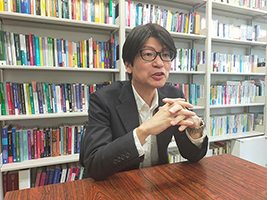 「1対1の雑談と3人の雑談には、それぞれ異なる良さがあります。1対1の雑談では、相手に集中して話すことで、より深い対話や信頼関係につながりやすい。一方、3人での雑談では、複数の視点が交わることで話題が広がりやすくなります。目的に応じて、人数を使い分けることが重要だと考えます。」 |
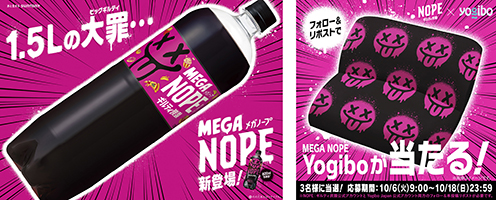
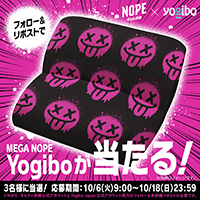
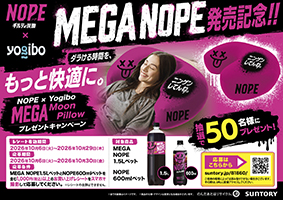
 ビーズソファをはじめ、インテリア家具・生活雑貨などリラックスアイテムを扱うライフスタイルブランド。 Yogiboのビーズソファは1つでベッド・ソファ・リクライナー・チェアなど自在に形状を変化させられ、デザイン性の高いインテリアとしてご自宅からホテル、オフィスまで幅広く活用されています。現在世界7ヶ国で展開中です。 |
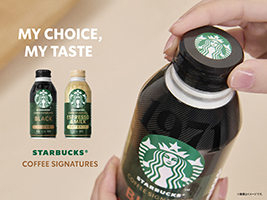
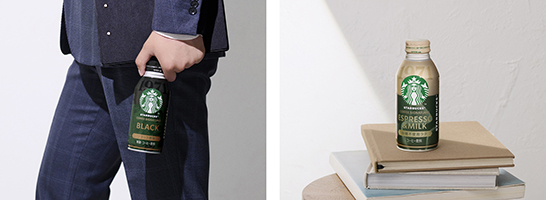

 スターバックスでは、1971年にシアトルで創業以来、厳選した高地産のアラビカ種を使用し、豆のおいしさを最大限引き出すための焙煎方法が、“スターバックスロースト”というひとつの哲学として引き継がれています。今回配合した“エスプレッソロースト”は、豆の芯までしっかりと熱を入れて焙煎することによる、はっきりとした力強い風味やコク、豊かな香り、キャラメルのような甘み、やわらかな酸味が特徴です。長めにローストされたこのコーヒーはミルクとの相性もよく、ホットでもコールドでも飲みごたえのある、バランスのよい味わいをお楽しみいただけます。 (シアトル本社のコーヒースペシャリスト:セルジオ アルバレス談) |
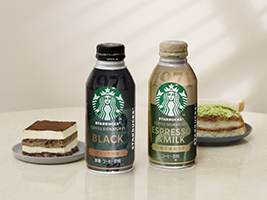
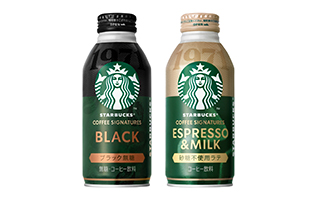
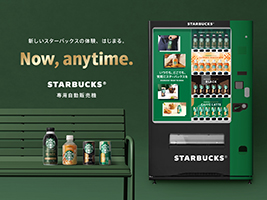
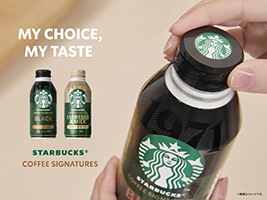
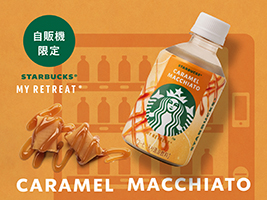
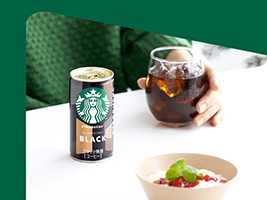

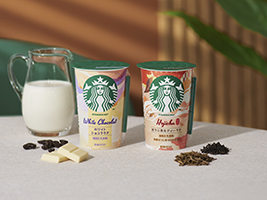
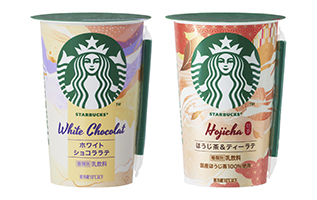
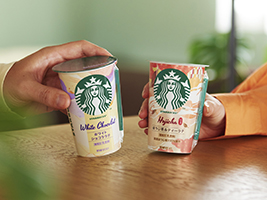
 ドリンクと相性の良いフードは、組み合わせることでそれぞれの味わいを引き立たせるだけでなく、そのドリンク体験を新たな高みに引き上げる可能性も秘めています。そこで、米国シアトルのスターバックス本社で商品開発を行っている担当者による、「スターバックス ホワイトショコララテ」、「同 ほうじ茶&ティーラテ」と一緒に楽しめる、おすすめの組み合わせをご紹介します。 (スターバックス・コーヒー・カンパニーグローバルチャネルデベロップメント R&D ケニー・バレンタ) |
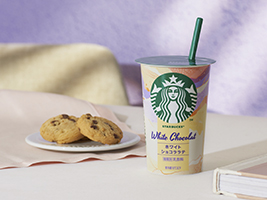 チョコチップクッキー チョコチップを練り込んだ、サクサク感としっとり感が楽しめるチョコチップクッキー。クッキーのダークチョコレートと、「ホワイトショコララテ」のホワイトチョコレートによる風味のコントラストが、それぞれの魅力を引き立て合い、濃厚でクリーミーな味わいを楽しめます。ほっとひと息したい時に、至福のひとときをお届けします。 |
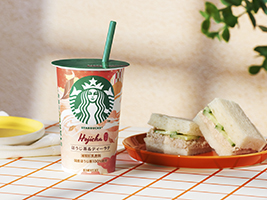 ツナときゅうりのサンドイッチ サンドイッチの中でも定番の一つであるツナときゅうりを使用したサンドイッチ。きゅうりのシャキシャキした食感とクリーミーなツナが、「ほうじ茶&ティーラテ」の豊かな風味と調和し、奥行きのある味わいが広がります。また、後味にはほうじ茶の香ばしい香りが心地よくあふれ、すっきりとした余韻をお楽しみいただけます。 |
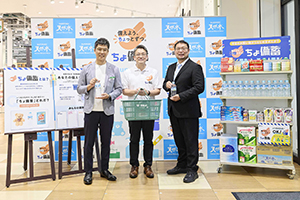
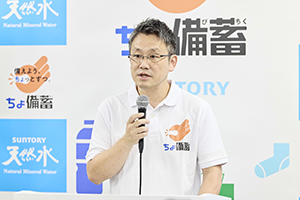 サントリー 溝本将洋 溝本は「水は単に飲むものではなく、日々の生活を支える重要なインフラです。『サントリー天然水』は、安全・安心な飲料水を提供するだけでなく、災害時には命を支えるライフラインとしての役割も担うブランドだと考えています。昨年から開始した『ちょ備蓄』プロジェクトは、日常と非日常を切り分けず、『いつも使っているものを、ちょっとずつ多めに買っておく』という行動を積み重ねることで、自然と『もしものときの備え』につなげていく考え方です。こうした小さな行動の積み重ねによって、しっかり備蓄ができている人を少しでも増やしていきたいと思います。」とプロジェクトへの思いを説明しました。 |
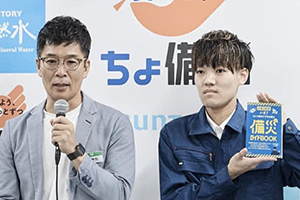 サミット 岡田崇氏(左)、仁木氏(右) また、協力企業を代表してサミット株式会社 取締役常務執行役員 岡田崇氏より、「サミットでは、お客様に災害に備える機会を増やしていただくため、『備災セール』の回数を増やしたり、リーフレットを配布したりしています。今回のイベントは、普段の買い物の延長で、誰もが気軽に災害に備えることができる素晴らしい企画だと思っています。この輪がもっと広がっていくことを願っています。」との思いが語られました。また、サミット従業員で、防災士の仁木氏も登壇し、「日常の備えは一部の専門家だけで行うのではなく、一人ひとりが担っていくものです。皆様の災害に備える活動を全力でサポートしていきたい。」と力強く語りました。 |
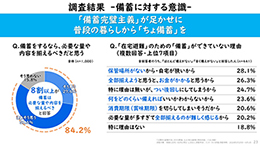
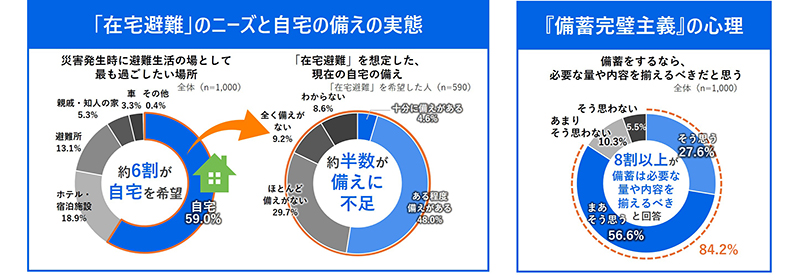
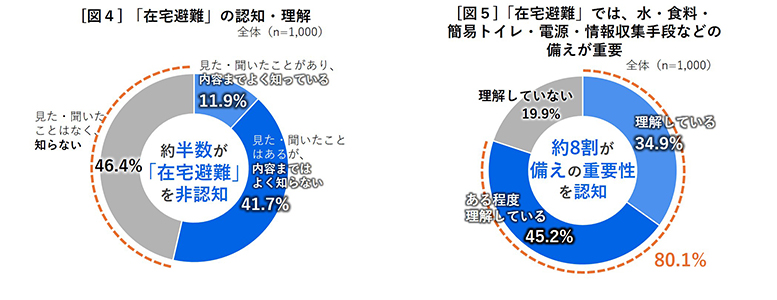
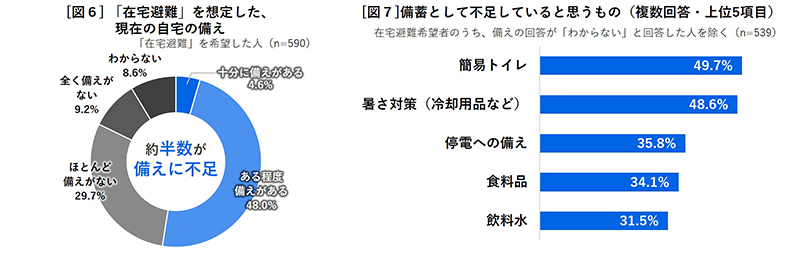
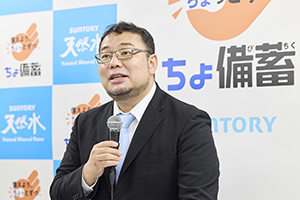 防災心理学者 木村玲欧氏 調査では、災害時、自宅に倒壊・浸水などの危険がなく、その場で生活を続けられる場合に「在宅避難」を希望した人に、現在の自宅での「在宅避難」への備えについて聞いたところ、半数近くの人が備えに不足があることがわかり、さらに、「十分に備えがある」と回答した人は、わずか4.6%にとどまる実態を紹介。避難生活の場として「自宅で過ごしたい」という希望と、自宅の備えの実態との隔たり『在宅避難の壁』が浮き彫りになったことを説明しました。一方で、木村氏は「ある程度備えがある」と回答した人は48.0%に上ることに着目。「ゼロから全てを完璧に備える必要はありません。すでにできている備えにまず気づき、一つずつ足していくことが大切。」と解説しました。 |
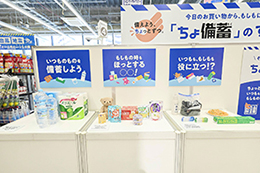
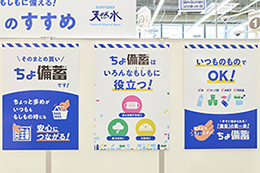
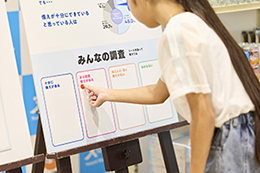
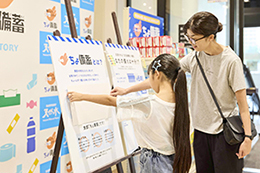
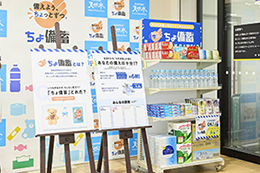
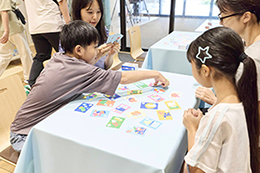
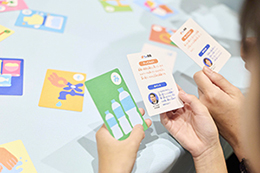

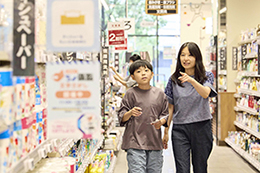
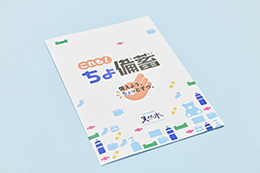
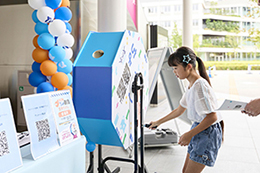
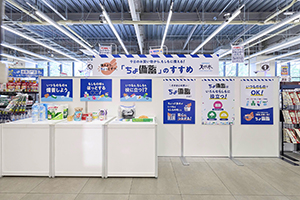
 名称:「サントリー天然水 防災備蓄イベント“これも!ちょ備蓄アクション”」 開催日時:2026年8月27日(木)~8月29日(土)11:00~18:00 開催会場:サミットストア ららテラス HARUMI FLAG店(東京都中央区晴海5丁目2-31) 参加費:無料 対象者(かるた・文字さがし):4~15歳程度のお子様(小学生以下のお子様は、保護者の同伴が必要です) 体験コンテンツ: ①「これも!ちょ備蓄」展示 ②「ちょ備蓄かるた」(※非売品) ③「これも!ちょ備蓄 文字さがし」 景品:かるた・文字さがしの参加者には、先着で、協力企業の商品を含む「ちょ備蓄」アイテムがもらえる巨大ガラポンにご参加いただけます。 ※かるた・文字さがしはお一人様1回限りの参加とさせていただきます。 |
 旭化成ホームプロダクツ 旭化成ホームプロダクツは、サランラップ®やジップロック®など身近な商品の防災活用を発信し、日常使いを通じた防災啓発に取り組んでいます。「いつも」と「もしも」をつなぐ考え方が「ちょ備蓄」の理念と一致することから、本プロジェクトに参加しました。 |
 味の素(株) 味の素(株)は備蓄した食品を定期的に消費し、食べた分だけ買い足していく「ローリングストック法」をおすすめしております。「味の素KKおかゆ」は、レトルトパウチなので持ち運びやすく、温めなくてもお召し上がりいただけます。「ローリングストック法」の推進の一環として「ちょ備蓄」プロジェクトに協力しています。 |
 サミット サミットは、定期的に「備災セール」を実施しており、備えておくと安心な商品の販売の他、備災に役立つ情報を記載したリーフレットを配布しています。日々の買い物の中で「もしもの時に備える」という考え方に賛同し、本プロジェクトに参加しています。 |
 大王製紙 ティシューやトイレットペーパーなどの紙製品は、災害時の衛生環境を支える重要な生活必需品です。エリエールでは、防災セット「やさしさストック」を通じて、日頃から使いながら備えるローリングストックの考え方を提案してきました。日常の延長で無理なく備える「ちょ備蓄」の考え方に共感し、本プロジェクトに賛同しました。 |
 はごろもフーズ はごろもフーズが販売する缶詰・レトルトパウチ製品は、常温で長期保存が可能な食品です。もしもの備えのために少し多めに購入し、普段使いしながら減った分を買い足す「ローリングストック法」をラジオ、ホームページなどで発信しています。「ローリングストック法」の更なる推進のため、「ちょ備蓄」に賛同致しました。 |
 森永製菓 森永製菓は、いつも食べている「食やお菓子」の持つちからを通じて、身近で実践的な防災のかたちを社会へ広く発信し、お客様一人ひとりの防災意識向上に貢献してまいります。普段食べている商品のちょっとした活用アイディアが、もしもの時の備えにつながるという「ちょ備蓄」の考え方に賛同し、本企画に参画しました。 |
 ロッテ “防災意識を少しでも身近に感じてほしい”という思いに大変共感し、一緒に取り組みさせていただきたいと思いました。日常から親しみのあるガムやチョコレートなどの“お菓子”を通じ、家族の防災意識向上に少しでもお役に立てれば幸いです。 |
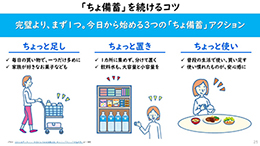
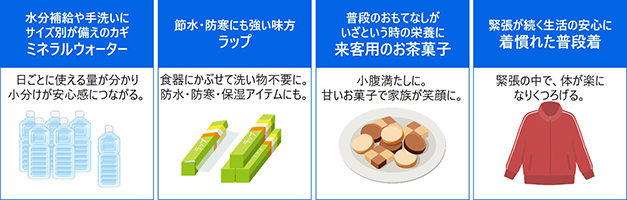
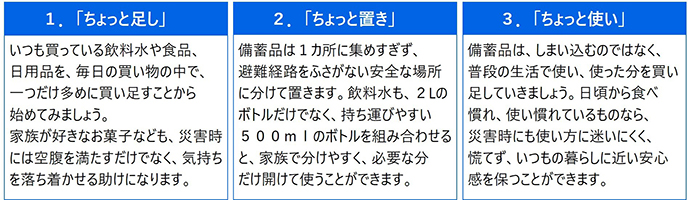
 「ちょ備蓄」プロジェクトは「サントリー天然水」の防災備蓄啓発活動です。備蓄への心理的ハードルや固定観念をなくし、“できることを、いつもを、ちょっとずつ”始めることから、もしもの備えにつなげていくという提案です。 |
 「いつも使っているものをちょっと多めに買っておく」「子どもが好きなお菓子をちょっと買い足しておく」「おうちのちょっとしたスペースも備蓄に有効活用してみる」など、ちょっと意識を変えるだけで、日常の行動が備えにつながり、それを継続することでもしもの時にも自分や大切な人を守り、社会の混乱も防ぐ力につながると考えています。 |
 |
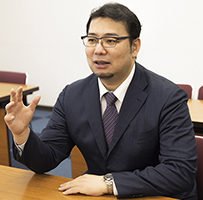 木村 玲欧(きむら れお)氏 兵庫県立大学環境人間学部・大学院環境人間学研究科教授。専門は防災心理学、防災教育学、社会調査法。内閣府 防災教育チャレンジプラン実行委員会委員長などを務める。著書多数。 |
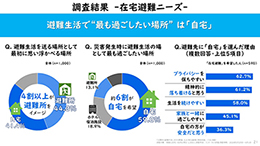
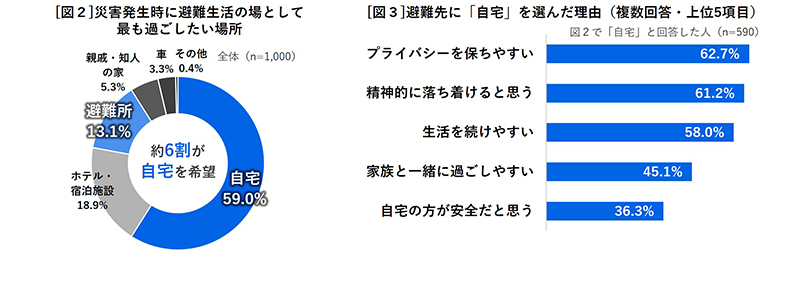
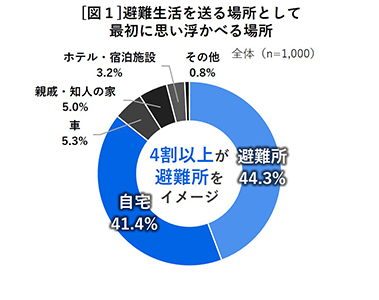 ◇災害発生後の避難生活の場として、“最初に思い浮かべる場所”の最多は「避難所」(44.3%)の一方で、避難生活で“最も過ごしたい場所”の最多は「自宅」で、約6割(59.0%)に。 「在宅避難」の選択理由は、心理的な安心感や住み慣れた生活環境 回答者に、災害発生後に避難生活を送る場所として“最初に思い浮かべる場所”を聞いたところ、「避難所」(44.3%)が最も多く、次いで「自宅」(41.4%)という結果となりました[図1]。 次に、避難生活を送る場として、“最も過ごしたい場所”を尋ねたところ、「自宅」と回答した人が、約6割(59.0%)と最も多く、「避難所」(13.1%)を大きく上回る結果となりました[図2]。 “最も過ごしたい場所”に「自宅」を選んだ人にその理由を尋ねると、「プライバシーを保ちやすい」(62.7%)、「精神的に落ち着けると思う」(61.2%)、「生活を続けやすい」(58.0%)が上位に挙げられ、心理的な安心感や住み慣れた生活環境を理由に「在宅避難」を望む人が多いことが分かりました[図3]。 *
 |
 「ちょ備蓄」は「サントリー天然水」の防災備蓄啓発活動です。備蓄への心理的ハードルや固定観念をなくし、“できることを、いつもを、ちょっとずつ”始めることから、もしもの備えにつなげていくという提案です。 |
 「いつも使っているものをちょっと多めに買っておく」「子どもが好きなお菓子をちょっと買い足しておく」「おうちのちょっとしたスペースも備蓄に有効活用してみる」など、ちょっと意識を変えるだけで、日常の行動が備えにつながり、それを継続することでもしもの時にも自分や大切な人を守り、社会の混乱も防ぐ力につながると考えています。 |

Prompts
Click prompts to add them under the company line, click again to take one out, then copy the result into your AI chat. Shared by Asian Century Stocks and Uncovered Thai Stocks. Thank you.
Suntory Beverage & Food Limited (ticker 2587), listed in Japan.
Copied
ETFs Holding Suntory Beverage & Food Limited
Exchange-traded funds whose newest published daily portfolio holds one of the company's listings, largest weight first.
| ETF | Weight in ETF | Shares | Market value | As of |
|---|---|---|---|---|
| IVAL | 2.31% | 149,982 | $ 5.08M | Nov 18, 2026 |
| DSTX | 0.75% | 12,800 | $ 354.171K | Jun 30, 2026 |
| AVIV | 0.09% | 53,700 | $ 1.819M | Nov 16, 2026 |
| DFIV | 0.09% | 626,500 | $ 20.045M | Nov 12, 2026 |
| AVDE | 0.03% | 146,200 | $ 4.952M | Nov 16, 2026 |
| DXIV | 0.02% | 1,600 | $ 51.192K | Nov 12, 2026 |
| DFAI | 0.02% | 117,400 | $ 3.756M | Nov 12, 2026 |
| DFIC | 0.01% | 69,300 | $ 2.217M | Nov 12, 2026 |
| DFSI | 0.01% | 4,200 | $ 134.379K | Nov 12, 2026 |
| AVSD | 0.01% | 800 | $ 27.099K | Nov 16, 2026 |
| DFAX | 0.01% | 33,500 | $ 1.072M | Nov 12, 2026 |