自己株券買付状況報告書(法24条の6第1項に基づくもの)
Bull 0
Bear 0
Routine
2533
|
Oenon Holdings, Inc. is a diversified Japanese group operating in the alcoholic beverages, enzyme pharmaceuticals, and real estate sectors. Its primary business involves the manufacturing and sales of shochu, chu-hi, sake, synthetic sake, plum wine, and Western spirits, with production and distribution handled by subsidiaries including Dowa Seishu, Fukutokuchou Shurui, Akita Ken Hakkou Kogyo, Oenon Product Support, and Waco. The group also provides transport and cargo handling services through Go-Tech. In the enzyme pharmaceutical segment, Dowa Seishu manufactures and sells enzymes and diagnostic reagents while offering contract fermentation services. The real estate division, managed by the parent company and subsidiaries such as Oenon Asset Corporation, engages in the trading and leasing of properties. Summarised from the annual report, fiscal year ended Dec 2025 |
Industry Beverages - Non-Alcoholic | Homepage oenon.jp |
| Sector Consumer Defensive | IR page oenon.jp | |
|
Tags
shochu, chu-hi, sake, plum wine, western spirits, enzyme pharmaceuticals, diagnostic reagents, contract fermentation, real estate leasing, cargo handling, Dowa Seishu, Fukutokuchou Shurui, Akita Ken Hakkou Kogyo, Oenon Product Support, Waco, Go-Tech, Oenon Asset Corporation
|
Press page oenon.jp/news |
Metrics
| Valuation | |
|---|---|
| Market cap | ¥ 31.875B |
| Market cap (USD) | $ 199.721M |
| P/E | 8.61 |
| PEG | — |
| P/BV | 1.12 |
| P/S | 0.36 |
| P/OCF | 8.93 |
| P/FCF | 17.25 |
| Dividend yield | 2.3% |
| Turnover / mcap | — |
| Returns | |
|---|---|
| ROE | 12.1% |
| ROI | 10.5% |
| ROIC | 10.4% |
| Profit margin | 3.5% |
| Growth | |
|---|---|
| Revenue growing | Yes |
| Profits growing | No |
| Revenue up 3y | No |
| Revenue up 5y | No |
| Earnings growth 3y (net profit CAGR) | — |
| Quality | |
|---|---|
| Profitable | Yes |
| Margin expanding | Yes |
| Buying back stock | No |
| Diluting (TTM) | No |
| Debt/Equity | — |
| Podcast bulls (TTM) | Sign up |
| Podcast bears (TTM) | Sign up |
| Podcast sentiment (TTM) | Sign up |
| Podcast sentiment % (TTM) | Sign up |
| News sentiment (TTM) | 0 |
| Quality score | 22.2% |
| Insiders | |
|---|---|
| Buys, 1w | Sign up |
| Buys, 1m | Sign up |
| Buys, 1y | Sign up |
| Sells, 1w | Sign up |
| Sells, 1m | Sign up |
| Sells, 1y | Sign up |
Sign up to see this company's insider trades
| Figure | FY 2025 | FY 2024 | FY 2023 | FY 2022 | FY 2021 | FY 2020 | FY 2019 | FY 2018 | FY 2017 | FY 2016 | FY 2015 | FY 2014 | FY 2013 | FY 2012 |
|---|---|---|---|---|---|---|---|---|---|---|---|---|---|---|
| Revenue | 87.63B | 84.104B | 84.947B | 81.12B | 78.618B | 77.712B | 75.444B | 77.151B | 78.739B | 79.212B | 82.325B | 84.186B | 85.799B | 85.367B |
| Net profit | 3.102B | 2.729B | 3.393B | -1.257B | 299M | 1.147B | 1.104B | 469M | 1.263B | 610M | 237M | 60M | 1.128B | 1.251B |
| Free cash flow | 1.848B | 3.219B | 3.735B | -4.794B | -1.051B | 1.12B | 1.582B | 798M | 1.19B | 2.509B | 1.939B | — | — | — |
| Figure | FY 2025 | FY 2024 | FY 2023 | FY 2022 | FY 2021 | FY 2020 | FY 2019 | FY 2018 | FY 2017 | FY 2016 | FY 2015 | FY 2014 | FY 2013 | FY 2012 |
|---|---|---|---|---|---|---|---|---|---|---|---|---|---|---|
| Share price | 509.26 | 393.8 | 354.43 | 256.41 | 360.23 | 410.23 | 396.91 | 347.15 | 370.32 | 259.35 | 223.86 | 215.92 | 244.37 | 197.48 |
| Price performance 12m | 0.29 | 0.11 | 0.38 | -0.29 | -0.12 | 0.03 | 0.14 | -0.06 | 0.43 | 0.16 | 0.04 | -0.12 | 0.24 | — |
Filed figures
Lines the statements and their notes report beside the headline figures, read from the filings' XBRL as filed (no restatement applied), with figures computed from one filing's own lines. Cash-flow lines carry their cash direction: an outflow is negative. Each period links to its filing; a figure's period, report date and tag are in its tooltip.
| Figure | Dec 2016 | Dec 2017 | Dec 2018 | Dec 2019 | Dec 2020 | Dec 2021 | Dec 2022 | Dec 2023 | Dec 2024 | Dec 2025 |
|---|---|---|---|---|---|---|---|---|---|---|
| Balance sheet detail | ||||||||||
| Trade receivables (JPY) | 19.8B | 20.5B | 18.7B | 17B | 16.9B | 16.3B | 17B | 16.8B | 16.7B | 19.7B |
| ↳ YoY growth | -9.6% | +3.4% | -8.8% | -8.6% | -1.0% | -3.4% | +4.1% | -1.2% | -0.1% | +17.9% |
| ↳ 5y CAGR | -5.1% | -3.8% | -3.7% | -2.1% | -0.4% | +3.2% | ||||
| Borrowings, current (JPY) | 3.06B | 3.1B | 3.55B | 1.05B | 1.05B | 3.7B | 6.95B | 3.2B | 1.85B | 1.95B |
| Borrowings, non-current (JPY) | 1.6B | 800M | — | 1.5B | 750M | — | 2.4B | 1.8B | 1.2B | 600M |
| Lease liabilities (JPY) | 66M | 82M | 48M | 26M | 142M | 92M | 74M | 75M | 109M | 193M |
| Cash and deposits (JPY) | 1.89B | 1.33B | 1.25B | 1.2B | 915M | 990M | 899M | 828M | 887M | 884M |
| Intangible assets (JPY) | 598M | 470M | 481M | 406M | 248M | 298M | 554M | 508M | 429M | 314M |
| Net debt (borrowings + leases - cash) (JPY) | 2.84B | 2.65B | 2.35B | 1.38B | 1.03B | 2.8B | 8.53B | 4.25B | 2.27B | 1.86B |
| Cash flow detail | ||||||||||
| Operating cash flow (JPY) | 3.22B | 3.12B | 3.74B | 3.93B | 4.76B | 1.55B | -860M | 4.61B | 4.28B | 3.57B |
| Purchases of property, plant and equipment (JPY) | -715M | -1.93B | -2.94B | -2.35B | -3.64B | -2.6B | -3.93B | -871M | -1.06B | -1.72B |
| Change in receivables (cash effect) (JPY) | 2.1B | -662M | 1.8B | 1.61B | 177M | 574M | -660M | -817M | 20M | -2.99B |
| Change in inventories (cash effect) (JPY) | 317M | 11M | 438M | -66M | -280M | -358M | -720M | -1.26B | 97M | -157M |
| Change in payables (cash effect) (JPY) | -399M | 314M | -598M | 342M | -423M | 282M | 502M | 201M | -183M | 553M |
| Dividends paid (cash effect) (JPY) | -439M | -434M | -425M | -426M | -425M | -419M | -438M | -294M | -470M | -576M |
| Share buybacks (cash effect) (JPY) | -1M | -141M | 0.00 | -78M | -306M | 0.00 | -349M | -87M | -462M | -503M |
| Interest paid (cash effect) (JPY) | -125M | -102M | -86M | -68M | -65M | -59M | -73M | -87M | -94M | -125M |
| Income taxes paid (cash effect) (JPY) | -819M | -558M | -254M | -454M | -313M | -758M | 37M | -219M | -895M | -976M |
| Operating cash flow before change in receivables (JPY) | 1.12B | 3.78B | 1.94B | 2.32B | 4.59B | 976M | -200M | 5.42B | 4.26B | 6.56B |
| Free cash flow (OCF - PPE - intangibles) (JPY) | 2.51B | 1.19B | 798M | 1.58B | 1.12B | -1.05B | -4.79B | 3.74B | 3.22B | 1.85B |
| Income detail | ||||||||||
| Research and development expense (JPY) | 470M | 506M | 524M | 511M | 515M | 538M | 416M | 453M | 523M | 591M |
| ↳ 5y CAGR | +1.6% | +2.7% | -3.8% | -2.9% | +0.5% | +2.8% | ||||
| Total comprehensive income (JPY) | 717M | 1.27B | 335M | 1.28B | 987M | 399M | -1.65B | 3.91B | 3.19B | 3.51B |
| Comprehensive income to owners (JPY) | 638M | 1.27B | 318M | 1.21B | 942M | 437M | -1.46B | 3.9B | 3.19B | 3.54B |
| Reported | Mar 23, 2018 | Mar 23, 2018 | Mar 22, 2019 | Mar 23, 2020 | Mar 23, 2021 | Mar 23, 2022 | Mar 22, 2023 | Mar 22, 2024 | Mar 24, 2025 | Mar 19, 2026 |
Sign up to see institutional holdings
Sign UpPodcast Mentions
Sign up to see podcast mentions and sentiment
Sign UpTimely disclosures published on TDnet, newest first, titles as filed in Japanese. The link opens the disclosure on TDnet. Filings with EDINET (periodic reports, extraordinary reports, offerings, holding and buy-back reports), newest first, titles as filed in Japanese. The link opens the filing on EDINET. Press releases from the company's own website, newest first.
2026年12月期 第3四半期決算短信〔日本基準〕(連結)
Bull 1
Bear 0
Results
日常に
Bull 1
Bear 0
Product/operations
ページ内を移動するためのリンクです
ここからサイト内主要メニューです


-
商品カテゴリー 一覧
 ブランドサイト一覧


 下町オエノン物語
 お酒のおいしい飲み方・楽しみ方
 乙類・甲類・混和焼酎の違い
 日本酒ができるまで
 おいしいマリアージュ
 洋酒で広がるお菓子のレシピ
 手作り果実酒の作り方&レシピ
 手作り梅酒の作り方&レシピ
 企業理念・ポリシー
 ごあいさつ
 会社概要
 事業紹介
 沿革
 個人投資家の皆様へ
-
日常に"華"を添える焼酎「博多の華」シリーズの「博多の華 The Dry」「博多の華 The Rich」がリニューアル! それぞれの個性をより際立たせた味わいと新デザインへ刷新
ここから本文です
ニュースリリース
日常に"華"を添える焼酎「博多の華」シリーズの「博多の華 The Dry」「博多の華 The Rich」がリニューアル! それぞれの個性をより際立たせた味わいと新デザインへ刷新
Dryの「キレ」、Richの「コク」、さらに極まる!シュリンクレスでエコに進化
2026年11月4日
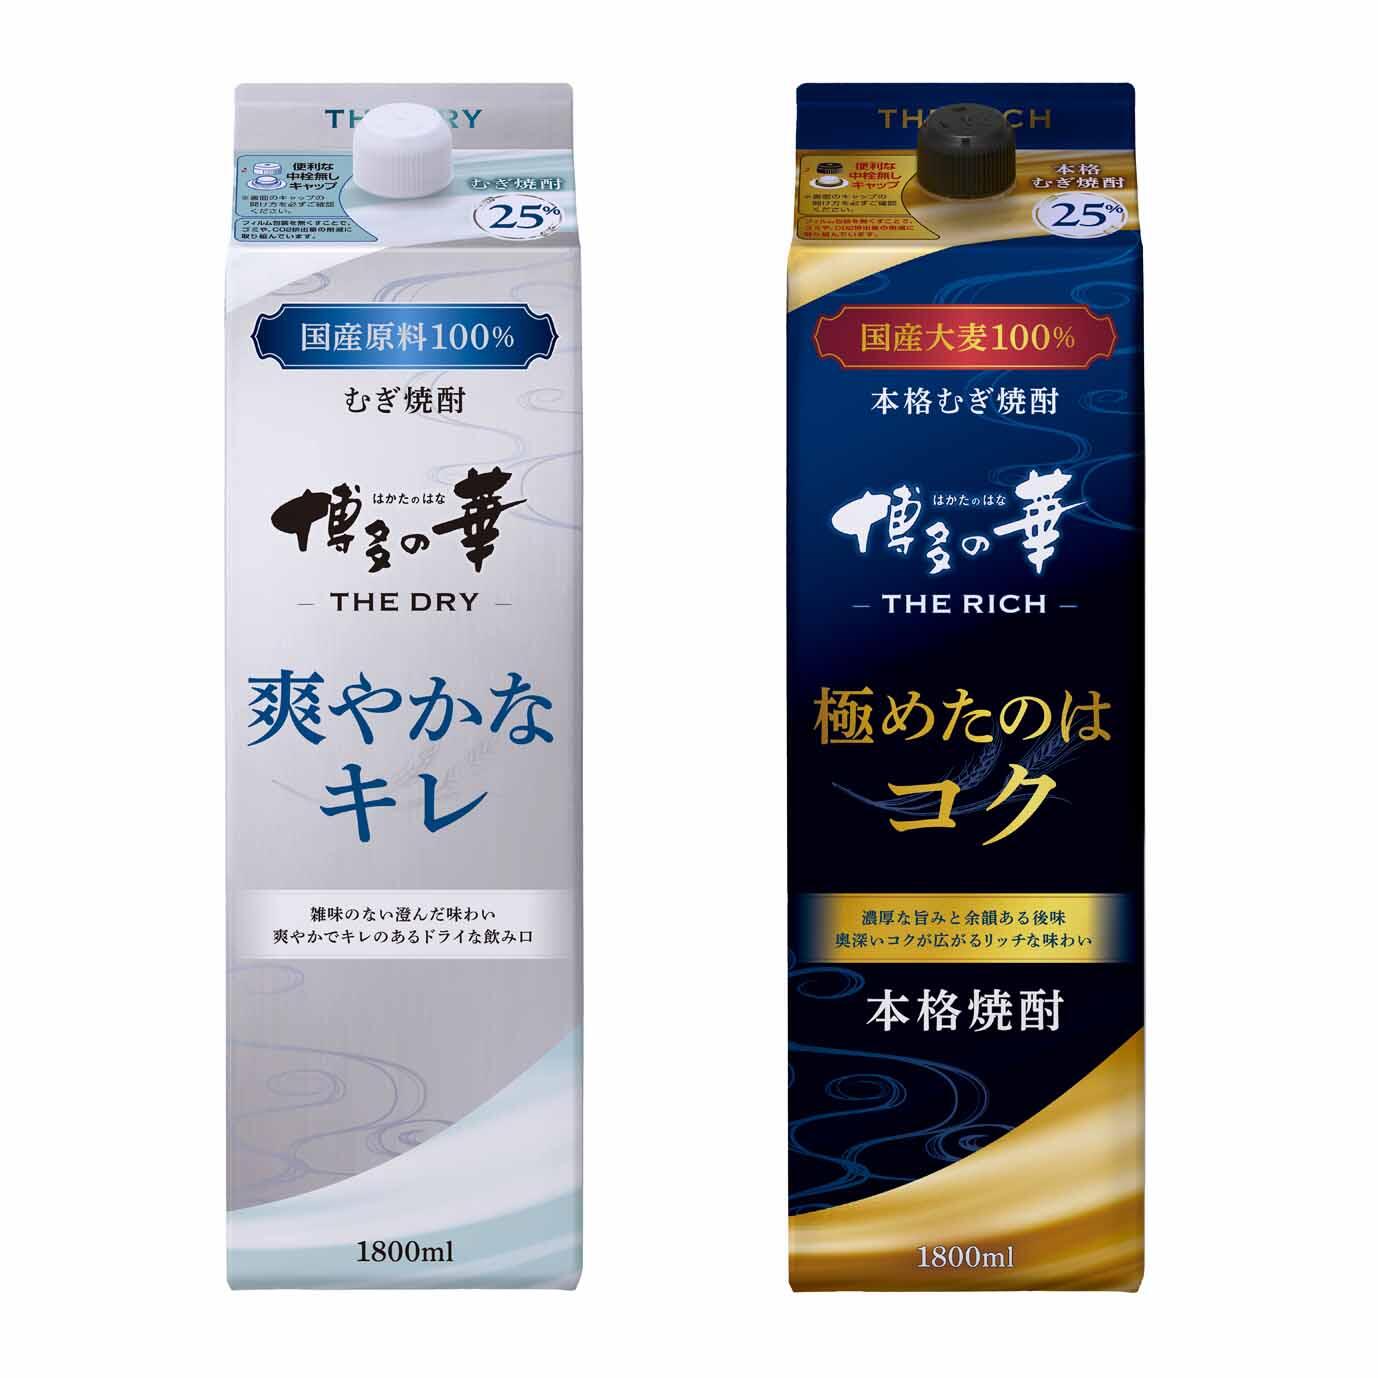
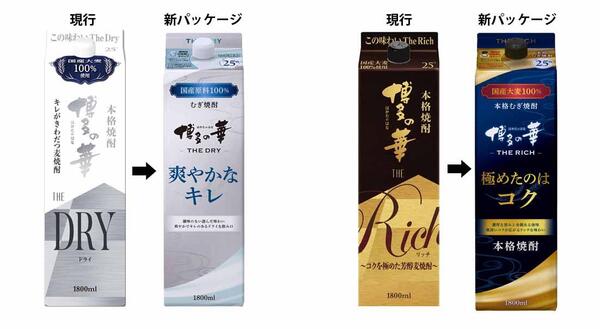
オエノングループの福徳長酒類株式会社(代表取締役社長:大原孝浩 本社:千葉県松戸市 以下、同社)は、日常に“華”を添える焼酎「博多の華」シリーズの「博多の華 The Dry」「博多の華 The Rich」の味わいとデザインをリニューアルし、フィルム包装なしのシュリンクレス・パッケージにて、2026年11月中旬より順次、全国でリニューアル発売します。
「博多の華 The Dry」は、麦原酒の雑味を丁寧に取り除いて仕上げた、爽やかなキレとドライな飲み口が特長のむぎ焼酎です。今回のリニューアルでは、隠し味としてミント焼酎をブレンドし、清涼な爽快感とキレのある後味を引き立てました。パッケージデザインは、味わいの核心である『爽やかなキレ』のフレーズをメインに配置しました。
「博多の華 The Rich」は、黒麹仕込みの常圧蒸留酒をベースに使用し、深みのある香ばしさとコクを極めたリッチな味わいに仕上げた本格むぎ焼酎です。今回のリニューアルでは、隠し味として樫樽に貯蔵したむぎ焼酎をブレンドすることで、ほのかな甘みとまろやかな味わい、奥深いコクを引き立てました。パッケージデザインは、味わいの核心である『極めたのはコク』のフレーズをメインに配置しました。
「博多の華 The Dry」「博多の華 The Rich」ともに、国産大麦を100%使用したシリーズです。このたび、それぞれの個性をより際立たせた味わいと、一目で特長がメインメッセージとして伝わるデザインへリニューアルしました。さらに、フィルム包装なしのシュリンクレス・パッケージとすることで、味わい、デザイン、環境配慮のすべてにおいて進化を遂げた商品へと生まれ変わりました。
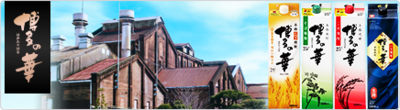
「博多の華」シリーズは、多くのお客様に長く愛され続けている同社を代表する焼酎ブランドです。「博多の華 The Dry」「博多の華 The Rich」の他、「博多の華 むぎ」「博多の華 そば」「博多の華 こめ」「博多の華 いも」など、幅広いラインアップをそろえ、皆様にご愛顧いただいています。
このたび、「博多の華 The Dry」「博多の華 The Rich」の味わいとデザイン、及びシュリンクレス・パッケージにリニューアルすることで、時代に寄り添う新たな価値を創造しながら焼酎ファンのニーズにお応えするとともに、これからも“華”を添える存在として進化し続けてまいります。
博多の華 The Dry
| 商品名 | 博多の華 The Dry |
| 品目 | 焼酎乙類 |
| アルコール分 | 25% |
| 内容量・容器 | 1,800ml ・ 紙パック |
| 荷姿 | 6本入りダンボール |
| 参考小売価格 | 2,073円(税抜き) |
| 発売日 | 2026年11月中旬より順次 |
| 発売地域 | 全国 |
博多の華 The Rich
| 商品名 | 博多の華 The Rich |
| 品目 | 焼酎乙類 |
| アルコール分 | 25% |
| 内容量・容器 | 1,800ml ・ 紙パック |
| 荷姿 | 6本入りダンボール |
| 参考小売価格 | 2,073円(税抜き) |
| 発売日 | 2026年11月中旬より順次 |
| 発売地域 | 全国 |
【博多の華 The Dry商品ページ】
https://www.oenon.jp/product/shochu/mugi/hakatanohana-mugi-sukkiri-thedry-25-pack.html
【博多の華 The Rich商品ページ】
https://www.oenon.jp/product/shochu/mugi/hakatanohana-mugi-kokubukai-therich-25-pack.html
【博多の華 ブランドサイト】
https://www.oenon.jp/hakatanohana/
Previous







Next
ここからフッター情報です

オエノングループ公式SNS


Copyright©OENON Holdings, Inc. All Rights Reserved.
お酒は適量を。お酒は20歳になってから。飲酒運転は法律で禁止されています。
のんだあとはリサイクル。妊娠中や授乳期の飲酒は、胎児・乳児の発育に悪影響を与えるおそれがあります。
Cookieの使用について
当ウェブサイトでは、ご覧いただく皆様に、より快適にウェブサイトをご利用いただくため、Cookieを利用しております。当ウェブサイトをご覧いただく際は、Cookieの使用についてご同意いただきますようお願いします。Cookieに関する情報や設定については「詳細を見る」よりご確認いただけます。
同意する

Prompts
Click prompts to add them under the company line, click again to take one out, then copy the result into your AI chat. Shared by Asian Century Stocks and Uncovered Thai Stocks. Thank you.
Oenon Holdings, Inc. (ticker 2533), listed in Japan.
Copied
ETFs Holding Oenon Holdings, Inc.
Exchange-traded funds whose newest published daily portfolio holds one of the company's listings, largest weight first.
| ETF | Weight in ETF | Shares | Market value | As of |
|---|---|---|---|---|
| DFIS | 0.00% | 54,100 | $ 161.048K | Nov 12, 2026 |
| DISV | 0.00% | 23,300 | $ 69.361K | Nov 12, 2026 |
| DFIC | 0.00% | 56,300 | $ 167.597K | Nov 12, 2026 |
| DFAX | 0.00% | 26,500 | $ 78.887K | Nov 12, 2026 |
| DFSI | 0.00% | 2,200 | $ 6,549.09 | Nov 12, 2026 |
| DXIV | 0.00% | 300 | $ 893.06 | Nov 12, 2026 |
| DFAI | 0.00% | 10,900 | $ 32.448K | Nov 12, 2026 |
| AVDS | 0.00% | 800 | $ 2,397.07 | Nov 16, 2026 |