2026年12月期第3四半期決算短信〔IFRS〕(連結)
Bull 2
Bear 0
Results
|
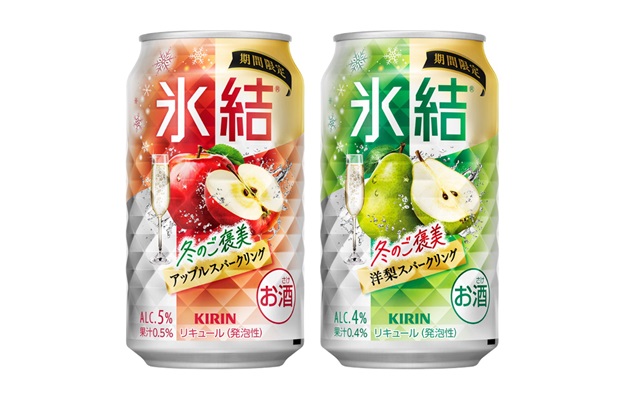
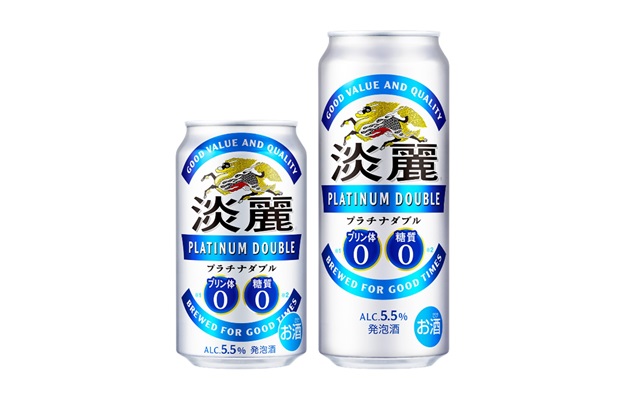
Kirin Holdings Company, Limited is a pure holding company that oversees a diversified group of 164 consolidated subsidiaries and 26 equity-method affiliates. The group operates across four primary business segments: alcoholic beverages, non-alcoholic beverages, pharmaceuticals, and health sciences. In the alcoholic beverages segment, the company manufactures and sells beer and low-alcohol drinks in Japan through Kirin Brewery Co., Ltd., and in Oceania and North America through Lion Pty Ltd. The non-alcoholic beverages segment involves the production and sale of soft drinks in Japan via Kirin Beverage Co., Ltd. and Coca-Cola products in the United States through Coca-Cola Beverages Northeast, Inc. The pharmaceutical segment focuses on the manufacturing and sales of medicines globally, primarily through Kyowa Kirin Co., Ltd. The health sciences segment includes the research, development, and sale of cosmetics and health foods in Japan through Fancl Corporation, and nutritional supplements in Australia, Southeast Asia, and China through Blackmores Limited. Summarised from the annual report, fiscal year ended Dec 2025 |
Industry Beverages - Brewers | Homepage kirinholdings.com/jp |
| Sector Consumer Defensive | IR page kirinholdings.com/jp | |
|
Tags
beer, low-alcohol beverages, soft drinks, coca-cola products, pharmaceuticals, cosmetics, health foods, nutritional supplements, craft beer, Kirin Brewery Co. Ltd., Lion Pty Ltd, Kirin Beverage Co. Ltd., Coca-Cola Beverages Northeast Inc., Kyowa Kirin Co. Ltd., Fancl Corporation, Blackmores Limited
|
Press page kirinholdings.com/jp/newsroom |
Metrics
| Valuation | |
|---|---|
| Market cap | ¥ 2.299T |
| Market cap (USD) | $ 14.433B |
| P/E | 11.78 |
| PEG | 1.18 |
| P/BV | 1.39 |
| P/S | 0.91 |
| P/OCF | 7.78 |
| P/FCF | 19.19 |
| Dividend yield | 2.6% |
| Turnover / mcap | — |
| Returns | |
|---|---|
| ROE | 9.4% |
| ROI | 9.2% |
| ROIC | 9.8% |
| Profit margin | 6.1% |
| Growth | |
|---|---|
| Revenue growing | Yes |
| Profits growing | Yes |
| Revenue up 3y | Yes |
| Revenue up 5y | No |
| Earnings growth 3y (net profit CAGR) | 9.9% |
| Quality | |
|---|---|
| Profitable | Yes |
| Margin expanding | Yes |
| Buying back stock | No |
| Diluting (TTM) | No |
| Debt/Equity | — |
| Podcast bulls (TTM) | Sign up |
| Podcast bears (TTM) | Sign up |
| Podcast sentiment (TTM) | Sign up |
| Podcast sentiment % (TTM) | Sign up |
| News sentiment (TTM) | 10 |
| Quality score | 26.3% |
| Insiders | |
|---|---|
| Buys, 1w | Sign up |
| Buys, 1m | Sign up |
| Buys, 1y | Sign up |
| Sells, 1w | Sign up |
| Sells, 1m | Sign up |
| Sells, 1y | Sign up |
Sign up to see this company's insider trades
| Figure | FY 2025 | FY 2024 | FY 2023 | FY 2022 | FY 2021 | FY 2020 | FY 2019 | FY 2018 | FY 2017 | FY 2016 | FY 2015 | FY 2014 | FY 2013 | FY 2012 |
|---|---|---|---|---|---|---|---|---|---|---|---|---|---|---|
| Revenue | 2.433T | 2.338T | 2.134T | 1.989T | 1.822T | 1.85T | 1.941T | 1.931T | 1.971T | 2.075T | 2.197T | 2.196T | 2.255T | 2.186T |
| Net profit | 147.542B | 58.214B | 112.697B | 111.007B | 59.79B | 71.935B | 59.642B | 164.202B | 128.627B | 118.158B | -47.329B | 32.392B | 85.656B | 56.198B |
| Free cash flow | 119.836B | 62.26B | 89.396B | 37.083B | 132.968B | 71.813B | 82.429B | — | — | 131.437B | 93.895B | — | — | — |
| Figure | FY 2025 | FY 2024 | FY 2023 | FY 2022 | FY 2021 | FY 2020 | FY 2019 | FY 2018 | FY 2017 | FY 2016 | FY 2015 | FY 2014 | FY 2013 | FY 2012 |
|---|---|---|---|---|---|---|---|---|---|---|---|---|---|---|
| Share price | 2.348K | 2.049K | 2.066K | 2.011K | 1.847K | 2.434K | 2.39K | 2.298K | 2.841K | 1.901K | 1.497K | 1.497K | 1.513K | 1.012K |
| Price performance 12m | 0.15 | -0.01 | 0.03 | 0.09 | -0.24 | 0.02 | 0.04 | -0.19 | 0.49 | 0.27 | 0 | -0.01 | 0.49 | — |
Filed figures
Lines the statements and their notes report beside the headline figures, read from the filings' XBRL as filed (no restatement applied), with figures computed from one filing's own lines. Cash-flow lines carry their cash direction: an outflow is negative. Each period links to its filing; a figure's period, report date and tag are in its tooltip.
| Figure | Dec 2016 | Dec 2017 | Dec 2018 | Dec 2019 | Dec 2020 | Dec 2021 | Dec 2022 | Dec 2023 | Dec 2024 | Dec 2025 |
|---|---|---|---|---|---|---|---|---|---|---|
| Balance sheet detail | ||||||||||
| Trade receivables (JPY) | 394B | — | 405B | 396B | 372B | 388B | 409B | 445B | 503B | 536B |
| ↳ YoY growth | -1.1% | -2.3% | -5.9% | +4.2% | +5.5% | +8.7% | +13.0% | +6.5% | ||
| ↳ 5y CAGR | +1.9% | +4.9% | +7.6% | |||||||
| Borrowings, current (JPY) | 135B | — | 97.1B | 240B | 249B | 102B | 114B | 101B | 78B | 81B |
| Borrowings, non-current (JPY) | 514B | — | 318B | 291B | 394B | 450B | 409B | 556B | 780B | 842B |
| Bonds payable (JPY) | 195B | — | — | — | — | — | — | — | — | — |
| Cash and deposits (JPY) | 57.7B | 155B | 173B | 166B | 162B | 149B | 88.1B | 131B | 119B | 125B |
| Intangible assets (JPY) | 402B | — | 180B | 169B | 209B | 196B | 201B | 304B | 660B | 695B |
| Net debt (borrowings + leases - cash) (JPY) | 590B | — | 242B | 365B | 481B | 402B | 435B | 525B | 739B | 798B |
| Cash flow detail | ||||||||||
| Operating cash flow (JPY) | 226B | 201B | 198B | 179B | 165B | 219B | 136B | 203B | 243B | 295B |
| Purchases of property, plant and equipment (JPY) | -95B | — | -87.9B | -96.4B | -93B | -86.3B | -98.5B | -114B | -181B | -176B |
| Change in receivables (cash effect) (JPY) | 3.04B | — | -15.2B | 6.18B | 3.78B | -9.11B | -8.46B | -13.4B | -34.9B | -33.3B |
| Change in inventories (cash effect) (JPY) | 14.8B | — | -16.1B | -17.2B | -6.08B | -20.4B | -39.5B | -20.1B | -4.89B | -1.74B |
| Change in payables (cash effect) (JPY) | -3.38B | — | 5.26B | -8.04B | -1.11B | 3.51B | 18.4B | 11B | 18.2B | 3.1B |
| Dividends paid (cash effect) (JPY) | -34.7B | — | -44.8B | -51.4B | -55.3B | -54.2B | -53.8B | -57.5B | -58.3B | -58.7B |
| Share buybacks (cash effect) (JPY) | -60M | — | -100B | -23.3B | -76.8B | -34M | -50B | -25M | -82M | -19M |
| Interest paid (cash effect) (JPY) | -9.87B | — | -6.04B | -6.4B | -4.79B | -4.15B | -4.37B | -5.44B | -6.52B | -9.88B |
| Income taxes paid (cash effect) (JPY) | -41.8B | — | -39.9B | -37.4B | -54.6B | -29.6B | -68.8B | -36.6B | -50.8B | -33B |
| Operating cash flow before change in receivables (JPY) | 223B | — | 213B | 173B | 161B | 228B | 144B | 217B | 278B | 329B |
| Free cash flow (OCF - PPE - intangibles) (JPY) | 131B | — | 110B | 82.4B | 71.8B | 133B | 37.1B | 89.4B | 62.3B | 120B |
| Income detail | ||||||||||
| Research and development expense (JPY) | 62.9B | — | 58.1B | 66.2B | 64.5B | 69.6B | 74.3B | 84.9B | 116B | 118B |
| ↳ 5y CAGR | +7.9% | +11.9% | +12.9% | |||||||
| Total comprehensive income (JPY) | 54.4B | 299B | 129B | 78.9B | 91.8B | 117B | 220B | 262B | 158B | 228B |
| Comprehensive income to owners (JPY) | 95.4B | 286B | 103B | 54.1B | 64B | 110B | 189B | 214B | 119B | 194B |
| Segments | ||||||||||
| Alcoholic Beverages · Segment revenue (JPY) | — | — | — | — | — | — | — | 1.05T | 1.08T | 1.08T |
| ↳ YoY growth | +3.5% | -0.6% | ||||||||
| Alcoholic Beverages · Segment operating income (JPY) | — | — | — | — | — | — | — | 120B | 124B | 135B |
| Health Science · Segment revenue (JPY) | — | — | — | — | — | — | — | 108B | 179B | 256B |
| ↳ YoY growth | +66.1% | +42.7% | ||||||||
| Health Science · Segment operating income (JPY) | — | — | — | — | — | — | — | -12.5B | -10.9B | 11.1B |
| Japan Beer And Spirits · Segment revenue (JPY) | — | — | 689B | 685B | 653B | 663B | 665B | 687B | — | — |
| ↳ YoY growth | -0.6% | -4.6% | +1.5% | +0.4% | +3.2% | |||||
| Japan Beer And Spirits · Segment operating income (JPY) | — | — | 82.7B | 85.2B | 75.5B | 70.5B | 74.7B | 77.7B | — | — |
| Japan Non Alcoholic Beverages · Segment revenue (JPY) | — | — | 285B | 289B | 254B | 247B | 246B | 258B | — | — |
| ↳ YoY growth | +1.4% | -12.0% | -3.0% | -0.3% | +4.9% | |||||
| Japan Non Alcoholic Beverages · Segment operating income (JPY) | — | — | 23.3B | 26.4B | 21.8B | 21.1B | 18.8B | 16.9B | — | — |
| Non Alcoholic Beverages · Segment revenue (JPY) | — | — | — | — | — | — | — | 519B | 568B | 581B |
| ↳ YoY growth | +9.4% | +2.4% | ||||||||
| Non Alcoholic Beverages · Segment operating income (JPY) | — | — | — | — | — | — | — | 52.4B | 64B | 67.7B |
| Oceania · Segment revenue (JPY) | — | — | — | — | 292B | 216B | 256B | 281B | — | — |
| ↳ YoY growth | -26.0% | +18.3% | +9.8% | |||||||
| Oceania · Segment operating income (JPY) | — | — | — | — | 22.1B | 26.6B | 31.5B | 32.4B | — | — |
| Oceania Integrated Beverages · Segment revenue (JPY) | — | — | 330B | 300B | 292B | — | — | — | — | — |
| ↳ YoY growth | -9.0% | -2.5% | ||||||||
| Oceania Integrated Beverages · Segment operating income (JPY) | — | — | 51.8B | 41.4B | 22.1B | — | — | — | — | — |
| Pharmaceuticals · Segment revenue (JPY) | — | — | 272B | 306B | 318B | 352B | 398B | 442B | 496B | 497B |
| ↳ YoY growth | +12.6% | +4.1% | +10.6% | +13.1% | +11.0% | +12.1% | +0.3% | |||
| Pharmaceuticals · Segment operating income (JPY) | — | — | 50.4B | 55.4B | 59B | 61.2B | 82.5B | 96B | 91.9B | 102B |
| Reported | Mar 29, 2018 | Mar 29, 2018 | Mar 27, 2020 | Mar 27, 2020 | Mar 30, 2022 | Mar 30, 2022 | Mar 30, 2023 | Mar 28, 2025 | Mar 28, 2025 | Mar 27, 2026 |
Sign up to see institutional holdings
Sign UpPodcast Mentions
Sign up to see podcast mentions and sentiment
Sign UpTimely disclosures published on TDnet, newest first, titles as filed in Japanese. The link opens the disclosure on TDnet. Filings with EDINET (periodic reports, extraordinary reports, offerings, holding and buy-back reports), newest first, titles as filed in Japanese. The link opens the filing on EDINET. Press releases from the company's own website, newest first.
自己株券買付状況報告書(法24条の6第1項に基づくもの)
Bull 0
Bear 0
Routine
変更報告書(特例対象株券等)(野村アセットマネジメント株式会社)
Bull 0
Bear 0
Routine

 別ウィンドウで開く






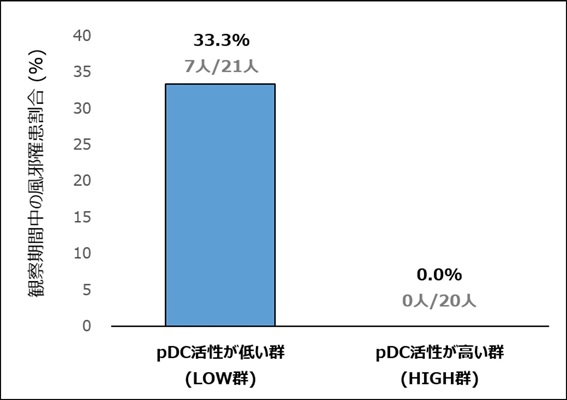
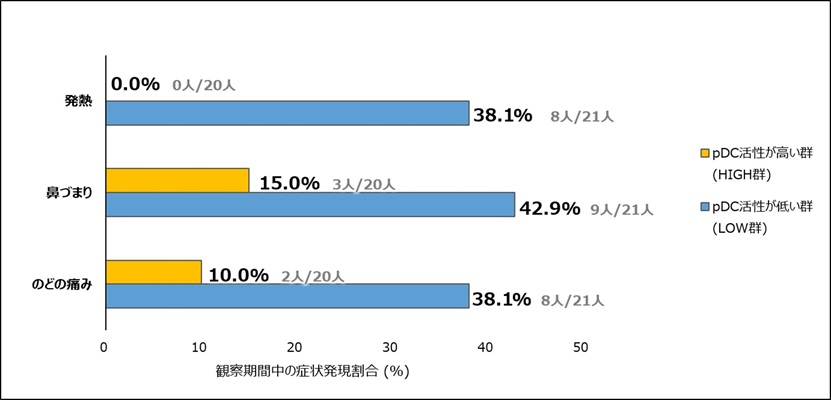
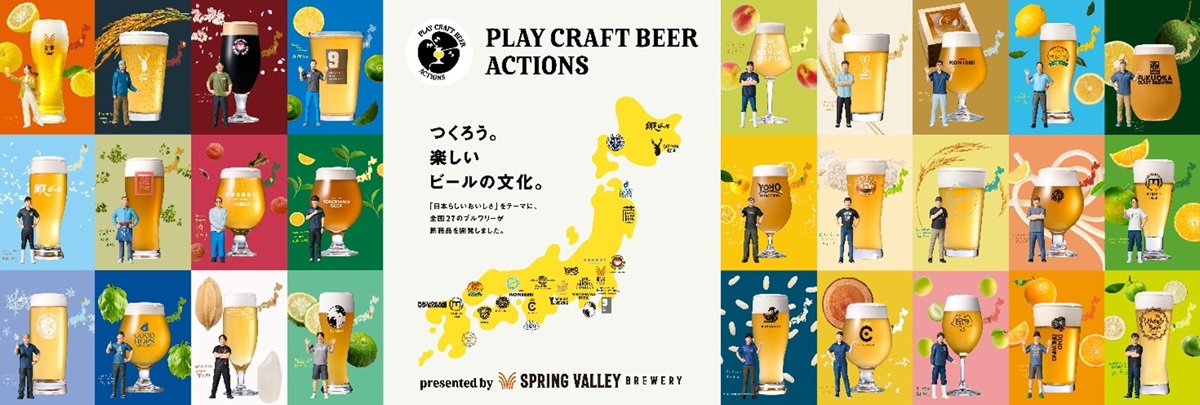
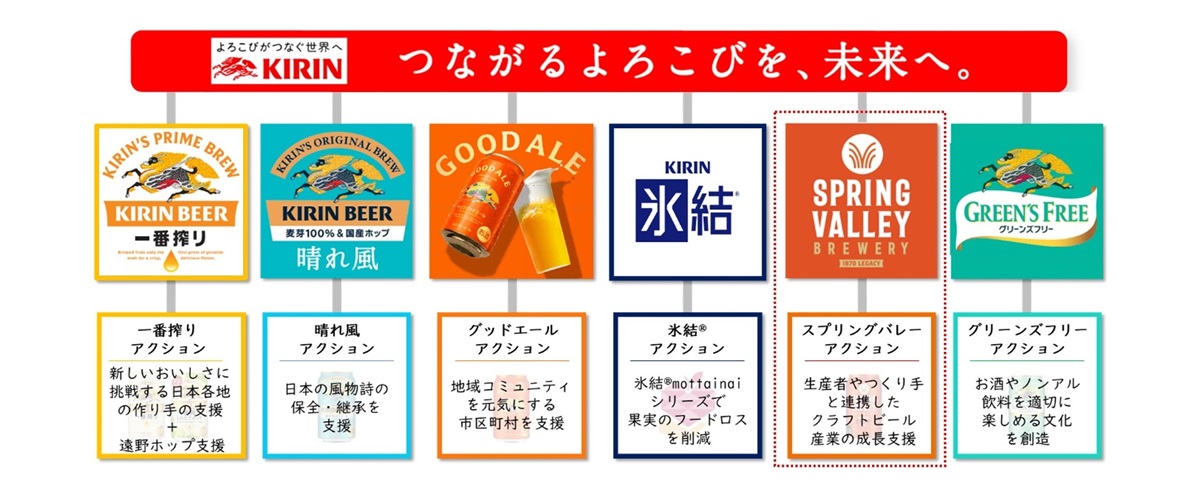
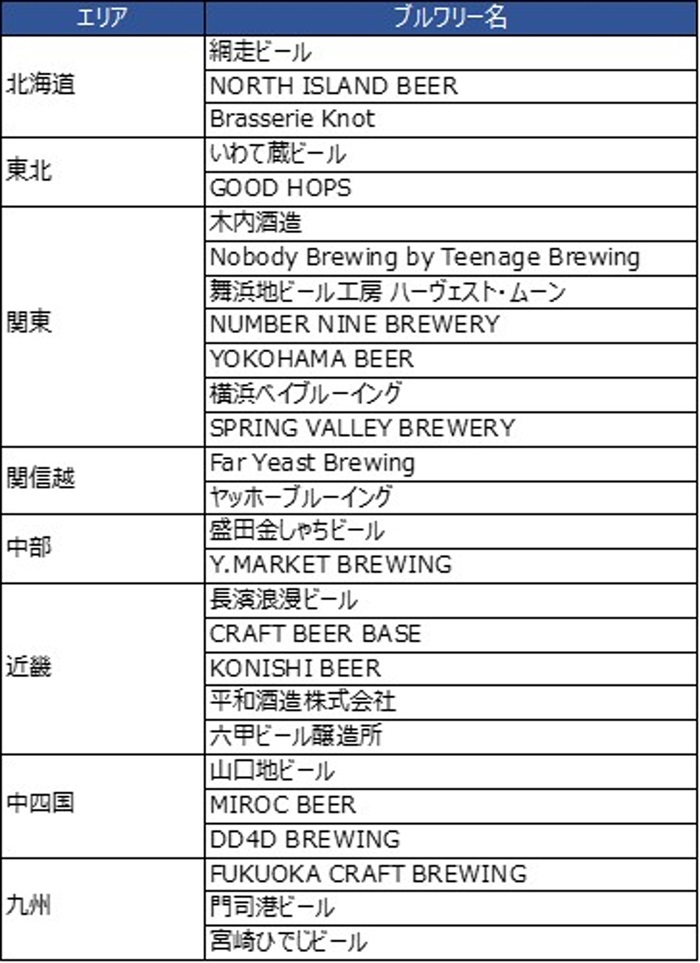
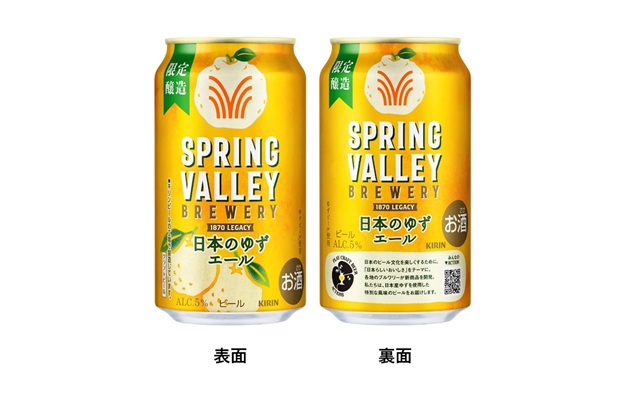
 別ウィンドウで開く
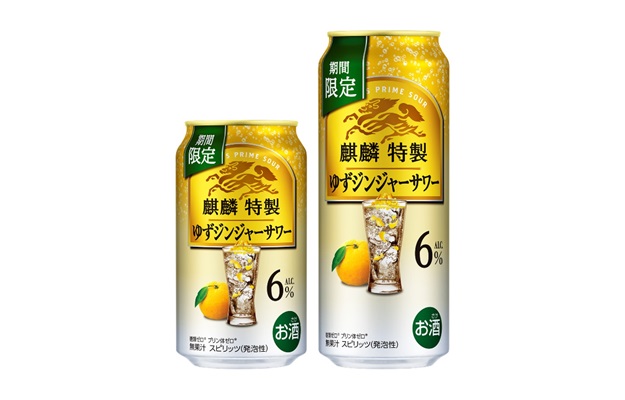


Prompts
Click prompts to add them under the company line, click again to take one out, then copy the result into your AI chat. Shared by Asian Century Stocks and Uncovered Thai Stocks. Thank you.
Kirin Holdings Company, Limited (ticker 2503), listed in Japan.
Copied
Company History
Name and ticker changes, and re-registrations under a new regulatory id. When a ticker stopped being used is not recorded, so former tickers are undated.
| Date | Change | Detail |
|---|---|---|
| Oct 24, 2024 | Acquired | Acquired Fancl Corporation (EDINET code E01046). Its filings from before the deal are on its own company page, not shown here. |
ETFs Holding Kirin Holdings Company, Limited
Exchange-traded funds whose newest published daily portfolio holds one of the company's listings, largest weight first.
| ETF | Weight in ETF | Shares | Market value | As of |
|---|---|---|---|---|
| IVAL | 2.17% | 239,181 | $ 4.77M | Nov 18, 2026 |
| JSTC | 0.29% | 42,479 | $ 853.44K | Nov 17, 2026 |
| NTSI | 0.13% | 36,000 | $ 622.538K | Jun 30, 2026 |
| DXIV | 0.10% | 12,100 | $ 230.801K | Nov 12, 2026 |
| DFSI | 0.09% | 54,100 | $ 1.032M | Nov 12, 2026 |
| AVDE | 0.08% | 788,300 | $ 15.838M | Nov 16, 2026 |
| DFIV | 0.08% | 928,800 | $ 17.716M | Nov 12, 2026 |
| FLSP | 0.08% | 42,400 | $ 733.212K | Jun 30, 2026 |
| DFIC | 0.07% | 600,300 | $ 11.45M | Nov 12, 2026 |
| AVSD | 0.07% | 13,200 | $ 265.209K | Nov 16, 2026 |
| DFAI | 0.07% | 656,100 | $ 12.515M | Nov 12, 2026 |
| DFAX | 0.03% | 202,740 | $ 3.867M | Nov 12, 2026 |
| AVIV | 0.00% | 1,300 | $ 26.119K | Nov 16, 2026 |