|
Human Holdings Co., Ltd. is a holding company that manages and directs its subsidiaries across four primary business segments: human resources, education, elderly care, and other services. In the human resources segment, the group operates staffing, recruitment, business outsourcing, DX solutions, and internet-based job information services through Human Leosia and Human Global Talent. The education segment provides adult education, full-time education, child education, international education, and childcare services via Human Academy, Human Star Child, and Human Academy Europe SAS. The elderly care segment offers day services, home care support, visiting care, group homes, small-scale multifunctional care, and care-assisted senior housing through Human Life Care. The other segment includes sports operations and nail salon management via Human Planning and Dashing Diva International. The group structure includes consolidated and non-consolidated subsidiaries as well as affiliated companies. Summarised from the annual report, fiscal year ended Mar 2026 |
Industry Staffing & Employment Services | Homepage athuman.com |
| Sector Industrials | IR page athuman.com | |
|
Tags
staffing, recruitment, business outsourcing, dx solutions, job information services, adult education, childcare, international education, elderly care, day services, home care, sports operations, Human Leosia, Human Global Talent, Human Academy, Human Star Child, Human Academy Europe SAS, Human Life Care, Human Planning, Dashing Diva International, PT.Human Mandiri Indonesia, Sankei Human Learning
|
Press page athuman.com/news |
Metrics
| Valuation | |
|---|---|
| Market cap | ¥ 16.511B |
| Market cap (USD) | $ 103.197M |
| P/E | 7.35 |
| PEG | 0.49 |
| P/BV | 0.84 |
| P/S | 0.16 |
| P/OCF | 5.93 |
| P/FCF | 8.89 |
| Dividend yield | 4.3% |
| Turnover / mcap | — |
| Returns | |
|---|---|
| ROE | 11.8% |
| ROI | 8.5% |
| ROIC | 8.8% |
| Profit margin | 2.2% |
| Growth | |
|---|---|
| Revenue growing | Yes |
| Profits growing | No |
| Revenue up 3y | Yes |
| Revenue up 5y | Yes |
| Earnings growth 3y (net profit CAGR) | 15.1% |
| Quality | |
|---|---|
| Profitable | Yes |
| Margin expanding | Yes |
| Buying back stock | No |
| Diluting (TTM) | No |
| Debt/Equity | — |
| Podcast bulls (TTM) | Sign up |
| Podcast bears (TTM) | Sign up |
| Podcast sentiment (TTM) | Sign up |
| Podcast sentiment % (TTM) | Sign up |
| News sentiment (TTM) | 50 |
| Quality score | 55.6% |
| Insiders | |
|---|---|
| Buys, 1w | Sign up |
| Buys, 1m | Sign up |
| Buys, 1y | Sign up |
| Sells, 1w | Sign up |
| Sells, 1m | Sign up |
| Sells, 1y | Sign up |
Sign up to see this company's insider trades
| Figure | FY 2026 | FY 2025 | FY 2024 | FY 2023 | FY 2022 | FY 2021 | FY 2020 | FY 2019 | FY 2018 | FY 2017 | FY 2016 | FY 2015 | FY 2014 | FY 2013 |
|---|---|---|---|---|---|---|---|---|---|---|---|---|---|---|
| Revenue | 102.539B | 100.329B | 95.896B | 91.575B | 86.293B | 85.811B | 85.99B | 84.313B | 78.763B | 74.417B | 69.079B | 62.594B | 56.66B | 52.041B |
| Net profit | 2.217B | 2.607B | 2.158B | 1.452B | 1.647B | 1.44B | 848.438M | 1.218B | 1.131B | 1.002B | 1.063B | 1.142B | 1.243B | 825.342M |
| Free cash flow | 2.278B | 42.268M | 3.216B | 1.319B | 685.221M | 954.798M | 266.601M | 1.421B | 1.164B | 1.181B | 476.367M | — | — | — |
| Figure | FY 2026 | FY 2025 | FY 2024 | FY 2023 | FY 2022 | FY 2021 | FY 2020 | FY 2019 | FY 2018 | FY 2017 | FY 2016 | FY 2015 | FY 2014 | FY 2013 |
|---|---|---|---|---|---|---|---|---|---|---|---|---|---|---|
| Share price | 1.703K | 1.589K | 1.356K | 923.93 | 896.5 | 956.89 | 722.21 | 2.063K | 2.062K | 1.688K | 780.11 | 1.066K | 718.8 | 440.01 |
| Price performance 12m | 0.07 | 0.17 | 0.47 | 0.03 | -0.06 | 0.32 | -0.65 | 0 | 0.22 | 1.16 | -0.27 | 0.48 | 0.63 | — |
Filed figures
Lines the statements and their notes report beside the headline figures, read from the filings' XBRL as filed (no restatement applied), with figures computed from one filing's own lines. Cash-flow lines carry their cash direction: an outflow is negative. Each period links to its filing; a figure's period, report date and tag are in its tooltip.
| Figure | Mar 2017 | Mar 2018 | Mar 2019 | Mar 2020 | Mar 2021 | Mar 2022 | Mar 2023 | Mar 2024 | Mar 2025 | Mar 2026 |
|---|---|---|---|---|---|---|---|---|---|---|
| Balance sheet detail | ||||||||||
| Trade receivables (JPY) | 8.83B | 9.15B | 9.5B | 9.77B | 10.3B | 10.4B | 11B | 11.3B | 11.7B | 11.8B |
| ↳ YoY growth | +6.7% | +3.6% | +3.9% | +2.8% | +5.7% | +1.2% | +5.3% | +3.0% | +3.7% | +0.2% |
| ↳ 5y CAGR | +4.5% | +3.4% | +3.8% | +3.6% | +3.8% | +2.7% | ||||
| Borrowings, current (JPY) | 1.83B | 2.11B | 2.31B | 2.57B | 3B | 3.21B | 3.33B | 3.39B | 3.07B | 2.86B |
| Borrowings, non-current (JPY) | 3.12B | 4.01B | 4.39B | 4.03B | 5.46B | 7.63B | 7.94B | 7.23B | 6.73B | 6.5B |
| Cash and deposits (JPY) | 16.8B | 18.5B | 20.3B | 20.1B | 22.8B | 25.5B | 27.2B | 29.1B | 27.8B | 29.1B |
| Intangible assets (JPY) | 1.11B | 1.18B | 1.53B | 1.46B | 1.19B | 1.18B | 1.35B | 1.56B | 1.74B | 1.41B |
| Net debt (borrowings + leases - cash) (JPY) | -11.9B | -12.3B | -13.6B | -13.5B | -14.4B | -14.7B | -15.9B | -18.5B | -18B | -19.8B |
| Cash flow detail | ||||||||||
| Operating cash flow (JPY) | 2.51B | 2.54B | 2.69B | 1.4B | 2.05B | 1.83B | 2.53B | 4.62B | 1.52B | 3.28B |
| Purchases of property, plant and equipment (JPY) | -1.03B | -930M | -617M | -595M | -831M | -719M | -697M | -729M | -965M | -741M |
| Purchases of intangible assets (JPY) | -302M | -445M | -655M | -539M | -261M | -422M | -512M | -678M | -516M | -263M |
| Change in receivables (cash effect) (JPY) | -534M | -318M | -246M | -259M | -533M | -159M | -545M | -371M | -386M | -375M |
| Change in inventories (cash effect) (JPY) | -147M | 29.3M | -86.6M | -40.5M | -25.6M | -26.5M | -134M | 221M | 31.2M | 31.6M |
| Change in payables (cash effect) (JPY) | -1.65M | -49.5M | 57.8M | -16.8M | 90.6M | -102M | 112M | -147M | -77.7M | -12.9M |
| Dividends paid (cash effect) (JPY) | -218M | -201M | -228M | -245M | -174M | -288M | -332M | -294M | -649M | -784M |
| Share buybacks (cash effect) (JPY) | — | — | — | — | — | — | — | -482M | -60,000 | — |
| Interest paid (cash effect) (JPY) | -17.5M | -15.5M | -14.7M | -13.8M | -16.9M | -20.5M | -28.8M | -36.2M | -50.7M | -69.7M |
| Income taxes paid (cash effect) (JPY) | -646M | -812M | -773M | -1B | -1.04B | -1.78B | -775M | -911M | -1.08B | -1.11B |
| Operating cash flow before change in receivables (JPY) | 3.05B | 2.86B | 2.94B | 1.66B | 2.58B | 1.99B | 3.07B | 4.99B | 1.91B | 3.66B |
| Free cash flow (OCF - PPE - intangibles) (JPY) | 1.18B | 1.16B | 1.42B | 267M | 955M | 685M | 1.32B | 3.22B | 42.3M | 2.28B |
| Income detail | ||||||||||
| Total comprehensive income (JPY) | 1B | 1.13B | 1.22B | 849M | 1.43B | 1.64B | 1.48B | 2.17B | 2.61B | 2.22B |
| Comprehensive income to owners (JPY) | 1B | 1.13B | 1.22B | 849M | 1.43B | 1.64B | 1.48B | 2.17B | 2.61B | 2.22B |
| Provision for credit losses (JPY) | 141M | 9.66M | 712,000 | 4.97M | 84.3M | 22M | 165M | 6.31M | 253,000 | 51.4M |
| Credit cost ratio (credit losses / average receivables) (%) | 1.6% | 0.1% | 0.0% | 0.1% | 0.8% | 0.2% | 1.5% | 0.1% | 0.0% | 0.4% |
| Reported | Jun 30, 2017 | Jun 29, 2018 | Jun 28, 2019 | Jun 26, 2020 | Jun 30, 2021 | Jun 30, 2022 | Jun 30, 2023 | Jun 26, 2024 | Jun 27, 2025 | Jun 24, 2026 |
Sign up to see institutional holdings
Sign UpPodcast Mentions
Sign up to see podcast mentions and sentiment
Sign UpTimely disclosures published on TDnet, newest first, titles as filed in Japanese. The link opens the disclosure on TDnet. Filings with EDINET (periodic reports, extraordinary reports, offerings, holding and buy-back reports), newest first, titles as filed in Japanese. The link opens the filing on EDINET. Press releases from the company's own website, newest first.
2026.10.29
ダッシングディバインターナショナル
ダッシングディバ ニューヨークとのコラボレーション企画 【創立20周年記念】ニューヨーク コラボレーション デザイン 全5種を2026年11月1日(日)より全国24店舗で提供開始
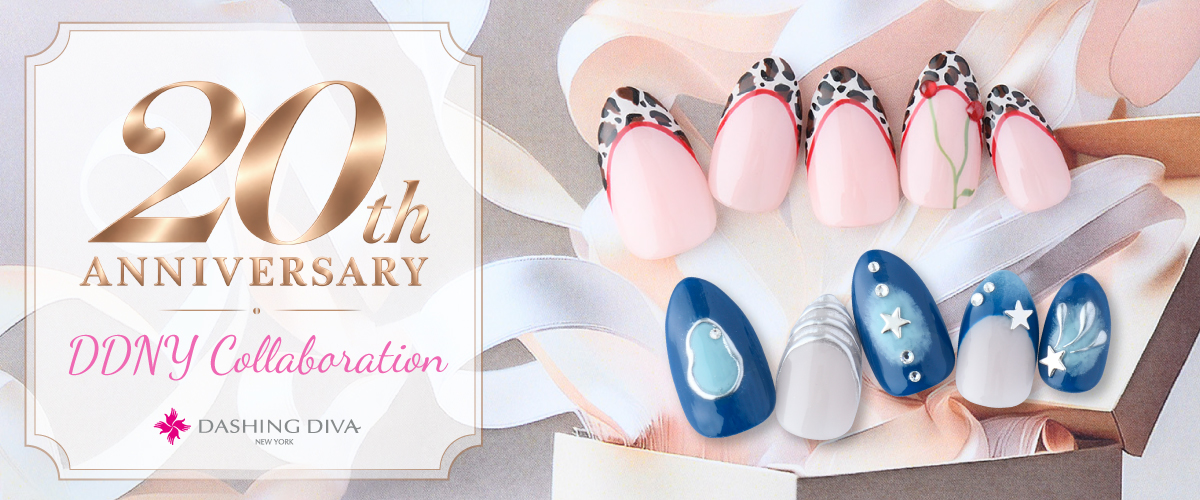
ネイルサロンを運営するダッシングディバインターナショナル株式会社(本社:東京都新宿区、代表取締役:田口 謙一、以下「ダッシングディバ」)は、会社創立20周年を記念し、ブランド発祥の地である本国「ダッシングディバ ニューヨーク」とコラボレーションした特別デザイン全5種を2026年11月1日(日)から展開します。
【本件のポイント】
-
2026年11月1日(日)から会社創立20周年を記念した本国とのコラボデザイン全5種が登場
-
本国「ダッシングディバ ニューヨーク」で販売されている人気ネイルチップ5種をサロン向けに特別アレンジして提供
-
現地ニューヨークで人気のデザインが、大人の女性の指先を華やかに彩る
■本件の概要
- 期間:2026年11月1日(日)から
- 実施店舗:DASHING DIVA全24店舗
- 価格:13,750円(税込)、15,510円(税込)、17,270円(税込)、17,380円(税込)、21,010円(税込)
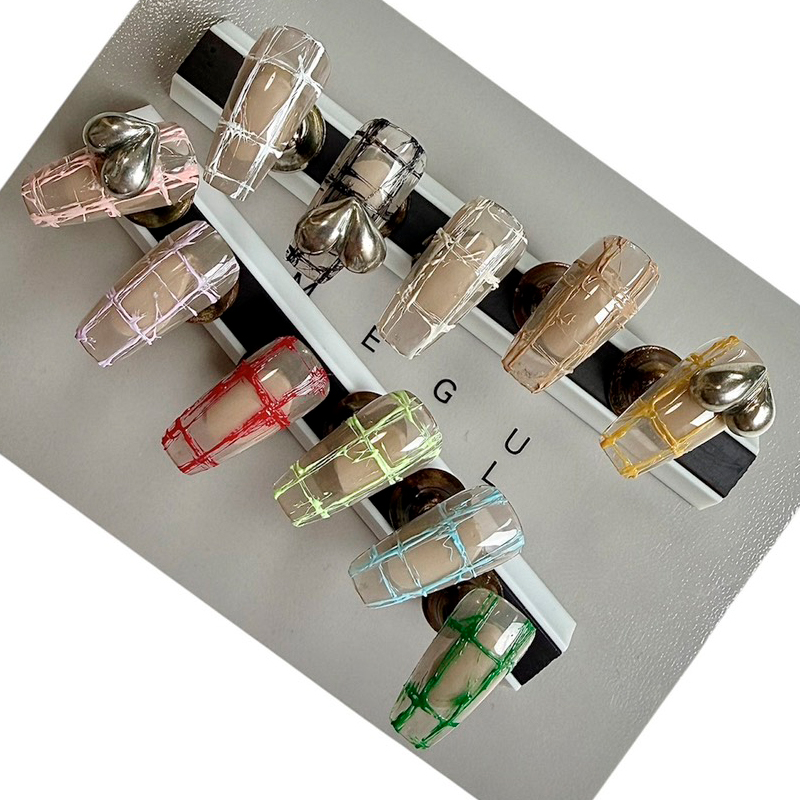
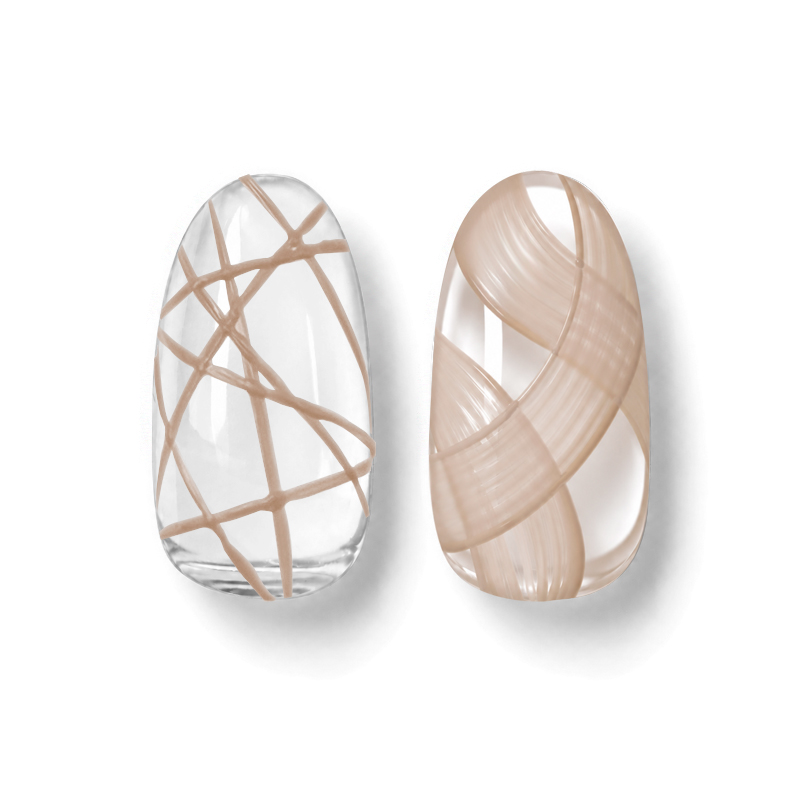
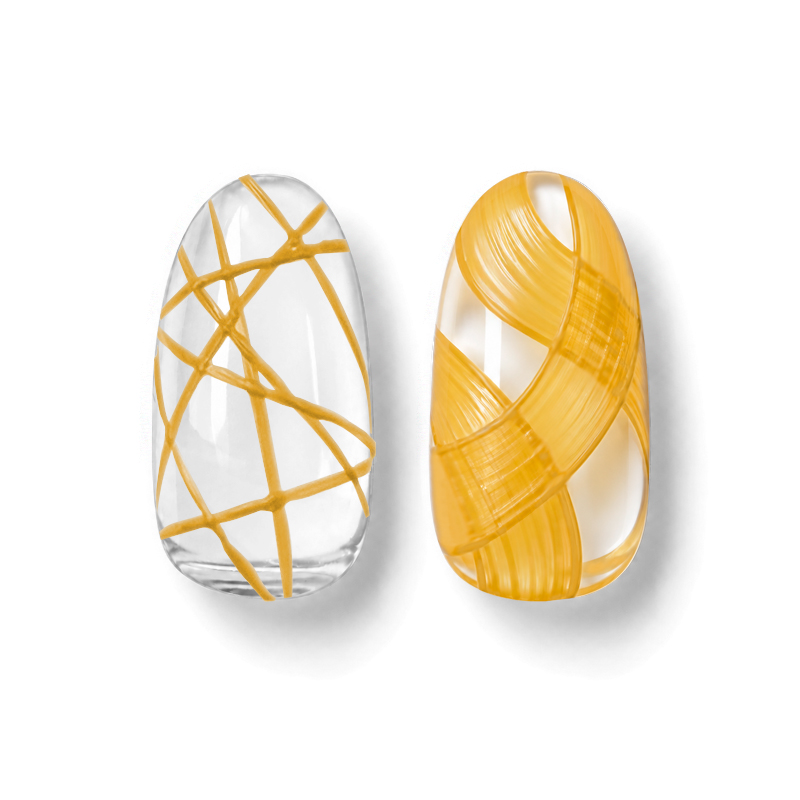
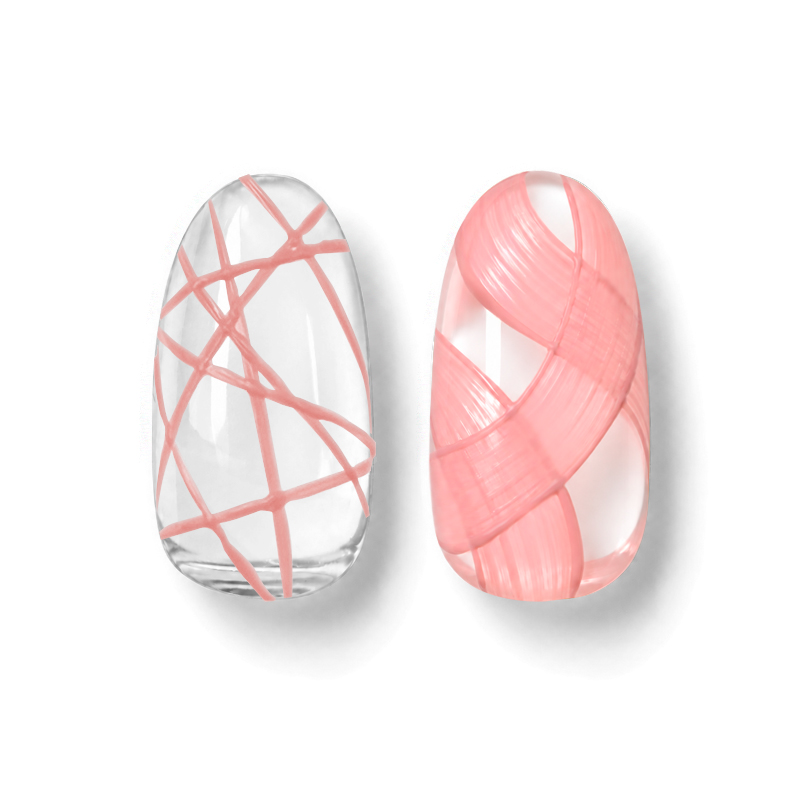
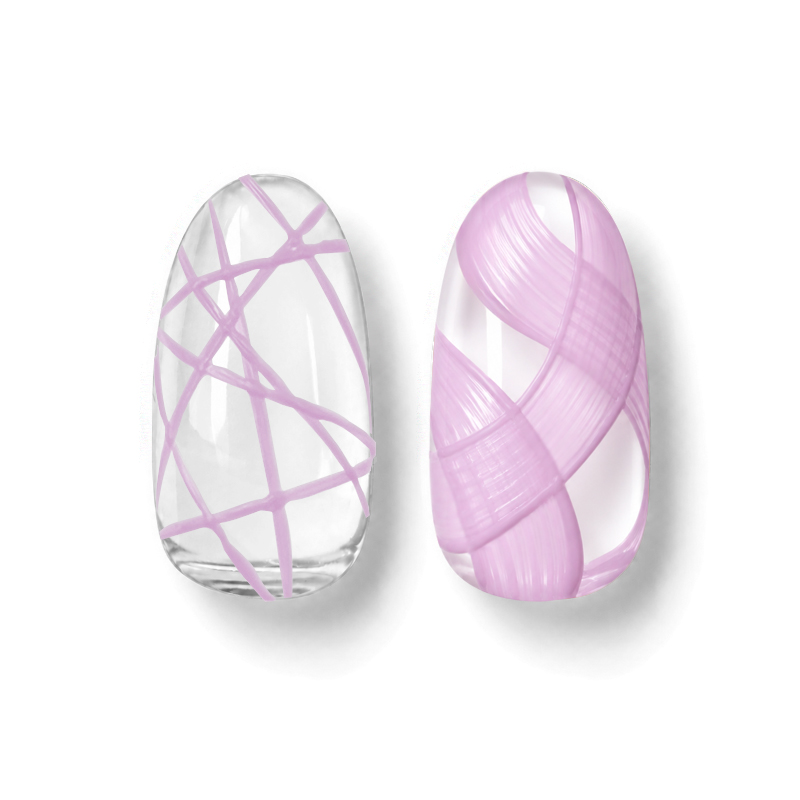
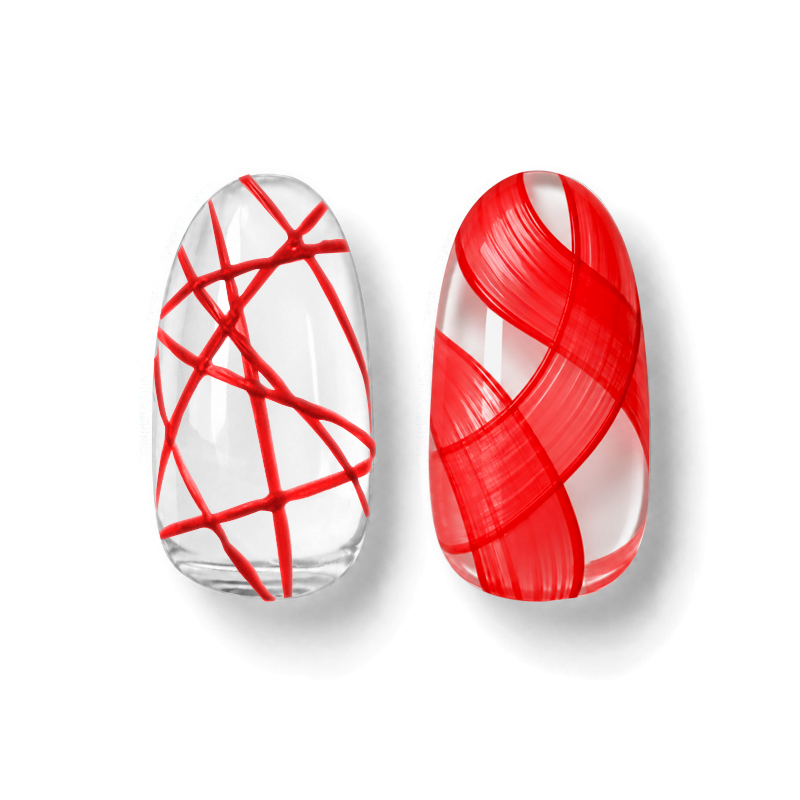
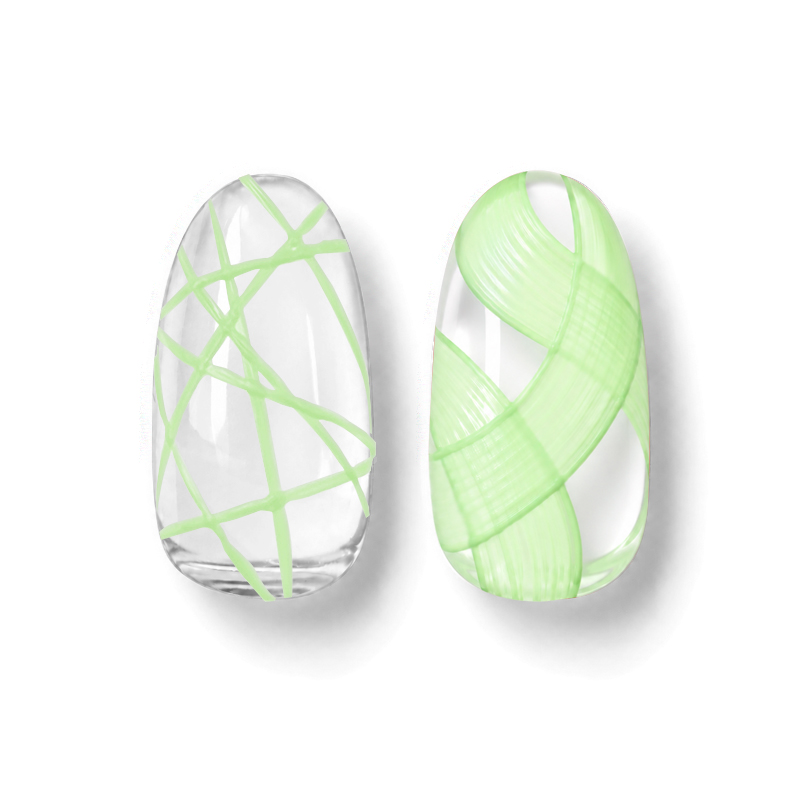
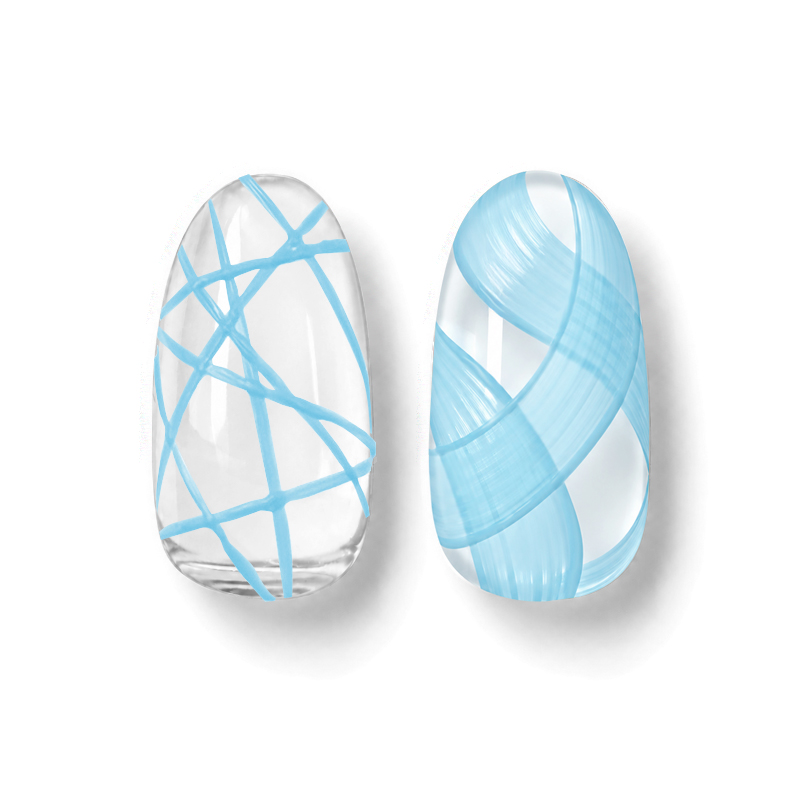
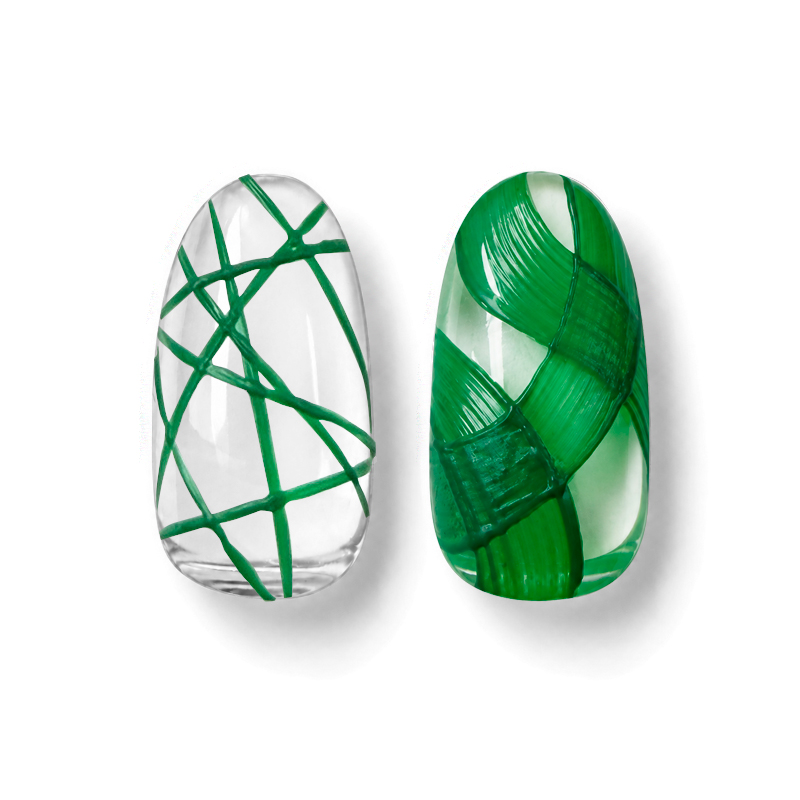
- 内容:会社創立20周年を記念し、本国「ダッシングディバ ニューヨーク」で販売されている人気ネイルチップから厳選したデザイン全5種を、日本のサロンワーク向けに特別アレンジ。トレンドのマグネットやミラー、遊び心あるレオパードやビジューアートまで、洗練された大人の指先を演出する上質なデザインをラインアップ。
【デザイン一覧】
(※いずれのデザインもカラー変更可能。ファイリング・ドライケア・クリームトリートメント含む)
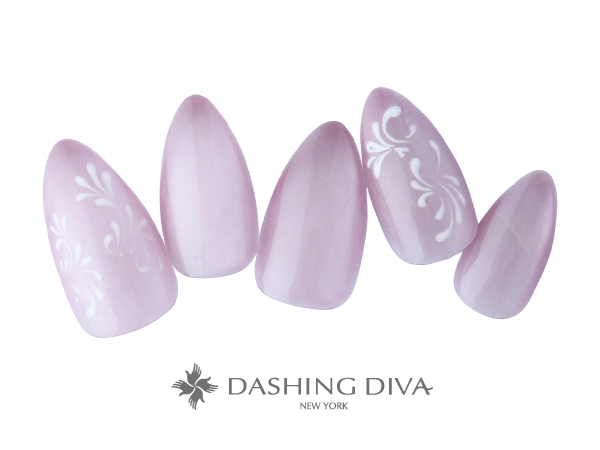
人気のマグネットに、繊細な手描きフラワーを添えて
13,750円(税込)
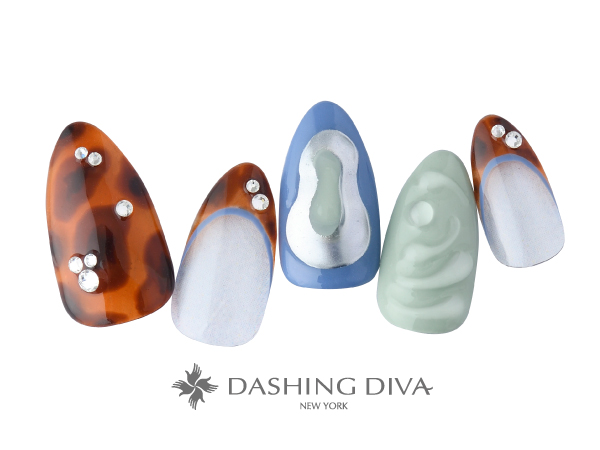
深みべっ甲×ミラーアートが光る、大人のレトロポップ
15,510円(税込)
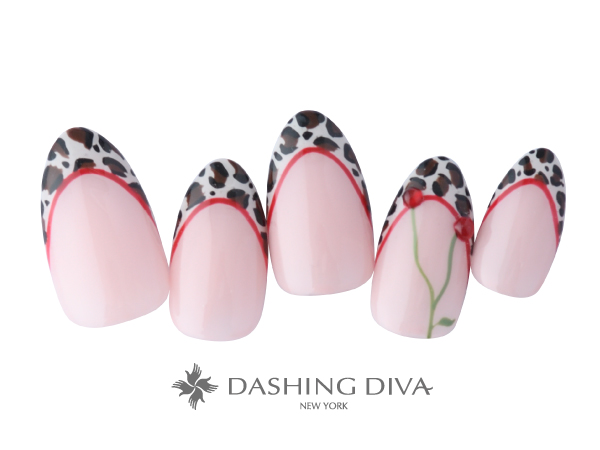
ヒョウ柄×くすみピンクに、可愛いチェリーを
17,270円(税込)
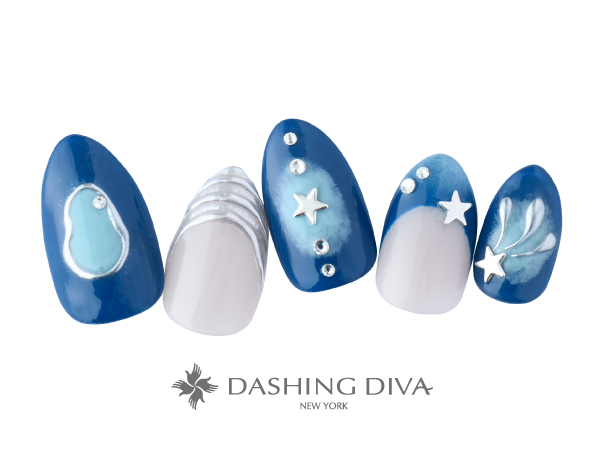
神秘的な輝きを放つ、スペースファンタジー・デザイン
17,380円(税込)
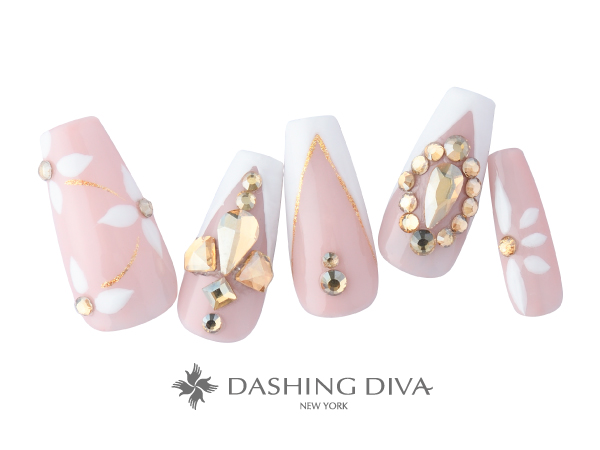
贅沢に敷き詰めた輝くビジューで、ラグジュアリーな指先に
21,010円(税込)
「DASHING DIVA」とは
ニューヨークで誕生し、オープンわずか6カ月でマニキュア部門の賞を獲得したネイルブランド「DASHING DIVA」。本場仕込みのスタイリッシュな感性と確かな技術を融合させ、日本のお客様の指先に元気とキレイをお届けするネイルサロンです。
ネイルサロン ダッシングディバ 全24店
<直営店18店>
【東京】汐留シティセンター店、新宿サブナード店、茗荷谷店、東京ドームシティ ラクーア店、アトレ大井町店、ひばりが丘パルコ店、セレオ八王子店、グランデュオ蒲田店、トリエ京王調布店、錦糸町パルコ店、練馬店
【神奈川】アトレ川崎店、ノクティ溝の口店、西武東戸塚 S.C.店、ラスカ平塚店
【埼玉】ルミネ大宮店、浦和パルコ店 【愛知】名古屋ユニモール店
<FC店6店>
【東京】中野マルイ店、エキュート立川店、赤羽アピレ店、府中フォーリス店
【千葉】船橋東武店 【神奈川】新百合ヶ丘オーパ店
ヒューマングループについて

1985年の創業以来「為世為人(いせいいじん)」を理念に掲げ、教育を中核に人材、介護、保育、IT、美容、スポーツと多岐にわたる事業を展開しています。
深刻な社会課題である「労働人口減」に対し、各事業の専門性を活かした4領域で解決を推進しています。教育・人材事業による「海外人材の活用」「成長産業分野の専門教育と労働移動」、介護(通所・訪問・ホスピス等)や保育・学童運営による「国内労働力の確保」、RPA・AI・IT活用を通じた「生産性の向上」に注力。SDGsへの貢献を通じて、誰もが自分らしく生き、学び、働ける社会の実現と、時代に即した労働環境の革新に取り組んでいます。
ヒューマンホールディングスウェブサイト:https://www.athuman.com/
ダッシングディバインターナショナル株式会社 会社概要
-
- 代表者:代表取締役 田口 謙一
- 所在地:東京都新宿区西新宿7-5-25 西新宿プライムスクエア3階
- 資本金:1,000万円
事業やリリースに関するお問い合わせ
ダッシングディバインターナショナル株式会社 広報宣伝室:西岡
TEL:(03)6692-8645
FAX:(03)3227-4885
E-mail:[email protected]
ヒューマングループに関するお問い合わせ
ヒューマンホールディングス株式会社 広報担当 : 若林
E-mail:[email protected]


©2026 Human Holdings Co.,Ltd. All Rights

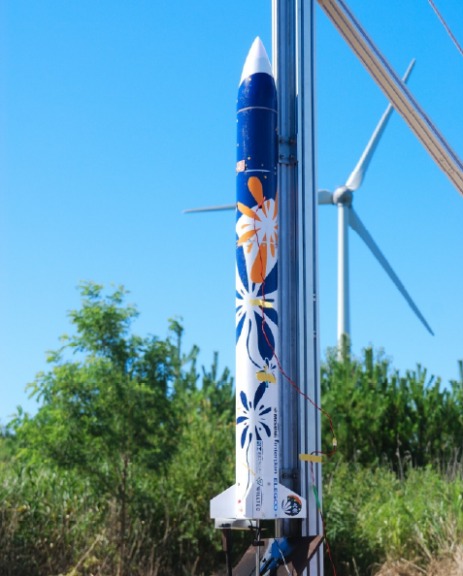
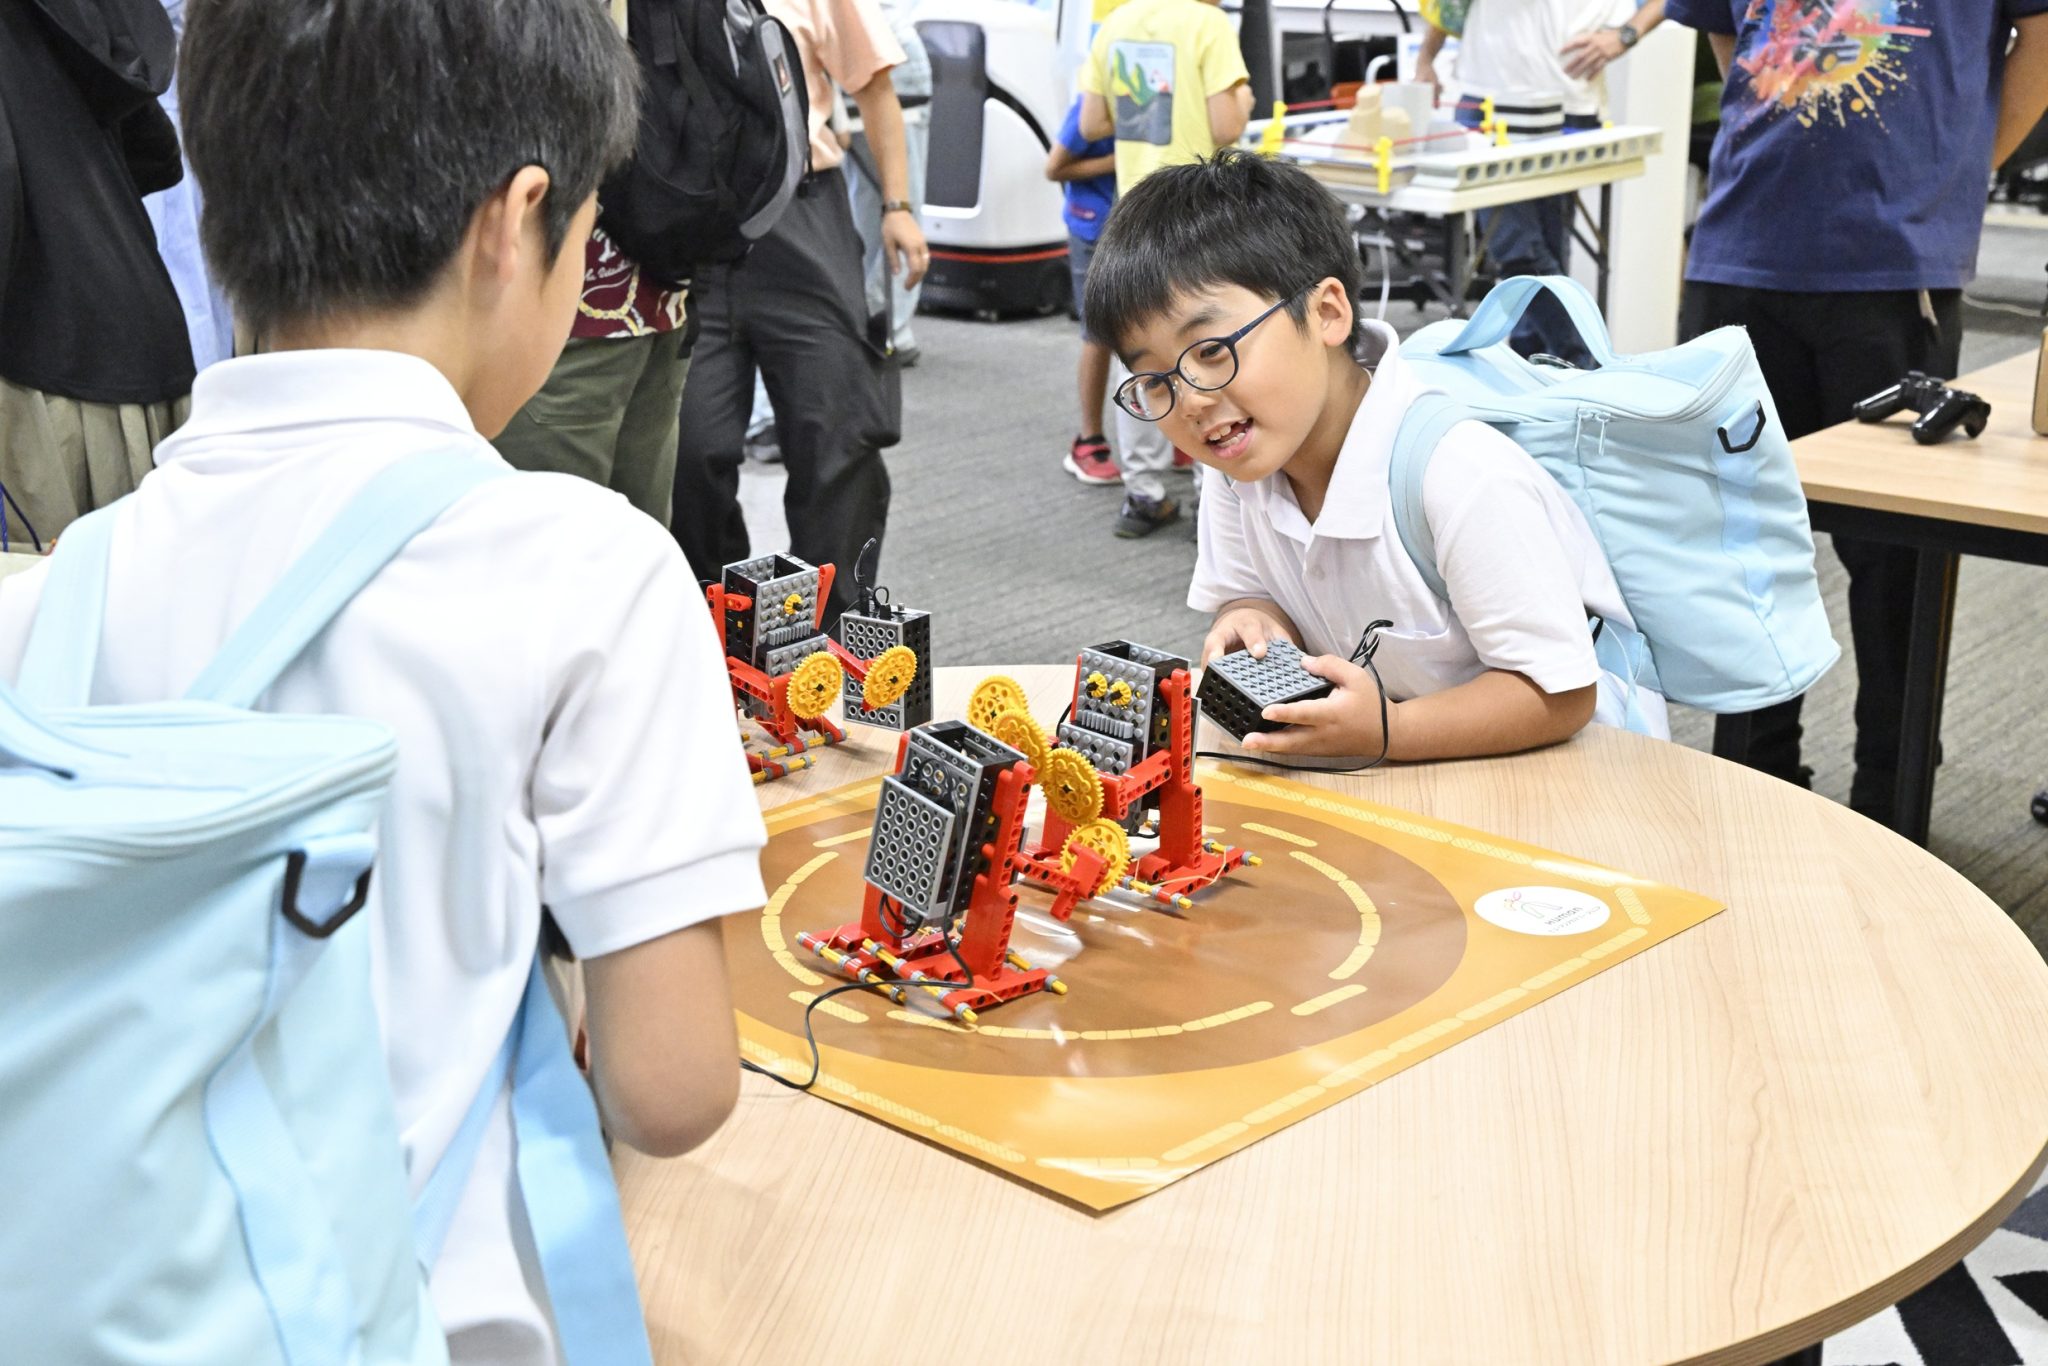

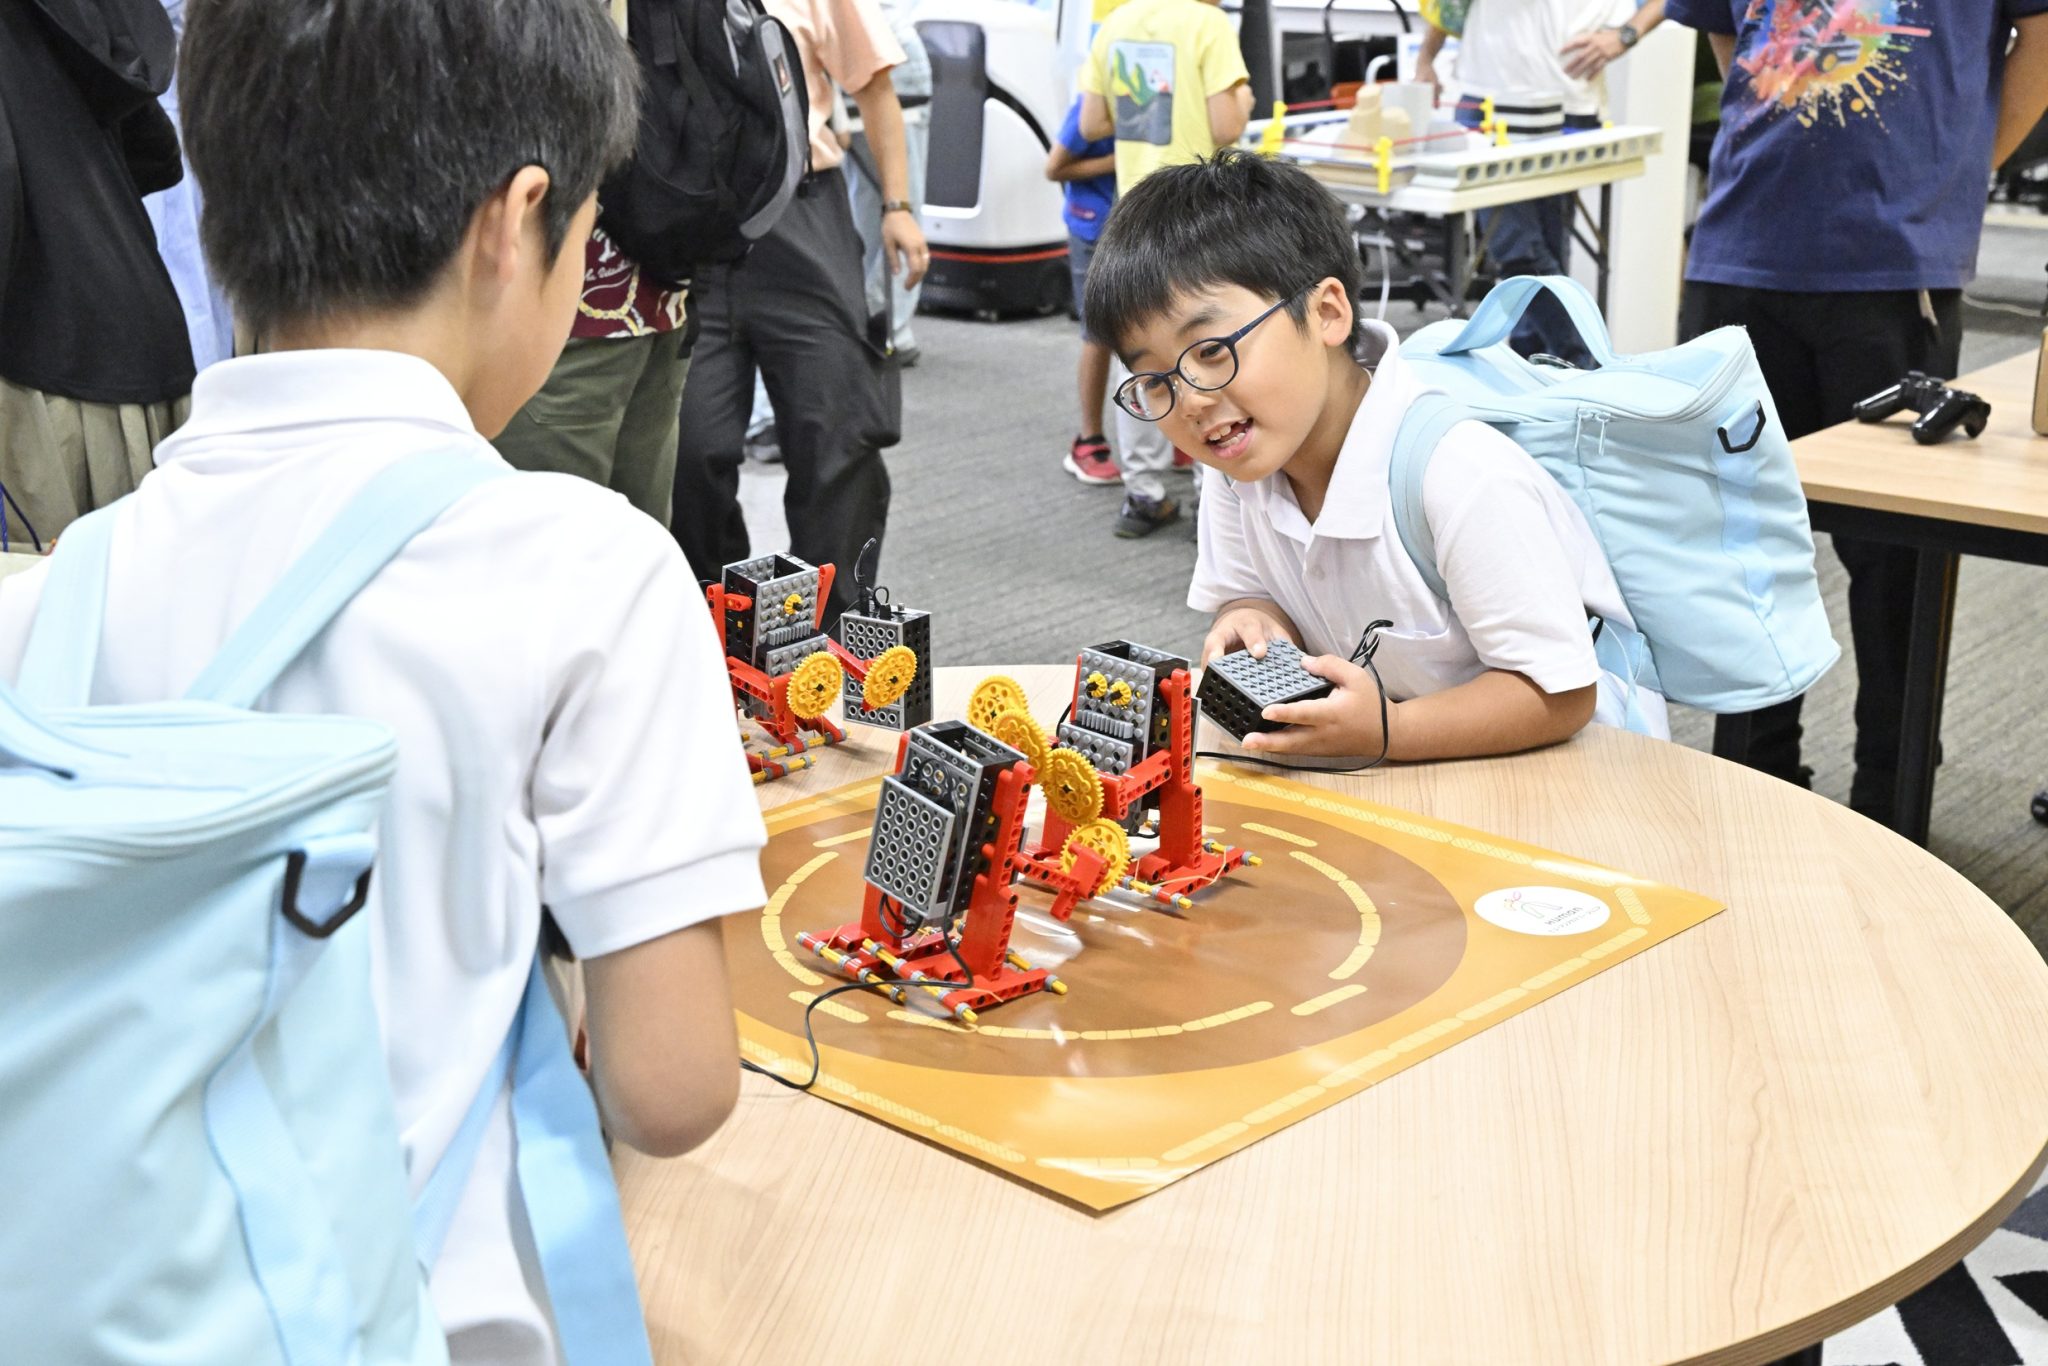
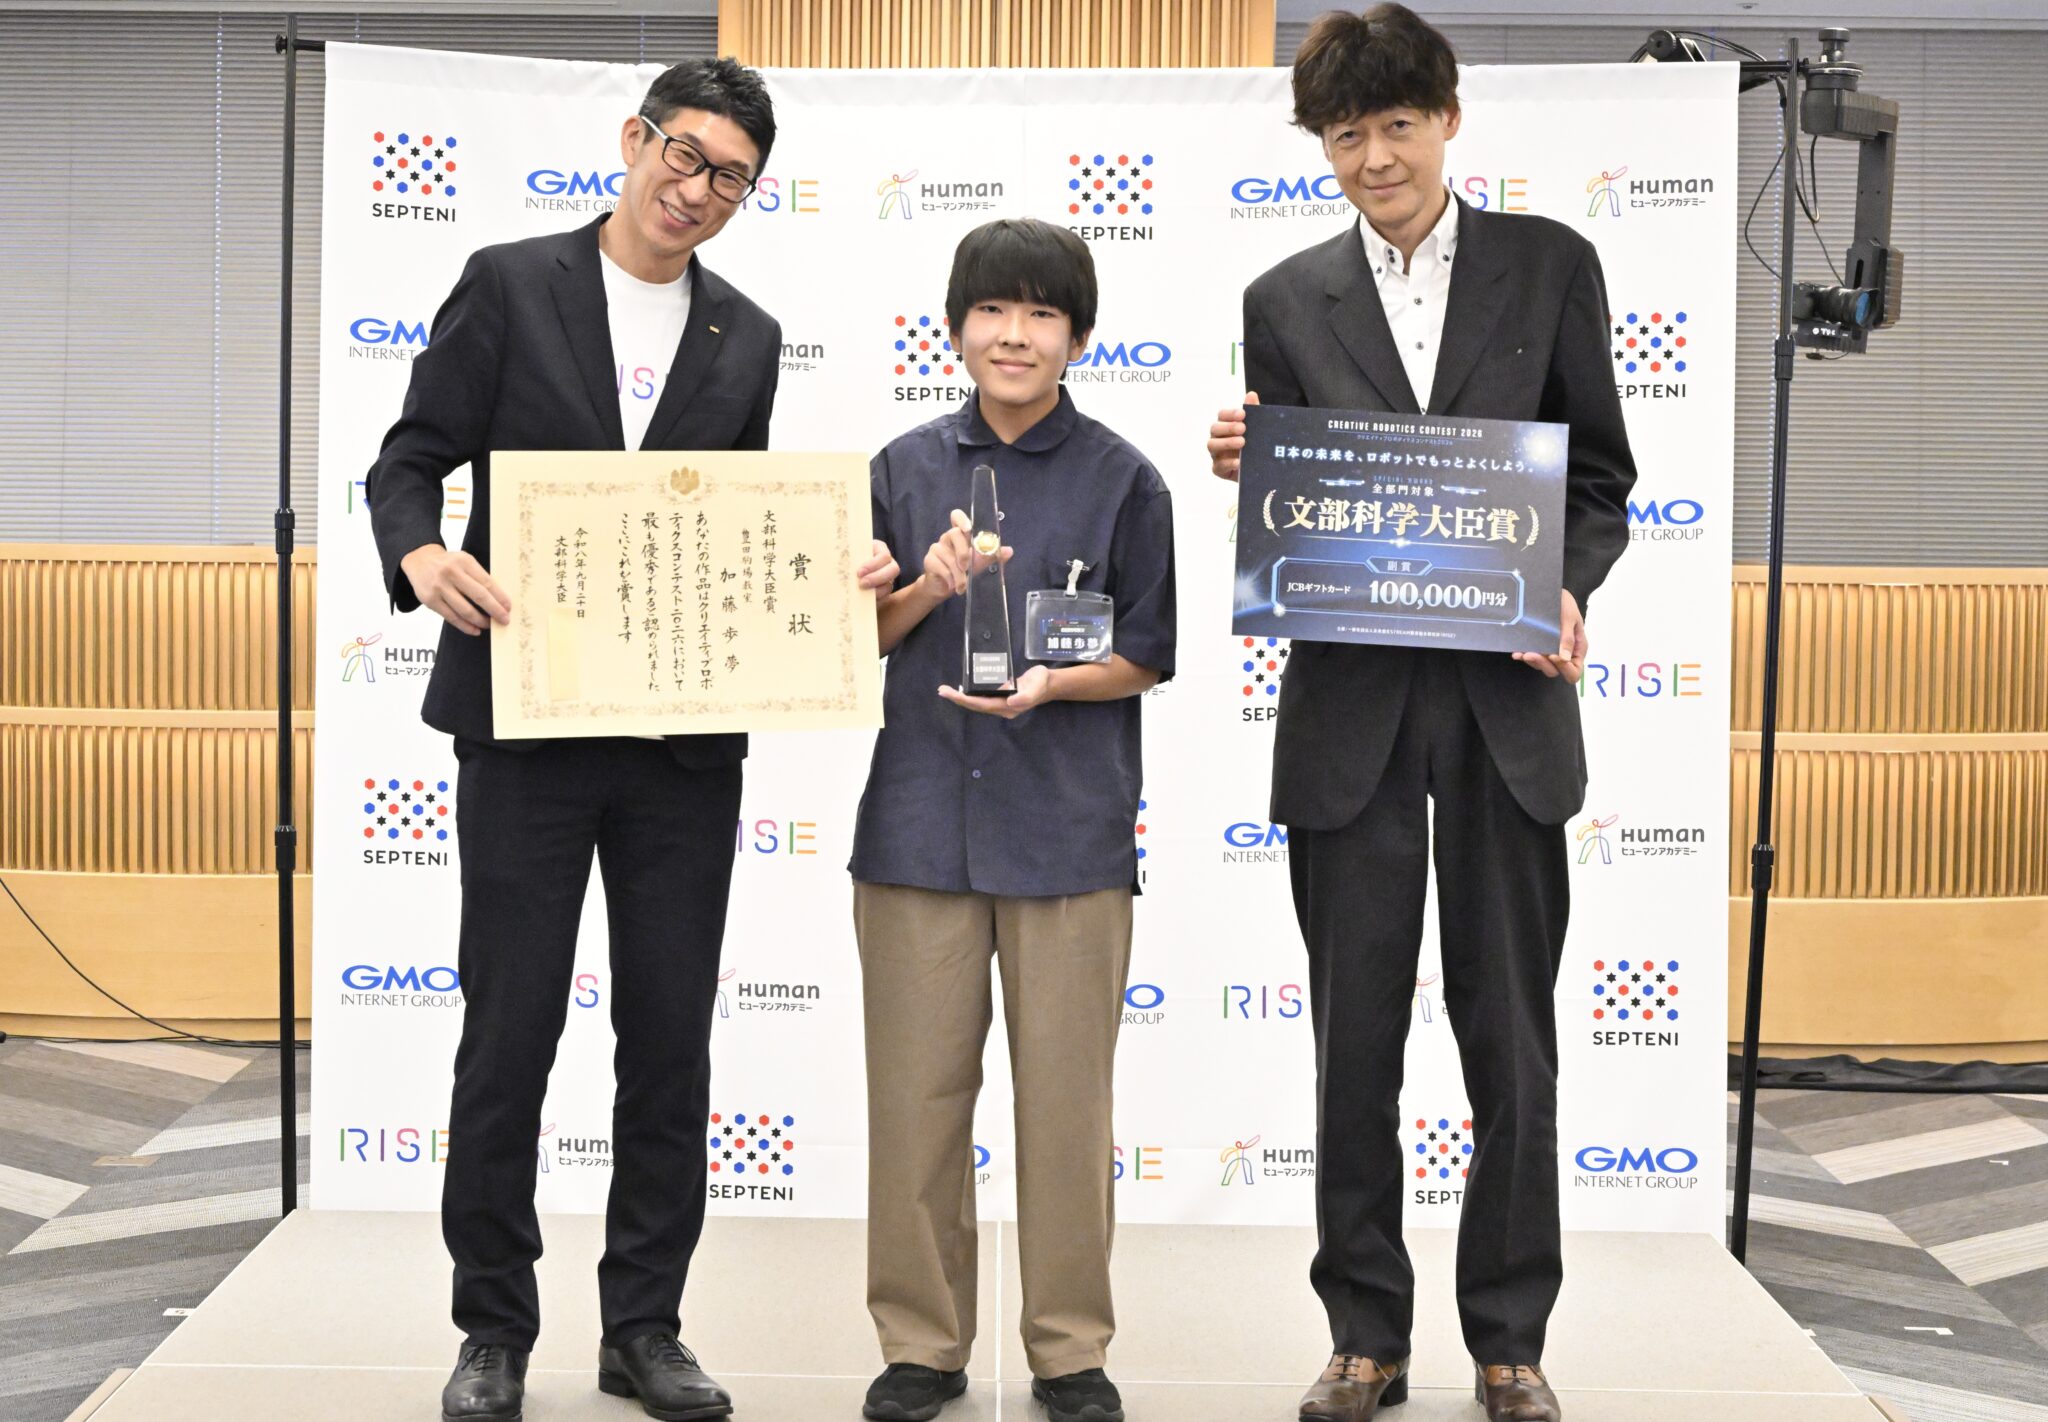
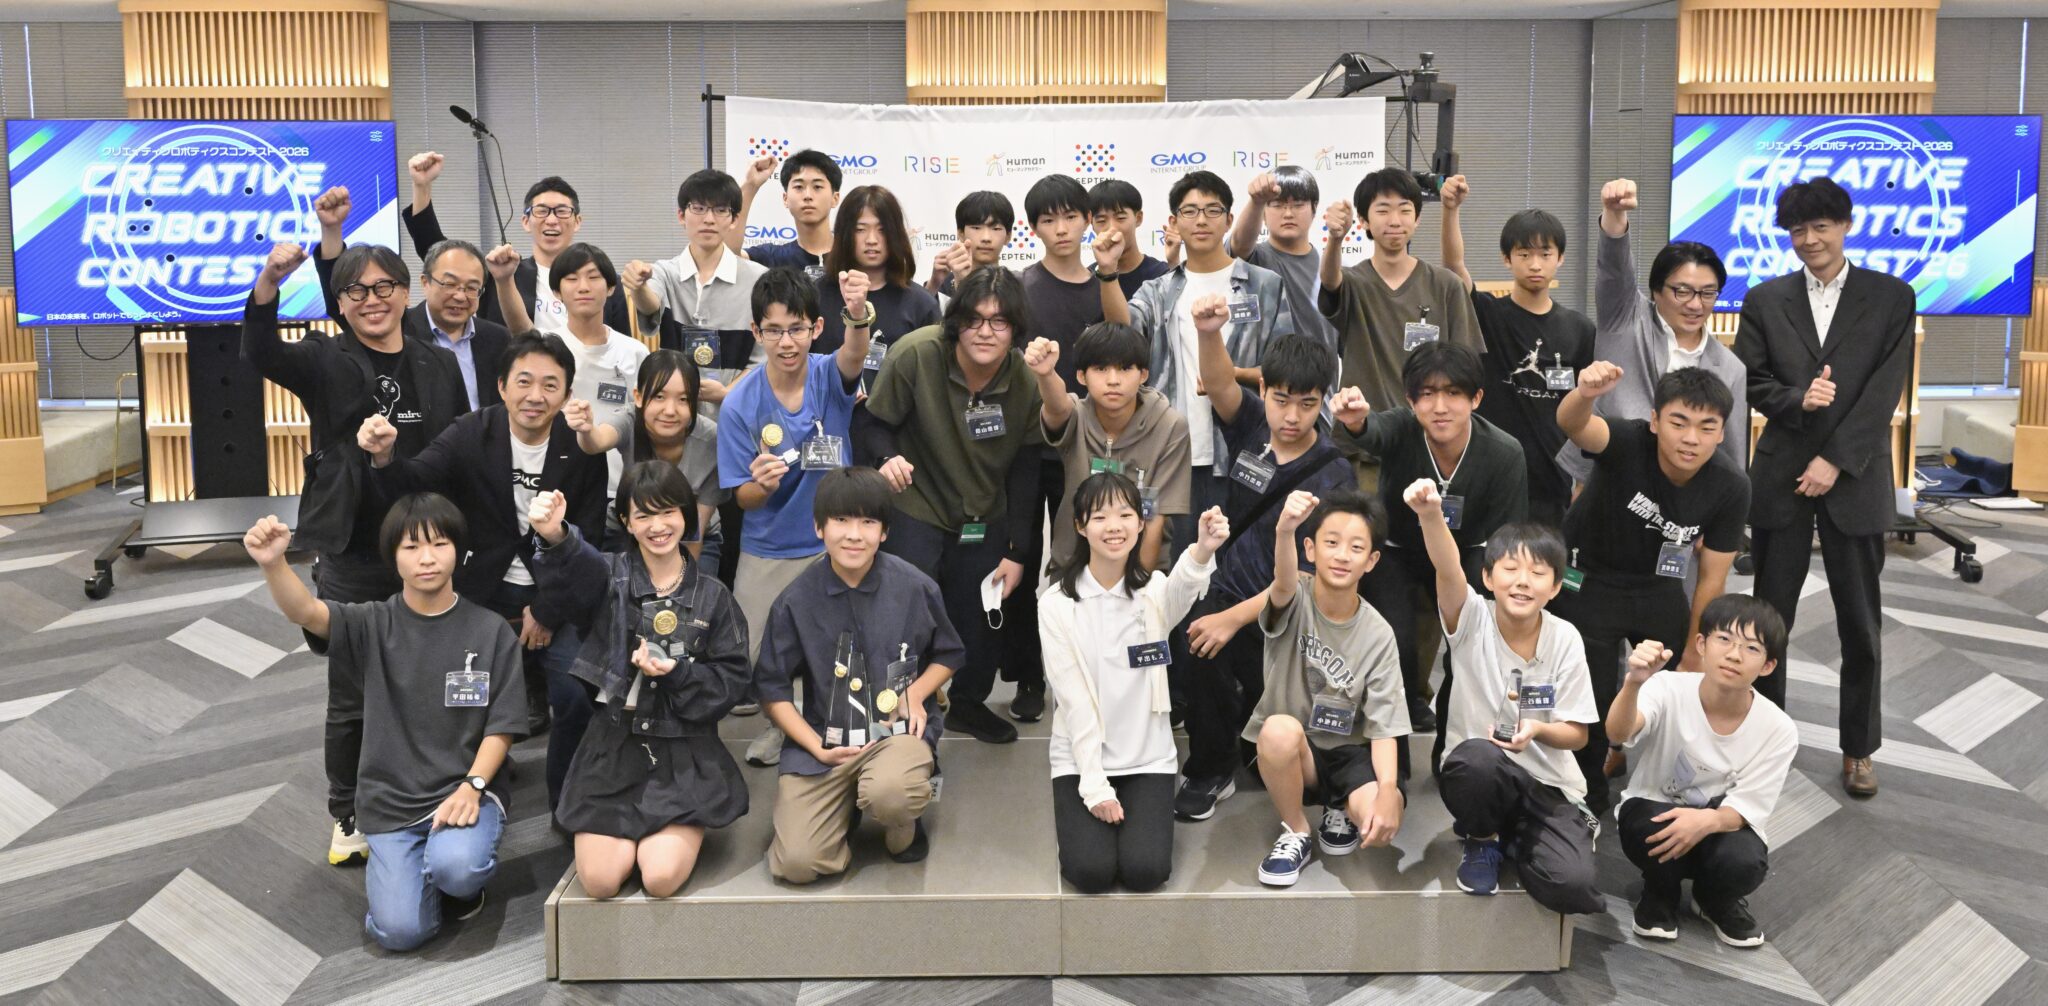
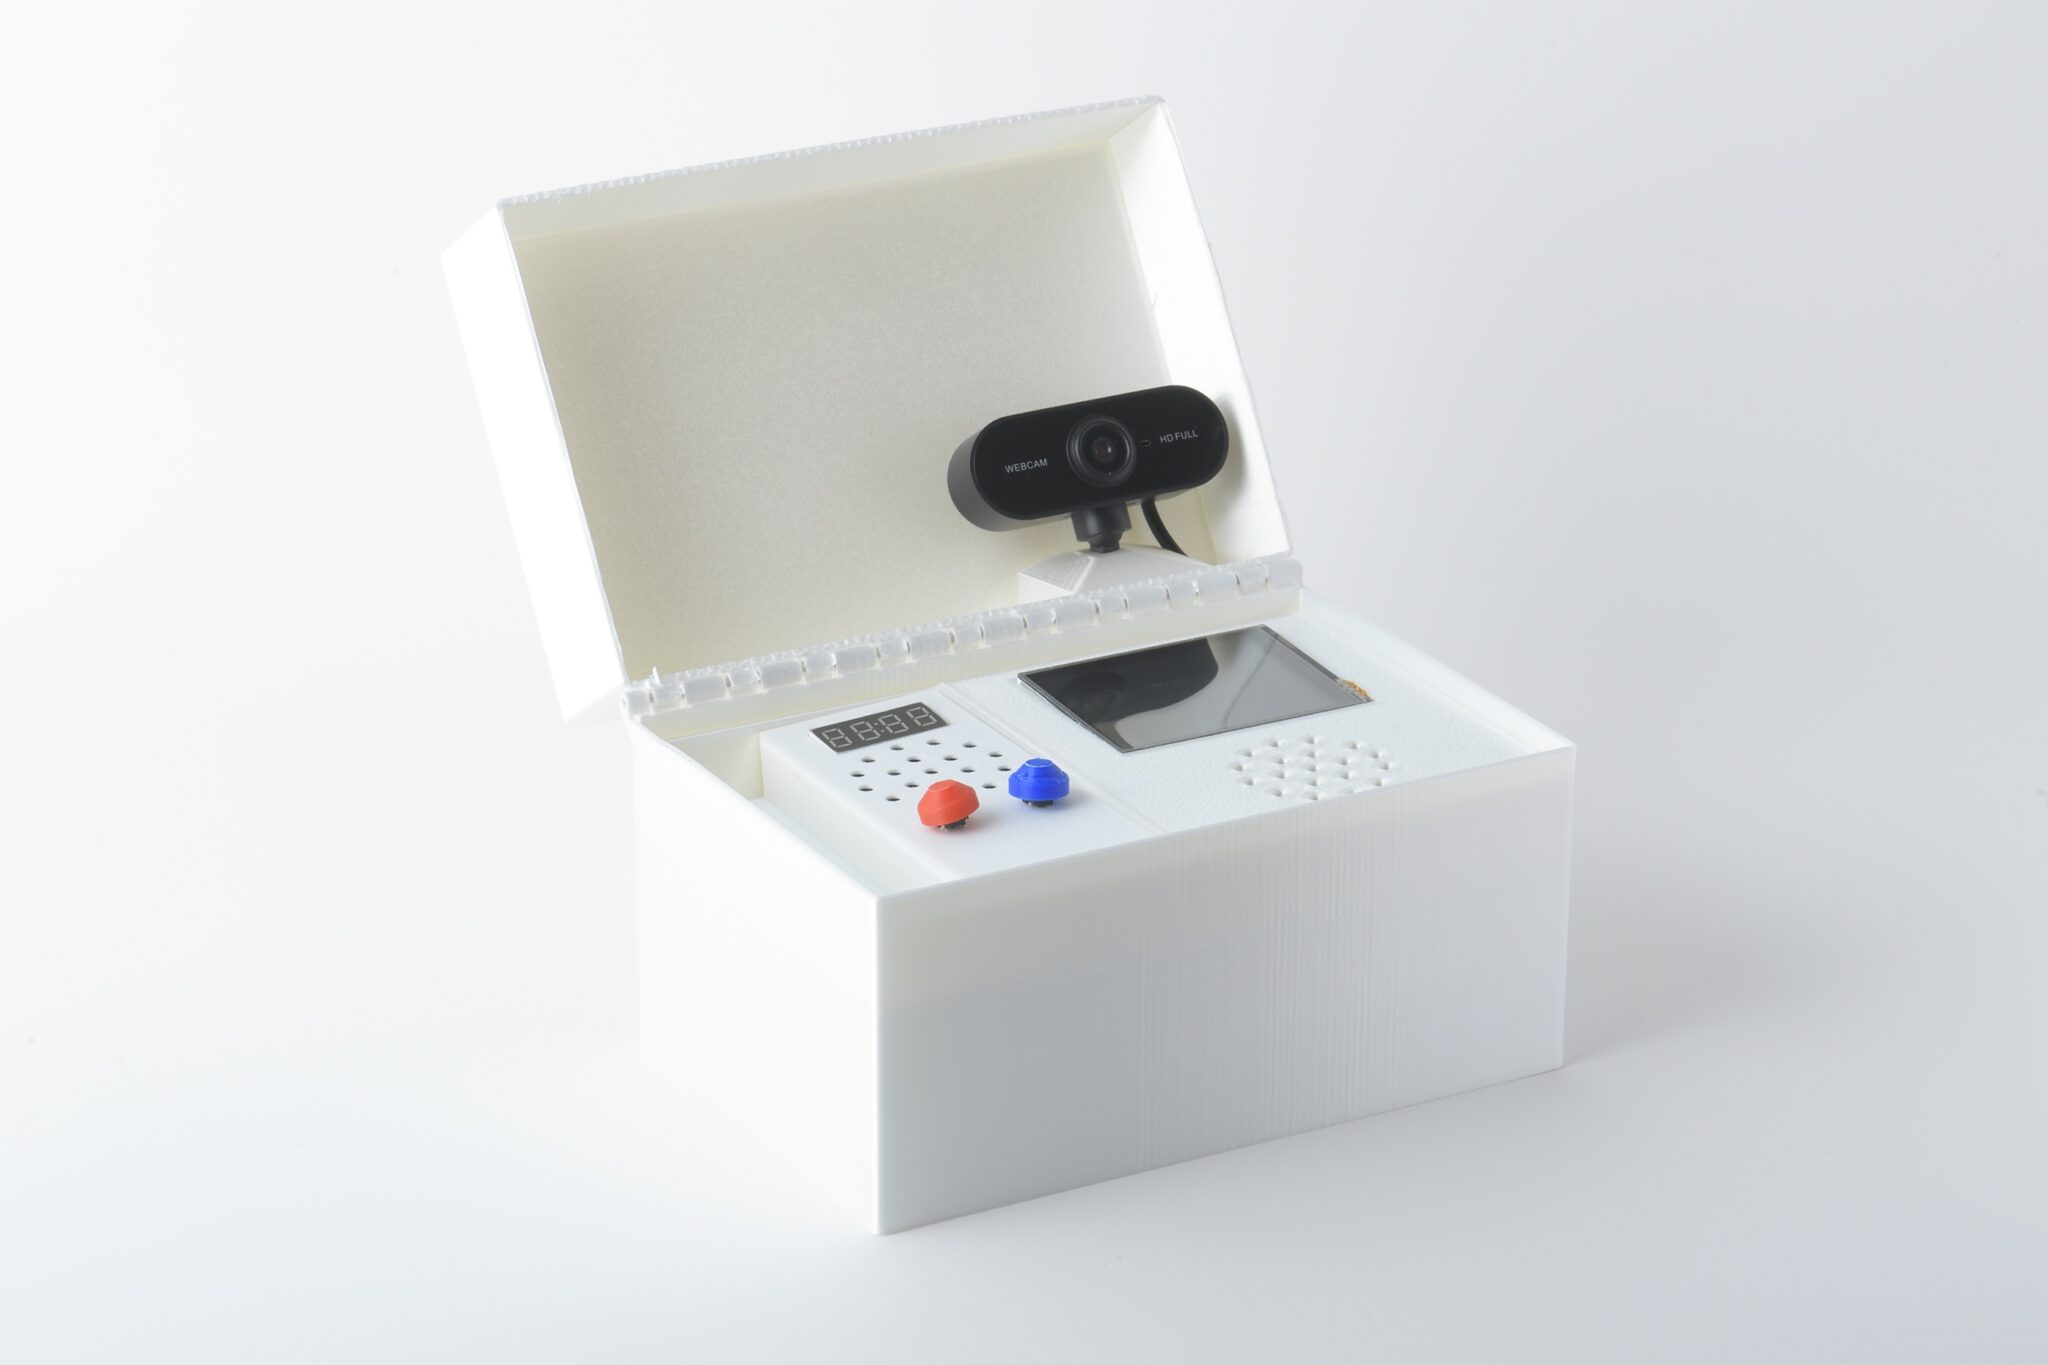
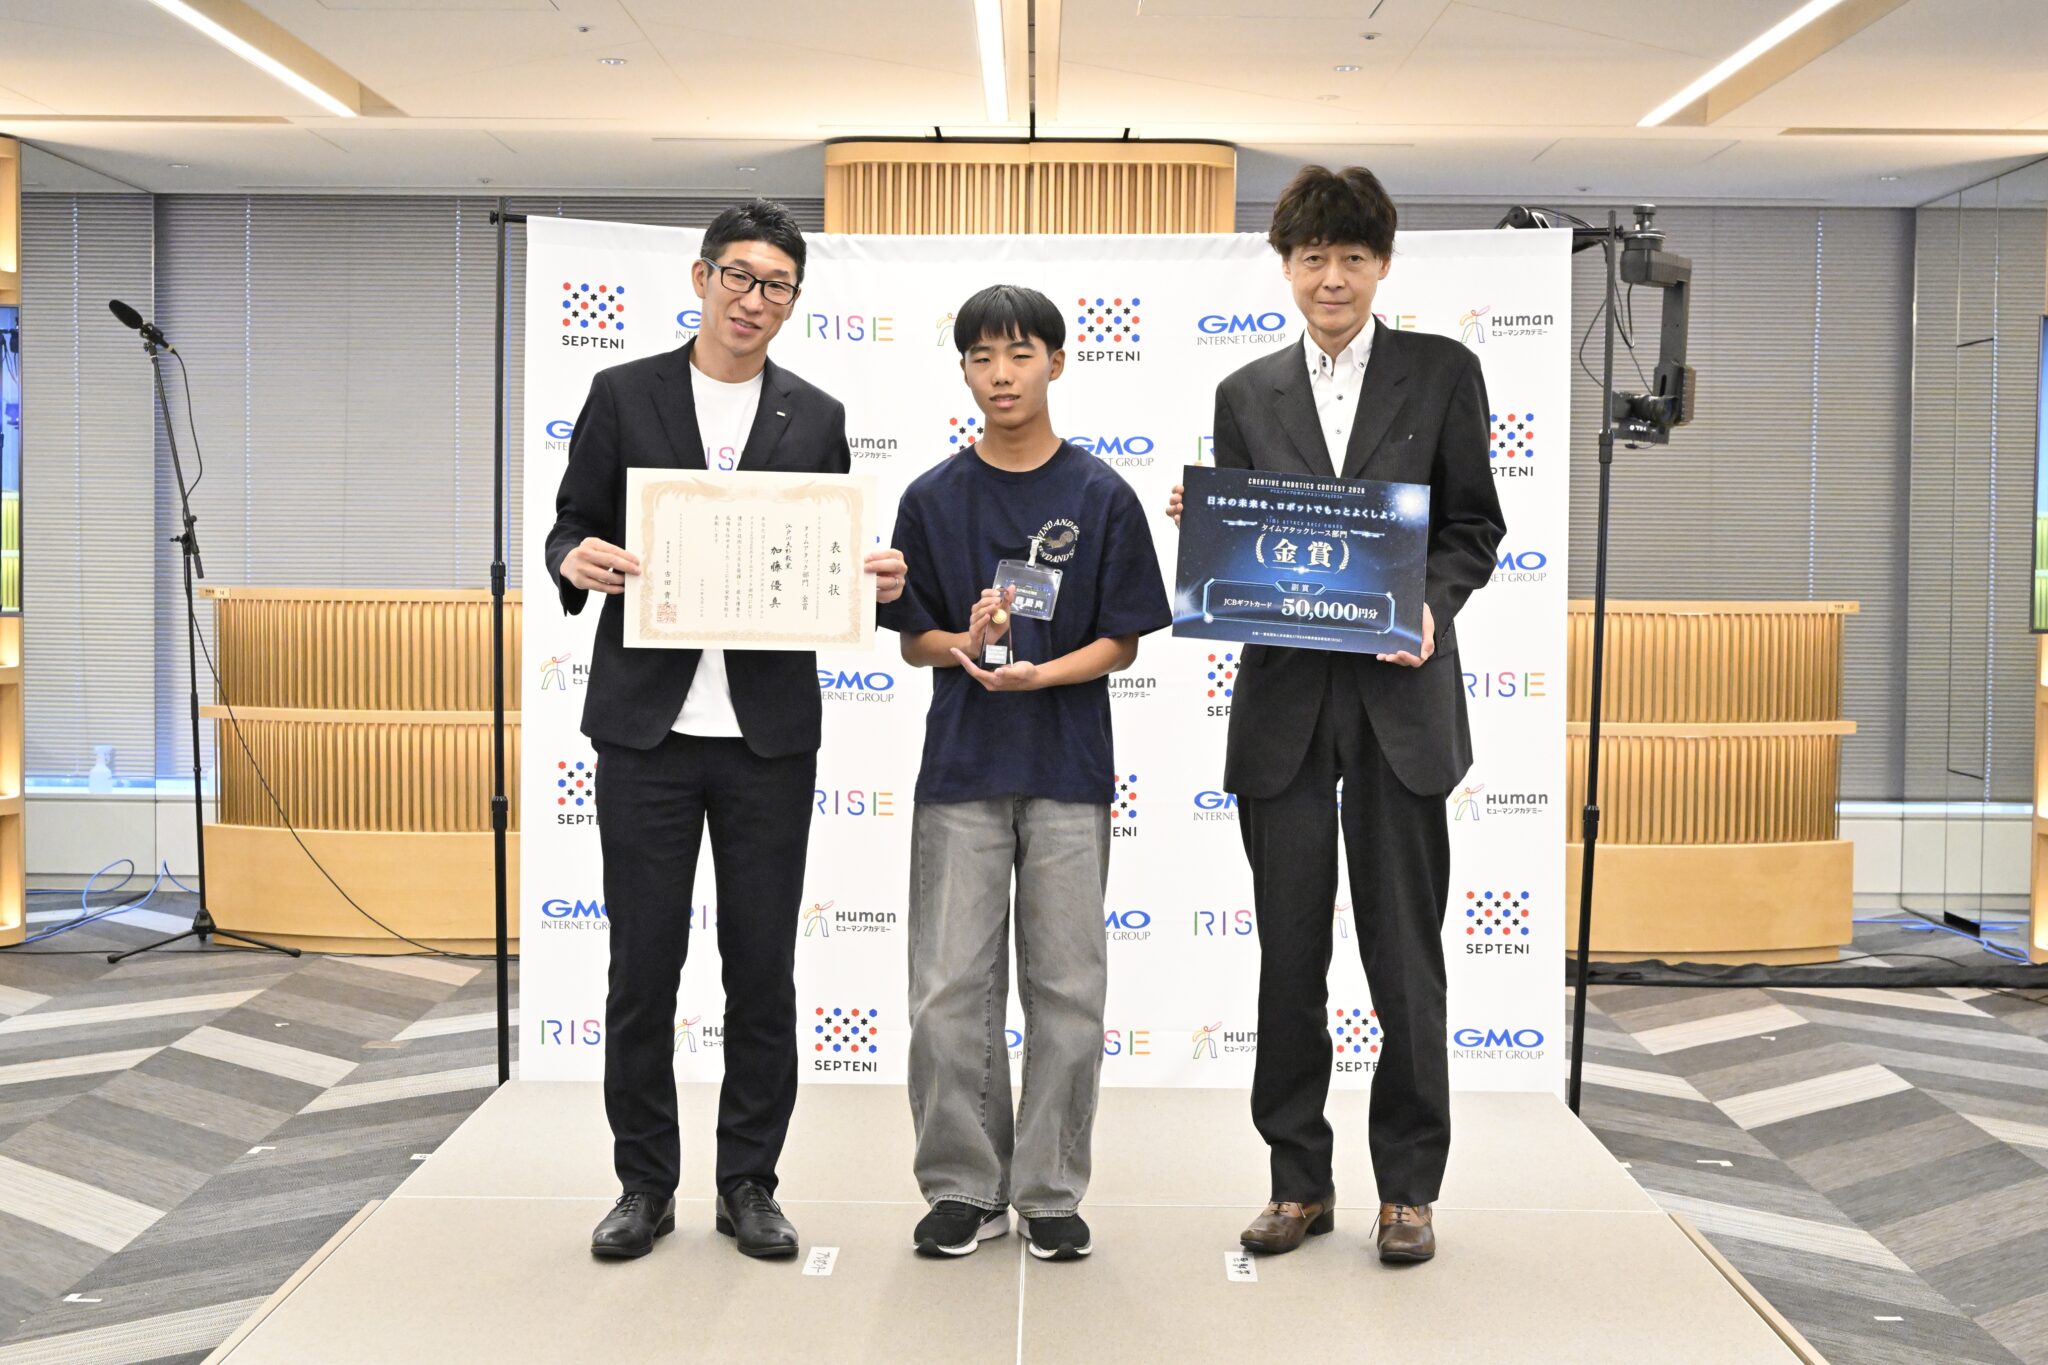
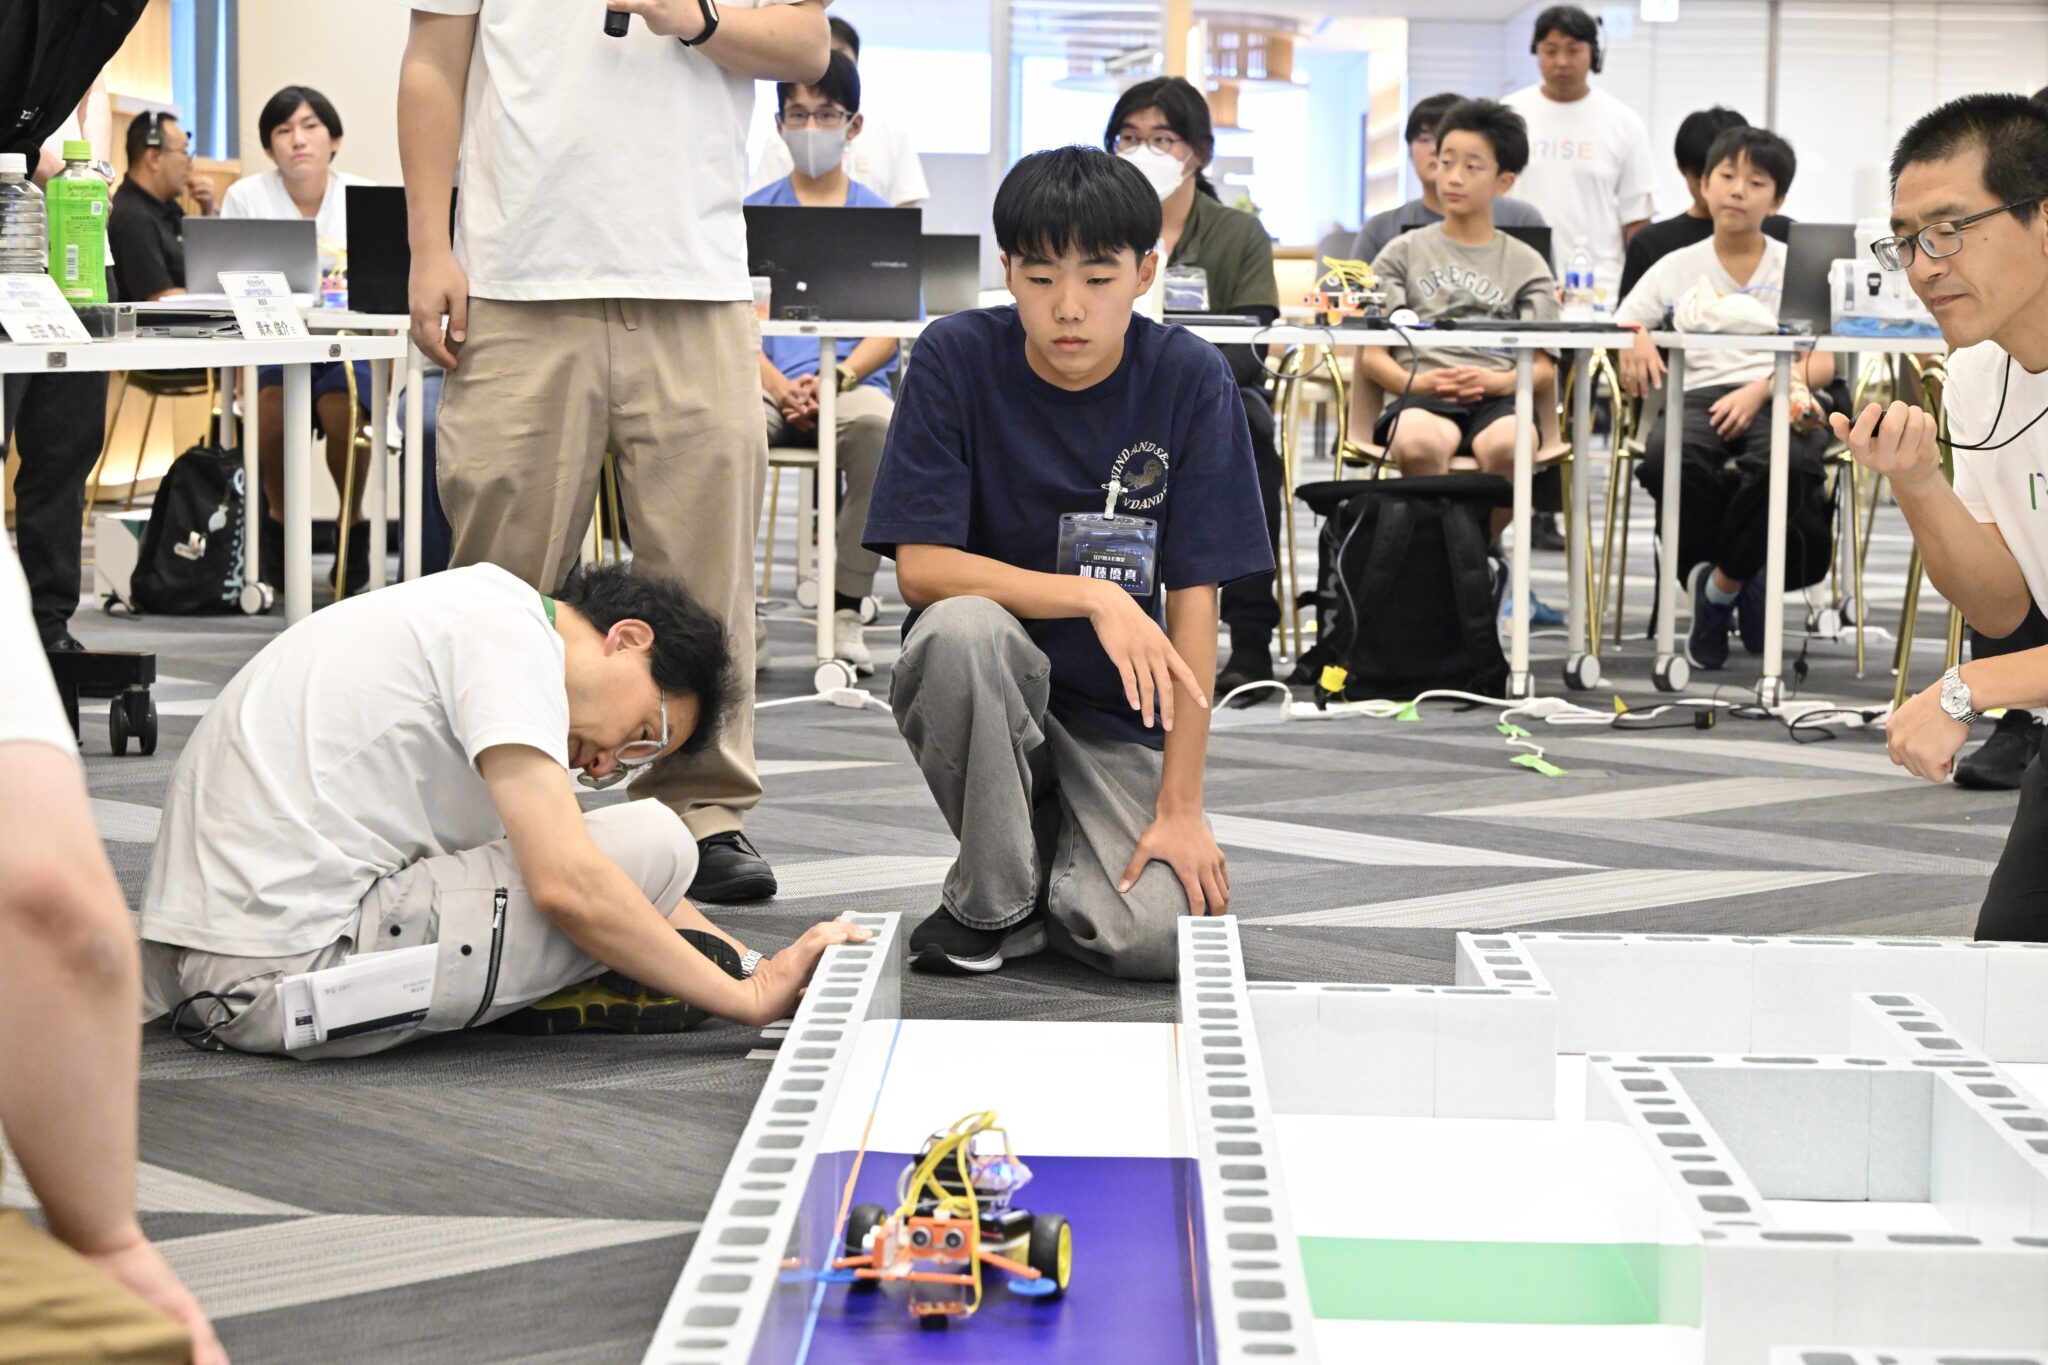
 「ヒューマンアカデミージュニア ロボット教室」は、ロボットクリエイターの高橋智隆氏をアドバイザーに迎え、2009年6月にスタート。未就学児(5~6歳)から中学生を対象に全国で展開し、教室数は2,000教室以上、在籍生徒数は27,000名を超えるロボットプログラミング教室です(※2026年3月末時点)。
 学びの面白さを提供する「Edutainment Company」として、1985 年の創設以来、時代や社会の変化にあわせながら800以上の講座を編成しました。未就学児童から中高生・大学生・社会人・シニア層とあらゆるライフステージにおけるSTEAM教育やリスキリング、学び直しの支援を行っています。
 1985年の創業以来「為世為人(いせいいじん)」を理念に掲げ、教育を中核に人材、介護、保育、IT、美容、スポーツと多岐にわたる事業を展開しています。


 学びの面白さを提供する「Edutainment Company」として、1985 年の創設以来、時代や社会の変化にあわせながら800以上の講座を編成しました。未就学児童から中高生・大学生・社会人・シニア層とあらゆるライフステージにおけるSTEAM教育やリスキリング、学び直しの支援を行っています。



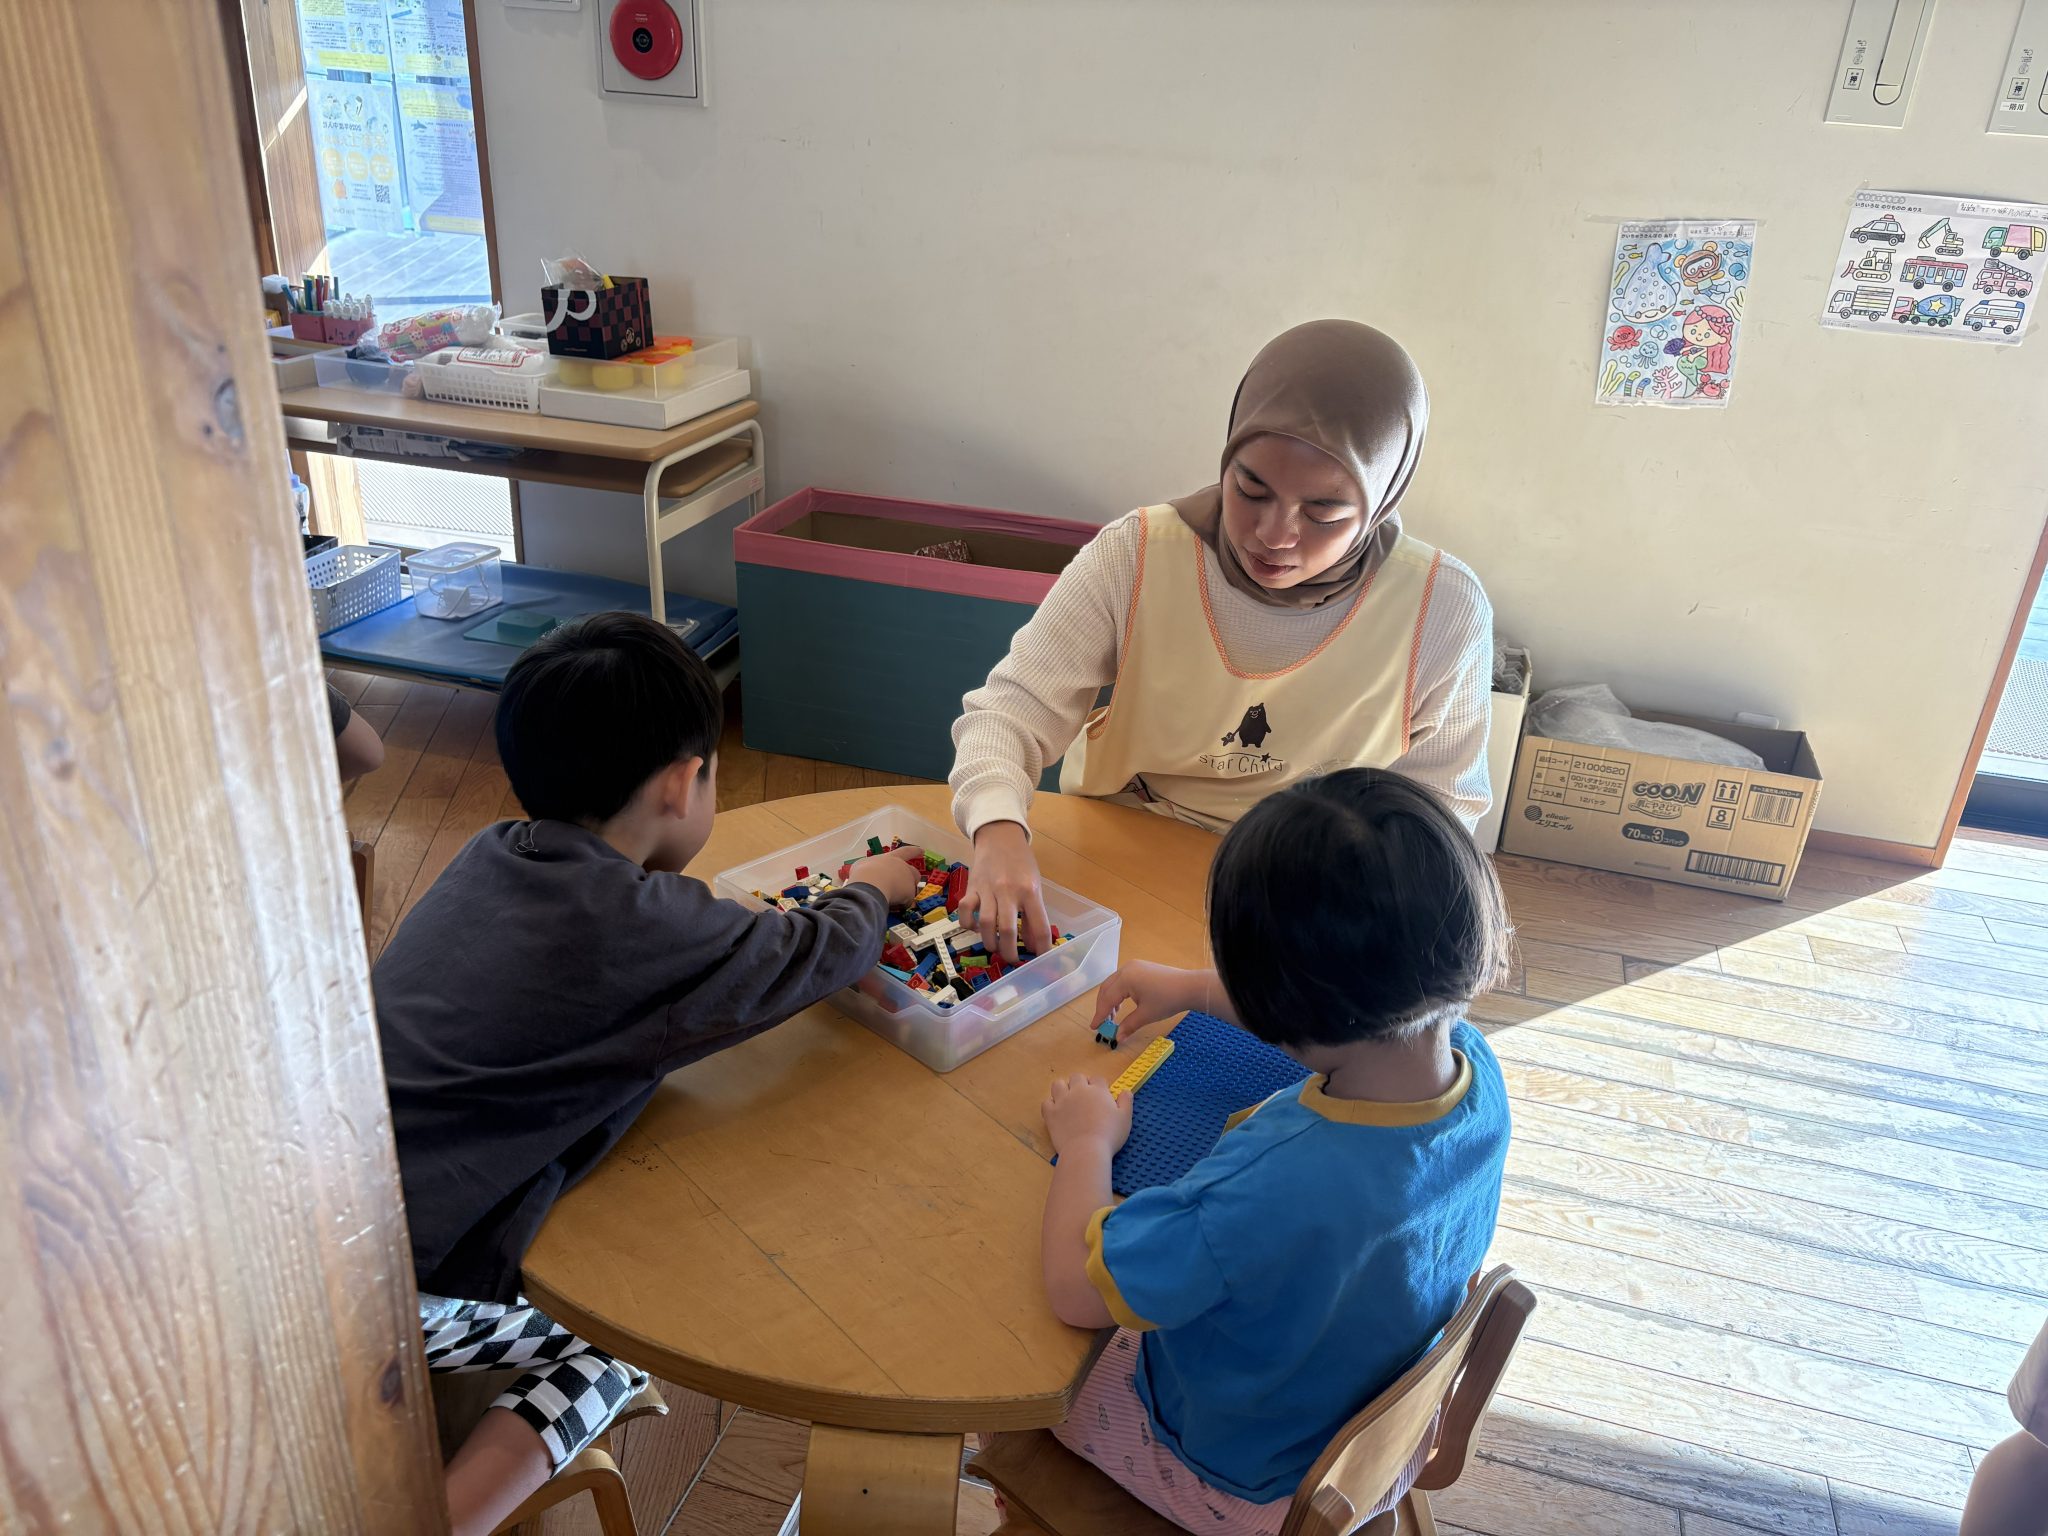

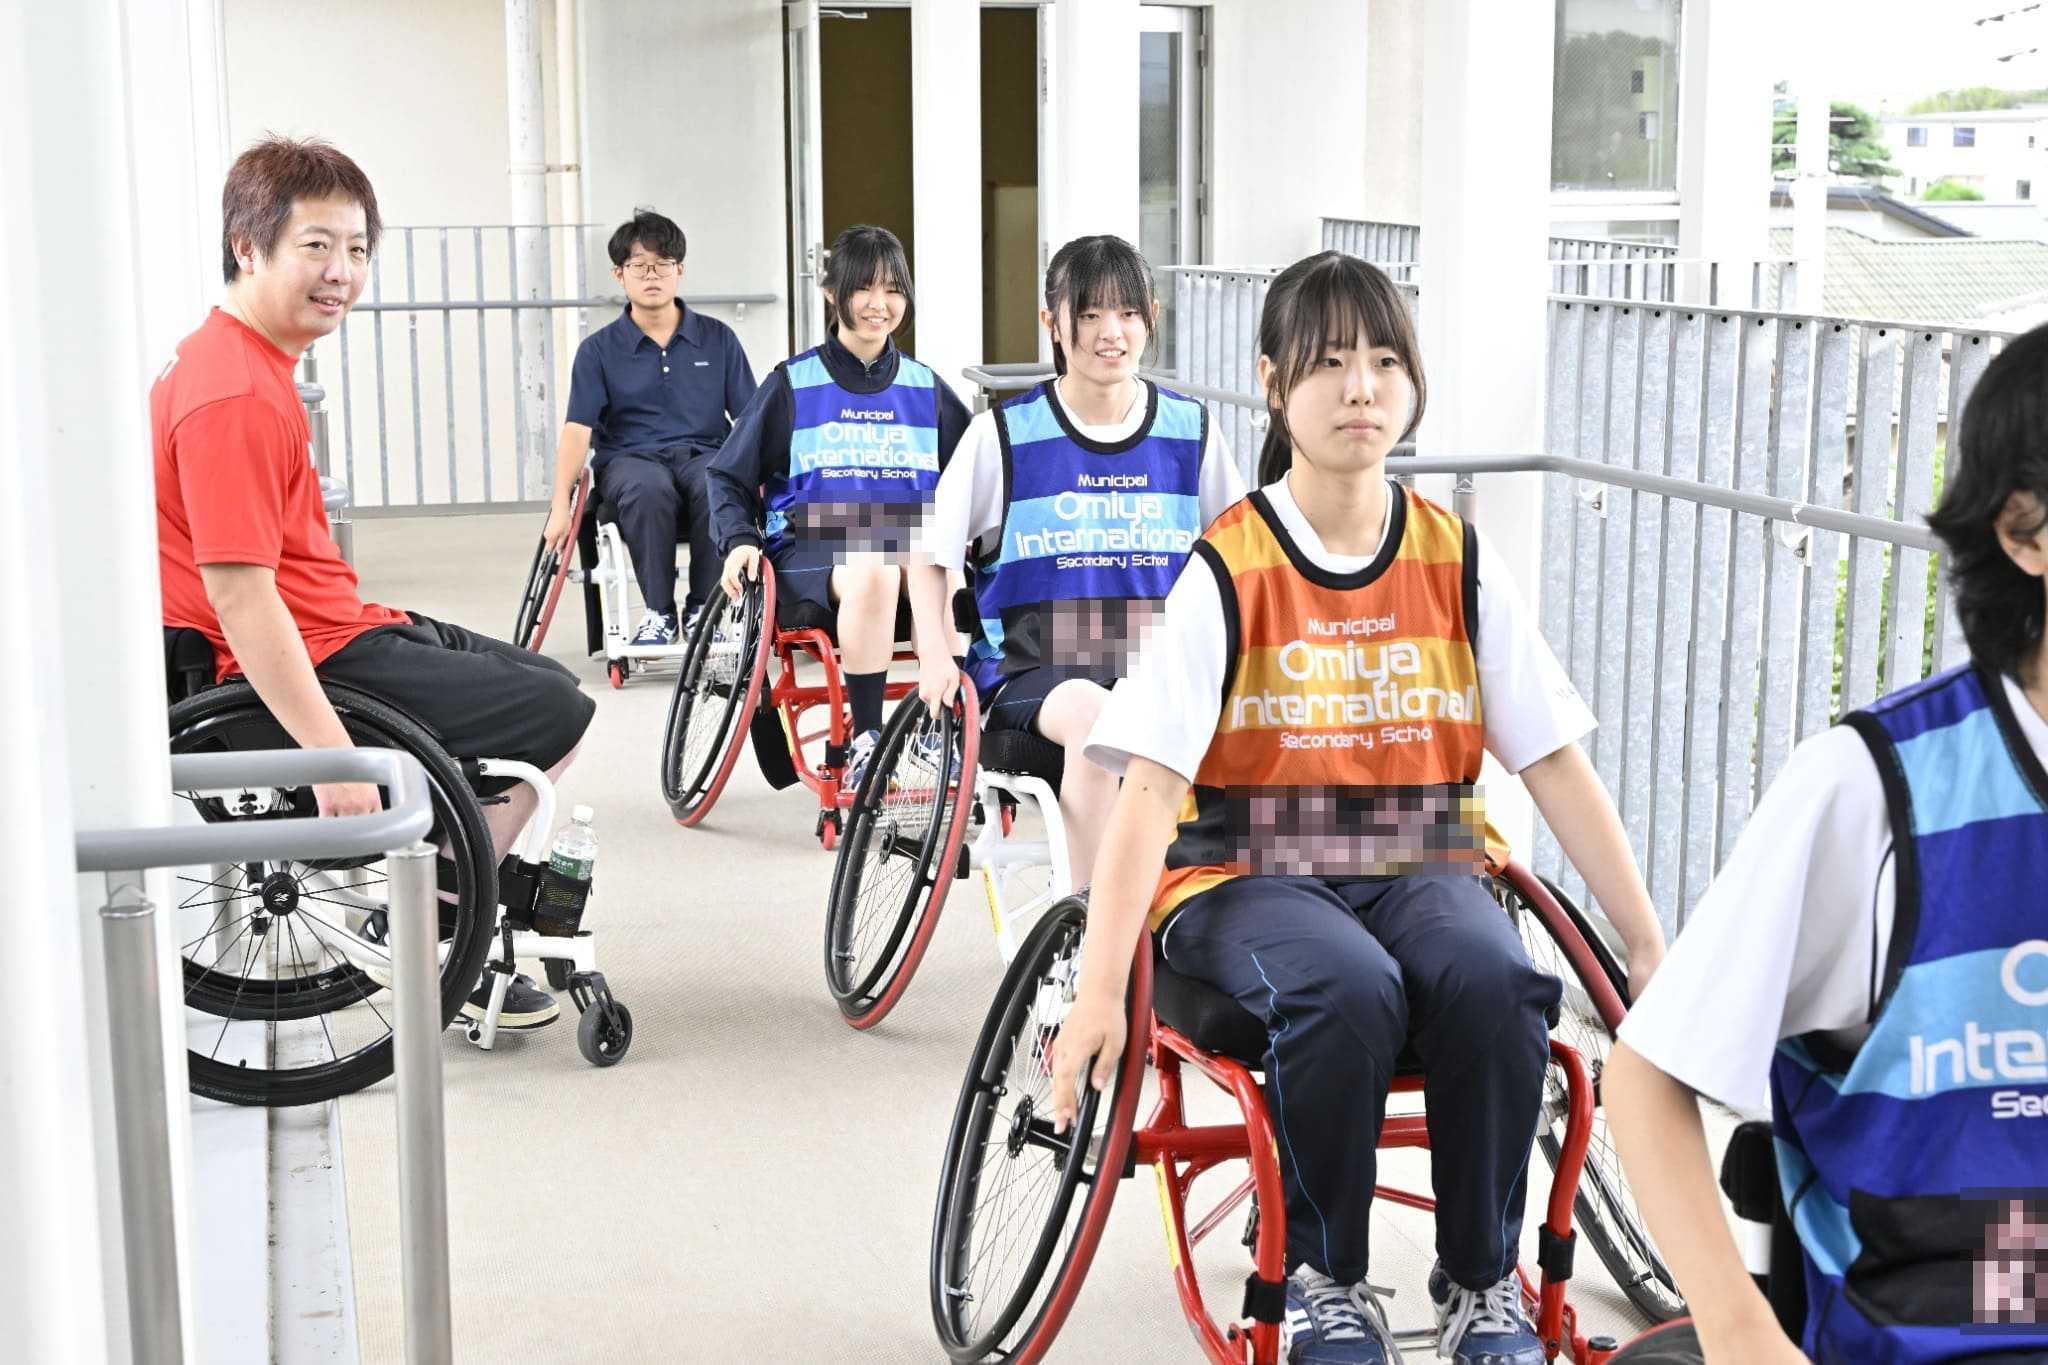
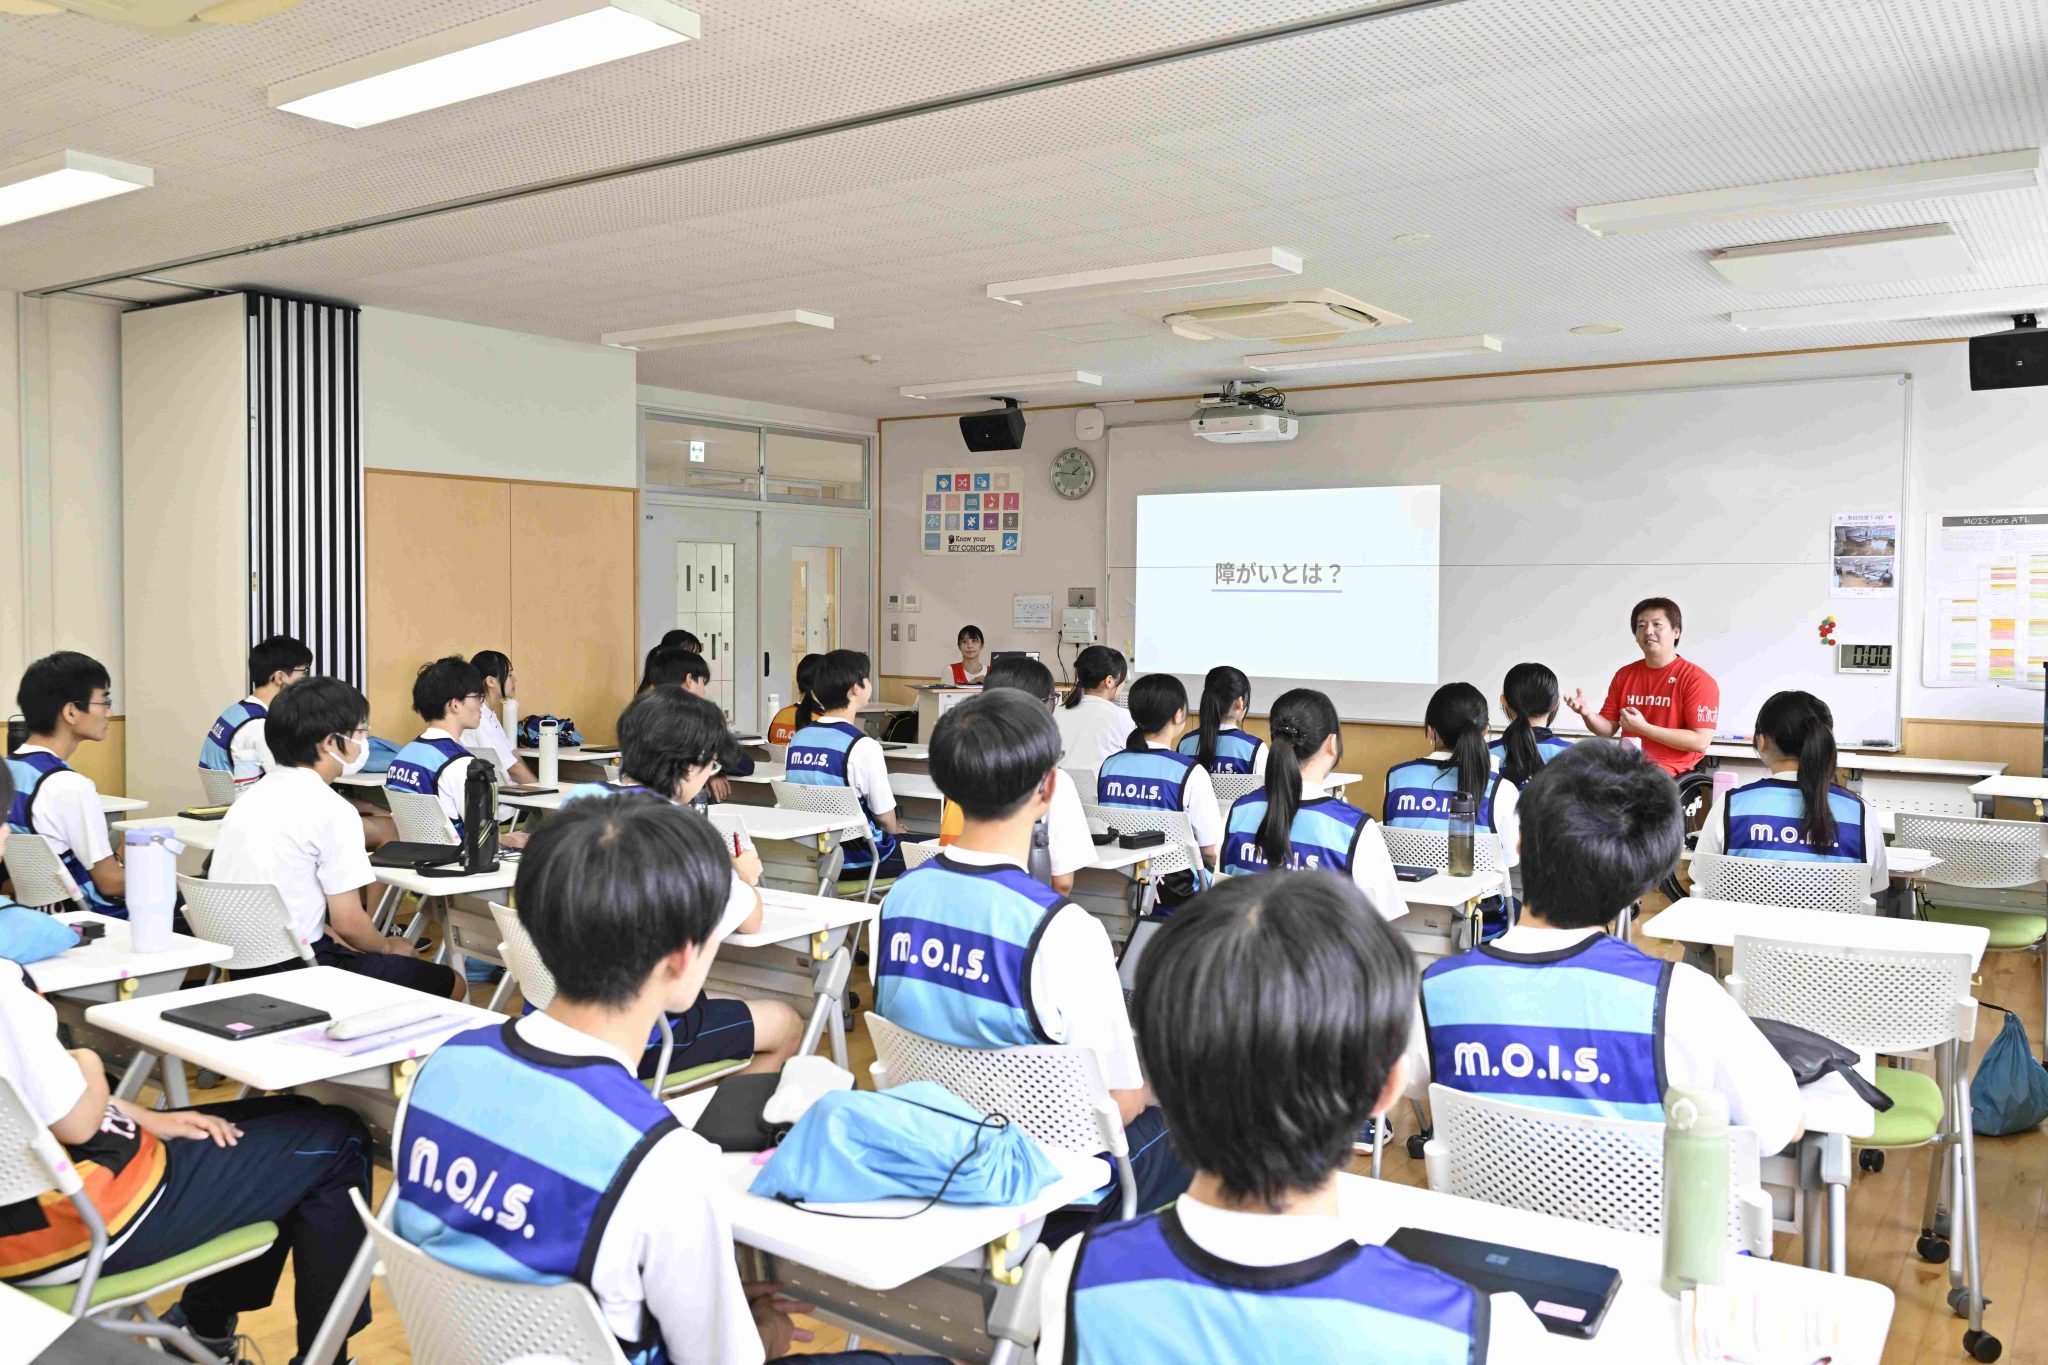
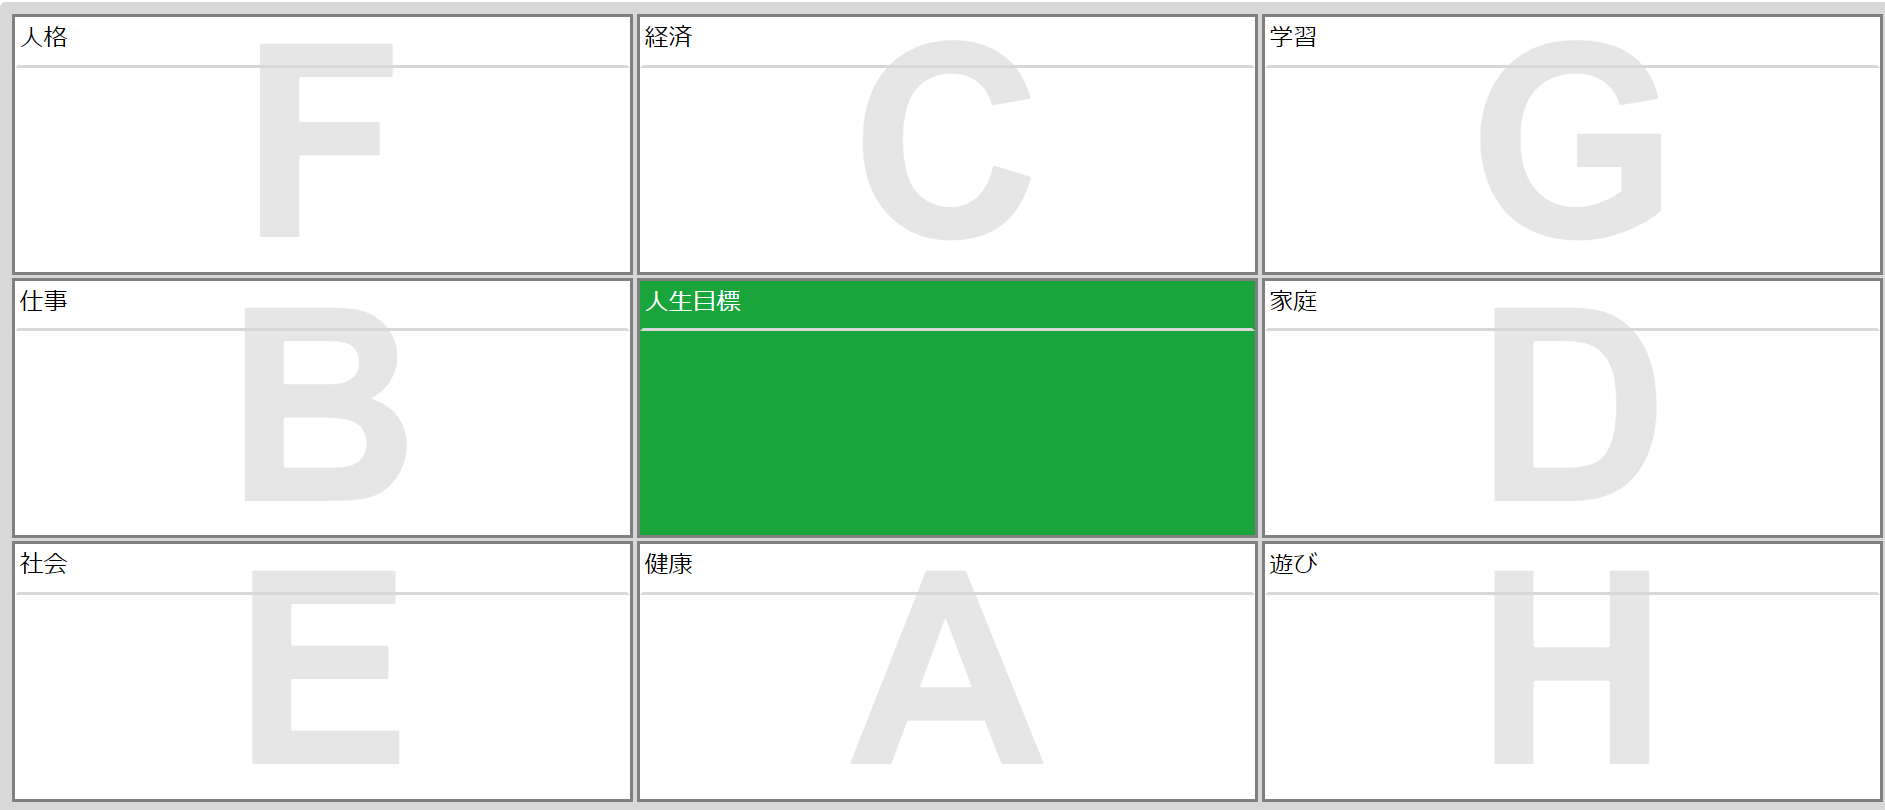
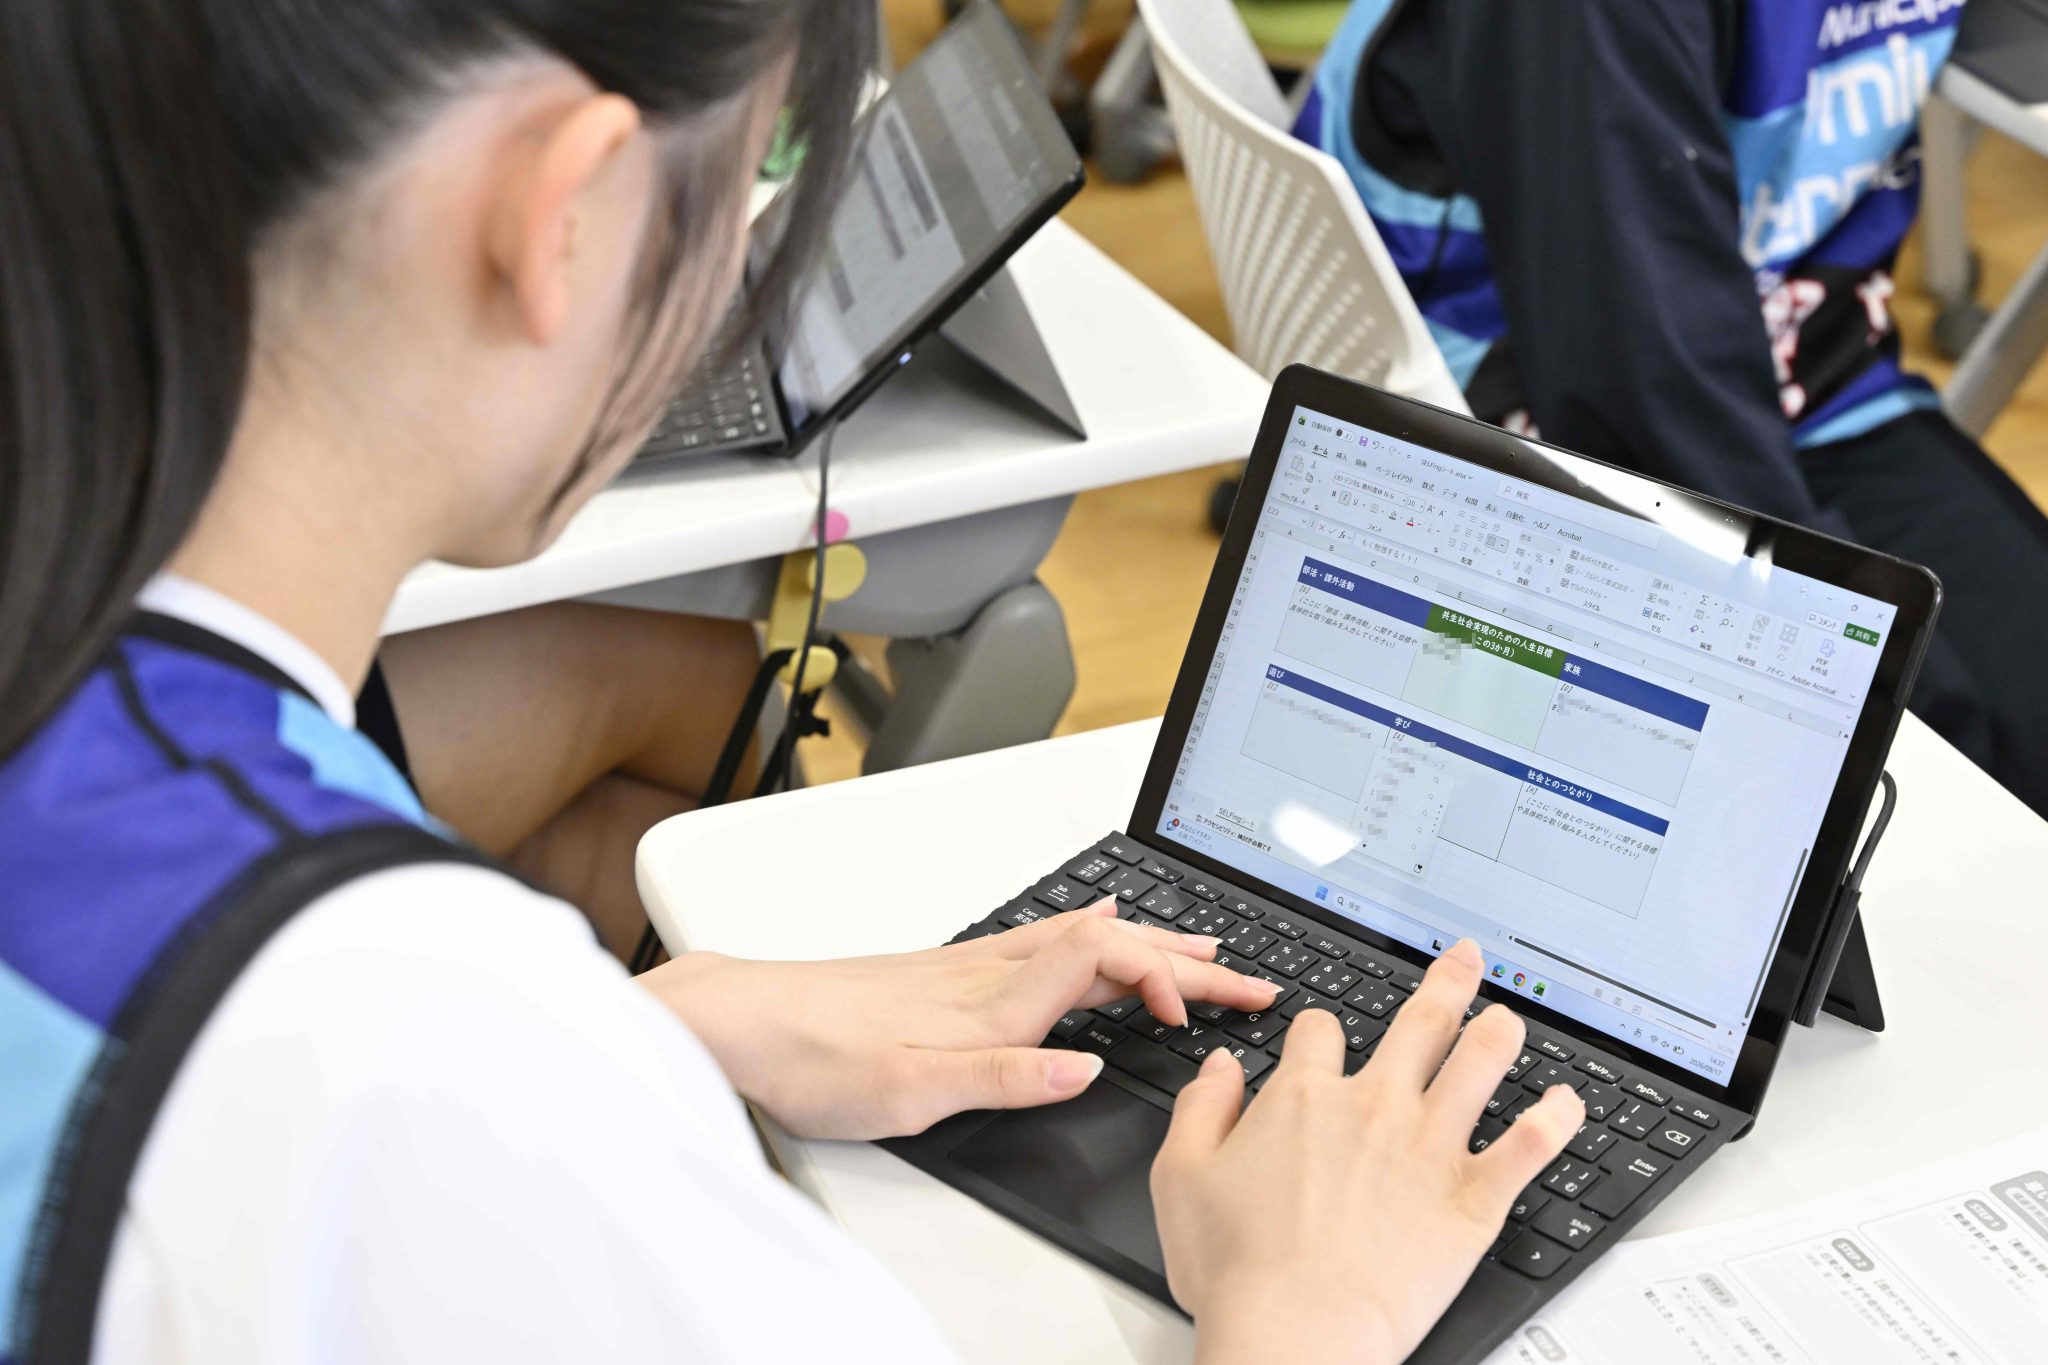
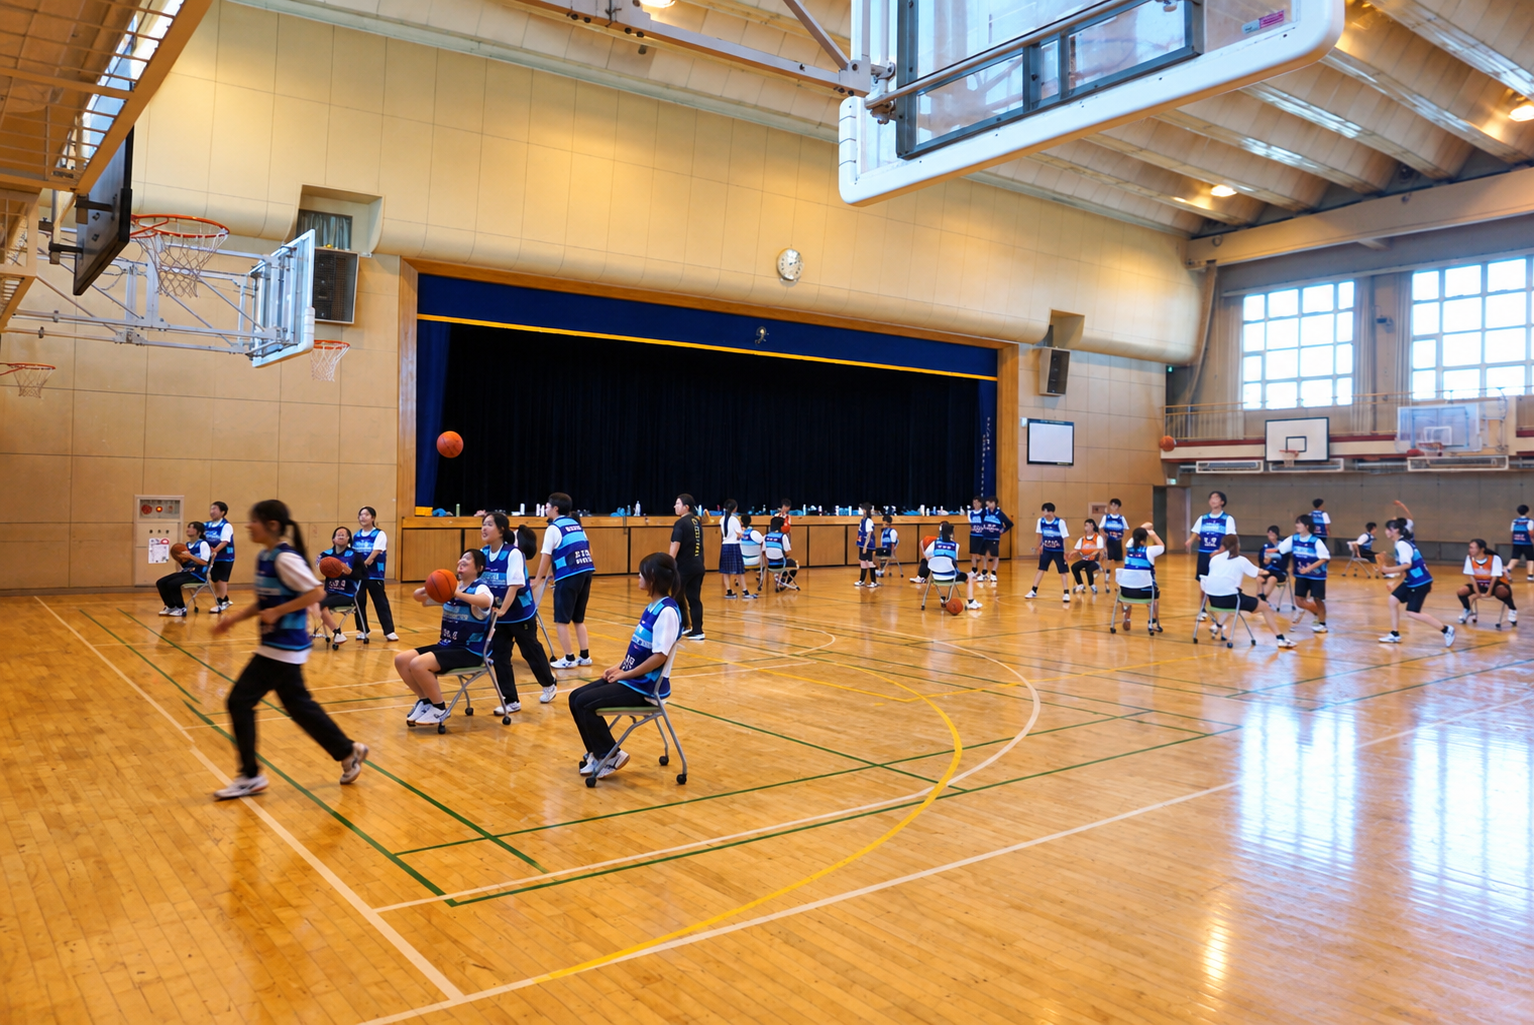
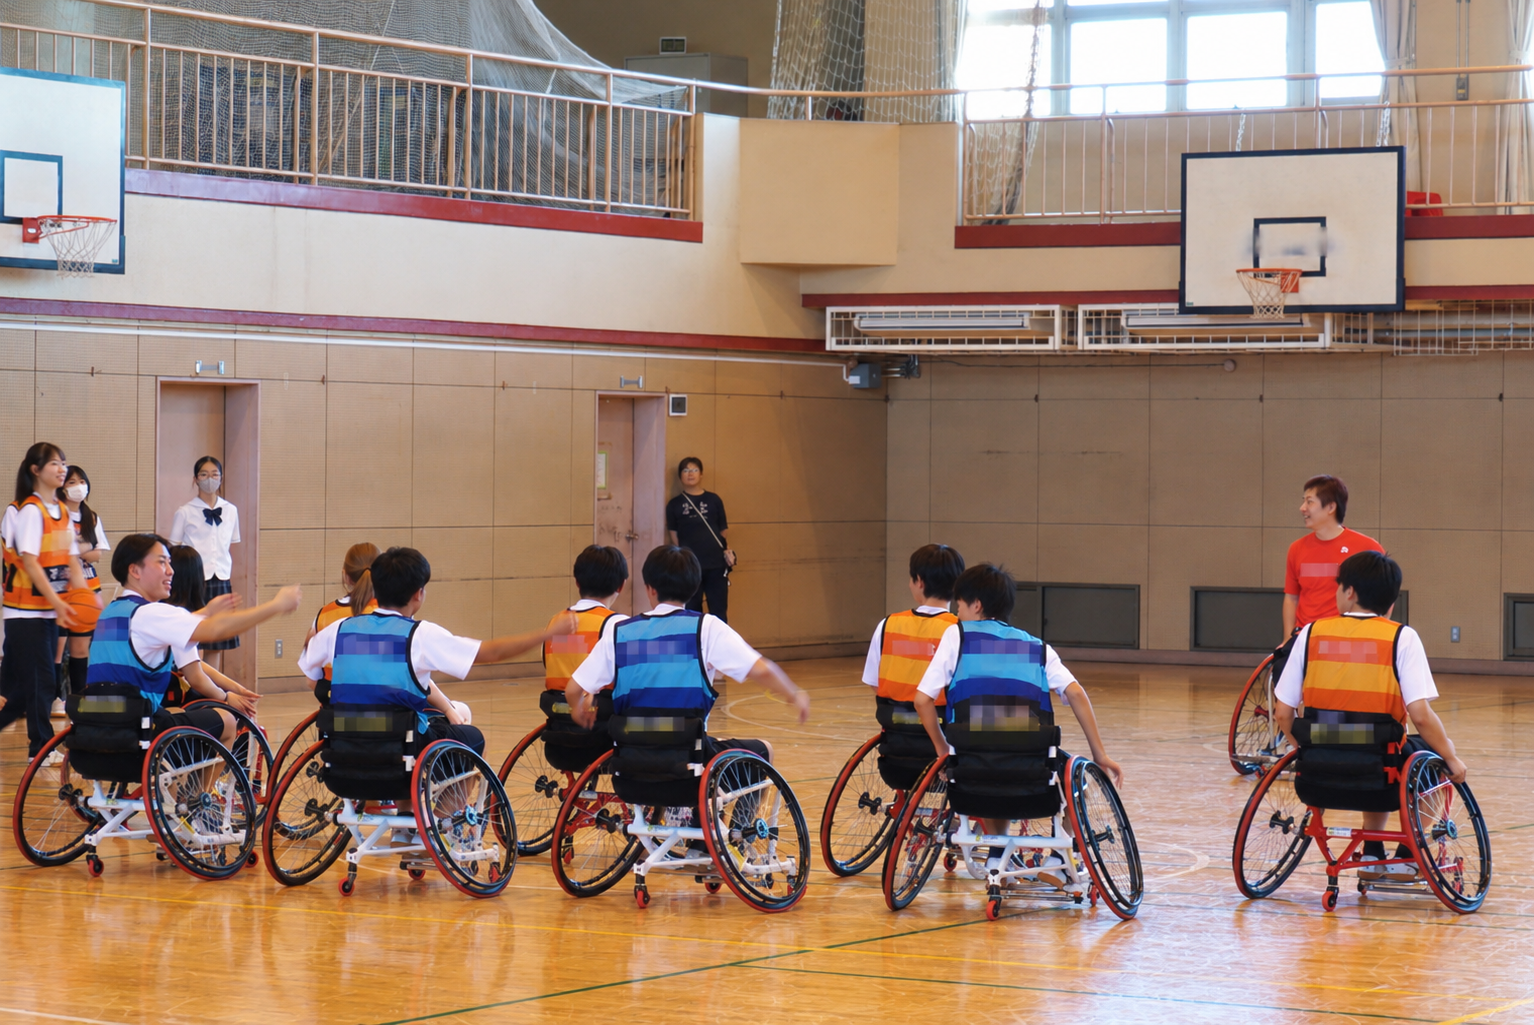
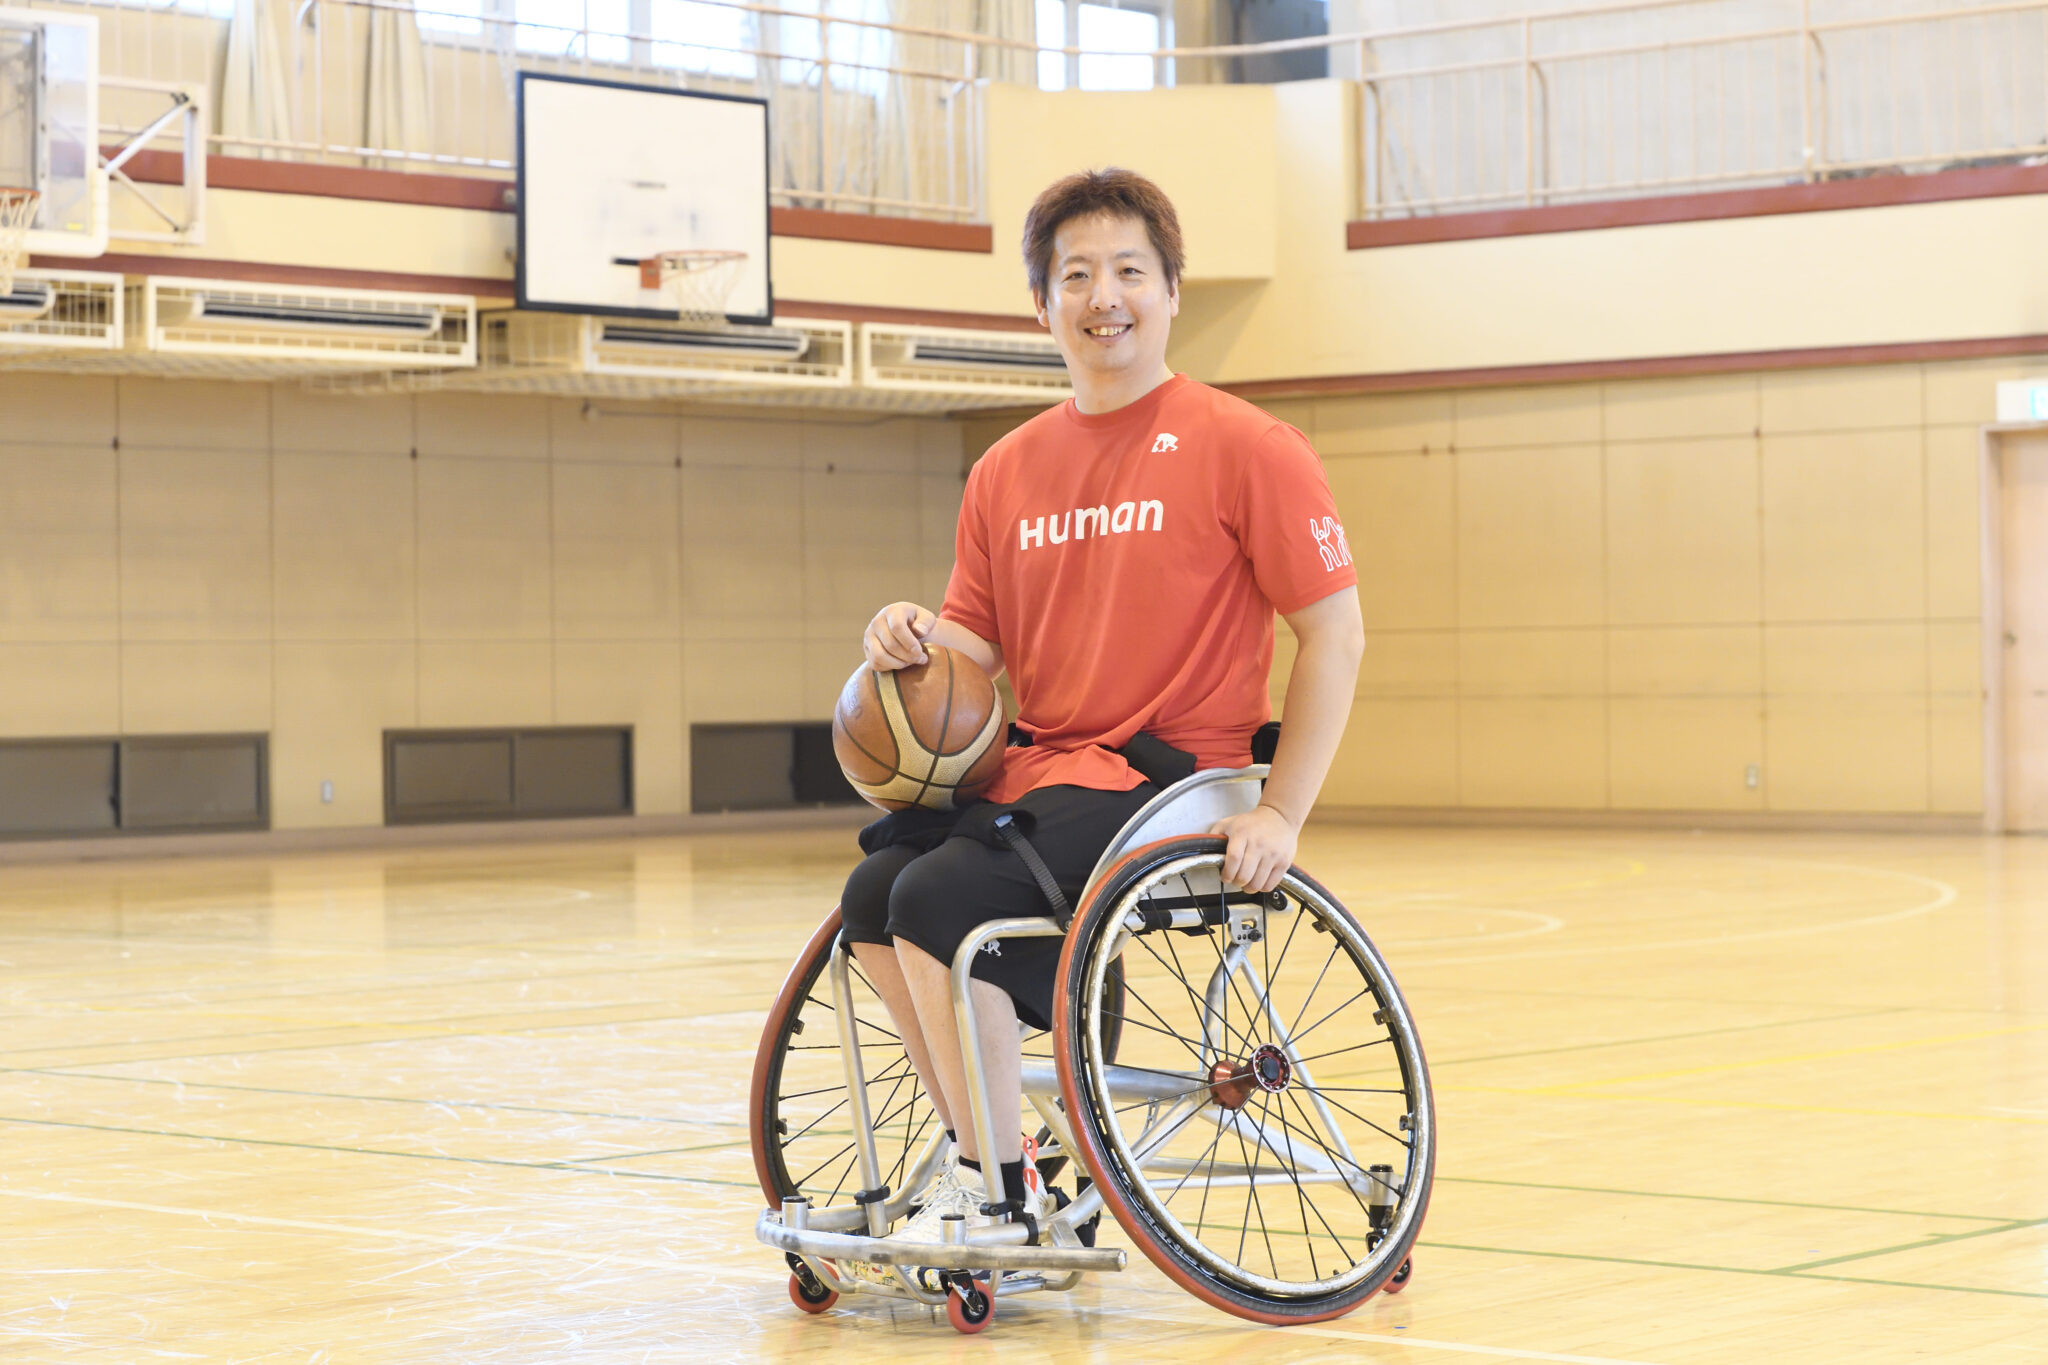


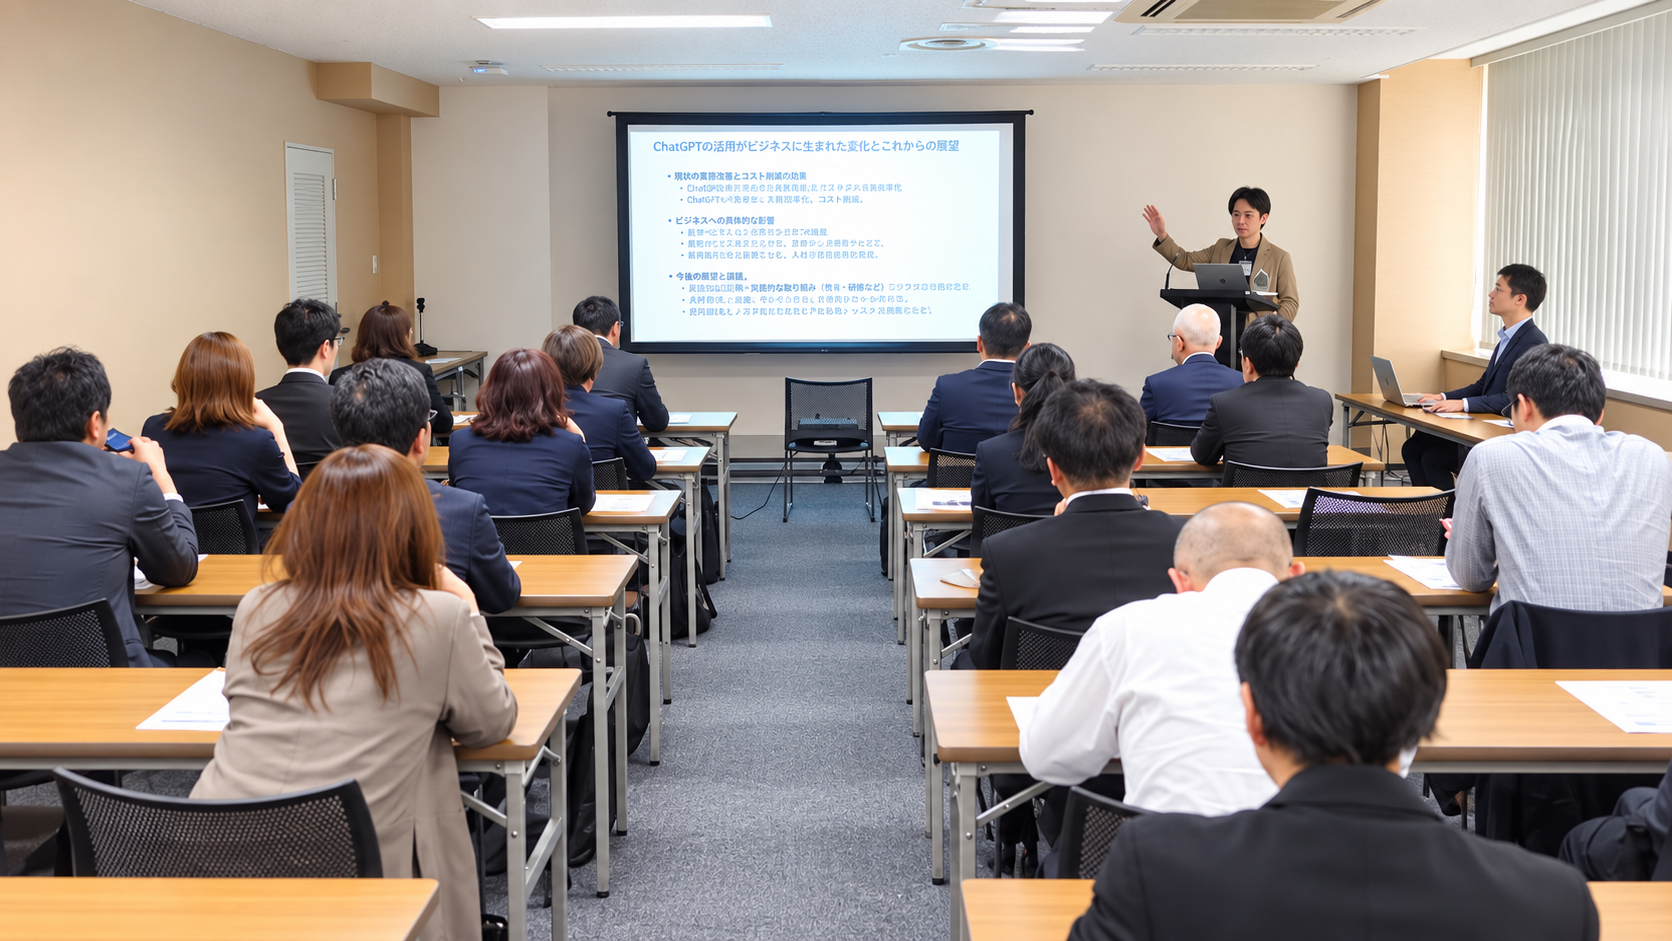
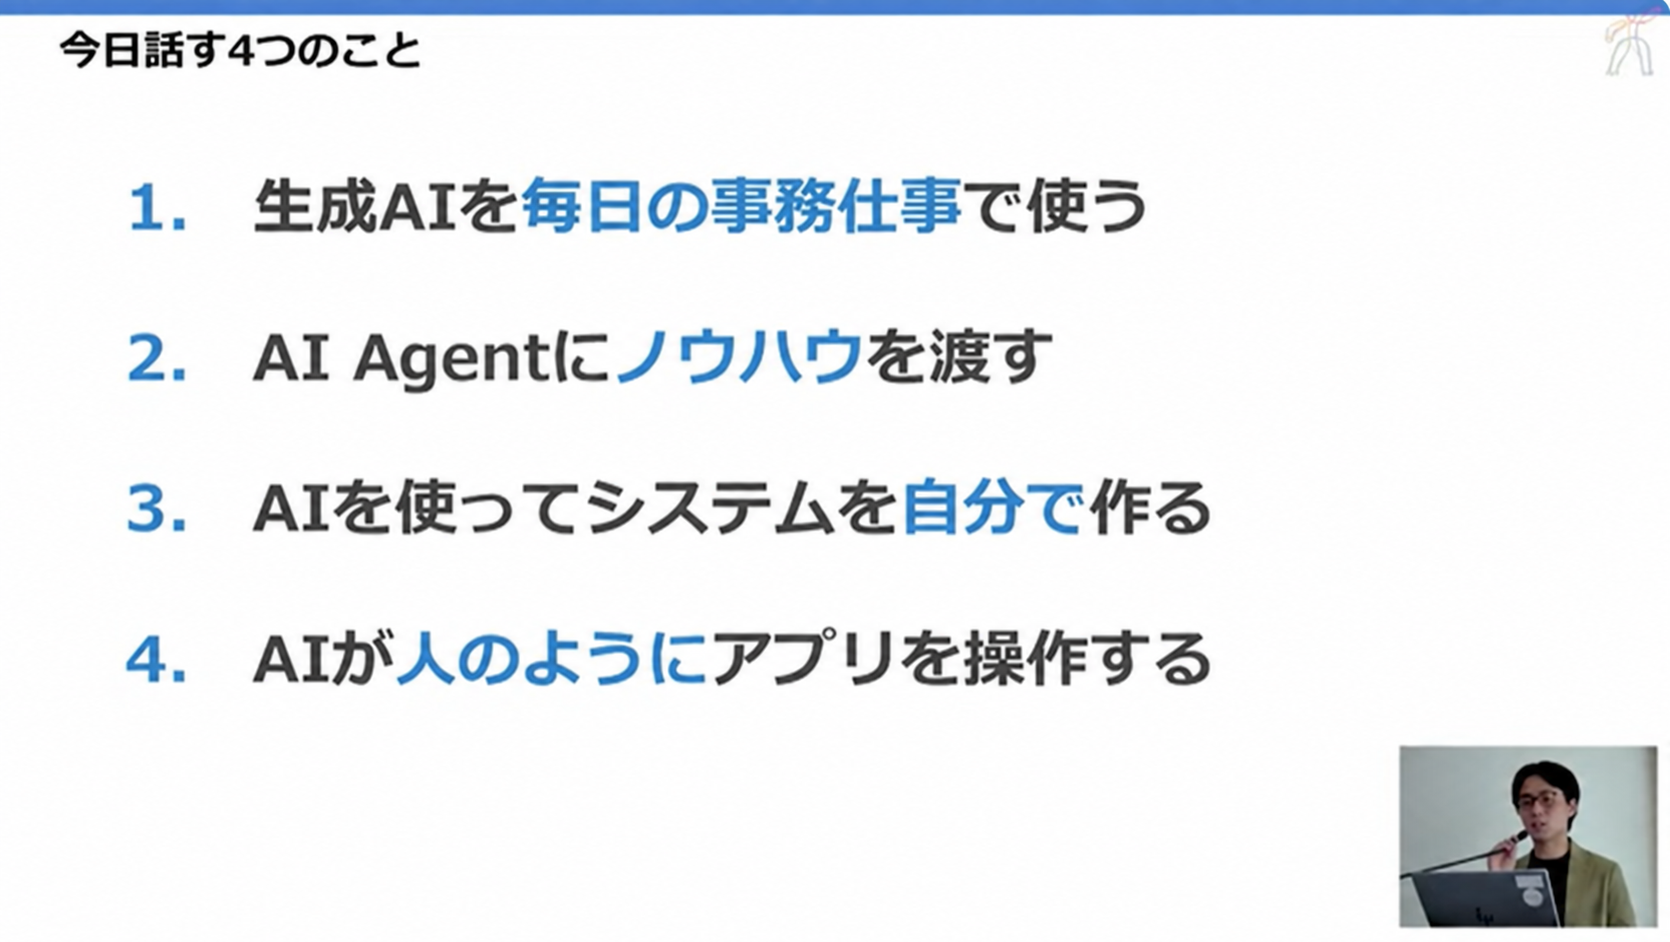
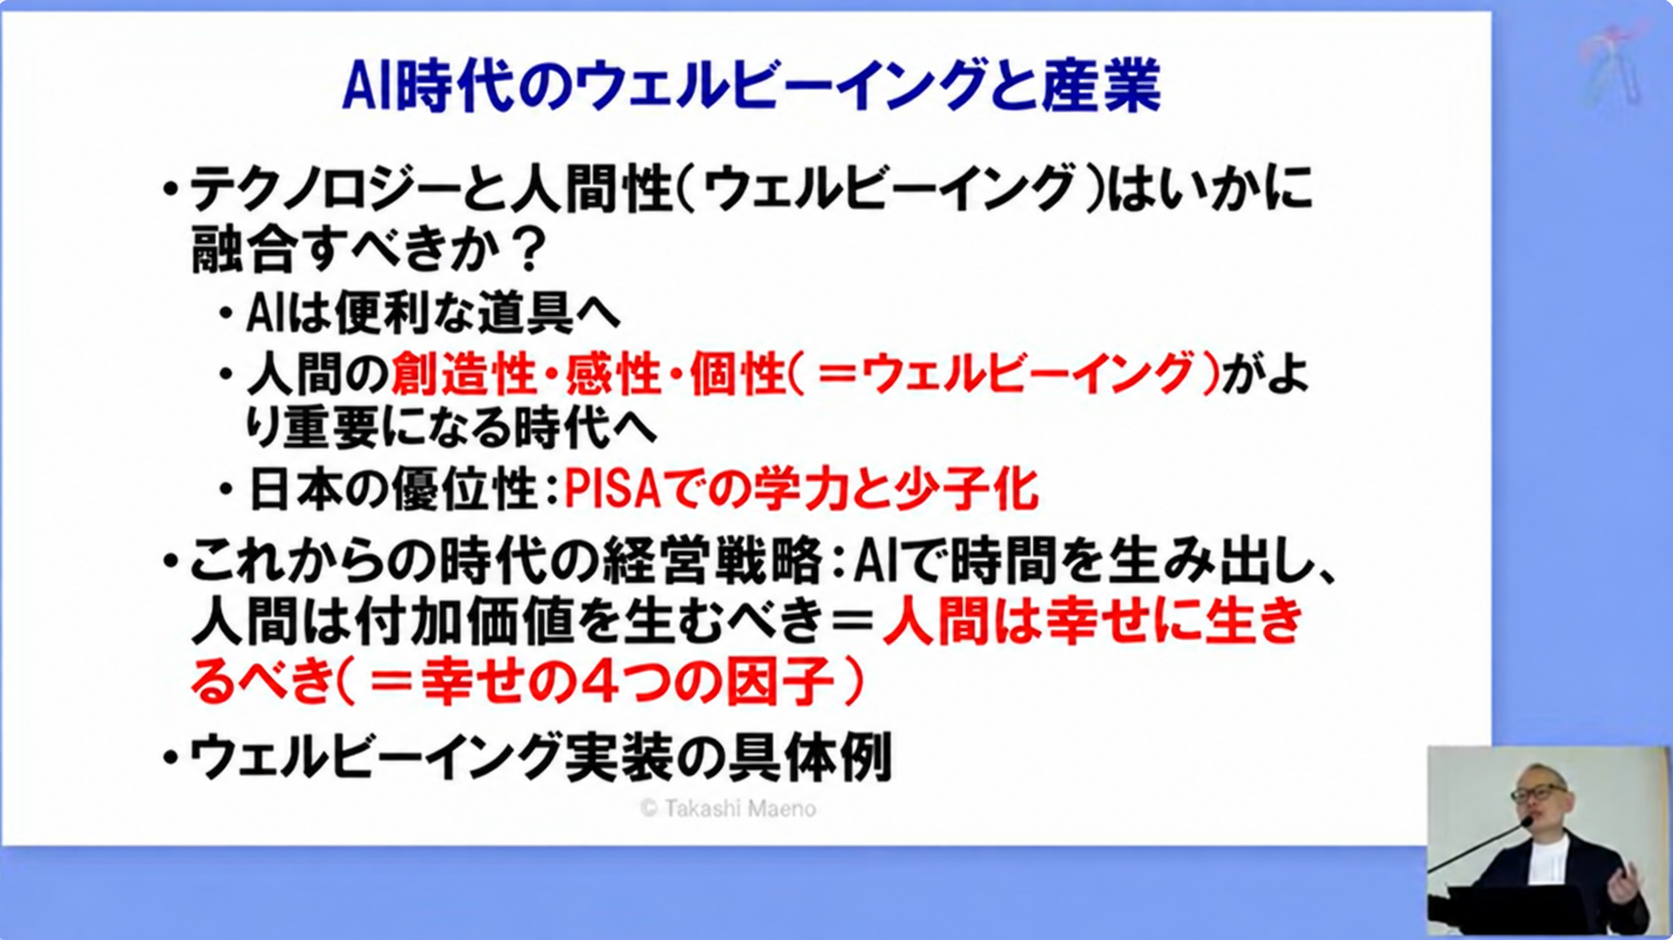


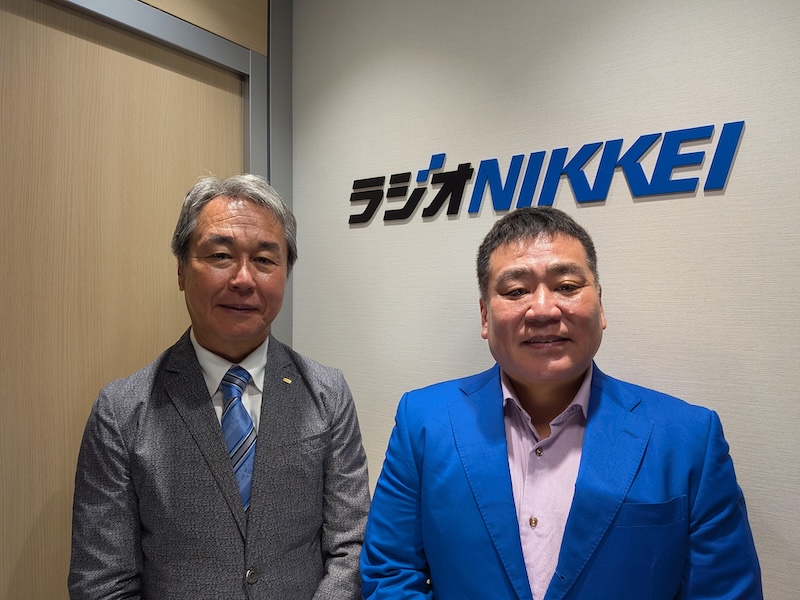
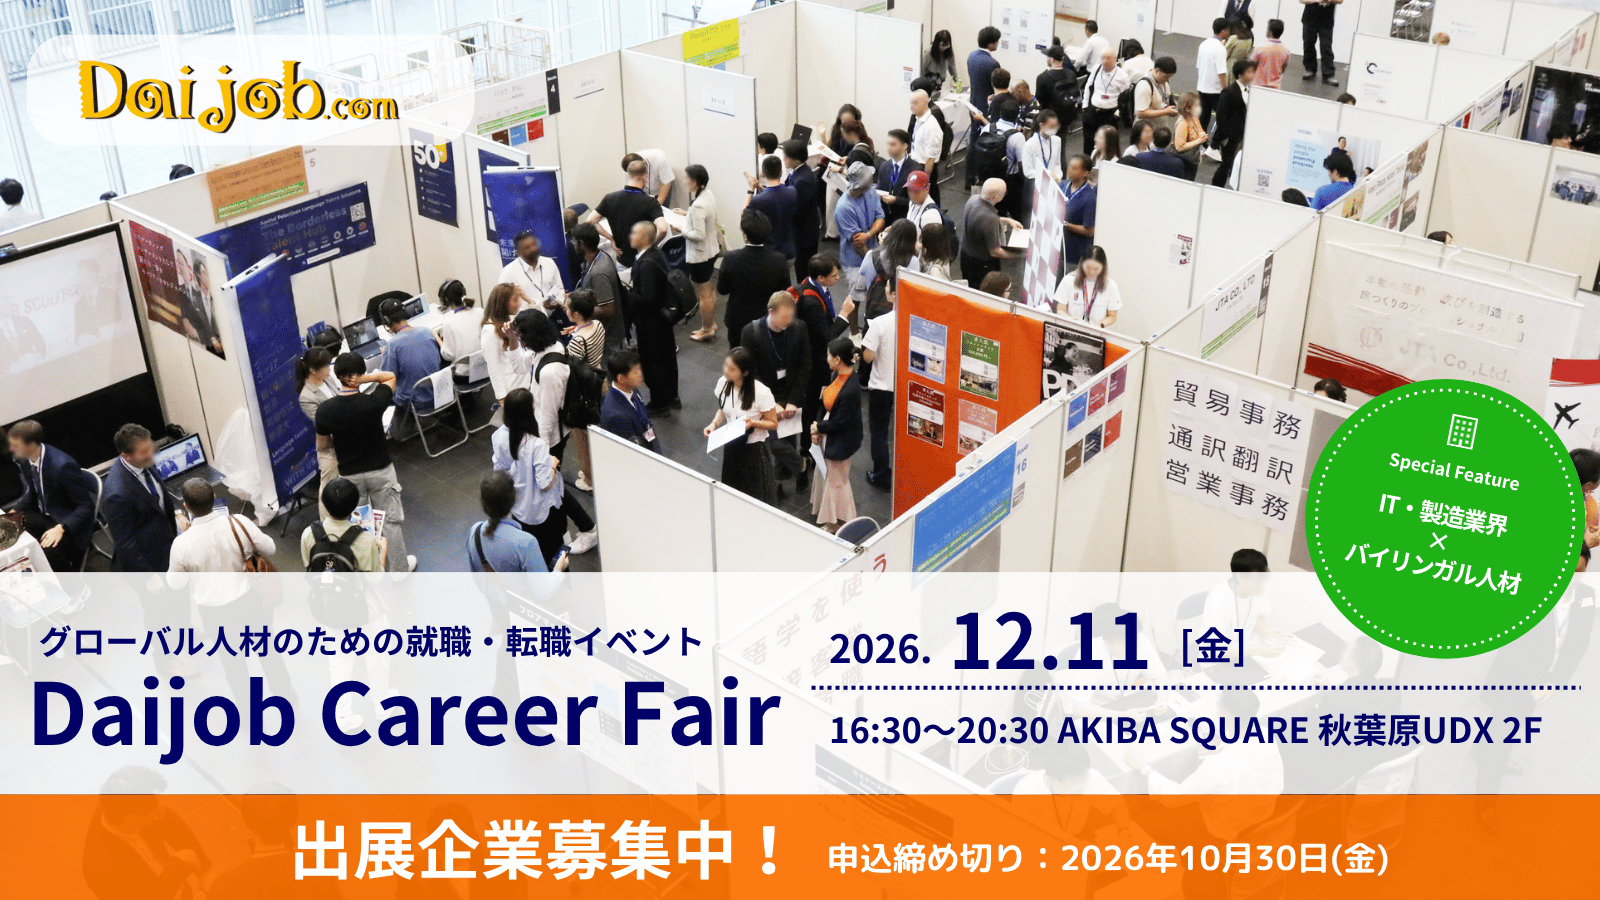
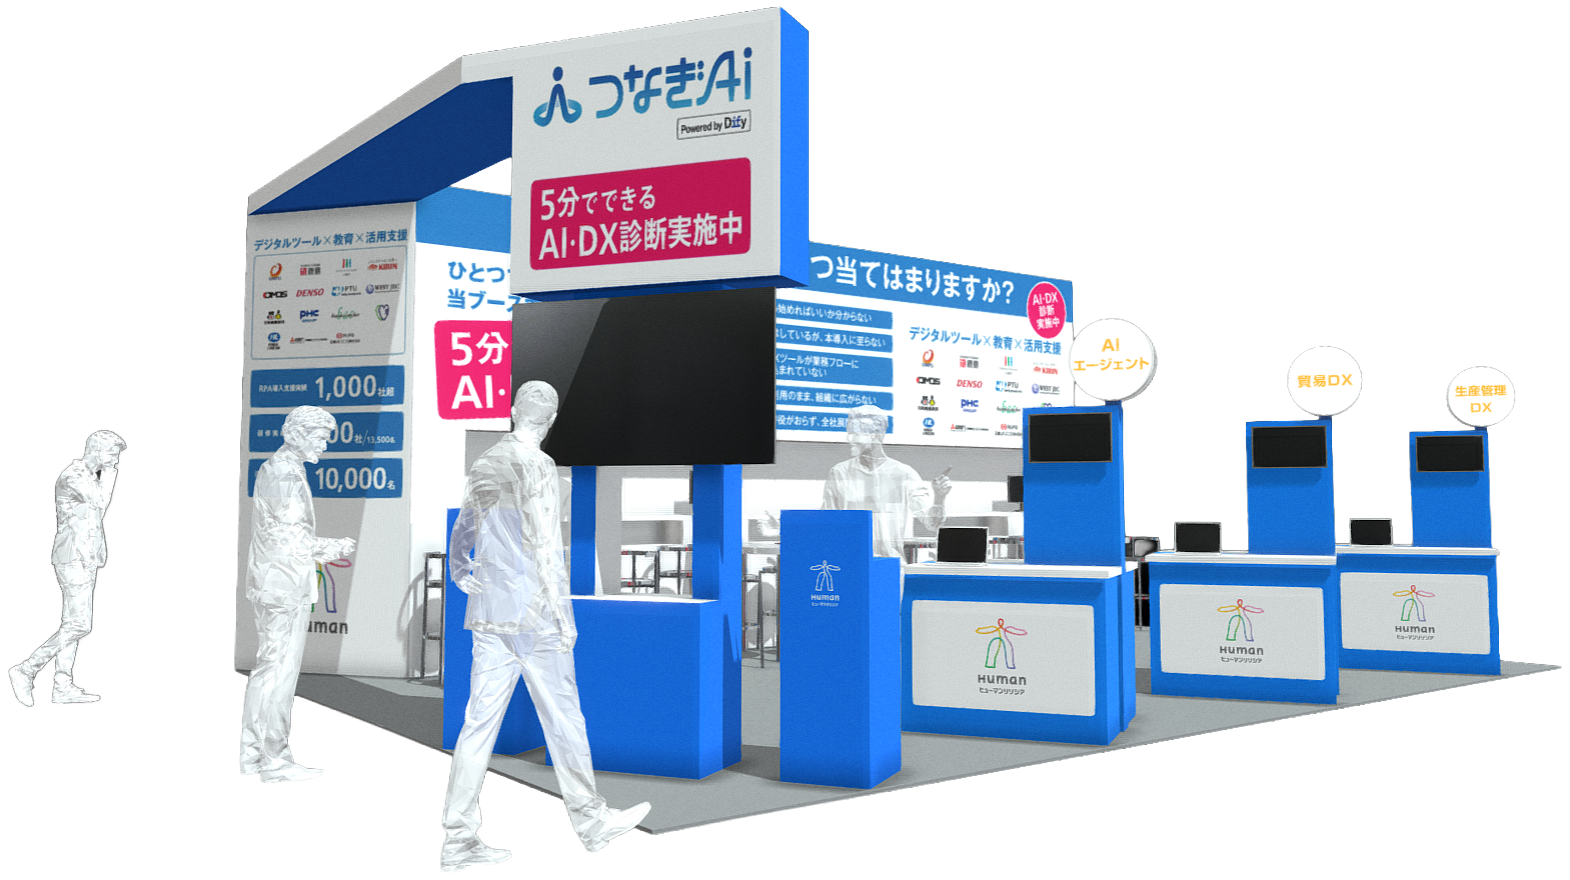
 展示会名 : 第10回 AI・業務自動化展(「Japan DX & AX Week 秋」内)
 多くの企業より、ツールを導入しても、「組織での成果につながらない」、「部分的な効率化や自動化にとどまっている」といった課題が寄せられています。そこで、当社ブースでは、自社のAI活用やDX推進に関する課題を5分で可視化する「AI・DX診断」を実施します。「AIをどのように業務に活用するか」「業務改善をどこから進めるか」を検討する入口として、自社の現状を振り返る機会を提供します。
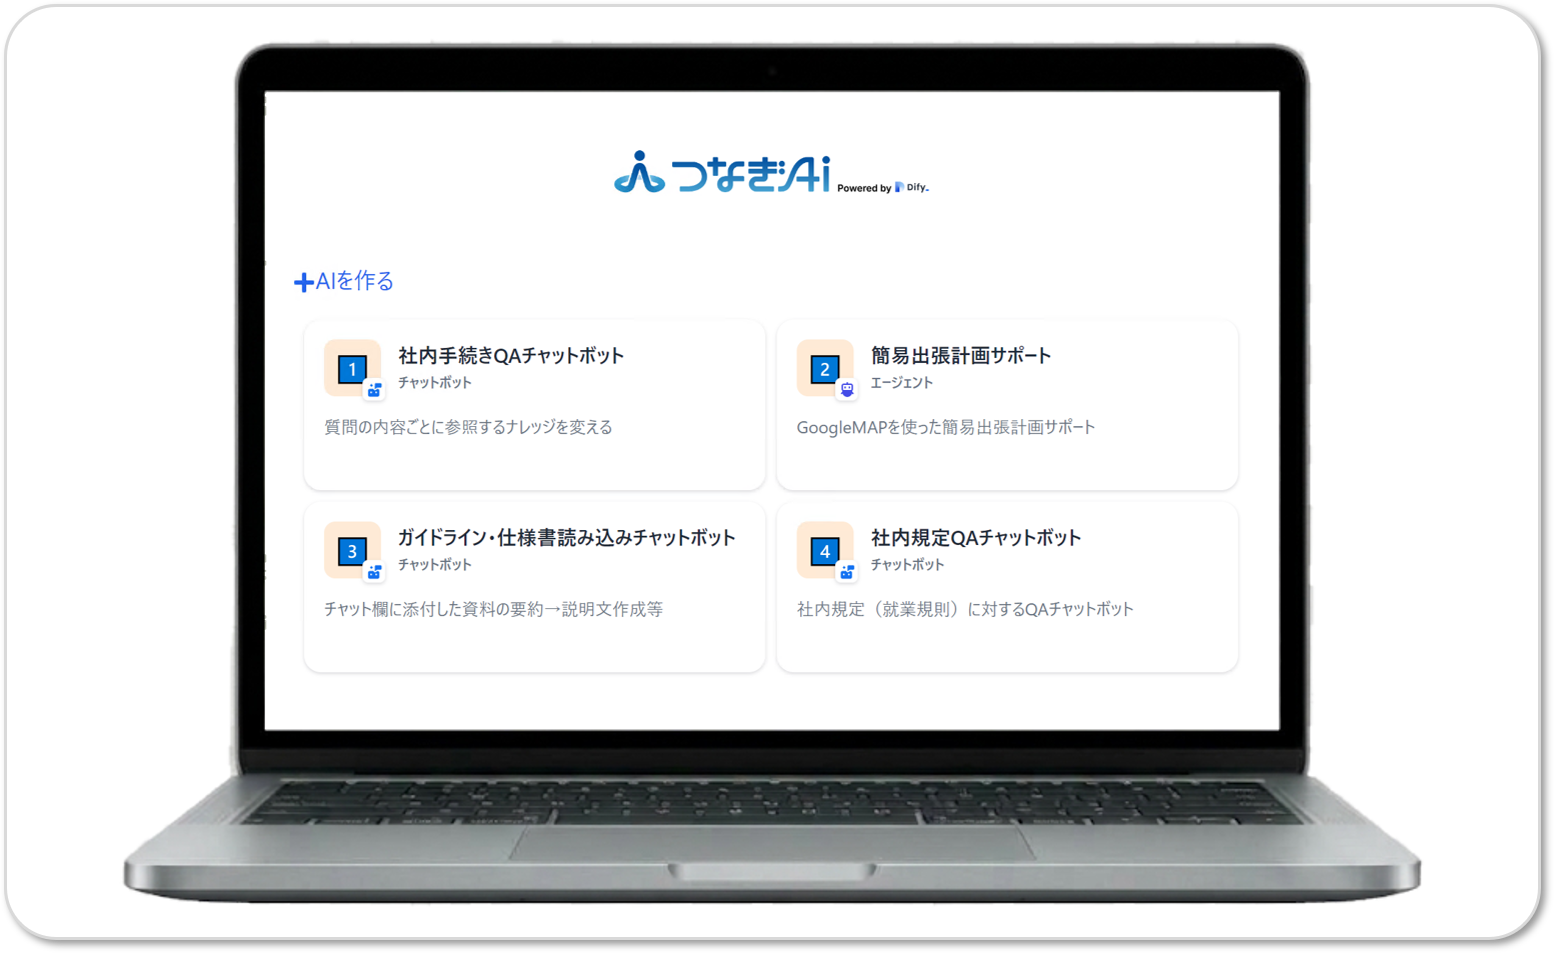 AIエージェント開発基盤「つなぎAI」を中心とした実機デモを体験いただけます。AIを業務プロセスに組み込み、自動化・効率化につながる具体的な活用方法を、自律的な作業実行をお見せしながら、紹介します。
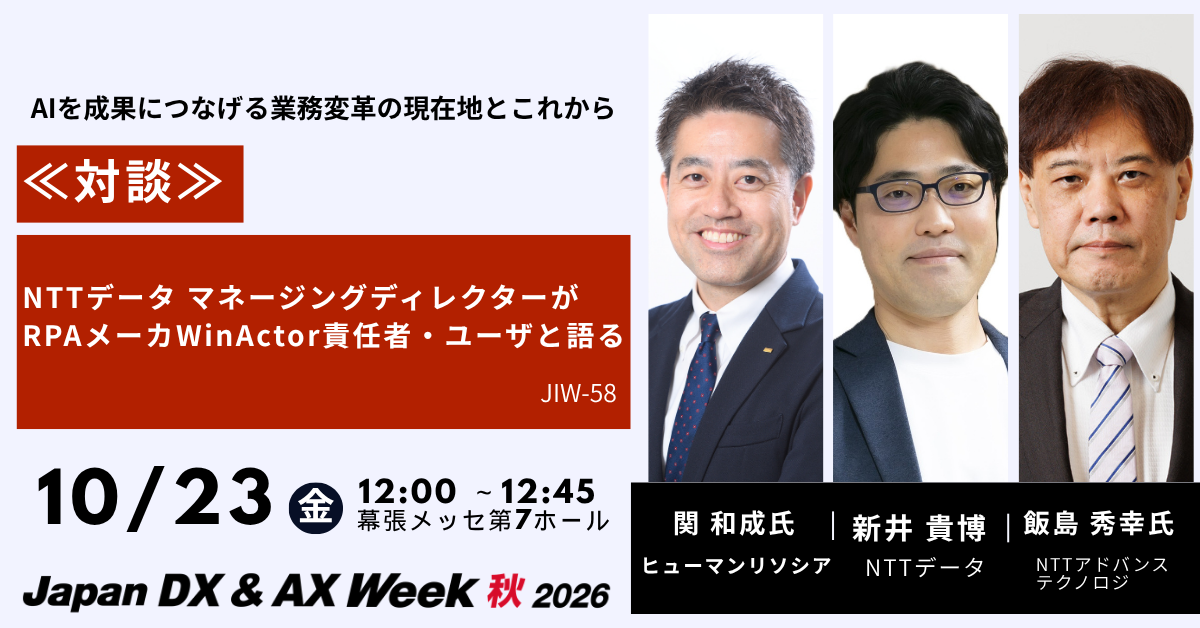 講演内容:



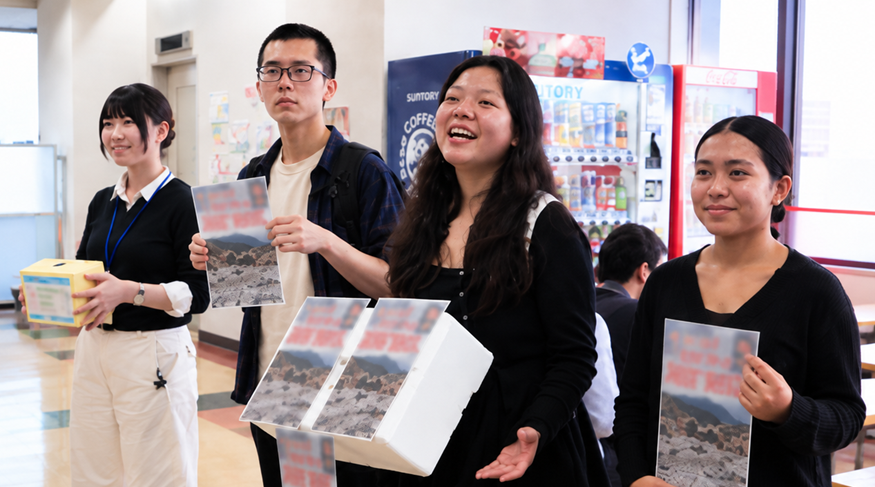
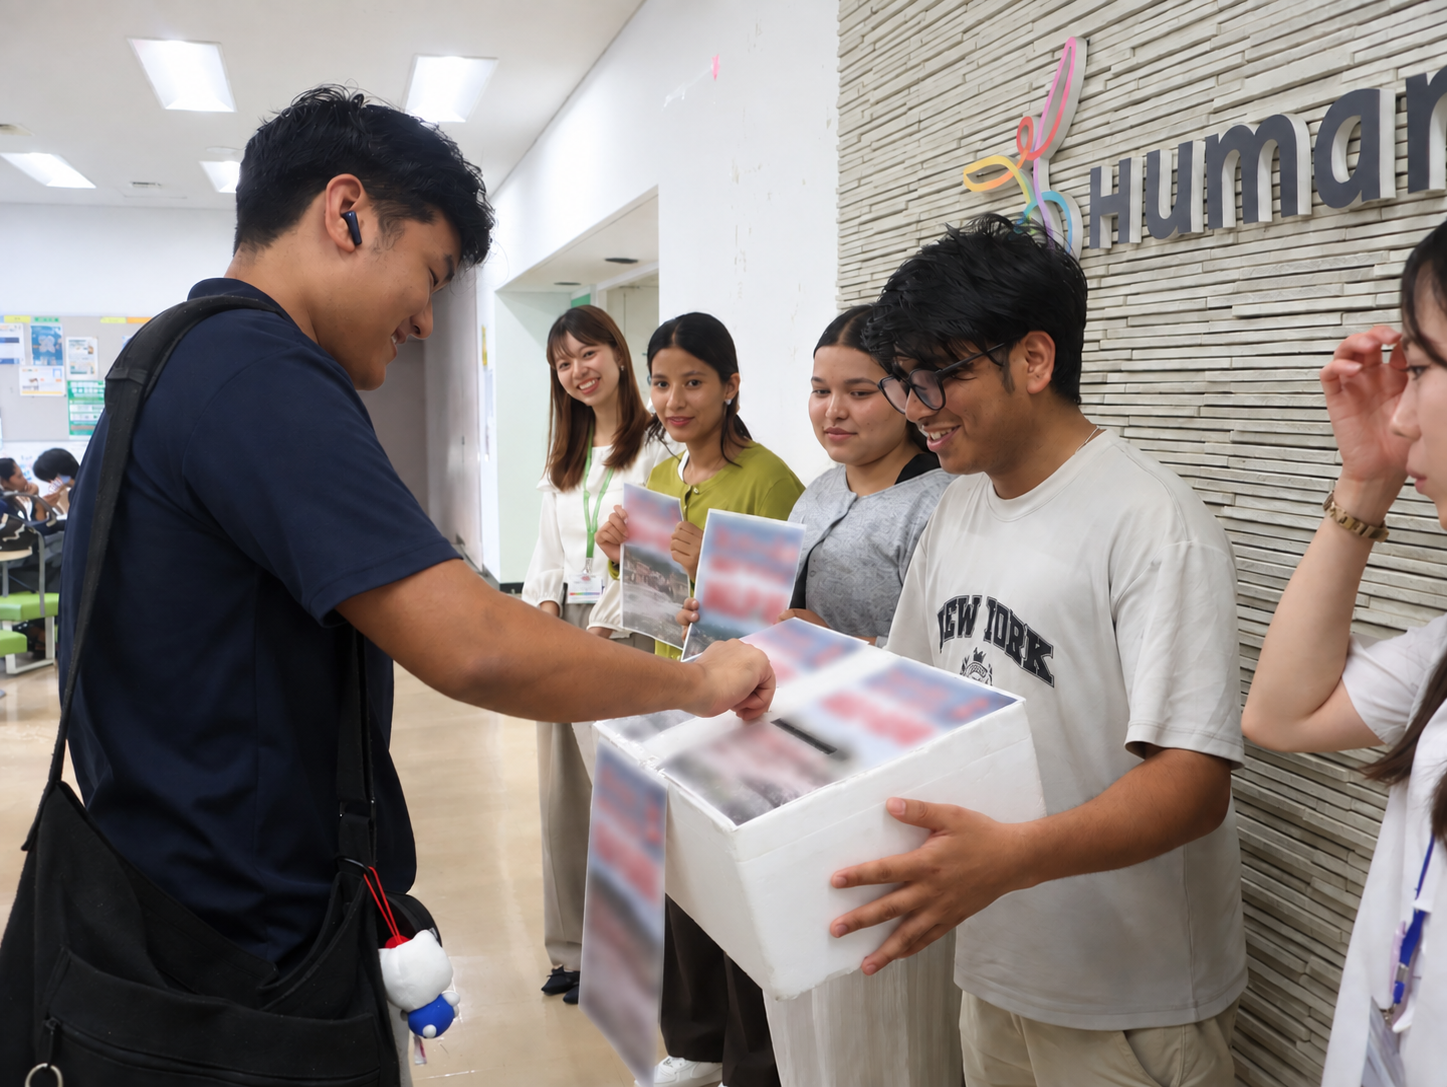
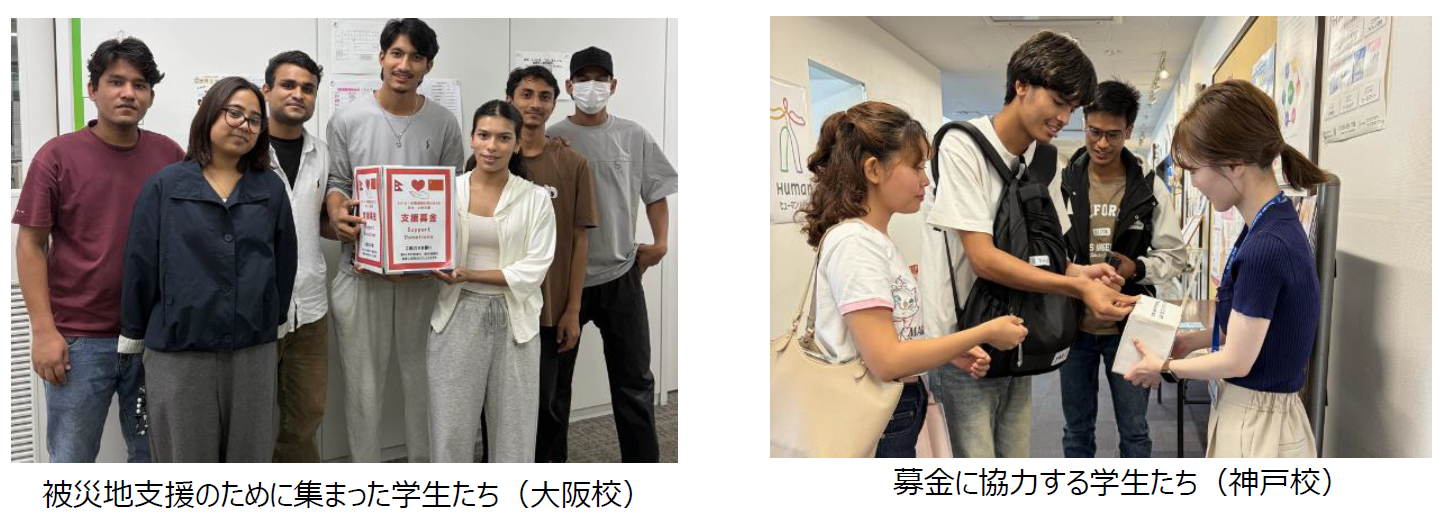
 1987年に大阪で開校以来、外国人を対象とした日本語教育機関として、39年にわたり日本の大学や大学院、専門学校といった高等教育機関への進学を目指す留学生を支援し、これまで30,000名以上の卒業生を輩出しています。(2026年3月実績)
Prompts
Click prompts to add them under the company line, click again to take one out, then copy the result into your AI chat. Shared by Asian Century Stocks and Uncovered Thai Stocks. Thank you.
ETFs Holding Human Holdings Co., Ltd.
Exchange-traded funds whose newest published daily portfolio holds one of the company's listings, largest weight first.
| ETF | Weight in ETF | Shares | Market value | As of |
|---|---|---|---|---|
| ORR | 0.11% | 41,201 | $ 400K | Nov 18, 2026 |