2027年3月期 第1四半期決算短信〔日本基準〕(連結) 2026年8月5日 上場会社名 株式会社新日本科学 コード番号 2395 URL https://snbl.com/ 代表者 (役職名) 代表取締役会長 問合せ先責任者 (役職名) 常務理事 IR広報統括部長 配当支払開始予定日 -…
2027年3月期
第1四半期決算短信〔日本基準〕(連結)
2026年8月5日
上場会社名
株式会社新日本科学
コード番号
2395
URL https://snbl.com/
代表者
(役職名) 代表取締役会長
問合せ先責任者 (役職名) 常務理事 IR広報統括部長
配当支払開始予定日
-
決算補足説明資料作成の有無:有
決算説明会開催の有無
上場取引所
(氏名)永田
(氏名)岩田
良一
俊幸
TEL
東
03(5565)6216
:有 (アナリスト・機関投資家向け)
(百万円未満切捨て)
1.2027年3月期第1四半期の連結業績(2026年4月1日~2026年6月30日)
(1)連結経営成績(累計)
売上高
2027年3月期第1四半期
2026年3月期第1四半期
(注)包括利益
営業利益
百万円
7,868
6,477
%
21.5
16.7
2027年3月期第1四半期
百万円
521
△340
△115百万円 (-%)
1株当たり
四半期純利益
円銭
25.55
6.25
2027年3月期第1四半期
2026年3月期第1四半期
(%表示は、対前年同四半期増減率)
経常利益
%
百万円
1,433
515
親会社株主に帰属する
四半期純利益
%
百万円
%
177.9
1,064
308.6
50.8
260
113.1
2026年3月期第1四半期
△3,309百万円 (-%)
潜在株式調整後
1株当たり
四半期純利益
円銭
-
-
(2)連結財政状態
総資産
2027年3月期第1四半期
2026年3月期
(参考)自己資本
純資産
百万円
100,208
105,055
2027年3月期第1四半期
自己資本比率
百万円
42,265
43,489
%
41.6
41.0
41,731百万円
2026年3月期
第2四半期末
円銭
20.00
年間配当金
第3四半期末
円銭
-
1株当たり純資産
円銭
1,002.40
1,035.76
43,120百万円
2.配当の状況
第1四半期末
円銭
-
-
2026年3月期
2027年3月期
2027年3月期(予想)
20.00
(注)直近に公表されている配当予想からの修正の有無:無
-
期末
合計
円銭
30.00
円銭
50.00
30.00
50.00
3.2027年3月期の連結業績予想(2026年4月1日~2027年3月31日)
(%表示は、通期は対前期、四半期は対前年同四半期増減率)
売上高
営業利益
百万円
%
百万円
%
第2四半期(累計)
17,154
16.1
1,240
-
通期
38,000
16.8
3,000
13.0
(注)直近に公表されている業績予想からの修正の有無:有
経常利益
百万円
2,988
6,000
%
83.6
2.9
親会社株主に帰属
する当期純利益
百万円
%
1,917
80.6
3,500 △23.4
1株当たり
当期純利益
円銭
46.04
84.07
※ 注記事項
(1)当四半期連結累計期間における連結範囲の重要な変更:無
(2)四半期連結財務諸表の作成に特有の会計処理の適用:無
(3)会計方針の変更・会計上の見積りの変更・修正再表示
① 会計基準等の改正に伴う会計方針の変更
:無
② ①以外の会計方針の変更
:無
③ 会計上の見積りの変更
:無
④ 修正再表示
:無
(4)発行済株式数(普通株式)
① 期末発行済株式数(自己株式を含む) 2027年3月期1Q
② 期末自己株式数
2027年3月期1Q
③
期中平均株式数(四半期累計)
2027年3月期1Q
41,632,400株 2026年3月期
586株 2026年3月期
41,631,814株 2026年3月期1Q
41,632,400株
586株
41,631,836株
※
添付される四半期連結財務諸表に対する公認会計士又は監査法人によるレビュー:無
※
業績予想の適切な利用に関する説明、その他特記事項
(将来に関する記述等についてのご注意)
本資料に記載されている業績見通し等の将来に関する記述は、当社が現在入手している情報及び合理的であると判
断する一定の前提に基づいており、その達成を当社として約束する趣旨のものではありません。また、実際の業績等
は様々な要因により大きく異なる可能性があります。業績予想の前提となる仮定等については、〔添付資料〕8ペー
ジ「1.当四半期決算に関する定性的情報(3)連結業績予想などの将来予測情報に関する説明」をご覧ください。
(決算補足説明資料及び決算説明会内容の入手方法)
当社は、2026年8月5日(水)15時にアナリスト・機関投資家向け説明会をウェブ会議形式で開催する予定です。
当日使用する決算説明資料(決算補足説明資料)は事前にTDnet及び当社ウェブサイト(https://snbl.com)に掲載
いたします。また、説明内容(動画及びトランスクリプト)は説明会開催後、速やかに同ウェブサイトに掲載する予
定です。
㈱新日本科学(2395)2027年3月期
第1四半期決算短信〔日本基準〕(連結)
○添付資料の目次
1.当四半期決算に関する定性的情報 ……………………………………………………………………………………
2
(1)経営成績に関する説明 ……………………………………………………………………………………………
2
(2)財政状態に関する説明 ……………………………………………………………………………………………
7
(3)連結業績予想などの将来予測情報に関する説明 ………………………………………………………………
8
2.四半期連結財務諸表及び主な注記 ……………………………………………………………………………………
9
(1)四半期連結貸借対照表 ……………………………………………………………………………………………
9
(2)四半期連結損益計算書及び四半期連結包括利益計算書 ………………………………………………………
11
四半期連結損益計算書 ……………………………………………………………………………………………
11
四半期連結包括利益計算書 ………………………………………………………………………………………
12
(3)四半期連結財務諸表に関する注記事項 …………………………………………………………………………
13
(継続企業の前提に関する注記) …………………………………………………………………………………
13
(株主資本の金額に著しい変動があった場合の注記) …………………………………………………………
13
(四半期連結キャッシュ・フロー計算書に関する注記) ………………………………………………………
13
(セグメント情報等の注記) ………………………………………………………………………………………
14
㈱新日本科学(2395)2027年3月期
第1四半期決算短信〔日本基準〕(連結)
1.当四半期決算に関する定性的情報
(1)経営成績に関する説明
医薬品業界は、国内外 において研究開発のスピードアップと費用の効率化 ならびに規制当局への対
応簡素化を期待してCRO(Contract Research Organization: 医薬品開発業務受託機関)へのアウトソ
ーシング(外部委託)の動きが引き続き活発化 しております。加えて核酸医薬、次世代抗体医薬、ペ
プチド医薬、遺伝子治療、細胞治療、再生医療などの新規創薬モダリティ(治療手段)の研究開発が
本格化してきています。このようなトレンドを受け、新規創薬モダリティの研究開発支援で高い実績
をもつ当社は、“オンリーワンのダントツCRO”としてクライアントから第一に指名される存在になる
ことを目指しており、顧客ニーズを満たす迅速な対応とサービスの向上ならびに継続的な品質の向上
に注力しております。
こうした状況の中、2027年3月期第1四半期連結累計期間(2026年4月1日から2026年6月30日:
以下、当Q1)の業績は、主力のCRO事業がけん引し、売上高は7,868百万円と第1四半期としては過去
最高となり、2026年3月期第1四半期連結累計期間(以下、前Q1)に比べて1,391百万円(21.5%)の
増加となりました。営業利益は521百万円となり、前Q1の営業損失340百万円と比べて862百万円の増益
となりました。営業利益の大幅改善は、CRO事業で2026年3月期中での売上計上を見込んでいた複数の
大型案件の完了が2027年3月期にずれた、「期ずれ」の多くが当Q1に売上計上となったことが主因で
す 。米国連結子会社 のSatsuma Pharmaceuticals,Inc.( 以下、Satsuma社 ) の 経鼻片頭痛治療薬
TM
Atzumi の事業化に向けた当Q1の営業損失は593百万円(前Q1: 746百万円)となりました。経常利益
は、1,433百万円と前Q1に比べて917百万円(177.9%)の増益となりました。CRO事業のうち 臨床事業
を推進している新日本科学PPDからの当Q1の持分法利益は、718百万円(前Q1: 700百万円)となりまし
た 。為替差損益 は172 百万円 の 為替差益 と な り 、前Q1の 為替差益120百万円 と 比 べ て51百万円
(42.6%)の増益要因となっております。親会社株主に帰属する四半期純利益は1,064百万円と前Q1に
比べて803百万円(308.6%)増益となりました。
当社グループ従業員数(連結ベース/時間給・非常勤 を除く)は、2026年4月に新入社員150名、
(うち女性は90名)が加わったこともあり2026年6月30日現在1,680名(2026年3月末比158人増)と
なりました。また、女性従業員比率は54.6%(連結ベース/臨時従業員含む)となっております。
セグメント別の経営成績及びSDGs/ESGへの取組みは次のとおりです。
①CRO事業
CRO事業は、細胞・実験動物等を用いる 非臨床試験(または前臨床試験)を受託する 非臨床事業
と、臨床試験を受託する臨床事業から構成されます。当社の非臨床事業は、業界では国内最大手で
あり、NHPを用いた数多くの試験実績から世界的に第2グループの一角と認識されています。当Q1の
非臨床事業は順調に推移し、これまで実施してきた以下の取組みが成果を表してきております。
・CROとして世界で唯一構築できている「実験施設近隣に自社NHP繁殖場を設置した動物供給体制
の確立」が新たな創薬モダリティの研究開発の本格化等により重要性を増しています。加えて
海外でのNHPの入手困難な環境が当社にプラスに働き受注に繋がっています。また、2021年3月
期から5年計画で進めておりました国内NHP繁殖体制強化と、輸入リスクの軽減、ならびに品質
向上を実現する大規模NHP繁殖施設(投資総額85億円)が完成しました。これらの取組みは、特
に欧米顧客から高い評価を受けております。
・生体試料中の医薬品等開発候補品(被験物質)やバイオマーカーの濃度分析をバイオアナリシ
スと呼びます。当社は新たな創薬モダリティの有効性・安全性評価に必要な最新鋭装置を多数
導入 し、被験物質測定系やバイオマーカー評価系 を早い 時期から構築してきたことが、上記
「実験施設近隣に自社NHP繁殖場を設置した動物供給体制の確立」と相乗効果を発揮し、バイオ
アナリシスの受注増に繋がっております。成長余地の高い領域と認識しており、2027年3月期
も新たに4台のLC-MS/MSを導入予定で、海外からの受注増に対応できる体制を強化しておりま
す。
・これらの取組みを高く評価いただいた複数の製薬企業とプリファード契約(予め選定したCROに
優先的に委託する契約)を締結し、受注増に繋がっております。2026年3月期は新たに国内大
手製薬企業1社とプリファード契約を締結しており、これにより合計4社の国内製薬企業とプ
リファード契約を実現しました。また 、2024年11月に 安全性研究所に海外顧客専任チーム
(Global Study Team: GST)を新たに組成するなど、欧米からの受託を目指す営業活動を強化
㈱新日本科学(2395)2027年3月期
第1四半期決算短信〔日本基準〕(連結)
したことが奏功し、2026年3月期はグローバルメガファーマ1社からプリファードベンダー認
定を取得しています。
・国内大手製薬企業との創薬段階における包括的研究受託契約も顧客数が順調に推移しており、
複数の企業から創薬初期段階からの開発研究を受注しております。
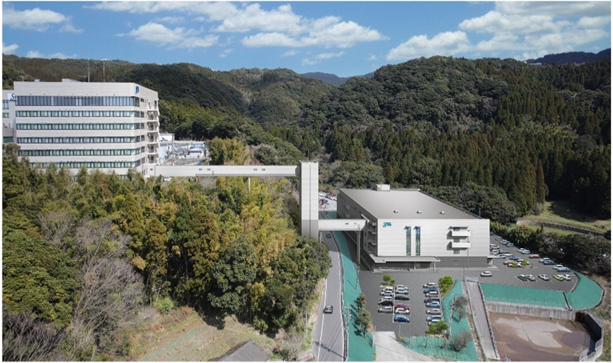
・2022年12月から鹿児島本社で建設を進めてきた新社屋研究棟(地上8階建・2棟)は2024年9
月から本格運用を開始しました。ここには、動物試験を補完する形で利用が進んでいくと予測
されるMPS(Microphysiological Systems: 生体模倣システム)専用実験室を設置し、2025年4
月に国内CROとして初めてとなる受託サービスを開始し、複数の受託契約に結びついておりま
す。2026年7月に開催された第53回日本毒性学会学術年会において、MPSに関する発表を行いま
した。国内・海外の製薬企業からの関心は高く、複数の問い合わせが継続しております。
・安全性研究所、メディポリスNHPセンターおよび株式会社新日本科学イナリサーチセンターが、
AAALAC International(国際実験動物ケア評価認証協会)の完全認証の継続通知を受領しまし
た。AAALAC Internationalは、実験動物施設における人道的で責任ある動物 のケアと利用に関
する評価を行う唯一の国際独立調査機関(民間の非営利団体)です。認証を取得した後も、3
年に一度、施設訪問により再評価 が行 われます 。多 くの製薬企業、特に 欧米顧客において
AAALAC Internationalからの認証取得は、CROへの委託の重要な前提条件となります。
・2026年2月には、戦略的取組みの成果が出てきた 欧米顧客からの受注取り込みを更に強化する
ため、欧米顧客からの要望の高いEU規格の大型飼育ケージに特化したNHP実験施設「EU実験棟」
の新設を発表しました。地上4階建て総額約100億円の投資となり、当社の長年のNHP試験の経
験から得たノウハウを豊富に取り入れ、新型MRI(3テスラ)やCT装置などを備えた世界最高水
準の施設になると自負しており、2027年秋頃の完成を目指します。
・実験終了から最終報告書草案提出までの期間短縮と質向上を企図して、AIを用いた報告書自動
作成システム開発に取り組んでおります。2026年3月期はPoCを実施、満足いく結果が得られて
います。2026年5月から本実装へ向けた段階に入り、2027年3月 までには本システムを実装し
新たなサービスを顧客に提供します。
上記取組みの結果、当Q1における非臨床事業の受注高は第1四半期として過去最高となる9,961百
万円、前Q1比1,866百万円(23.0%)の増加となりました。受注増加の主要因は、戦略的に取組みを
強化している欧米顧客からの受注増加であり、欧米顧客からの 当Q1の 受注高 は前Q1比39.8%増の
4,280百万円と大きく伸長 しています。当Q1の海外受注高は前Q1比68.8%増の5,301百万円、総受注
高に占める海外受注高比率は53.2%(前Q1: 38.8%)となりました。当Q1末(2026年6月末)の受
注残高は前Q1末比7,939百万円(22.0%)増の44,060百万円と過去最高水準となっています。
臨床事業は、米国に本拠を置くグローバル臨床CROのPPD,Inc.(以下、PPD社)との 合弁会社、株
式会社新日本科学PPD(以下、新日本科学PPD)において、主に国際共同治験(Global Study)の受
託事業を展開しており、2025年4月に設立10年を迎えました。PPD社は、2021年12月に世界的大手医
療機器企業のThermo Fisher Scientific Inc.グループの傘下に加わることにより、受注シナジーを
高めることを目指しております。新日本科学PPDは、PPD社が受託した国際共同治験における日本エ
リアの実施を主力事業としており、グローバル企業でありながら、当社がこれまで長年培ってきた
経営・教育ノウハウを取り入れ、安定した定着率の高い職場環境を整えることで、ハイレベルな受
注残高を背景に、設立以来高い成長率を実現してきております。新日本科学PPDからの当Q1の「持分
法による投資利益」は718百万円(前Q1: 700百万円)となっています。
CRO事業の当Q1の売上高は、7,537百万円と第1四半期として過去最高となり、前Q1比1,355百万円
(22.0%)の増収となりました。同事業の営業利益は1,538百万円と前Q1比769百万円(200.0%)増
益、売上高営業利益率は20.4%(前Q1: 12.4%)になっております。
②トランスレーショナル リサーチ事業(TR事業)
トランスレーショナル リサーチ事業(TR: Translational Research、以下、TR事業)とは、自社
研究開発のほか、国内外の大学、バイオベンチャー、研究機関などにおいて、基礎研究から生まれ
る有望なシーズや新技術を発掘し付加価値を高めて事業化または株式上場、あるいはM&Aにつなげる
研究開発型の事業です。
1997年にTR事業を開始して以来、TR事業の主軸として探求してきた当社独自開発の経鼻製剤投与
㈱新日本科学(2395)2027年3月期
第1四半期決算短信〔日本基準〕(連結)
基盤技術(SMART: Simple MucoAdhesive Release Technology、以下、SMART)は、担体組成をベー
スとした、経鼻粉末製剤技術と経鼻投与デバイス(医療機器)を組み合わせたプラットフォーム技
術です。鼻粘膜での薬物滞留を向上させることで薬剤の速やかで高い吸収を可能にしており、加え
て注射に比べて投与が簡易であり、製剤の室温保存も可能という強みがあります。
経鼻製剤投与の事業化 は、Satsuma社が2025 年4月30日( 米国時間 )にFDA より経鼻片頭痛薬
「Atzumi™」(開発コード: STS101)の販売承認を取得 しております。Satsuma社は、2027年下半期
の米国市場での上市を視野に、Satsuma社主導で販売体制整備を進めつつ、戦略的パートナーシップ
の構築などを含め、幅広い事業展開を実施中です。米国以外の地域(中東・アジア・欧州など)に
おいては、現地の販売提携先へのライセンスアウト(権利導出)に向けた交渉を進めております。
STS101の臨床試験結果は、2026年6月に米国頭痛学会(American Headache Society: AHS)におい
てポスター発表されました。
新日本科学本体のTR事業本部には、製剤・デバイスなど基盤技術を創出研究する部署、パーキン
ソン病治療薬の臨床治験を進める部署、経鼻粘膜ワクチンのProof of Concept(以下、POC)取得を
管理する部署があります。パーキンソン病のオフ 症状治療のための点鼻レボドパ経鼻薬(開発コー
ド:TR-012001)及び改良開発品(TRN501)の開発は、当社連結子会社の(株)SNLD(以下、SNLD社)
で進 めています 。SNLD社 では、国内においてパーキンソン病患者 (12例)を 対象に実施した
TR-012001探索的臨床第2相試験の成績 を、2025 年4月に米国神経学会 (American Academy of
Neurology: AAN)年次総会及び追加解析結果を2026年7月にパーキンソン病・運動障害疾患コングレ
スにて発表しました。また、2025年5月の日本神経学会総会、7月の日本パーキンソン病・運動障
害疾患学会、10月のMDS国際パーキンソン病・運動障害疾患学会では、第1相試験の成績を含めて複
数の演題を発表しました。TRN501は、2024年8月に臨床第1相試験における日本人健康成人への投
薬を完了し、データ解析と総括報告書の作成を進め、今後学会にて結果発表の予定です。各国の薬
事制度・市場調査を綿密に行い、今後の開発方針を慎重に見極めつつ、次の臨床治験計画を立案中
です。経鼻粘膜ワクチン開発は、AMED/SCARDAから委託研究開発費を得て、研究開発を進めてきまし
た。この度実施されたAMEDの中間評価において、当社が開発した粉体経鼻投与法を用いることで鼻
腔粘膜に分泌型 IgA 産生が誘導され鼻粘膜におけるインフルエンザウイルス感染成立を防ぐ効果を
示すことがカニクイザルを用いた研究で認められました。このことから、「非臨床 POC の取得を達
成」 したとAMED/SCARDAによって評価され、中間評価で最高評価となる「評価A」の 評価を獲得、
AMEDから委託研究開発費の追加も含めた研究開発支援の延長(2029年3月31日まで)が決定されま
した。今後、開発試験期間内での第1相臨床試験を実施してまいります。
当社は1999年以来、米国ワシントン州に設立したSNBL USA, LTD.を中心にCRO事業およびTR事業を
展開し、日米のアカデミア、投資家、製薬企業、プロフェッショナル企業などとの強固なネットワ
ークを構築してきました。創薬エコシステムの発展に取り組むべく、米国での事業を通じて培った
経験およびネットワークを最大限に活用し、投資事業およびビジネスインキュベーション支援を一
体的に推進するSGG(SNBL Global Gateway)事業を展開しております。
2026年4月には、創薬シーズ・技術に関するライセンス仲介事業を展開してきたGemseki事業部を
発展的に改組し、SGG統括部を新設いたしました。これにより、従来の投資およびビジネスインキュ
ベーション機能に、事業パートナー探索を含むライセンシング支援機能を加え、医薬品・医療機器
の創出・育成に必要な支援をワンストップで提供する体制を構築しております。
SGG統括部では、米国市場への進出を目指す日本のバイオテック企業やスタートアップに加え、日
本市場への進出や日本企業との連携を目指す米国企業・スタートアップを対象に、「投資」「ビジネ
スインキュベーション」
「ライセンシング支援」の3つの機能を通じて、日米双方における市場進出
および事業展開を支援しております。
「投資」においては、連結子会社である株式会社Gemsekiインベストメントを中心に、日本および
北米のスタートアップへの投資活動を展開しております。2024年に組成したGemseki2号投資事業有
限責任組合を通じて投資活動を継続しており、当Q1には日本のスタートアップ1社に対して投資を
実行いたしました。また、グローバル投資分野において豊富な実績を有するSBIグループと、米国シ
リコンバレーに本社を置くイノベーション・プラットフォーム・プロバイダーであるPlug and Play
社との共同ファンド「SBI US Gateway Fund」を通じて、北米を中心とした投資活動を展開しており
ます。
「ビジネスインキュベーション」においては、当社が米国で構築してきたネットワークおよび事
㈱新日本科学(2395)2027年3月期
第1四半期決算短信〔日本基準〕(連結)
業基盤 を活用し、日本企業の米国市場進出ならびに米国企業の日本市場進出を支援しております。
具体的には、市場分析、進出戦略・事業計画の策定、薬事・知財戦略、現地拠点の設立および事業
計画の実行支援を一貫して提供しております。当Q1は、米国進出の検討初期段階にある複数の日本
のバイオテック企業およびベンチャーキャピタルに対し、米国市場分析および進出形態に関するア
ドバイザリーサービス、非臨床試験コンサルティングを提供いたしました。また、当社と連携する
ベンチャーキャピタルが、米国ワシントン州で当社が運営するビジネスインキュベーション施設に
オフィスを開設いたしました。同施設では、日本のバイオテック企業を中心に会員数が増加してお
り、日米のベンチャーキャピタル、製薬企業、バイオテック企業、研究機関等の交流および事業連
携の機会を継続的に創出しております。
2026年5月には、米国 ワシントン州においてSeattle Children’s Research Instituteおよび神
戸市との共催 により、2日間のライフサイエンスイベント 「Life Science Gateway 2026 Seattle
and Japan」を開催 いたしました。本イベントでは、日米 におけるライフサイエンス分野の投資環
境、共同研究環境およびCDMOを含む創薬エコシステムを紹介したほか、日米のスタートアップによ
る発表 やネットワーキングの機会を設け、約190名が参加 いたしました。また、同月に開催 された
Plug and Play社主催の「Plug and Play Silicon Valley May Summit 2026」にも参画し、スタート
アップ、事業会社、投資家との面談や情報交換を行いました。これらの活動を通じて、日米のライ
フサイエンス関係者の接点を広げ、事業連携や投資機会の創出に取り組んでおります。
「ライセンシング支援」においては、「創薬シーズの最適な活用を支援することで、人類に貢献す
る」ことをミッションに、従来のGemseki事業で蓄積してきた創薬シーズ・技術に関する情報および
グローバルなネットワークを活用し、創薬シーズ・技術を保有する創薬スタートアップ、研究機関
等を対象に、導出戦略の策定、導出候補先の選定、面談機会の設定および 契約締結に向けたライセ
ンシング・パートナリング支援を提供しております。当Q1は、2026年6月に米国サンディエゴで開
催された「BIO International Convention 2026」に参加し、創薬スタートアップ、研究機関、製薬
企業等との面談機会を得て、有望な創薬シーズ・技術を有する新規顧客の探索および 契約獲得を推
進するとともに、既存顧客が保有する創薬シーズ・技術の紹介ならびにライセンシングおよび事業
提携機会の創出を支援しました。
これらの取り組みを通じて、日米のスタートアップ、アカデミア、投資家、製薬企業および創薬
支援企業を結び付け、投資、ビジネスインキュベーション、ライセンシング支援を一貫して支援す
ることで、グローバルな創薬エコシステムの発展を推進しております。
こうした中、TR事業の当Q1の売上高は、59百万円(前Q1: 47百万円)となりました。当Q1の営業
損失 はSatsuma社が593 百万円 と前Q1(746 百万円)よりも低かったこともあり 、966 百万円 (前Q1:
1,101百万円)となりました。
③メディポリス事業(社会的利益創出事業)
当社は、鹿児島県指宿市の高台に103万坪(340万㎡)の広大な敷地「メディポリス指宿」を保有
しており、この自然資本を活用したメディポリス事業を社会的利益創出事業として、発電事業とホ
スピタリティ事業を展開しています。社会的利益創出事業は、「環境、生命、人材を大切にする会
社であり続ける」と掲げた理念を体現するものであり、経済的利益のみならず、社会や環境課題と
いった視点の社会的利益を一体的に創出しています。具体的には、再生可能エネルギーを活用した
発電事業、人々のWellbeing(ウェルビーイング)、つまり全人的な健康の実現をメインコンセプト
としたホテル宿泊施設の運営(ホスピタリティ事業)を行っております。
発電事業では、2015年より約1,500kW級のバイナリー型地熱発電所を運営しております。地熱発電
は、CO₂排出量がほぼゼロであり、天候や昼夜に左右されず安定的な発電が可能なベースロード電源
です。当社発電所は年間約1,000万kWhを発電し、FIT制度を活用した安定的な売電収入を計上してお
ります。また、2025年4月からは、ホテルの泉源からの 余剰蒸気を活用した温泉発電所が稼働を開
始し、年間約400万kWh(一般家庭約1,000世帯分)の発電を達成しました。前年度に続き、当Q1も安
定した発電を継続しております。なお、両発電所を合わせた 想定年間発電量は、当社の年間消費電
力量の約半分に相当します。
ホスピタリティ事業は、お客様のニーズに合わせる形でヒーリングリゾートホテル「別邸天降る
丘」と、医療機関メディポリス国際陽子線治療センターの患者専用宿泊施設「ホテルフリージア」
および研修専用の「指宿ベイヒルズ」の3つの施設を運営しております。「別邸天降る丘」は、一
般客のほか、当社を訪れる国内外 のパートナーの滞在先としても活用されています。滞在者の満足
㈱新日本科学(2395)2027年3月期
第1四半期決算短信〔日本基準〕(連結)
度は高く、信頼関係の構築につながることで、当社事業の業績にも寄与しています。さらに滞在者
の満足度を高めるため、2026年6月にスパ施設を大幅改修(2026年7月にリニューアルオープン)
しました。メディポリス国際陽子線治療センターは、2011年1月に治療を開始して以来、8,000件を
超えるがん患者さんの陽子線治療実績を積み重ねております。
メディポリス事業の当Q1の売上高は、237百万円(前Q1: 210百万円)と27百万円(12.8%)の増
加となりました。営業利益は発電事業で減価償却費が増加したこと等により16百万円(前Q1: 33百
万円)となりました。
④米国不動産事業
当社 は、米国子会社SNBL USA, LTD.が 保有する約6万坪の敷地内に建設した多目的産業用ビル
STC: Seaway Technology Center(17,282㎡)を賃貸する米国不動産事業の営業を2025年から開始し
ています。米国不動産事業の当Q1の売上高は、テナントからの収入により49百万円(前Q1: 43百万
円)となりました。営業損失は、28百万円(前Q1: 23百万円)となりました。
⑤SDGs/ESGへの取組み
2015年9月の国連総会で採択された「持続可能な開発目標 (Sustainable Development Goals:
SDGs)」は、2030年までの達成を目指す世界中の人々が幸せに暮らせるように定められた世界共通
の目標です。これは、当社創業以来の企業理念「環境・生命・人材を大切にする会社であり 続け
る」と、当社スローガン「わたしも幸せ、あなたも幸せ、みんな幸せ」、そのものであり、当社は
SDGs/ESGの取組みについて、業界のリーディングカンパニーであると認識しております。
SDGs/ESGの取組みについては、取締役会の諮問機関として設置した「SDGs委員会」(委員長は独
立社外取締役の戸谷圭子氏)およびSDGs委員会の下部組織として設置した「環境委員会」(委員長
はサステナビリティ担当理事)において、毎月活発な議論を行っており、その成果として作成した
ESGデータブック及び各種ESGポリシー、TCFD提言に基づく情報開示等を自社WEBサイト上の専用ペー
ジ(https://snbl.com/esg/)に開示しております。
当社が創造していきたい未来として、「統合報告書」に2028Vision「ステークホルダーに寄り添
い、幸せの連鎖を創造する」というフレーズを掲げています。また、2028年度の財務KPI(目標)と
して「売上高500億円、経常利益200億円、売上高経常利益率40%、配当性向30~40%」を目指すと
掲げました。なお、資本コストは、2026年3月期の業績を基に試算し、5.3%としています。β値は
直近5年間の週次データを用いて0.94と算出しています。資本収益性の指標は、ROE(自己資本利益
率)とROIC(投下資本利益率)を重視しており、毎月の取締役会の報告事項となっております。とも
に10% 以上を目指しており 、2026 年3月期の業績 を基に 計算したROEは10.9%、ROICは8.4% でし
た。2026年6月には、コーポレートガバナンス報告書を更新しており、2021年6月の改訂後のコー
ポレートガバナンス・コードの各原則(プライム市場向けの内容含む)すべてを実施しています。
2026年6月30日時点の女性取締役比率は28.5%(14名中4人)です。
当社は、SDGs/ESGに関する継続的な取組みにより、各評価機関から高い評価を受けております。
グ ロ ー バ ル イ ン デ ッ ク ス プ ロ バ イ ダ ー で あ る 英国FTSE Russellに よ り 構築 さ れ たFTSE JPX
Blossom Japan Indexの構成銘柄に2年連続、FTSE JPX Blossom Japan Sector Relative Indexには
5年連続で選定されています。また、女性活躍推進に優れた企業として、経済産業省と東京証券取
引所が共同で主催する「なでしこ銘柄」に、令和3年度と令和7年度の2回、選定されています。
当Q1における株主/投資家との対話実績について、機関投資家/アナリストミーティングは58件
(前Q1: 76件)となりました。IR広報ブログは63回更新しタイムリーな情報提供に努めています。
当社は、生物多様性保全への取組みとして、地域貢献(鹿児島県はニホンウナギ供給国内1位)
を目的として、レッドリストに登録されているニホンウナギの稚魚、シラスウナギの人工生産研究
(水産事業)を進めております。2019年には鹿児島県沖永良部島和泊町に研究施設を設置しシラス
ウナギの人工生産を行っています。研究室 レベルでは高い生残率を実現しており、現在は大量生産
に向けたスケールアップを進めています。2024年10月には水産業界大手の(株)ニッスイと共同研究
を開始しました。独自に開発した人工飼料と新型飼育水槽(黒潮水槽™)を用いることで、人工シラ
スウナギについて5年以内に100万尾規模の生産体制の構築を視野に、量産化を進めています。
㈱新日本科学(2395)2027年3月期
第1四半期決算短信〔日本基準〕(連結)
(2)財政状態に関する説明
当第1四半期連結会計期間末の総資産は、前連結会計年度末に比べ4,846百万円(4.6%)減少し、
100,208百万円となりました。流動資産は、「現金及び預金」が4,202百万円減少したことや「棚卸資
産」が2,093百万円増加したなどにより、前連結会計年度末に比べ2,842百万円(6.6%)減少して
40,146百万円となりました。固定資産は、「投資有価証券」が2,289百万円減少したことなどにより、
前連結会計年度末に比べ2,003百万円(3.2%)減少して60,062百万円となりました。
負債は、前連結会計年度末に比べ3,623百万円(5.9%)減少し、57,942百万円となりました。流動
負債は、「前受金」が2,019百万円増加しましたが、未払法人税等が883百万円減少したことなどによ
り、前連結会計年度末に比べ168百万円(0.4%)増加して39,494百万円となりました。固定負債は、
「長期借入金」が3,834百万円減少したことなどにより、前連結会計年度末に比べ3,792百万円
(17.0%)減少して18,448百万円となりました。
純資産は、「親会社株主に帰属する四半期純利益」を1,064百万円計上しましたが、配当金の支払を
1,248百万円行ったこと、「その他有価証券評価差額金」が1,896百万円減少したことなどにより、前
連結会計年度末に比べ1,223百万円(2.8%)減少し、42,265百万円となりました。
㈱新日本科学(2395)2027年3月期
第1四半期決算短信〔日本基準〕(連結)
(3)連結業績予想などの将来予測情報に関する説明
米国政府により発表された 相互関税政策の影響は、当社の第一の成長エンジンである非臨床事業、
第二の成長エンジンである臨床事業ともにサービスの提供事業であり米国への製品等の輸出はほとん
どありませんので、業績への影響は現時点では軽微と考えております。中東情勢の影響につきまして
も、現時点において事業に必要な医療等製品・物資において入手困難な状況は出ておりません。
2026年7月28日に熊本県を中心に発生した「令和8年熊本地震」については、被災された方々に謹ん
でお見舞い申し上げます。同地震の当社事業への影響は現時点 ではございませんが、今後も状況を注
視し、新たな情報等が確認された場合には、速やかにお知らせいたします。
2027年3月期Q1の 業績は順調に推移しており 、5月11日に 公表しました2027年3月期第2四半期
(累計)の連結業績予想を修正しました。詳しくは 本日公表の「2027年3月期第2四半期(中間期)
連結業績予想の修正に関するお知らせ」をご覧ください。
前提としている為替レートは、期初に設定した1米ドル=150円を引き続き用いております。
業績予想の前提となる主要な経営指標(設備投資、減価償却費、研究開発費、従業員数)は以下を
ご参照ください。
【非臨床事業の受注の推移】(単位:百万円)
2024年
2024年
2025年
2025年
2026年
2026年
2027年
2027年
3月期
3月期
3月期
3月期
3月期
3月期
3月期
3月期
Q1実績通期実績 Q1実績通期実績 Q1実績通期実績 Q1実績通期計画
受注高
8,398
27,411
7,170
32,109
8,095
35,728
9,961
37,800
内、国内受注高
6,208
20,359
4,001
19,769
4,955
20,223
4,660
19,200
内、海外受注高
2,189
7,052
3,169
12,340
3,140
15,505
5,301
18,600
受注残高
33,329
33,212
36,051
34,394
36,120
40,920
44,060
(注)1.海外受注高は円換算レートを各期の期中平均レートで算定しております。
2.海外受注残高は円換算レートを各期の期末レートで算定しております。
【主要な経営指標】
2024年
3月期
Q1実績
2024年
3月期
通期実績
2025年
3月期
Q1実績
2025年
3月期
通期実績
設備投資
1,408
8,525
4,273
11,390
(百万円)
減価償却費
411
1,774
482
2,496
(百万円)
研究開発費
294
1,741
617
2,217
(百万円)
期末人員数
1,360
1,341
1,445
1,436
(人)
(注)2025年3月期第3四半期からSatsuma社を含む。
2026年
3月期
Q1実績
2026年
3月期
通期実績
2027年
3月期
Q1実績
2027年
3月期
通期計画
2,049
5,304
1,127
11,086
715
3,318
760
3,948
748
2,400
691
2,435
1,541
1,522
1,680
1,676
㈱新日本科学(2395)2027年3月期
第1四半期決算短信〔日本基準〕(連結)
2.四半期連結財務諸表及び主な注記
(1)四半期連結貸借対照表
(単位:千円)
前連結会計年度
(2026年3月31日)
資産の部
流動資産
現金及び預金
受取手形、売掛金及び契約資産
棚卸資産
その他
貸倒引当金
流動資産合計
固定資産
有形固定資産
建物及び構築物(純額)
土地
その他(純額)
有形固定資産合計
無形固定資産
のれん
その他
無形固定資産合計
投資その他の資産
投資有価証券
その他
貸倒引当金
投資その他の資産合計
固定資産合計
資産合計
当第1四半期連結会計期間
(2026年6月30日)
18,536,325
7,304,856
15,114,090
2,205,775
△172,270
42,988,777
14,334,226
7,173,582
17,207,150
1,603,674
△172,581
40,146,051
23,799,105
5,033,176
7,369,410
36,201,692
23,445,924
5,072,688
8,119,472
36,638,085
1,762,784
359,685
2,122,470
1,745,531
383,542
2,129,074
21,373,107
2,566,688
△197,220
23,742,575
62,066,737
105,055,514
19,083,433
2,434,505
△222,233
21,295,704
60,062,864
100,208,916
㈱新日本科学(2395)2027年3月期
第1四半期決算短信〔日本基準〕(連結)
(単位:千円)
前連結会計年度
(2026年3月31日)
負債の部
流動負債
買掛金
短期借入金
未払法人税等
前受金
その他
流動負債合計
固定負債
長期借入金
リース債務
その他
固定負債合計
負債合計
純資産の部
株主資本
資本金
資本剰余金
利益剰余金
自己株式
株主資本合計
その他の包括利益累計額
その他有価証券評価差額金
為替換算調整勘定
その他の包括利益累計額合計
非支配株主持分
純資産合計
負債純資産合計
当第1四半期連結会計期間
(2026年6月30日)
406,866
19,669,996
966,195
14,705,860
3,576,392
39,325,311
263,591
19,569,996
82,364
16,725,830
2,852,239
39,494,021
21,121,025
468,120
651,805
22,240,951
61,566,263
17,286,245
727,399
435,281
18,448,926
57,942,948
9,679,070
2,398,557
22,572,741
△780
34,649,589
9,679,070
2,426,054
22,334,488
△780
34,438,832
7,911,222
559,946
8,471,168
368,492
43,489,251
105,055,514
6,014,443
1,278,547
7,292,991
534,142
42,265,967
100,208,916
㈱新日本科学(2395)2027年3月期
第1四半期決算短信〔日本基準〕(連結)
(2)四半期連結損益計算書及び四半期連結包括利益計算書
(四半期連結損益計算書)
(単位:千円)
前第1四半期連結累計期間
(自 2025年4月1日
至 2025年6月30日)
当第1四半期連結累計期間
(自 2026年4月1日
至 2026年6月30日)
6,477,677
3,408,391
3,069,286
3,410,221
△340,934
7,868,873
3,821,039
4,047,834
3,526,098
521,735
6,662
1,020
120,802
725,577
61,244
915,307
11,245
1,170
172,225
830,970
57,351
1,072,962
57,816
312
490
58,618
515,754
106,938
1
54,473
161,413
1,433,284
2,751
2,751
1,127
1,127
178,781
6,219
185,001
333,504
39,605
37,398
77,003
256,500
△3,924
260,425
26,031
0
26,031
1,408,380
57,899
287,470
345,369
1,063,010
△1,031
1,064,042
売上高
売上原価
売上総利益
販売費及び一般管理費
営業利益又は営業損失(△)
営業外収益
受取利息
受取配当金
為替差益
持分法による投資利益
その他
営業外収益合計
営業外費用
支払利息
支払手数料
その他
営業外費用合計
経常利益
特別利益
固定資産売却益
特別利益合計
特別損失
固定資産除却損
減損損失
特別損失合計
税金等調整前四半期純利益
法人税、住民税及び事業税
法人税等調整額
法人税等合計
四半期純利益
非支配株主に帰属する四半期純損失(△)
親会社株主に帰属する四半期純利益
㈱新日本科学(2395)2027年3月期
第1四半期決算短信〔日本基準〕(連結)
(四半期連結包括利益計算書)
(単位:千円)
前第1四半期連結累計期間
(自 2025年4月1日
至 2025年6月30日)
当第1四半期連結累計期間
(自 2026年4月1日
至 2026年6月30日)
256,500
1,063,010
166,447
△3,661,075
△71,504
△3,566,132
△3,309,632
△1,896,778
665,526
52,282
△1,178,969
△115,959
△3,300,538
△9,093
△117,489
1,530
四半期純利益
その他の包括利益
その他有価証券評価差額金
為替換算調整勘定
持分法適用会社に対する持分相当額
その他の包括利益合計
四半期包括利益
(内訳)
親会社株主に係る四半期包括利益
非支配株主に係る四半期包括利益
㈱新日本科学(2395)2027年3月期
第1四半期決算短信〔日本基準〕(連結)
(3)四半期連結財務諸表に関する注記事項
(継続企業の前提に関する注記)
該当事項はありません。
(株主資本の金額に著しい変動があった場合の注記)
該当事項はありません。
(四半期連結キャッシュ・フロー計算書に関する注記)
当第1四半期連結累計期間に係る四半期連結キャッシュ・フロー計算書は作成しておりません。なお、第1四半期
連結累計期間に係る減価償却費(のれんを除く無形固定資産に係る償却費を含む。)及びのれんの償却額は、次のと
おりであります。
前第1四半期連結累計期間
(自 2025年4月1日
至 2025年6月30日)
減価償却費
のれんの償却
715,987千円
28,491千円
当第1四半期連結累計期間
(自 2026年4月1日
至 2026年6月30日)
760,556千円
28,830千円
㈱新日本科学(2395)2027年3月期
第1四半期決算短信〔日本基準〕(連結)
(セグメント情報等の注記)
【セグメント情報】
Ⅰ
前第1四半期連結累計期間(自 2025年4月1日至 2025年6月30日)
1.報告セグメントごとの売上高及び利益又は損失の金額に関する情報
(単位:千円)
報告セグメント
CRO
事業
トランス
メディポリス 米国不動産
レーショナル
事業
事業
リサーチ事業
計
その他
(注)1
合計
調整額
(注)2
四半期連結
損益計算書
計上額
(注)3
売上高
外部顧客への
売上高
セグメント間の
内部売上高又は
振替高
計
セグメント利益又
は損失(△)
6,171,699
14,319
169,797
43,313
6,399,129
78,547
6,477,677
6,477,677
11,050
32,762
40,375
84,188
76,364
160,552
△160,552
6,182,749
47,081
210,173
43,313
6,483,318
154,912
6,638,230
△160,552
6,477,677
769,071 △1,101,160
33,945
△23,782
△321,925
3,824
△318,100
△22,833
△340,934
(注)1.「その他」の区分は、報告セグメントに含まれない事業セグメントであり、建設事業等を含んでおります。
2.セグメント利益又は損失(△)の調整額△22,833千円は、セグメント間取引消去9,064千円、各報告セグメン
トに配分していない全社費用△31,897千円であります。全社費用は、主に報告セグメントに帰属しない一般管
理費であります。
3.セグメント利益又は損失(△)は、四半期連結損益計算書の営業利益と調整をおこなっております。
2.報告セグメントごとの固定資産の減損損失又はのれん等に関する情報
重要な変動が生じていないため、記載を省略しております。
Ⅱ
当第1四半期連結累計期間(自
2026年4月1日
至
2026年6月30日)
1.報告セグメントごとの売上高及び利益又は損失の金額に関する情報
(単位:千円)
報告セグメント
CRO
事業
トランス
メディポリス 米国不動産
レーショナル
事業
事業
リサーチ事業
計
その他
(注)1
合計
調整額
(注)2
四半期連結
損益計算書
計上額
(注)3
売上高
外部顧客への
売上高
7,530,526
59,755
183,374
49,245
7,822,900
45,972
7,868,873
7,868,873
6,829
53,795
60,624
68,594
129,218
△129,218
計
7,537,355
59,755
237,169
49,245
7,883,524
114,566
7,998,090
△129,218
7,868,873
セグメント利益又
は損失(△)
1,538,121
△966,010
16,442
△28,761
559,792
23,627
583,419
△61,684
521,735
セグメント間の
内部売上高又は
振替高
(注)1.「その他」の区分は、報告セグメントに含まれない事業セグメントであり、建設事業等を含んでおります。
2.セグメント利益又は損失(△)の調整額△61,684千円は、セグメント間取引消去3,579千円、各報告セグメン
トに配分していない全社費用△65,263千円であります。全社費用は、主に報告セグメントに帰属しない一般管
理費であります。
3.セグメント利益又は損失(△)は、四半期連結損益計算書の営業利益と調整をおこなっております。
2.報告セグメントごとの固定資産の減損損失又はのれん等に関する情報
重要な変動が生じていないため、記載を省略しております。