Language * [日本語](https://www.sbs-group.co.jp/sbshlds/foryourdreams/rbr_interview01/) * [English](https://www.sbs-group.co.jp/sbshlds/foryourdreams/rbr_interview01/) *…


*   [日本語](https://www.sbs-group.co.jp/sbshlds/foryourdreams/rbr_interview01/)

*   [English](https://www.sbs-group.co.jp/sbshlds/foryourdreams/rbr_interview01/)

*   [中国(简体)](https://www.sbs-group.co.jp/sbshlds/foryourdreams/rbr_interview01/)

*   [中國(繁體)](https://www.sbs-group.co.jp/sbshlds/foryourdreams/rbr_interview01/)
-
Contact Us
-
-
For Your Dreams.
For Your Dreams.
Under the slogan "For Your Dreams.", we will become a group that takes on the challenge of dreams, develop corporate activities to "realize dreams" for all stakeholders, and strive to improve corporate value.
 Web showroom
 Challenging the dream
-Ricoh Black Rams player Ikeda-
 SBS Truck Illustrated Guide
 SBS Truck Photo Gallery
-
Corporate information
Corporate information top
You can view basic information about the SBS Group, such as a message from the top management and management philosophy.
 top message
 Management Philosophy
 Company Profile
 List of officers
 Group company list
 Group history
 SBS Group CM Gallery
-
Solutions/case studies
Solutions/case studies
We propose the SBS Group's services, solutions, case studies, warehouses, and bases according to the customer's issues.
 Solution search
 Case study search
 Warehouse/base search
 Vacant warehouse search
-
Shareholder / Investor Information
Shareholder/Investor Information Top
You can view the financial results and IR activities of the SBS Group to date.
 top message
 growth strategy
Medium-term
Management Plan
SBS group at a glance
 IR library
Financial statements
Financial Results
Presentation Materials
Securities report
Business Report
Performance/
Financial Highlights
 Stock information
Basic stock information
Actual dividend
General meeting of shareholders
Electronic public notice
Performance Forecasts
financial position
Stock price information
(Yahoo! Finance)
IR calendar
Disclosure policy
IR news
-
Sustainability
Sustainability top
From the three perspectives of "peace of mind," "environment," and "human resources,"
Creating new value through SBS Group sustainability
 ESG Library
Integrated report
External evaluation
 Management policy
Top commitment
Corporate governance
Business risks
partnership
Health and
Productivity Management
 Toward the realization of a sustainable society
SBS Group Value Creation
ESG management
Ensuring safety
Consideration for the environment
Relationship with society
-
news
-
Employment information
All html pdf doc xls ppt
ALL categories SBS Holdings
match recent Ten 20 30 none small medium large
-
TOP
-
For Your Dreams.
-
Challenging the Dream - Ricoh Black Rum...
Challenging the dream
-Ricoh Black Rams player Ikeda-

Challenging your dreams...
It's about "believing in yourself and doing what needs to be done one step at a time. It's about building on that."
Since 2021, SBS Holdings has been an official partner of Ricoh Black Rams Tokyo, a team in the Japan Rugby League One Division 1. Through various activities, they have worked together to maximize the value of rugby and realize the team's vision, "Be a Movement," in an effort to inspire and encourage many fans. This time, we conducted a special interview with Yuki Ikeda, a key player for Black Rams Tokyo and a candidate for the Japanese national team. We spoke with him about SBS's philosophy, "For Your Dreams," the "dream" he continues to hold, and his challenges.
Rugby, which I started playing at the age of four, and the "dream" I held in my heart at that time.

--We'd like to start by discussing the theme "For Your Dreams." First, what impression does the word "dream" give you, Ms. Ikeda?
"Influenced by my parents, who loved rugby since childhood, I often watched Japan national team matches, the top league at the time, and university rugby. From that time on, I always thought, 'I want to stand on that field and play.' I thought about it every time I watched a match. My goal now is to stand on the pitch as a member of the Japan national team and to participate in the World Cup, but I believe that those feelings from when I was little led to my current dream."
—You were familiar with rugby from a young age, but what was theきっかけ (trigger/reason) that made you start playing it as a sport?
"Theきっかけ (trigger) was that a friend from the same kindergarten was playing rugby. My family and I were close, and I think it all started when he invited me to play together."
—So, from then on, you dedicated yourself entirely to rugby, is that right?
"Actually, I quit rugby in junior high school. My school didn't have a rugby club, and I also wanted to try basketball, so I took a break from the sport."
However, he chose to attend Tokai University Gyosei High School (Osaka, 6-time national champion), a school renowned for its rugby prowess.
"Tokai University has nationally renowned powerhouses in both rugby and basketball. Considering my plans to continue playing sports through university, I felt that attending Tokai University Gyosei High School, its affiliated high school, would be the 'right' choice, no matter which sport I chose to pursue."
—That's how you ended up at Tokai University Gyosei High School, where you won the 93rd Hanazono tournament (2013). Ikeda was also on the pitch as a member of the winning team. What made you decide to take up rugby again?
"Tokai University Gyosei High School's rugby team wasn't just aiming to participate in the national tournament; they were seriously striving to become the best in Japan. I also wanted to play at that level if I was going to dedicate myself to it, so I returned to rugby."
—I imagine you went through a lot of hardship, especially after that break.
"The only rugby I knew was elementary school rugby (laughs). I had watched matches, but the number of players had changed to 15, and the rules had changed too... From those basic things to the physical build, everything was completely different. There were about 120 members in the club, and several of them were on the high school national team."
-- Just getting into the team is a struggle.
"At Tokai University Gyosei High School, however, all the players, from beginners to those on the high school national team, practice together. I felt a huge difference in skill level, but I couldn't let my seniors down while they were practicing with the goal of becoming the best in Japan. In that sense, every day was a struggle."
—But even in those circumstances, I didn't give up.
"I didn't have any concrete evidence, but I believed in myself, thinking, 'I can do it, I can succeed.' Naturally, I wasn't able to play in any matches as a freshman. But at that time, I set myself a three-year goal. First, to build up my physique so that I could compete in high school rugby for a year. I set a target weight and worked on building my body. Then, in my sophomore year, I aimed to become a reserve (bench) member. Finally, in my junior year, I aimed to earn a starting position. I wasn't able to achieve my goal of becoming a reserve member in my sophomore year, but I could really feel that I had improved tremendously. I didn't give up, believing 'I can definitely do it,' and when I became a junior, I was able to earn a starting position."
—That must have made the joy all the greater.
"For three years, I practiced to win the championship at Hanazono. The moment we achieved that was a special feeling. In my experience playing rugby, becoming a champion is very difficult. Teammates, coaches, and luck—I think many things come together to lead to becoming a champion. But even though I've been playing rugby for a long time, I've only experienced being a champion once. During my time at Tokai University, we were runners-up twice in the university championship."
--You continued playing rugby throughout high school and university, and joined Black Rams Tokyo in 2021. You play as a key player on the team, but what kind of team is Black Rams Tokyo?
"I feel like we're a team with a lot of potential. Last year we didn't make the playoffs, and the season before that we had to play in the relegation playoffs (in 10th place). However, everyone believes we have the ability, and last season we were so close to the playoffs. We feel like we're very close, and we'll be challengers again next season. I think that hungry atmosphere is definitely present in practice."
Anxiety is inevitable when pursuing your dreams...
Instead, "focus on what you should do, what you want to do, and what is necessary."
--It seems that throughout your time playing rugby, Ikeda, you have always continued to "challenge" yourself in pursuit of your "dreams."
"Since returning to rugby, my high school team aimed to be the best in Japan, and the same was true during my university years. It's been the same since I became a working adult; I've always been fortunate enough to put myself in high-level environments."
—What do you do when you encounter unexpected obstacles or setbacks?
"When you hit a wall, I think it's a sign that you need to change something within yourself. In rugby terms, that might be when you're not selected for the team. But there's always a reason for that, and it means you haven't reached the level to be selected yet. So when you hit a wall, the first thing you need to do is understand what you need to do to overcome it. After that, you just need to believe in yourself and keep working hard. If you don't have confidence, you can't beat your opponents and you can't achieve your goals. You need to make a solid plan about what you need to do and then do what's in front of you."

Photo courtesy of Ricoh Black Rams Tokyo
—Listening to you speak, I sense a very strong will.
"I don't have any concrete evidence for it, but ever since I was little, I've always believed that 'there's no reason I can't do it.' I think that was the most important thing. After that, I think it's all about understanding what I needed to do and working hard at it."
--The SBS Group's philosophy, "For Your Dreams," is followed by "Challenging your dreams opens up the future," and your rugby career has truly embodied that philosophy.
"It's a tough process, but I believed that if I steadily improved step by step, I could eventually reach that point. First, I focused on doing each task in front of me, one at a time. I think it's all about building on that."
-- Mr. Ikeda's motto, "Don't fear the future, don't cling to the past, live in the present," seems to connect with the SBS Group's philosophy, "For Your Dreams."
"When you're about to start something new, or when you're changing your environment, anxiety is bound to come along. But I'm the type of person who thinks, 'There's no point in worrying about anxiety right now.' I think it's important to focus on what you should be doing now, what you want to do now, and what you need to do now."
--Black Rams Tokyo conveys the importance of having dreams and taking on challenges to children through activities such as rugby school and "guest teacher" programs where players visit nearby elementary schools to teach classes. Is there anything you would like to convey to children, Ikeda-san?
"Having a dream creates a path for you to walk, and from there you can see what you need to do next. I believe that if you think, 'Can I do it?' or 'I can't do it,' then you won't be able to achieve your dream or your goal. When you have a goal and a dream and move forward, you need to overcome obstacles and put in the effort. The most important thing when doing that is to believe in yourself. And once you have a dream, never give up. I think that's what you need to achieve it."
--Ikeda is also continuing to challenge herself in pursuit of her dream of becoming a member of the Japanese national team.
"When I participated in the national team training camp last year (2024), Head Coach Eddie Jones told me that working hard is extremely important. At the same time, he said, 'Keep your passion for rugby alive.' You can't face tough training without a strong desire to become a certain person. I realized the importance of always maintaining that passion."
SBS said, "We feel a strong connection to you... We appreciate your support. Your good play and matches give us energy every day."

—As you continue to pursue your dreams, you must sometimes feel reassured by the support of those around you. How do you feel about the support from partners such as the SBS Group?
"Without our sponsors, the team wouldn't exist, and we're able to focus on rugby thanks to their support. SBS Holdings, in particular, has their name on our jerseys, so we feel a very close connection to them. We're grateful for their support from such a close position. We want to have a positive impact on them through rugby, and they inspire us to play well and have good matches that will energize us every day."
--The power of support is immense, isn't it?
"It gives me so much strength. It really motivates me to want to repay their support and give back through my play. I'm happy to receive their support, and I myself watched rugby when I was a child, which gave me energy and vitality, so I want to be that kind of person for others. I got married last year, and my family has grown. I believe that fulfilling my own dreams will also lead to the happiness and joy of those who support me. Of course, I want to give back to the Rams Family (the nickname for Black Rams Tokyo fans) and our partner companies, but I also want to be able to give back to the people around me through rugby."
Yuki Ikeda, born May 21, 1995 (Heisei 7), is 30 years old. He is from Osaka Prefecture. At Tokai University Gyosei High School in Osaka, he won the Hanazono National High School Rugby Championship in his third year. He entered Tokai University in 2014 and was the runner-up in the University Rugby Championship in his second and third years. He joined NTT Communications in 2018 and Ricoh in 2021. In 2024, he participated in the Japan national team training camp for the first time. He has 0 caps for the national team, is 187 cm tall and weighs 98 kg.
SBS Holdings has been an official partner of Black Rams Tokyo since 2021, providing various forms of support. We spoke with Yoshikage Ohira, who is in charge of sponsor sales at Black Rams Tokyo, about the team's "dreams" and "challenges" as they continue their activities, with an eye on contributing to the local community through rugby.
SBS: "Top partner... their support has a positive impact on the entire team."
--Could you tell us about the connection between Black Rams Tokyo and SBS Holdings?
"SBS Holdings has been a partner since the very beginning. We even have their name on our jerseys, and they are considered our top partner. They have been helping us with team operations since the first year of League One. In addition to the team, they also have connections with SBS Ricoh Logistics, which handles logistics for the Ricoh Group, and we are grateful for their collaboration across the entire group."
--I understand that as a logistics company, you also provide support for team management.
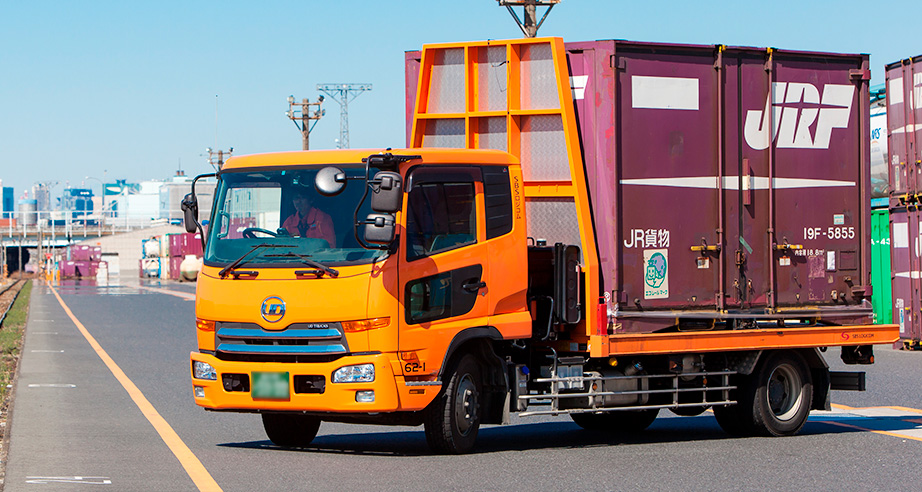
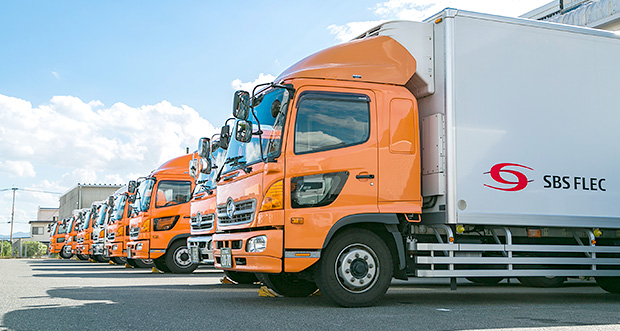
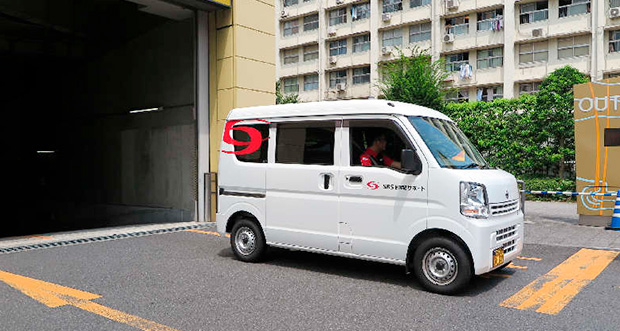
"They provide comprehensive support, including transporting luggage for away games and large-scale training equipment used during training camps. In addition, since becoming a partner, SBS Ricoh Logistics has created a special truck with the Black Rams Tokyo logo on it. I was very surprised when I first saw it. It looks really cool and has become a source of motivation for the players."


Photo courtesy of Ricoh Black Rams Tokyo
--I hear it's become a hot topic among the Rams Family (the nickname for Black Rams Tokyo fans).
"Apparently, it's also used for regular transportation services, and fans take pictures of it and upload them to social media. It's even become a topic of conversation because people say that spotting it in the city brings good luck (laughs)."
--It's reassuring to have the whole group supporting you.
"We are grateful for the cool advertisements SBS put up before the league season started, and for their help in building excitement. SBS's support has had a positive impact on the entire team."
--Could you tell us about Black Rams Tokyo's vision for the future?
"As a team, we aim to achieve the highest possible ranking. This is something that can be accomplished through the efforts of those on the ground, but at the same time, what we are aiming for is how well we can integrate into and become closely connected with the local people and the community. We are engaged in activities such as guest teaching and community service, but our goal is for Black Rams Tokyo to be the core, involving the local people and creating a wave of change. We would be happy if we could connect with SBS, of course, as well as our partner companies, the local community, and the government, and take Black Rams Tokyo to the point where horizontal connections can be made."
-- You can really feel the excitement, with flags being displayed at Futako-Tamagawa and Seijo Gakuenmae stations, which are the closest stations to your home ground.
"We even have a wrapped bus running around our local area, and we really feel the support. We will continue to work on various things in order to remain a presence that people can support."
Related Links

Corporate information

Solution search

Sustainability
Page Top
For Your Dreams.
Corporate information
Solutions/case studies
Shareholder / Investor Information
Sustainability
news
Employment information
Copyright © 2022 SBS holdings Inc. All rights reserved.