証券コード:2327(東証プライム、名証、福証) 2026年度第2四半期決算実績 ならびに 2025–2027 中期経営計画の進捗 2026年11月2日 日鉄ソリューションズ株式会社 代表取締役社長玉置和彦 Copyright © 2026 NS Solutions Corporation. All Rights Reserved. EXECUTIVE…
証券コード:2327(東証プライム、名証、福証)
2026年度第2四半期決算実績
ならびに 2025–2027 中期経営計画の進捗
2026年11月2日
日鉄ソリューションズ株式会社
代表取締役社長玉置和彦
Copyright © 2026 NS Solutions Corporation. All Rights Reserved.
EXECUTIVE SUMMARY
上期は売上・利益とも過去最高、通期営業利益見通しを490億円へ上方修正
2026年度上期実績
変革のハイライト
売上収益
営業利益
当期利益*
TAM型ビジネスモデルへの移行
1,990 億円
232 億円
前年同期比 +12% +206億円
149 億円
前年同期比 +27% +49億円
2026年度は売上の50%程度が
TAM型となる見通し
前年同期比 +24% +28億円
良好な需要環境の下、上期として売上収益・営業利益・当期利益ともに過去最高を更新
COREPEAK© 立上げ
2026年度通期見通し(上方修正)
オファリングブランド。
初年度100億円規模の
新規ビジネス創出を目標
売上収益
4,190 億円
前年比+10% +377億円/前回比±0億円
営業利益
490 億円
前年比+11% +48億円/前回比+5億円
当期利益*
324 億円
前年比+5% +16億円/前回比+1億円
Anthropicと戦略的パートナー
シップ
国内ユーザー系SIerとして初。
製鉄の現場を起点に
AI-Native化を推進
Copyright © 2026 NS Solutions Corporation. All Rights Reserved.
2
01
2026年度上期実績
上期:増収増益で過去最高を更新
Copyright © 2026 NS Solutions Corporation. All Rights Reserved.
3
1.2026年度上期実績
増収増益で上期過去最高値を更新 ― 粗利率も1.2pt改善
FY2025
上期
FY2026
上期
差異
増減率
前回
見通し
前回比
売上収益
1,784
1,990
+206
+12%
2,000
-10
売上総利益
461
539
+77
+17%
545
-6
売上総利益率
25.9%
27.1%
+1.2pt
27.3%
-0.2pt
販管費等
279
307
+28
+10%
330
-23
営業利益
183
232
+49
+27%
215
+17
営業利益率
10.2%
11.7%
+1.4pt
10.8%
+0.9pt
税引前利益
188
237
+49
+26%
219
+18
親会社の所有者に
帰属する当期利益
120
149
+28
+24%
133
+16
※前回見通し:2026年7月30日(1Q決算発表時)公表の第2四半期(累計)連結業績予想
Copyright © 2026 NS Solutions Corporation. All Rights Reserved.
売上収益 1,990億円(+12%)
国内IT需要は全般的に好調な状況が継続
売上総利益率 27.1%(+1.2pt改善)
高粗利案件の増加、
インフォコム取得時期差
販管費等 +28億円
インフォコム取得時期差、
セキュリティ強化投資、管理システム刷新費用等
営業利益 232億円(+27%)
上期として過去最高を更新
単位:億円
4
2.営業利益増減要因(上期)
増収と粗利率改善で+77億円、販管費等の増加28億円を吸収し+49億円の増益
+53
増収による売上総利益の増加
+24
-28
+53
232
183
FY2025上期
増収による
売上総利益率
販管費等
FY2026上期
実績
売上総利益増
の改善
の増加
実績
インフォコム影響(規模差)
+17
その他
+36
売上総利益率の改善
+24
インフォコム影響(率差)
+12
前年赤字案件解消
+6
粗利率の改善(官公庁案件・TAM型比率拡大等)
+6
販管費等の増加
-28
インフォコム影響
-22
管理システム刷新
-13
その他(既存システム費用減他)
+7
前回見通し(7/30)比 +17億円(215→232億円)
インフォコム影響(PPA・取得関連費用を含む) FY2025上期 → FY2026上期、億円
売上収益
売上総利益
販管費等
営業利益
規模
-3 売上収益前回見通し比-10億円
70 → 132
+63億円
32 → 61
+29億円
36 → 57
+22億円
▲4 → +4
+7億円
粗利率
-3 粗利率改善+7、原価への振替-10※
販管費等
粗利率 45.9%→46.0%
PPA・取得関連費用を含む
Copyright © 2026 NS Solutions Corporation. All Rights Reserved.
PPA等除き 8→12(+3)
下期への期ズレ+10、その他+3、
+23 原価への振替+10※
※販管費から原価への計上区分の振替(営業利益への影響なし)
単位:億円
5
3.サービス・顧客業種別売上収益/営業利益(上期)
産業・鉄鋼/コンサルティング&デジタル部門が好調
FY2025上期
FY2026上期
増減
売上増減率
売上収益
ビジネスソリューション
営業利益
営業利益率
売上収益
営業利益
営業利益率
売上収益
営業利益
営業利益率
1,388
157
11.3%
1,482
160
10.8%
+94
+3
-0.5pt
+7%
産業・鉄鋼
749
93
12.4%
843
95
11.3%
+94
+2
-1.2pt
+13%
流通・プラットフォーマー
361
34
9.5%
350
30
8.6%
-11
-4
-0.9pt
-3%
金融
278
30
10.6%
288
35
12.3%
+10
+6
+1.7pt
+4%
コンサルティング&デジタルサービス
695
32
4.6%
793
87
10.9%
+98
+55
+6.3pt
+14%
その他・調整額
-299
-6
-
-285
-15
-
+14
-9
-
合計
1,784
183
10.2%
1,990
232
11.7%
+206
+49
+1.4pt
(参考)日本製鉄向け
354
327
-27
+12%
-7%
※営業利益率=営業利益÷売上収益。グループ会社分は各サービス・顧客業種に含めて表示(インフォコムはFY2025 2Qより連結)
Copyright © 2026 NS Solutions Corporation. All Rights Reserved.
単位:億円
6
4.ビジネスソリューション部門の状況
上期は産業・鉄鋼が牽引し、売上+94億円(+7%)・営業利益+3億円の増収増益
売上収益(億円)
売上収益
(対前年同期)
増減要因(上期前年同期比)
産業・鉄鋼
流通・プラットフォーマー
金融
産業・鉄鋼
1,556
1,482
1,388
289
288
278
416
361
利益:販管費増(PPA等)と鉄鋼分野の減収による利益減を
インフォコム連結と産業分野の増収による粗利増で相殺し前年並み
843
上期
下期
上期
FY2026
営業利益(億円)・営業利益率(%) 積上げ/数値は合計/折線は部門計の営業利益率
流通・プラットフォーマー
金融
利益率 11.3% (-1.2pt)
売上:インフォコム新規連結+49、自動車・化学素材・電機/産業機械・食品・鉄道等の
産業分野+37、鉄鋼分野-24
852
産業・鉄鋼
営業利益 95 (+2)
350
749
FY2025
売上 843 (+94)
+13%
営業利益率
流通・プラットフォーマー
売上 350 (-11)
営業利益 30 (-4)
-3%
利益率 8.6% (-0.9pt)
売上:インフォコム連結(ヘルスケア)+14の一方、
小売-14、情報サービス-10
利益:減収とインフォコム関連の販管費増(PPA等)により減益
12.8%
11.3%
10.8%
199
157
31
56
30
34
112
93
上期
下期
FY2025
160
35
31
94
金融
売上 288 (+10)
+4%
営業利益 35 (+6)
利益率 12.3% (+1.7pt)
売上:グループ会社主体の増収(新規連結含む)
利益:増収と粗利率改善により増益、利益率は部門内で最も改善
上期
FY2026
Copyright © 2026 NS Solutions Corporation. All Rights Reserved.
※各要因の数値は前年同期比の増減額(億円)
単位:億円
7
5.コンサルティング&デジタルサービス部門の状況
上期は官公庁向け大型案件により売上+98億円(+14%)・営業利益+55億円
売上収益(億円)
売上収益
(対前年同期)
増減要因(上期前年同期比)
官公庁・教育機関向け
ITインフラ・ソリューション等
739
695
コンサルティング&デジタルサービス計
793
売上 793 (+98)
営業利益 87 (+55)
+14%
利益率 10.9% (+6.3pt)
売上:官公庁向け大型案件+111を主因に増収。
586
589
598
106
153
195
上期
下期
上期
FY2025
FY2026
利益:官公庁向け大型案件等で大幅増益
官公庁・教育機関向け
売上:官公庁向け大型案件+111
営業利益(億円)・営業利益率(%)
営業利益率
9.6%
10.9%
ITインフラ・ソリューション等
4.6%
87
71
売上:プロダクト+13、通信+11、パブリッククラウド+5の一方、社内向け-23
32
上期
下期
FY2025
上期
FY2026
※各要因の数値は前年同期比の増減額(億円)
Copyright © 2026 NS Solutions Corporation. All Rights Reserved.
単位:億円
8
6.受注高の状況(上期)
上期受注高2,128億円(+14%)、前期のインフォコム受注残の取込等を考慮した実質増加率は20%程度
1,864 → 2,128億円 +264億円 / +14%
産業・鉄鋼 925億円(+113億円)
+14%
2,128
・産業分野が大幅増
・鉄鋼分野は前年並み
・前年同期のインフォコム受注残取込*の反動を含む
1,864
546
■ コンサル&デジタル
351
290
412
流通・プラットフォーマー 330億円(-82億円)
-20%
327
■ 金融
330
■ 流通・PF
・本体の減は時期ズレが主体
・前年同期のインフォコム受注残取込*の反動を含む
金融 327億円(+37億円)
+13%
812
FY2025上期
925
・本体、グループ会社ともに増加
■ 産業・鉄鋼
コンサル&デジタル 546億円(+195億円)
FY2026上期
+56%
*インフォコム受注残取込影響:連結時に受注として取り込んだインフォコムの受注残額(175億円)
Copyright © 2026 NS Solutions Corporation. All Rights Reserved.
・官公庁向け主体に大幅増
・グループ会社も増加
※( )内は前年同期比の増減額
単位:億円
9
7.受注残高の状況
9月末受注残は2,128億円(+18%)、下期売上見通しのカバー率は56%(+2pt)
1,811 → 2,128億円 +317億円 / +18%
セグメント別の状況(9月末受注残・前年同期比)
セグメント別受注残高(億円)
■ 産業・鉄鋼 829億円(+164億円 / +25%)
産業分野が大幅増、鉄鋼分野、グループ会社も増加
■ 流通・PF 238億円(-32億円 / -12%)
本体、グループ会社共に減
2,128
■ 金融 213億円(+25億円 / +13%)
1,811
本体、グループ会社共に増
847
■ コンサル&デジタル
213
■ 金融
238
■ 流通・PF
■ コンサル&デジタル 847億円(+160億円 / +23%)
官公庁向け主体に大幅増
687
189
270
下期売上収益に対するカバー率
FY2026下期(売上収益見通し 2,200億円)
1,233
967
56%
FY2025下期(実績 2,030億円)
665
829
■ 産業・鉄鋼
1,100
930
54%
■ 9月末受注残から計上 □ 今後の受注・計上
2025/9末
2026/9末
Copyright © 2026 NS Solutions Corporation. All Rights Reserved.
カバー率は前年同期から2pt上昇
単位:億円
10
8.連結バランスシート
売上規模の拡大に伴いBSも拡大 ― 総資産は4,339億円(3月末比+163億円)に増加
連結財政状態の要約(億円) 2026年3月末 → 2026年9月末
2026/3末
上期の主な増減(3月末比)
2026/9末
増減
現金及び現金同等物
現金及び現金同等物
1,088
1,274
+186
営業債権・契約資産
1,049
1,104
+56
+186億円
営業CF +312(うち法人所得税の還付 +92)、投資CF -1
財務CF -126(期末配当 -82、リース負債返済 -35)
営業債権・契約資産
のれん・無形資産
644
657
+13
その他資産
1,395
1,303
-92
契約資産 +90(下期の売上計上に向けた進行中案件の積み上がり)
営業債権 -35
その他資産
資産合計
4,176
4,339
+163
リース負債
252
302
+50
1,036
1,080
+44
負債合計
1,288
1,382
+94
2,888
2,957
+69
負債及び資本合計
4,176
4,339
+163
+50億円
オフィス等の使用権資産の増加(+50)に対応
資本合計
資本合計
-92億円
3月末に計上していた未収還付税(127)の還付等
リース負債
その他負債
+56億円
+69億円
中間利益 +149、期末配当の支払 -82
※営業債権・契約資産は「営業債権及びその他の債権」と「契約資産」の合計。のれん・無形資産は「のれん」と「無形資産」の合計
Copyright © 2026 NS Solutions Corporation. All Rights Reserved.
単位:億円
11
9.連結キャッシュフロー
営業CF312億円 ― 手元資金1,274億円はM&A・成長投資の待機資金として規律をもって配分
FY2026上期現金及び現金同等物の増減
FY2025上期
FY2026上期
増減
営業活動によるCF
-123
312
+435
投資活動によるCF
-567
-1
+567
フリーCF
-690
312
+1,002
財務活動によるCF
-107
-126
-19
現金及び現金同等物期末残高
1,129
1,274
+144
+312
-1
-126
1,274
1,088
営業CF:増益に加え、前年同期の法人所得税支払(約300億円)等が剥落。
今期は法人所得税の還付(約90億円)もあり大幅改善
投資CF:前年同期はインフォコム取得(約550億円)を実行。
今期は設備・SW投資(-44)と有価証券償還(+52)でほぼ中立
財務CF:配当性向50%方針の期末配当(-82)とリース負債返済(-35)
資金配分の方針成長投資(売上比5%)・M&A(借入も活用)・株主還元(配当性向50%)を規律をもって配分
Copyright © 2026 NS Solutions Corporation. All Rights Reserved.
期首現金
営業CF
投資CF
財務CF
期末現金
単位:億円
12
02
2026年度業績見通し
通期ガイダンスは営業利益490億円に上方修正
Copyright © 2026 NS Solutions Corporation. All Rights Reserved.
13
10.2026年度ガイダンス(上方修正)
通期営業利益を485→490億円へ上方修正、年間配当は89.0円へ(前回見通し比+2.0円)
売上収益
営業利益
4,190 億円
前年比+10% +377億円/前回比±0億円
前期配当および当期配当見通し
当期利益*
490 億円
前年比+11% +48億円/前回比+5億円
前年比+5% +16億円/前回比+1億円
配当の推移(1株当たり配当金:円、配当性向:%)
中間配当
50.1%
30.2%
31.2%
FY2026
見通し
対前年
当期利益(億円)
308
324
+16
EPS(円/株)
168.5
177.1
+8.6
中間配当(円/株)
40.0
44.5
+4.5
期末配当(円/株)
45.0
44.5
-0.5
通期配当(円/株)
85.0
89.0
+4.0
50.4%
50.3%
324 億円
28.3%
FY2025
期末配当
50.4%
配当性向
50.3%
32.1%
85
89
45
44.5
36.5
40
44.5
FY2024
FY2025
FY2026
見込み
74
26.25
33
37.5
42.5
18
20
22.5
13.75
12.5
15
17.5
20
FY2020
FY2021
FY2022
FY2023
37.5
配当性向
年間配当 89.0円前年比+4.0円・前回比
+2.0円、配当性向 50.3%
※FY2023以前は2024年7月1日付株式分割(1株→2株)後のベースに換算。FY2024より配当性向の目安を30%→50%へ変更
Copyright © 2026 NS Solutions Corporation. All Rights Reserved.
14
11.2026年度半期別業績(上期実績・下期見通し)
上期進捗率は売上・営業利益ともに47%、通期営業利益は485→490億円へ上方修正
FY2025実績
FY2026(通期見通し 上方修正)
対前年(上段:増減率/下段:差異)
上期
下期
通期
上期実績
下期見通し
通期見通し
上期
下期
通期
売上収益
1,784
2,030
3,813
1,990
2,200
4,190
+12%
+206
+8%
+171
+10%
+377
売上総利益
461
557
1,018
539
591
1,130
+17%
+77
+6%
+35
+11%
+112
売上総利益率
25.9%
27.4%
26.7%
27.1%
26.9%
27.0%
+1.2pt
-0.6pt
+0.3pt
販売費及び一般管理費等
279
297
576
307
333
640
+10%
+28
+12%
+36
+11%
+64
営業利益
183
260
442
232
258
490
+27%
+49
-1%
-2
+11%
+48
営業利益率
10.2%
12.8%
11.6%
11.7%
11.7%
11.7%
+1.4pt
-1.1pt
+0.1pt
税引前利益
188
264
453
237
261
498
+26%
+49
-1%
-4
+10%
+45
親会社の所有者に
帰属する当期利益
120
188
308
149
175
324
+24%
+28
-7%
-13
+5%
+16
上期進捗率売上収益 47%
営業利益 47%
当期利益 46%
※ 当社は例年、下期に売上・利益が偏重する傾向
Copyright © 2026 NS Solutions Corporation. All Rights Reserved.
単位:億円
15
12.2026年度見通し 営業利益増減分析(上方修正)
FY2025実績442億円 → FY2026見通し490億円(+48億円)― 前回見通し比+5億円の上方修正
増収による売上総利益増
+101
+11
-64
490
442
+101
インフォコム影響(規模差)
+29
その他
+72
売上総利益率の改善
+11
インフォコム影響(率差)
前年赤字案件解消
AI、自社アセット投資
その他
+6
+6
-10
+9
販管費等の増加
-64
インフォコム影響
-21
管理システム刷新
-26
セキュリティ強化
-7
その他
-11
前回見通し(7/30)比 +5億円(485→490億円)
FY2025
実績
増収による
売上総利益率
販管費等
売上総利益増
の改善
の増加
Copyright © 2026 NS Solutions Corporation. All Rights Reserved.
FY2026
見通し
粗利率改善+10、新規施策・AIライセンス-10
粗利率
-20 原価への振替-20※
販管費等
+25 原価への振替+20※、その他+5
規模:売上収益4,190億円は前回見通しから変更なし
※販管費から原価への計上区分の振替(営業利益への影響なし)
単位:億円
16
03
2025–2027 中期経営計画の進捗状況
折り返し時点の到達点・残余課題・達成経路
Copyright © 2026 NS Solutions Corporation. All Rights Reserved.
17
14.2025–2027中期経営計画の概要
2030ビジョンの前半3カ年 ― 4つの抜本的変革で営業利益1,000億円への基盤を構築
NSSOL 2030ビジョン
"Social Value Producer with Digital"
2027年度定量目標
指標
4つの抜本的変革
2027年度目標
2025年度実績
売上収益
4,500億円
3,813億円
営業利益
600億円
442億円
13%
11.6%
ROE
13%程度
11.4%
TAM型売上比率
75%程度
38%程度
営業利益率
① 事業収益モデル
② 顧客アプローチ
TAM型収益モデルへの転換
オファリング起点で構想〜実装を
一貫支援
③ 技術獲得・適用プロセス
④ 社内業務・マネジメント
AI駆動開発による生産性向上
管理部門の集約・標準化
成長投資・株主還元
出所:当社 2025–2027中期経営計画(2025年2月公表)、2025年度決算説明資料(2026年4月)
Copyright © 2026 NS Solutions Corporation. All Rights Reserved.
M&A投資
M&A除く成長投資
株主還元
3カ年 1,500億円
売上収益比 5%程度
配当性向 50%
18
15.中期経営計画の進捗サマリー
営業利益・ROEは要加速、利益率向上と外部成長を最優先に推進
売上収益
軌道上
営業利益
ROE
要加速
要加速
TAM型比率
変革進行
3,383 → 4,500 億円
385 → 600 億円
10.9% → 13% 程度
5% → 75% 程度
FY24実績 → FY27目標
FY24実績 → FY27目標
FY24実績 → FY27目標
FY24実績 → FY27目標
FY26見込 4,190億円到達度 72%
FY26見込 490億円到達度 49%
FY26見込 11%程度到達度 19%
FY26見込 51%程度到達度 66%
年度別推移
現在地
売上収益
営業利益
ROE
TAM型比率
FY24実績
3,383
385
10.9%
5%程度
FY25実績
3,813
442
11.4%
38%程度
FY26上期実績
1,990
232
10.5%*
45%程度
FY26見込み
4,190
490
11%程度
51%程度
FY27目標
4,500
600
13%程度
75%程度
FY25は過去最高益・ROE改善。
4つの変革が実行段階に入り、社員の意識・行動も変化
残差
営業利益はFY26見込みから+110億円の積み上げが必要
達成経路
オーガニックは資本コスト上昇を踏まえた利益率向上を、
外部成長はM&A施策の推進を加速
*ROEは上期の親会社所有者帰属当期利益を年率換算(149億円×2÷期首・期末平均資本)した参考値
Copyright © 2026 NS Solutions Corporation. All Rights Reserved.
単位:億円
19
16.中期目標営業利益600億円への成長イメージと進捗
FY2024実績385億円 → 内部成長+145・外部成長+70で600億円へ
粗利率の上昇と外部成長の加速が課題 → 前倒しで使用した販管費の回収を強化
計画値 vs FY2026見込み
FY2026見込み 490億円 = オーガニック465 + 外部成長25
2025-2027 中期経営計画営業利益成長要因
(当初計画から2024年度見通し→実績のデータを補正)
オーガニック累計到達度
増収効果
100
55%(385 → FY26見込465 / 目標530)
計画 +155 ~26見込み+118
76%
110
70
600
IT需要取り込み/顧客基盤拡大
155
粗利率上昇
計画 +100 ~26見込み+50
50%
販売価格改善・販売構成改善・TAM型転換
385
販管費増
80%
計画 -110 ~26見込 -88
成長投資・人的資本強化・管理基盤刷新
外部成長(M&A)
FY2024
実績
増収効果
粗利率上昇
販管費増
外部成⻑
(M&A)
Copyright © 2026 NS Solutions Corporation. All Rights Reserved.
FY2027
目標
計画 +70 FY26見込 +25
36%
インフォコム連結貢献(PPA等反映後)
単位:億円
20
17.取組みを加速させる事項:粗利率改善
利益率向上を最優先 ― 変革の成果を「利益として残す」4つのレバー
01
02
03
04
TAM比率の向上
価値ベースPricingへの
転換
AI活用による生産性向上
不採算の抑制
課題
比率は上昇、
利益率への反映が不十分
課題
強化する取組み
• T・A・M型別に粗利率目標を
設定
• アセット再利用で原価低減、
COREPEAKを実案件へ
強化する取組み
• 先行案件の契約化を加速
• 成果連動・固定価格・サブスク
契約を標準化
人月前提の商慣行
Copyright © 2026 NS Solutions Corporation. All Rights Reserved.
課題
小規模案件への適用が遅れ、
計画未達
課題
不採算が改善効果を相殺する
リスク
強化する取組み
• Claude Code等を
標準プロセスに組込み
• 効率化分を利益に残す契約
設計、全社適用
(FY27 +20%)
強化する取組み
• 提案時リスク審査と
上流ゲートを強化
• 見積の標準化と誤差率の管理
21
18.事業収益モデルの変革 × 顧客アプローチの変革の相互作用
COREPEAKの実践がT型を増やし、現場へのフィードバックが新たなA型・M型を生む
② 顧客アプローチの変革
T型の増加
COREPEAK© 全社オファリングブランド
上流からのアプローチで開発の仕方を当社が主導。
生成AIを組み込んだ高生産性SIへ切り替えやすくなる
「変革シナリオ」で経営課題を構造化し、「オファリングBlock(課題解決アセット群)」を
組み合わせて構想から実装まで一気通貫で提供
A型・M型の創出
TAMをオファリング
Blockへ組み込み
FDE
実践知見のフィードバック
で新たなTAMを創出
現場に入り込むFDEが、オファリング実践で得た知見を持ち帰り
還流。顧客の共通課題が浮き彫りになり、アセット化・プラット
フォーム化へ
循環の担い手
フォワード・デプロイド・エンジニア
COREPEAKの価値向上
① 事業収益モデルの変革
T
SI Transformation
次世代SIモデル
A
Asset Driven
アセット活用型
M
Multi Company
Platform
PF提供モデル
強化されたアセットでオファリングBlockが拡充し、
提案価値がさらに向上。
好循環を全社で回す
TAM型比率 FY24 5% → FY25 38% → FY26見込 50% → FY27 75%
COREPEAK起点の売上創出目標
Social Value Producer with Digital
FY2026 100億円 → FY2027 全社売上の10%
A型・M型の主なプロダクト例はAppendixに掲載。FDE=Forward Deployed Engineer(お客様の現場に入り込み、構想から実装、知見の還流までを担う人材)
Copyright © 2026 NS Solutions Corporation. All Rights Reserved.
22
19.「投資」「実装」「収益化」の現在地
FY2026上期:先行投資を続けながら、AI活用とインフォコムの成果が利益に転換し始めた
投資
実装
収益化
投入した資本 | INPUT(累計)
先行KPI | LEADING KPI(2026/8)
財務成果 | OUTCOME(FY26上期)
出資・M&A(累計)
時間創出効果(全社・月)
インフォコム営業利益
600 億円 インフォコム550、B-Prost等
23.5万時間/月前回比約1.9倍
12 億円 FY26上期(FY25 33)
成長投資(累計)
同(人月換算)
連結貢献
238 億円 FY25 147+上期 91
1,470 人月月あたり(前回774人月)
+4 億円 PPA反映後(FY25 +10)
人的資本投資(累計)
生成AI活用率/ほぼ毎日利用
TAM型比率
71 億円 FY25 47+上期 24
50%超 / 64.5% 開発案件/全社
45 % FY26上期(FY25 38%)
現預金の活用
AIエージェント
営業利益
655 億円 25/3末 1,929 → 26/9末 1,274億円
2,107 名社員の32%が業務で利用
232 億円 FY26上期 +27%、過去最高
投資規模(累計)
生産性向上事例
次の刈り取り
909 億円 M&A・成長投資・人的資本の累計
36% / 45% 要件定義/製作工程
600 億円 FY27 営業利益目標
Copyright © 2026 NS Solutions Corporation. All Rights Reserved.
23
20.成長投資・M&Aの実績と今後の取り組み
企業価値成長に向けた成長投資・M&Aの遂行 ― 規律をもって案件化を推進
3カ年1,500億円のM&A枠
執行済 600億円(インフォコム 550、B-Prost 等)
2024年4月〜2026年9月:実績 ― 外部成長・資本提携を着実に実行
残枠 900億円 ― 中計期間内の案件化を推進
2026年10月〜2027年3月:今後実行すること
• 重点領域で候補を絞り込み、案件化へ
2024/4
OSPソリューションズをグループ会社化(現:日鉄ソリューションズ沖縄)
中期計画前半
• インフォコムのシナジーを具体化
2024/9
リクルートHD株式を全株売却(約743億円)― 成長投資・M&Aの原資を確保
2025/1
WCS ABYAKTA NAWASENA(インドネシア)を子会社化、ローカル市場へ
参入
• スタートアップとの資本業務提携を継続
2025年度
インフォコムをグループ化(約550億円)
― 100日PMIで統合、初年度から連結利益に貢献
成長投資・M&Aの遂行方針
2025/8
〜
資本業務提携4件:インテリジェントフォース、デリバリーコンサルティング、
N.Avenue、cBioinformatics
1
2026/5
B-Prostを子会社化 ― 損害保険会社向け基幹システム事業を強化
2
2026/9
Anthropicと戦略的パートナーシップ契約
― AIエージェント協働基盤・レガシー刷新へ
Copyright © 2026 NS Solutions Corporation. All Rights Reserved.
• グローバルのケイパビリティ取り込み
3
中計期間内に着実に遂行
1,500億円のM&A枠と成長投資(売上比5%)を重点領域で案件化
中長期リターン AND 中計目標
2030ビジョンの中長期リターンと、営業利益600億円・ROE13%程度を両立
資本効率と財務健全性の両立
手元資金を成長投資に活用し現預金900億円へ。借入も活用、配当性向50%維持
24
21.キャッシュアロケーション ― 中期経営計画の方針と進捗
中計方針どおり成長投資・M&A・株主還元へ配分、現預金は運転資金相当の900億円程度へ
2025–2027中期経営計画 キャッシュアロケーション方針(3カ年計画)
計画に対する進捗(FY2025実績+FY2026上期累計) 経過期間 18/36カ月
営業CF他
476 / 1,270
FY25 85(売却税金▲360含む)+FY26上期 391
借入
440
営業CF他
1,270
出資・M&A
M&A
1,500
600 / 1,500
FY25 580(インフォコム等)+B-Prost等
成長投資(人的資本投資含む)
309 / 690
FY25 194+FY26上期 115。売上比3.9%→5%へ
→
株主還元
成長投資(人的資本投資
含む)
690
224 / 480
FY25 142+FY26上期 82(期末配当)。配当性向50%
借入
0 / 440
R&Iから信用格付け取得(10月)、大型案件実行時の準備
期初Cash(2025/3)
1,929
株主還元
480
期末Cash(2028/3)
900
Cash In
Cash Out
▲ 経過期間 50%
現預金 1,929(25/3)→ 1,274(26/9)→ 900億円(28/3目標・月商2.4カ月)
資本コスト上昇への対応
ハードルレートに反映し、利益率向上と資本効率で資本コストを上回るリターンを確保
財務レバレッジの活用/M&A・成長投資の積極化/安定的な株主還元(配当性向50%)/
運転資本の最適化(月商2.4カ月)
Copyright © 2026 NS Solutions Corporation. All Rights Reserved.
単位:億円
25
(参考)当社事業特性とキャッシュ・コンバージョン・サイクルについて
大型開発案件が多くCCCが長いため、平時の適正現預金は月商約2.4カ月
大型システム開発(製造業向け)
マネージドサービス・サブスクリプション型
個別受託・プロジェクト型
①要件定義
②設計
③開発
継続課金・ストック型=A型・M型
④テスト
⑤検収
⑥請求
⑦入金
サービス提供
月次請求
入金
サービス提供
月次請求
入金
着手から入金まで 6カ月〜18カ月程度 ― 入金までのリードタイムが長い
1カ月単位で定常的に繰り返し ― 請求・回収が短期
主な特徴
財務への影響
主な特徴
財務への影響
• 大型・長期案件が中心
• 複雑な要件・カスタマイズ
• 検収/承認プロセスが多い
• 契約資産・未請求債権が増加
• 売上債権回転日数が長期化
• CCCが長くなる
• 継続的なサービス提供
• 月額・定額課金が中心
• 請求/回収が定常的・短期
• 売上債権回転日数が短い
• 契約負債(前受収益)が増加
• CCCが短くなる
同業他社の傾向(例)とNSSOLの状況(2027年度目標)
同業A社
B社
C社
D社
NSSOL
顧客・販売構成
金融証券主体
サービス・ストック主体
保守・サービス比率高い
当社と似た構成
製造業中心、大型開発比率が高い
CCC(月商換算)
約1.95カ月
約1.30カ月
約1.89カ月
約5.05カ月
約68日 = 約2.27カ月
Copyright © 2026 NS Solutions Corporation. All Rights Reserved.
26
22.残り18カ月の重点施策と進捗管理
6つの施策を半期ごとのマイルストーンで進捗管理し、先行KPIで早期に軌道修正
FY26下期
FY27
進捗管理の仕組み
施策ごとの管理項目
既存事業
TAM型拡大
案件獲得・価格是正
価値ベース契約拡大
利益最大化
対象案件拡大
粗利率上昇
利益貢献定着
効果額
責任部門
先行KPI
判断
モニタリングとレビューのサイクル
全社生産性向上
AI効果顕在化
AI駆動開発の加速
AIネイティブへの
移行
月次
インフォコム
PMI課題解消
シナジー拡大
収益貢献加速
四半期
案件遂行
M&A
資本配分
投資・還元実行
次期中期に向けた必要
Piece探索
目標資本構成実現
各施策は 効果額 × 責任部門 × 先行KPI × 判断期限 をセットで管理
Copyright © 2026 NS Solutions Corporation. All Rights Reserved.
半期
半期
KPIモニタリング
戦略実行マネジメントセンターが
集計・分析
経営会議・取締役会で審議
進捗と課題を確認し、打ち手を決定
マイルストーン到達判定
半期ごとの到達点を確認
決算説明会で開示
実績・KPI・事例で進捗を説明
↺ レビュー結果を各施策に反映し、次のサイクルへ
27
23.Anthropicとの戦略的パートナーシップ
規模ではなく「現場」で勝つ ― AnthropicのAI技術 × NSSOLの業務知見・構築力
先行する大手SIer: 全社展開の「規模」で先行
NSSOL(2026年9月) 国内ユーザー系SIerとして初の戦略的提携
製鉄の「IT・OT現場」で差別化
Client Zero:日本製鉄の現場 × Claude
01
02
03
AIエージェント協働基盤
レガシー刷新
日本製鉄という現場
散在するデータ・プロセスをAIエージェン
トで連携し、形式知化
Claude Codeで診断〜移行を一貫支
援し、ヘッドレスERPも提供計画
「クライアントゼロ」としてIT・OTの現場
で妥協なくAIを鍛える
今後の展開
• 展開業種:製造業から金融、流通・サービス、公共へ
• 共同マーケティング:Anthropicと国内外で推進
製造業から金融・流通・公共まで、AIを「事業を動かす当事者」へ
Copyright © 2026 NS Solutions Corporation. All Rights Reserved.
28
24.AI時代の変化を成長機会に ― NSSOLの強みと役割
AIは人月型SIにとって脅威。だが当社にとっては変革を加速する追い風となる。
AI時代の競争優位= 3つの力の三位一体
業務を読み解く力
業務の目的・判断基準・制約を構造
化し、AIが参照できる資産に
製鉄の現場を起点に多くの業種へ ― 長年の業務知見を蓄積
3つの力の掛け算で生まれる
業務を
作り替える力
人・AI・システムの役割を
再設計し、
業務プロセスを作り替える
AI時代の
競争優位
AIを
定着させる力
1
AIは人月・工数モデルを成り立たなくする。
だが、汎用AIツールを入れるだけでは価値は出ない
2
必要なのは AI Readyな基盤・ガードレール・業務への接続設計。
ここにAI時代のSIerの役割がある。
3
日本製鉄のミッションクリティカルな業務で培った業務知見は、
AIが正しく判断するための「コンテキスト資産」
AIを安全に組み込み、
ガバナンスとセキュリティ
で動かし続ける
何をAIに委ね、何を人が判断・責任を持つか ― その境界を描けるのは「ヒト」だけ
Copyright © 2026 NS Solutions Corporation. All Rights Reserved.
29
25.人とAIが協調してビジネスを遂行するプラットフォーム
製造業のケース ― 現場知識を「同じ意味」でつなぎ、人とAIエージェントが協調して意思決定する統合基盤
オーケストレータ
Human&AI Agent
協調ビジネス基盤
ディスカッションタイムライン
企業を実際に動かす
議論と意思決定の基盤
生産計画
Agent
営業
担当者
案件収益
マネージャ
購買
Agent
生産管理
Agent
在庫物流
Agent
AIエージェントを介してデータ・知識の提供
セマンティクス
業務意味基盤
AI Ready
ナレッジベース
オントロジ
各基盤の情報をセマンティクスとオントロジーで繋ぎ、AI Agentが部門やシステムをまたいで「同じ意味」で判断可能にする
オントロジーテンプレート
オントロジー自動生成
オントロジー統合
品質管理
変更管理
用語管理
暗黙知管理
Agent共通記憶管理
構造化データと
現場知識を統合・連携する
中核基盤
各種データソース
工場・業務・外部に存在する
あらゆるデータ
構造化データ基盤
設備データ基盤
ナレッジ統合基盤
構造化データの統合・分析・AI活用
OTデータを設備文脈に則り統合・活用
システム外にある現場の意味・関係・経験・規則を
構造化し、社外情報と共にAIが活用できるようにする
業務システムデータ
・ERP / 会計・販売・購買・
在庫・生産管理
・PLM / BOM管理
・MES / 製造管理
・CMMS / 保全管理
OTデータ(設備・センサ)
PLC/DCS
センサー
Copyright © 2026 NS Solutions Corporation. All Rights Reserved.
プロセスデータ
ドキュメント・ファイルデータ
・手順書・マニュアル
・報告書、日報
・図面、P&ID、仕様書
・Excel、CSV
外部・オープンデータ
・法規制、基準情報
・メーカー公開情報
・市場、原材料データ
30
26.昨今のサイバー攻撃の多発とNSSOLが提供する対応サービス「NSSIRIUS」
侵入を前提に、専任セキュリティ・アカウント・マネジャー(SAM)が平時から伴走し、サイバー攻撃の影響を最小化
他社にない3つのサービス強み
01
専任SAMの伴走
CISSP等の資格を持つセキュリティ・アカウント・マネ
ジャーがお客様専任で、平時の備えから有事の指揮支
援まで一貫して担当
02
AI × 統合ログ
複数センサーのログを統合し、AIを含む相関分析で潜
伏する攻撃の兆候をいち早く察知。実害が出る前に対
応を実践
03
リテーナー契約
年間クレジットを事前購入いただき、有事に見積・発注・
要員手配のタイムロスなく即時に着手。未使用分は平時
の診断・教育に充当
なぜ、NSSOLか ― SIerとしての総合力
01
システム全体の把握力
SIerとして基幹システムを構築・運用してきた経験によ
り、システム全体を俯瞰して対応。Anthropicとの戦略
的パートナーシップなどAIの知見も蓄積
02
アプリケーション開発の知見
昨今のサイバー攻撃にはPHPの脆弱性対応などアプリ
ケーション改修も必要。開発の知見を持つ人材が豊富で、
対策を実装まで完結
03
エヌエスシリウス
NSSIRIUSとは
インシデントレスポンス・リテーナーサービス
(2025年11月提供開始)。
プロアクティブ(リスク評価・脆弱性診断・教育・脅威ハンティング)
とリアクティブ(初動・分析・復旧支援・再発防止)の両面で、お客様
のCSIRT業務を包括的に支援。
セキュリティ機器の販売やSOC監視にとどまらず、「有事に判断し、
説明し、復旧できる体制」そのものを提供。
クライアントゼロでの実践知
30年超のセキュリティ事業。当社を含むグループのセ
キュリティ支援・運用で培った実践知をサービスに還元
サイバー攻撃対応は「総合力」が求められる時代へ
NSSIRIUSとSIerとしての総合力で、お客様のサイバー攻撃対策をトータルで支援
Copyright © 2026 NS Solutions Corporation. All Rights Reserved.
31
Appendix
四半期別業績・売上構成・粗利率推移・一過性要因・主要ニュース
Copyright © 2026 NS Solutions Corporation. All Rights Reserved.
32
27.四半期別連結業績
2Qは売上1,053億円・営業利益140億円、営業利益率13.3%と高水準
FY2025
1Q
2Q
FY2026
3Q
4Q
1Q
2Q
売上収益
827
957
970
1,059
937
1,053
売上総利益
210
251
270
287
248
291
25.4%
26.3%
27.8%
27.1%
26.5%
27.6%
販売費及び一般管理費等
125
154
142
155
156
151
営業利益
85
98
127
133
92
140
営業利益率
10.3%
10.2%
13.1%
12.5%
9.9%
13.3%
税引前利益
88
100
130
135
95
142
親会社の所有者に帰属する当期利益
51
69
91
97
52
96
売上総利益率
Copyright © 2026 NS Solutions Corporation. All Rights Reserved.
単位:億円
33
28.四半期別サービス・顧客業種別売上収益/営業利益
2Qは売上1,053億円(+10%)・営業利益140億円(+43%)、利益率13.3%
売上収益
営業利益
FY2025
FY2026
FY2025
1Q
2Q
3Q
4Q
1Q
2Q
1Q
635
753
746
811
727
755
産業・鉄鋼
335
414
402
450
415
流通・プラットフォーマー
166
194
208
208
金融
134
144
136
コンサル&デジタルサービス
371
324
官公庁・教育機関向け
43
営業利益率
FY2026
2Q
3Q
4Q
1Q
69
88
97
101
75
428
40
53
57
55
174
176
15
19
26
153
137
151
13
16
356
383
376
417
23
63
75
78
50
145
328
261
281
305
326
272
その他・調整額
-180
-120
-132
-134
-166
-119
合計
827
957
970 1,059
937 1,053
(参考)日本製鉄向け
178
176
173
166
ビジネスソリューション
ITインフラ・ソリューション等
178
2Q
FY2025
FY2026
1Q
2Q
3Q
4Q
1Q
2Q
85
10.9%
11.7%
13.1%
12.5%
10.3%
11.3%
46
49
12.1%
12.7%
14.1%
12.2%
11.1%
11.4%
30
13
17
9.2%
9.8%
12.4%
14.6%
7.6%
9.6%
15
16
16
20
10.1%
11.2%
10.8%
10.5%
11.5%
13.1%
9
32
39
26
60
6.1%
2.9%
9.0%
10.2%
7.1%
14.4%
-7
1
-2
-8
-9
-6
-
-
-
-
-
-
85
98
127
133
92
140
10.3%
10.2%
13.1%
12.5%
9.9%
13.3%
161
※営業利益率=営業利益÷売上収益。グループ会社分は各サービス・顧客業種に含めて表示(インフォコムはFY2025 2Qより連結)。官公庁・教育機関向け/ITインフラ・ソリューション等はデータ未入手のため空欄
Copyright © 2026 NS Solutions Corporation. All Rights Reserved.
単位:億円
34
29.売上収益の構成(単独)
上期は官公庁・大学が13.1%へ上昇、機器も11.2%へ ― 製造業は37.4%
需要分野別売上収益構成
商品・サービス別売上収益構成
単独計(社外売) FY2025上期 1,457億円 / FY2026上期 1,546億円
(製造業のうち日本製鉄 23.4% / 20.3%)
単独計(社外売) FY2025上期 1,457億円 / FY2026上期 1,546億円
2.8%
3.3%
8.0%
7.8%
7.6%
8.2%
11.2%
13.1%
15.7%
43.5%
14.6%
41.1%
その他
公共・公益
25.8%
23.8%
機器
官公庁・大学
運用/保守サービス
金融
構築・開発
流通・サービス
製造業
40.0%
37.4%
FY2025上期
FY2026上期
Copyright © 2026 NS Solutions Corporation. All Rights Reserved.
48.4%
47.7%
FY2025上期
FY2026上期
35
30.売上高総利益率の推移(四半期)
粗利率は中長期的に上昇トレンド、FY26上期は27.1%と前年同期から1.2pt改善、2Qは27.6%
30%
27.8%
28%
27.6%
27.1%
26.5%
26.3%
26%
25.4%
25.0%
24.4%
24%
23.5%
23.4%
22.7%
22.7%
22.5% 22.4%
22.7%
24.6%
23.2% 23.1%
22.8%
22.7%
22.0%
22%
21.6%
21.4%
20.5%
20.7%
19.9%
20%
18%
1Q
FY20
2Q
3Q
4Q
1Q
FY21
2Q
3Q
4Q
1Q
FY22
2Q
3Q
4Q
1Q
FY23
2Q
3Q
4Q
1Q
FY24
2Q
3Q
4Q
1Q
FY25
2Q
3Q
4Q
1Q
FY26
2Q
FY2020は日本基準
Copyright © 2026 NS Solutions Corporation. All Rights Reserved.
36
31.バランスシートの推移(2020/3末〜2026/9末)
政策保有株式の売却資金を、成長投資・M&Aと株主還元へ
総資産の構成と資本合計の推移(億円) ※資本合計の数値は右表参照
現金及び現金同等物
政策保有株式
BSの質の変化
その他資産(営業債権・契約資産、有形・無形資産、のれん等)
資本合計
2020/3 2025/3 2026/3
2,247
2,106
1,697
3,039
政策保有株式
/純資産(単体)
26%
1.6%
2.1%
具体的提携が
無いものは
保有せず
手元流動性
(月商換算)
2.5カ月
6.8カ月
3.4カ月
2.4カ月
資本合計(億円)
1,554
2,698
2,888
利益蓄積で
増加
3,009
1,799
1,339
中計目標
37
1,494
604
597
387
600
49
1,929
330
580
2020/3
786
957
1,013
1,040
2021/3
2022/3
2023/3
2024/3
56
1,088
1,274
2026/3
2026/9※
財務マネジメントの方針
健全なBSの維持
信用力と投資余力を確保
2025/3
大型投資は借入も活用
2022/4
2024/4
2024/9
2025/2
2025年度
2026年度〜
上場政策保有株式の
売却方針を公表
配当性向50%へ
引上げ、株式分割
リクルートHD株を
全株売却(約743億円)
中計:手元キャッシュ
約1,000億円圧縮、
月商2.4カ月へ
インフォコム取得等に
約580億円を投下
残るM&A枠・借入活用
で配分を継続
手元資金に借入も組み合わせ、資本効率を向上
株主還元は配当性向50%を維持
利益成長に連動した増配。ROEは資本コスト超を維持
※政策保有株式(上場・非上場の合計)の保有額・純資産比率は有価証券報告書に基づく単体ベース(2026/9末は連結BS注記より)
Copyright © 2026 NS Solutions Corporation. All Rights Reserved.
単位:億円
37
32.四半期別主要一過性要因・大型案件等
四半期比較の際に考慮すべき一過性要因と大型案件の一覧(FY2025 1Q〜FY2026 2Q)
FY2025
1Q
売上収益
2Q
営業利益
大型案件
4Q
957
Ⓢ 新規連結 70
85
一過性
受注高
3Q
827
大型案件
FY2026
970
Ⓢ 新規連結 68
1Q
2Q
1,059
Ⓢ 新規連結 88
937
1,053
G 94
(+1Q 17=上期 111)
Ⓢ 新規連結 64
98
127
133
92
140
1,112
1,085
1,124
1,072
1,056
取得費用 -7
752
Ⓢ 新規連結 248
Ⓒ G 268
Ⓢ 新規連結 38
Ⓢ 新規連結 118
Ⓑ O 152
Ⓢ 新規連結 75
G 65
G 64
Ⓑ:ビジネスソリューション、Ⓒ:コンサルティング&デジタルサービス、Ⓢ:子会社、O:Oracle、G:官公庁向け
Copyright © 2026 NS Solutions Corporation. All Rights Reserved.
単位:億円
38
33.主要ニュース・プレスリリース
2026年5月〜10月:AI・金融DX・業界特化型PFを中心に30件を発表
2026/10/29
R&Iから発行体格付「A(安定的)」を新規取得
2026/8/10
千葉銀行の新営業支援システムを構築
2026/10/29
Helpfeelと、AI時代のCX変革に向けた戦略的アライアンスで基本合意
2026/8/7
埼玉大学、教務事務システムを「CampusSquare」に刷新し、クラウド基盤にOCIを採用
2026/10/22
群馬銀行と第四北越銀行、「BM4Iサービスプラットフォーム」を共通採用
2026/8/6
バイブコーディングプラットフォーム「Alli Coworker」の販売を開始
2026/10/21
三島信用金庫、信用金庫として初めて金融機関向け電子契約サービス「FINCHUB」を採用
2026/7/9
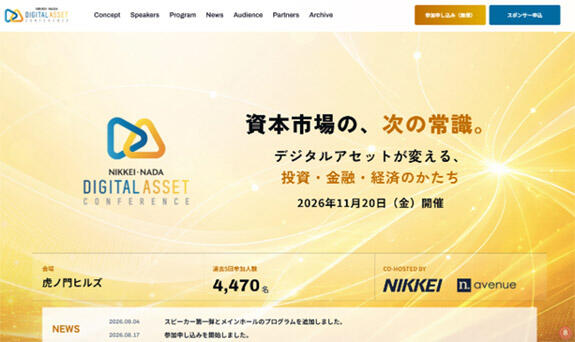
デジタルアセット次世代執行基盤の共同検証を開始
2026/10/15
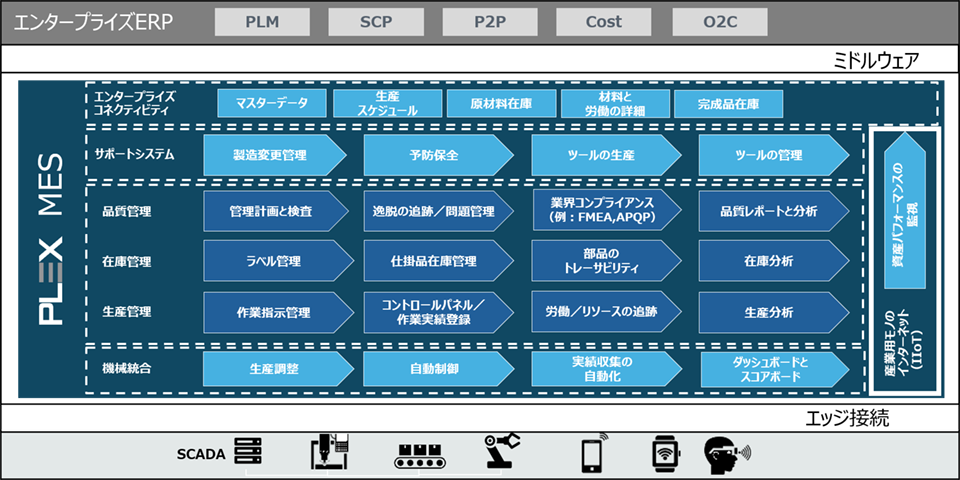
ロックウェル オートメーションのクラウド型MES「PLEX」の販売を開始
2026/7/9
日鉄ソリューションズと電通総研、次世代ITインフラ領域で協業へ
2026/10/13
日本デジタル分散型金融協会(JDFA)への参画を通じ、デジタル分散型金融市場の発展を
目指す
2026/7/2
暗号資産インデックス「NADA」、テスト算出開始と利用企業募集を開始
2026/10/1
BoxとDatabricksの連携により、企業データを横断的に活用するAIソリューションを提供
開始
2026/7/1
「NS DevCompass」にAI駆動開発を導入
2026/10/1
「統合報告書2026」を発行
2026/6/30
「DID/VC共創コンソーシアム AIエージェント×金融取引分科会」の発足について
2026/9/28
NSSOL、Anthropicと戦略的パートナーシップ契約を締結
2026/6/30
国内暗号資産ETFの実現へ、暗号資産インデックス協議会の報告書を公表
2026/9/28
「Appian INNOVATION AWARD」を受賞
2026/6/25
業界特化型ECプラットフォーム「NS Eclipa」の提供を開始
2026/9/24
顧客ID管理プラットフォーム「Auth0」を活用したID基盤ソリューションの提供を開始
2026/5/29
株式会社B-Prostのグループ会社化について
2026/9/17
横浜FG向け「BM4Iサービスプラットフォーム」導入プロジェクトを開始
2026/5/25
ソニー生命向けに投資運用管理プラットフォーム「SimCorp One」の導入を支援
2026/9/10
「HULFT Square」と「CONTRACT CROSS」の連携を開始し、電子契約業務の効率化と
デジタル化の支援を強化
2026/5/13
TeciemとAPAC地域における市場系ソリューションの販売強化に向けた戦略的パートナー
シップを締結
2026/8/25
CX・コンタクトセンター高度化支援サービス「NSRelato」の提供を開始
2026/5/12
統合ナレッジ基盤「データシンクロニシティプラットフォーム」と「Geminant」を連携したデー
タ活用環境の展開を本格化
2026/8/18
最適化モデルのライフサイクル管理プラットフォーム「wisepot」を提供開始
2026/5/7
松本市と「上高地の管理運営体制構築の研究に関する連携協定」を締結
Copyright © 2026 NS Solutions Corporation. All Rights Reserved.
39
34.日本製鉄グループとのシナジーと日本製鉄向け売上の推移
安定した基盤売上を起点に、All NSSOLのオファリングとAI成果をグループ全体へ
日本製鉄向け売上収益の推移(億円)
中期成長ストーリーを通したシナジー
• 日鉄グループのDXに、All NSSOLの全社オファリングで能動的に提案
706
625
553
653
• 日鉄テックスエンジと協業し、IT・OT領域のDXソリューションを創出
680
• 製鉄所で鍛えた技術をアセット化し、外部顧客・海外へ展開
579
親子上場メリットの活用と経営の独立性
• 700億円程度/年の安定販売先、先進IT/OTソリューションの実践フィールド
• 日本製鉄以外の売上収益が約80%、IT業界に精通した経営陣による独立した経営
• 親会社との重要な取引は独立社外取締役のみで構成される親会社取引等審議委員
会で審議し、利益相反を防止
FY2021
FY2022
FY2023
FY2024
FY2025
FY2026見通し
Copyright © 2026 NS Solutions Corporation. All Rights Reserved.
単位:億円
40
35.TAM型(A型・M型)の主なプロダクト・サービス例
事業分野ごとに業務知見をアセット化・プラットフォーム化し、複数顧客へ横展開
事業分野
¥
A型・M型の主なプロダクト・サービス(太字:プロダクト名)
共通領域
BPMS(ビジネスプロセスマネジメント) / 高度文書管理ソリューション(Box) / Geminant(デジタルツインPF) / NS Devia(AI駆動開発) /
CONTRACT CROSS(電子契約) / ConSeek(統合経営管理PF) / Oracle Alloy(クラウドサービス) / NSSIRIUS(サイバーセキュリティ) /
emerald SaaS(次世代運用サービス)
産業
PPPlan(食品業向けSCM) / PPCV(画像AIソリューション) / NSLOGIX(物流企業間データ連携PF) / Hakobini(配送協働PF)
鉄鋼
PPMP(生産管理パッケージ)― 素材産業向けプラットフォームとして展開
流通
fitAI(小売店舗AI支援) / COCOTRA(インバウンド旅行) / NS Eclipa(業界特化型ECプラットフォーム)
金融
BM4I(IFRS金融商品会計サービス) / Enesage(エネルギー取引管理サービス) / Web3金融データ提供プラットフォーム /
VIGILO MRM(モデル・リスク管理)
コンサル&デジタル
absonne(マネージド・クラウド) / NS DevCompass(AI駆動開発) / 統合ナレッジ基盤(データシンクロニシティPF) / OptiMagic(最適化業務支援)
目標粗利率(中計) T型 27%→30% A型 30%→40% M型 20%→30%(2027→2030年度) / Nestorium上で約35サービスが稼働
Copyright © 2026 NS Solutions Corporation. All Rights Reserved.
41
36.技術基盤と社内業務・マネジメント変革の進捗
統合報告書2026のエッセンス
各フェーズに最適なAIツールで開発生産性2倍へ ― 管理部門の生産性向上で販管費を抑制
③ 技術獲得・適用プロセスの変革 ― 標準プラットフォーム
基本構想
要件定義
設計
開発
④ 社内業務・マネジメントの変革
テスト
移行
NSDevia
開発AIエージェント(Jitera・Autify)、AI要件ビルドツール、
コーディングエージェント
Curatis
テスト自動化
NSSOLAS
汎用セキュア生成AIサービス(レビュー、脆弱性検査、PJ管理支援)
Nestorium
全社標準ITサービスPF:セキュリティ・クラウド連携・SBOM管理。
約35サービスが稼働
運用保守
管理部門売上高生産性(売上高/期末管理部門人員)
Base
+15%
+30%
2024年度基準
2025年度実績
2026年度目標
• 2025年4月、管理系組織を全社部門に集約し業務を標準化
• OA管理の全社集約・サービス化(NSSOLVIT)
• 法務・販売・購買・財務・人事にAIを適用、AIアクティブユーザー率76%
• Fit to Standard:FieldGlass本番化(2025/7)、SAP S/4HANA(2028/4予定)
• 売上拡大下でも管理部門人員を効率化し、販管費を抑制
生成AI活用の現状
従来型開発 → AI支援開発 →
AI駆動開発へ移行し、
開発生産性2倍を当たり前に
開発案件の50%超で活用
効率化率:新規開発で最大45%〜最小10%
要件定義 +36%・製作工程 +45%の事例
従来型開発
AI支援開発
AI駆動開発
人が全工程を手作業(人月が対価)
AIが補助・人が主導(活用率50%超)
AIエージェントが主導・人は判断・レビュー
出所:統合報告書2026 P.11(4つの抜本的変革③④の進捗)、2025年度決算説明会資料
Copyright © 2026 NS Solutions Corporation. All Rights Reserved.
42
37.サステナビリティ経営 ― マテリアリティ・KPIと外部評価
統合報告書2026のエッセンス
TAM型モデルはサステナビリティ経営の実践 ― 5つのマテリアリティをKPIで管理
マテリアリティ
主なKPI
2025年度実績
目標
① ITを通じた社会課題の解決
T型/A型/M型売上高
T 680億円(達成)/A 570億円(達成)/
M 35億円(未達)
FY26:
T 1,210/A 870/M 30億円
② 社会インフラとしての
ITサービス安定供給
ITサービス案件の
重大障害発生件数
0件(達成)
0件
③ 多様な人材が活躍できる場の創出
エンゲージメント/女性管理職比率
/男性育休取得率
57%(前年比向上)/8.2%/110%
前年度比向上/
2030年度 10%以上/90%
以上継続
④ 環境負荷低減
GHG排出量 Scope1+2/
Scope3原単位
14,526 t-CO₂
(2015年比▲64%)/83 t-CO₂/億円
2030年度半減、
2050年度 カーボンニュートラル/74
(2030年)
⑤ 信頼される社会の一員としての
ガバナンス/コンプライアンス追求
取締役会の実効性評価/
コンプライアンスe-learning受講率
実効性確保(第三者評価含む)/100%
継続/100%
関連するSDGs
人的資本
ガバナンス
外部評価
• 従業員数 10,276名(2026/3・連結)
• ビジネスアーキテクト職を新設、スキルポートフォリオを
年1回計測
• ビジョン浸透・共感 63.3%、成長意欲 66%
• 取締役11名中独立社外6名・女性2名
• 役員報酬にROE連動の譲渡制限付株式とマテリアリティ
評価
• 上場政策保有株式は原則保有せず(純資産比1%未満)
• 人的資本経営品質(シルバー)初受賞
• ホワイト500 初認定、プラチナくるみんプラス、えるぼし、
PRIDE指標ゴールド
• FTSE4Good/FTSE Blossom Japan 構成銘柄
SDGsアイコン:国連広報センター(UNIC)提供の日本語版アイコンを国連の使用ガイドラインに基づき使用。マテリアリティとの対応は当社サステナビリティ開示に基づく整理
出所:統合報告書2026 P.27–31(マテリアリティとKPI)、P.32–44(人的資本)、P.47–53(ガバナンス)、P.77–78(非財務情報)
Copyright © 2026 NS Solutions Corporation. All Rights Reserved.
43
38.情報セキュリティマネジメント
統合報告書2026のエッセンス
部門別管理から「全社統制・全社管理」へ ― セキュリティをAI時代の経営基盤に
ガバナンス・体制
規程・訓練・インシデント対応
• 情報セキュリティ委員会(経営会議相当)が方針を決定、
取締役会へ年次報告
• 全社直轄の情報セキュリティ本部が統括、SIRT部が監
視・対応
AI時代の新たなリスクと提供価値
• NIST CSF 2.0を主軸に、ISO/IEC 27001を参照
• 「セキュリティファースト」が各業界の標準に
• 全社員・委託先への年次教育、標的型メール訓練、経営層
参加の対応訓練
• Security for AI/AI for Security ― AI時代のガ
バナンス構築を支援
• 社長を本部長とする対策本部と5つの行動原則
• クライアントゼロの実践知をサービス化(NSSIRIUS等)
• PDCAとOODAを連携、内部統制・監査部が監査
全社統制・全社管理の体制 ― 経営のガバナンス(PDCA)と日々の対応(OODA)を連携
取締役会
年1回報告・助言
情報セキュリティ委員会
経営会議相当/方針を決定
情報セキュリティ本部
全社直轄/統括責任
守る3つの対象 × 参照フレームワーク
戦略推進部|PDCA
リスク評価→施策→監視→是正
SIRT部|OODA
観察→判断→決定→実行
内部統制・監査部:意思決定・対応の適切性と効率性を監査
NSSOLグループ各組織
[共通] 利用責任
[個別] 保全責任
お客様のシステム・
データ
GOVERN
IDENTIFY
提供サービスの
安全性
PROTECT
DETECT
グループ内の
情報資産
RESPOND
RECOVER
NIST CSF 2.0(主たる参照)+ ISO/IEC 27001(情報資産の保護)
情報セキュリティは「守りのコスト」ではなく、事業継続と顧客信頼の前提 ― 最も信頼されるSIerへ
出所:統合報告書2026 P.4(社長メッセージ)、P.49(ガバナンス強化のポイント)、P.55–60(対談4・情報セキュリティ)
Copyright © 2026 NS Solutions Corporation. All Rights Reserved.
44
39.グローバル戦略・外部成長戦略の進捗
統合報告書2026のエッセンス
海外売上は150億円超、インドネシアのローカル市場に参入 ― M&Aは規律をもって実行
グローバル戦略:海外売上 120億円 → 150億円超 → 250億円(FY27目標)
外部成長戦略:3カ年1,500億円で売上470億円・営業利益70億円程度の効果
• 製造・鉄鋼・流通向けERPソリューションが堅調、Dynamics 365を中国・タイ・
インドネシアで展開
• インフォコム:100日PMIで統合、今年度からシナジー本格化。GRANDITをAI化
• WCS ABYAKTA NAWASENA(インドネシア)を子会社化し、ローカル市場へ参入
• 各事業部門と外部成長推進WGを設置し、ミッシングパーツ獲得を推進
• 資本コスト超のリターンを基準に、買収後も継続モニタリング
• インド活用推進班(2026/1)を設置、技術人材の活用を本格化
• M&A・提携で技術とデリバリーネットワークを獲得
• 海外売上構成:パッケージ47%・スクラッチ28%・インフラ25%
グローバル人材基盤の活用 ― 海外の技術人材 × 日本の業務知見・品質
インド
時期
投資先
類型
目的
2025.08
インテリジェントフォース
出資
オファリング力・
上流コンサルティング力の強化
2025.09
デリバリーコンサルティング
出資
データ利活用領域での
コンサルティング力・実装力の強化
2025.11
N.Avenue
出資
暗号資産関連分野における事業共創
2026.03
cBioinformatics
出資
がんゲノム医療分野における事業共創
2026.05
B-Prost
子会社化
損害保険会社向け基幹システム事業の
強化
インド活用推進班(2026/1〜)技術人材の取り込み
インドネシア
技術人材・デリバリー力
AI・ERPの実装力
NSSOL(日本)
WCS ABYAKTA NAWASENA/
NSIDN:ローカル市場へ
日本製鉄で培った業務知見
高品質・高生産性のデリバリー
全社標準IT基盤・AI開発環境
タイ・中国・シンガポール
Thai NS Solutions/日鉄軟件/NS
Solutions Asia Pacific
米国・英国
NS Solutions USA/IT Consulting Europe
業務知見・品質・標準PF
(Nestorium・
Dynamics 365)
目標:海外売上 250億円(FY27)/NSSOLを真のグローバルブランドへ
出所:統合報告書2026 P.12(グローバル戦略・外部成長戦略の進捗)、P.7(社長メッセージ)、P.74(海外グループ会社)
Copyright © 2026 NS Solutions Corporation. All Rights Reserved.
45
40.価値創造プロセス ― 社会価値・顧客価値・経済価値の循環
統合報告書2026のエッセンス
社会価値を生み、経済価値を人材・技術・事業へ再投資する循環が成長ストーリー
パーパス
マテリアリティ
ともに未来を考え 社会の新たな可能性を テクノロジーと情熱で切り拓く
1 ITを通じた社会課題の解決
外部環境
2 社会インフラとしてのITサービス安定供給
ITメガトレンド
3 多様な人材が活躍できる場の創出
インプット
社会・経済の変化・技術革新
人的資本
NSSOL 2030ビジョン Social Value Producer with Digital
4 環境負荷低減
5 信頼される社会の一員としてのガバナンス/コンプライアンス追求
ビジネスモデル
NSSOL 2030ビジョン
アウトカム
社会価値
Social Value Producer with Digital
社会の新たな可能性の実現
資源効率の高度化
2025-2027 中期経営計画 4つの抜本的変革
知的資本
①
生成AI等新技術による
システム開発・運用の変化
企業による
デジタルビジネスの拡大
技術資本
事業収益モデルの変革
②
顧客アプローチの変革
③
技術獲得・適用プロセスの変革
④
社内業務・マネジメントの変革
顧客価値
T型
次世代SI
社会関係資本
A型
アセット活用
M型
PF提供
COREPEAK©
変革シナリオ × オファリングBlock
財務資本
AI時代の強み「業務設計力」
SIerとして培った強み
業界横断
プラットフォームの本格化
自然資本
業務知見 × 技術知見
業務を読み解く × 業務を作り替える
× AIを業務に定着させる
お客様の可能性を見つけ
カタチにする
経済価値(2030ビジョン)
売上 5,000億円/営業利益 1,000億
円
営業利益率 20%/ROE 15%程度
NSSOL付加価値の蓄積(FY25 1,546億円)
経済価値を 人材・技術・事業 へ再投資 ― さらに大きな社会価値を創出する循環
出所:統合報告書2026 P.23–24(価値創造プロセス)、P.6–7(社長メッセージ「サステナビリティ経営の実践としてのTAM型ビジネスモデル」)
Copyright © 2026 NS Solutions Corporation. All Rights Reserved.
46
41.NSSOL2030ビジョン実現に向けた成長投資の推進
統合報告書2026のエッセンス
「利益成長」と「次の成長基盤づくり」を並行 ― 投資→実装→収益化を段階管理
2025–2027 投資・基盤構築
M&A
2027–2030 実装・事業化
2030年代早期収益化・回収
取得・PMI
シナジー拡大
投資回収
事業・能力を獲得
投資実行額/PMI
利益貢献/案件化
IRR/ROIC
技術・基盤整備
商品化・顧客展開
収益モデル転換
AI・社内IT・実証
商用化/受注/再利用
売上/粗利/生産性
採用・育成・処遇
配置転換・高付加価値化
持続的成長力
能力・供給力を形成
人材確保/スキル獲得
高度人材比率/稼働
一人当たり付加価値
3カ年1,500億円|インフォコム等
成長投資
売上収益比 5%程度|AI・IT基盤
人的資本投資
社会価値創造型人材へのシフト
投資 | INPUT
実装 | LEADING KPI
収益化 | FINANCIAL OUTCOME
出所:2025–2027中期経営計画、統合報告書2026 P.9–12・P.19–22。
Copyright © 2026 NS Solutions Corporation. All Rights Reserved.
47
42.NSSOLの生成AI関連実績 ― 1Q開示からの進捗
社内実践は「使う」から「成果を広げる」へ ― 時間創出は約1.9倍、AIエージェント活用が本格化、Anthropic提携で加速
社内実践
SI案件・開発プロセス
最近のプレスリリース・事例
時間創出効果(全社・月)
生成AI活用率
2026/9
123,900時間
235,236時間
50%超 を維持し、AI駆動開発へ
774人月 → 1,470人月相当
Anthropicと戦略的パートナーシップ契約
国内ユーザー系SIerで初。製鉄の現場をClient Zeroに
AIエージェント協働基盤・レガシー刷新を推進
開発業務での利用ツール
ほぼ毎日利用する社員
48%
Claude/Claude Code の利用が大幅増
64.5%
2026/8
M365 Copilot・NSSOLAS に次ぐ利用規模。
9月にAnthropicと戦略的パートナーシップ
バイブコーディングPF Alli Coworker
販売開始
AI駆動開発をお客様の内製化支援へ展開
週2〜3日以上は 73% → 84%
生産性向上の事例
AIエージェント
要件定義 +36%・製作 +45%
2,107名(32%)が業務で利用
• AI駆動開発基盤 NSDevia を全社展開
(設計・テスト文書作成支援)
• 「開発生産性2倍を当たり前に」へ標準プロセスに組込み
• 2026年8月全社サーベイ:回答6,624名(87%)
• NSSOLAS Dify 拡張・Copilot Studio 本番展開、
全社学習支援
2026/6
AIエージェント×金融取引分科会を発足
DID/VC共創コンソーシアム。AIエージェントによる
金融取引の将来像を共同研究
自社実践 × SI実装力 × 顧客業務変革を一体で支援 ― 社内で鍛えたAI活用の実践知を、お客様の業務変革と当社の生産性(T型)へ還流
出所:NSSOL AI SURVEY 2026(2026年8月、回答6,624名)、時間創出効果は選択肢の細分化等により前回と算出条件が異なる
Copyright © 2026 NS Solutions Corporation. All Rights Reserved.
48
43.変革施策の進捗:COREPEAK・AI駆動開発・社内業務変革
オファリング・AI・業務の3つの変革で、営業利益600億円達成の確度を高める
AI駆動開発
社内業務変革
技術獲得・適用プロセスの変革
社内業務・マネジメントの変革
オファリングブランド
100億円規模
+20%
+30%
2026年度の新規ビジネス創出目標
2027年度の開発生産性向上目標
2026年度管理部門の売上高生産性目標
• 2026年4月に展開開始
• AI駆動開発による生産性向上を実証済み
• 管理部門を集約・標準化
• 「変革シナリオ」×「オファリングBlock」で構想から
実装まで一気通貫
• Anthropicとの提携と連動し適用を拡大
• 管理システム刷新で業務を再設計
• 小規模案件への適用を加速し、FY27に+20%へ
• 2025年度の販管費増(+144億円)は
インフォコム子会社化(+99億円)と
中計施策の前倒し実行が主因
• 今年度100億円規模の新規ビジネス創出へ
出所:当社 2025年度決算説明資料(2026年4月)、COREPEAK展開開始に関するプレスリリース(2026年4月8日)
Copyright © 2026 NS Solutions Corporation. All Rights Reserved.
49
本資料は、金融商品取引法上のディスクロージャー資料でなく、その情報の正確性、完全性を保証するものではありません。また、本資料に記載された将来の予測等は、開示の時点で入手可能な情報に基づき
当社が判断したものであり、不確定要素を含んでおります。従いまして、本資料のみに依拠して投資判断されますことはお控えくださいますようお願い致します。本資料利用の結果生じたいかなる損害につい
ても、当社は一切責任を負いません。本資料中には当社および他社製品の登録商標されたサービス名・商品名等を含みます。
Copyright
©2026
Solutions
AllCorporation.
Rights Reserved. All Rights Reserved.
Copyright
©NS
2026
NSCorporation.
Solutions
50


 日鉄ソリューションズ株式会社 デジタルソリューション&コンサルティング本部 HCM&組織変革グループ グループリーダー 西川 義信