2026年10月の月次売上高等について
Bull 1
Bear 0
Routine
Fiscal year ends February
Quarters are offset from the calendar — Q1 is Mar–May
|
STUDIO ALICE Co., Ltd. operates a photography studio chain and a costume manufacturing and wholesale business. The company provides commemorative photography services for children and families, covering milestones such as Shichi-Go-San, kindergarten and school graduations, temple visits, and maternity sessions. Its product portfolio includes photo albums, frames, keychains, and other photo items, alongside rental services for furisode (formal kimono) and specialized costumes. The group also offers a private studio concept called Studio Moaly, a pet photography service, and a school photo sales service for kindergartens, daycare centers, and elementary schools. STUDIO ALICE collaborates with brands such as Pokémon, Sumikko Gurashi, and Kuma no Gakko for themed photo backgrounds and costumes. The company operates a mobile application for viewing and ordering prints and photo products, and provides a housekeeping service in Osaka. Its group structure includes five subsidiaries and two other related companies, with one subsidiary operating the Neis Gymnastics Studio. Summarised from the annual report, fiscal year ended Feb 2026 |
Industry Personal Services | Homepage studio-alice.co.jp |
| Sector Consumer Cyclical | IR page ir.studio-alice.co.jp/ja/Top.html | |
|
Tags
children photography, maternity photography, pet photography, costume rental, furisode rental, photo printing, school photography, private studio, housekeeping services, gymnastics classes, Studio Moaly, Neis Gymnastics Studio, ALICE IN WONDER WALL, Alice Sitter, KOGYARU, TGC KIDS, Resort Trust, Charity Santa, Nexy Wonder Wall
|
Press page studio-alice.co.jp/company/news |
Metrics
| Valuation | |
|---|---|
| Market cap | ¥ 31.433B |
| Market cap (USD) | $ 196.456M |
| P/E | 19.95 |
| PEG | — |
| P/BV | 1.07 |
| P/S | 0.95 |
| P/OCF | 5.56 |
| P/FCF | 9.31 |
| Dividend yield | 2.7% |
| Turnover / mcap | — |
| Returns | |
|---|---|
| ROE | 3.8% |
| ROI | 3.8% |
| ROIC | 4.3% |
| Profit margin | 3.5% |
| Growth | |
|---|---|
| Revenue growing | No |
| Profits growing | No |
| Revenue up 3y | No |
| Revenue up 5y | No |
| Earnings growth 3y (net profit CAGR) | -19.9% |
| Quality | |
|---|---|
| Profitable | Yes |
| Margin expanding | No |
| Buying back stock | No |
| Diluting (TTM) | No |
| Debt/Equity | — |
| Podcast bulls (TTM) | Sign up |
| Podcast bears (TTM) | Sign up |
| Podcast sentiment (TTM) | Sign up |
| Podcast sentiment % (TTM) | Sign up |
| News sentiment (TTM) | 12 |
| Quality score | -27.8% |
| Insiders | |
|---|---|
| Buys, 1w | Sign up |
| Buys, 1m | Sign up |
| Buys, 1y | Sign up |
| Sells, 1w | Sign up |
| Sells, 1m | Sign up |
| Sells, 1y | Sign up |
Sign up to see this company's insider trades
| Figure | FY 2026 | FY 2025 | FY 2024 | FY 2023 | FY 2022 | FY 2021 | FY 2020 | FY 2019 | FY 2018 | FY 2017 | FY 2016 | FY 2015 | FY 2014 | FY 2013 | FY 2012 |
|---|---|---|---|---|---|---|---|---|---|---|---|---|---|---|---|
| Revenue | 32.928B | 35.598B | 36.396B | 38.564B | 40.672B | 36.353B | 38.879B | 39.644B | 43.057B | 38.719B | 38.719B | 38.142B | 37.061B | 35.367B | 33.794B |
| Net profit | 1.162B | 1.365B | 1.157B | 2.258B | 3.614B | 2.434B | 1.21B | 2.037B | 1.706B | 3.015B | 3.015B | 2.709B | 1.75B | 1.237B | 1.72B |
| Free cash flow | 2.456B | 4.325B | 2.198B | -152.434M | 4.666B | 3.015B | 632.576M | 4.384B | 733.968M | — | 2.71B | 1.603B | — | — | — |
| Figure | FY 2026 | FY 2025 | FY 2024 | FY 2023 | FY 2022 | FY 2021 | FY 2020 | FY 2019 | FY 2018 | FY 2017 | FY 2016 | FY 2015 | FY 2014 | FY 2013 | FY 2012 |
|---|---|---|---|---|---|---|---|---|---|---|---|---|---|---|---|
| Share price | 1.998K | 2.017K | 2.03K | 2.058K | 2.171K | 2.031K | 1.551K | 2.287K | 2.551K | 2.164K | 2.164K | 2.136K | 1.646K | 1.384K | 1.241K |
| Price performance 12m | -0.01 | -0.01 | -0.01 | -0.05 | 0.07 | 0.31 | -0.32 | -0.1 | 0.18 | 0.01 | 0.01 | 0.3 | 0.19 | 0.12 | — |
Filed figures
Lines the statements and their notes report beside the headline figures, read from the filings' XBRL as filed (no restatement applied), with figures computed from one filing's own lines. Cash-flow lines carry their cash direction: an outflow is negative. Each period links to its filing; a figure's period, report date and tag are in its tooltip.
| Figure | Feb 2019 | Mar 2019 | Feb 2020 | Feb 2021 | Feb 2022 | Feb 2023 | Mar 2023 | Feb 2024 | Feb 2025 | Feb 2026 |
|---|---|---|---|---|---|---|---|---|---|---|
| Balance sheet detail | ||||||||||
| Trade receivables (JPY) | 758M | 758M | 839M | 835M | 844M | 2.12B | 2.12B | 1.97B | 1.85B | 1.8B |
| ↳ YoY growth | +13.4% | +13.4% | +10.6% | -0.4% | +1.1% | +151.5% | +151.5% | -7.1% | -6.1% | -2.7% |
| ↳ 5y CAGR | +26.0% | +26.0% | +21.1% | +17.2% | +16.6% | |||||
| Lease liabilities (JPY) | 2.28B | 2.28B | 2.28B | 2.67B | 4.49B | 4.69B | 4.69B | 4.07B | 2.52B | 945M |
| Cash and deposits (JPY) | 12.4B | 12.4B | 11.1B | 13.6B | 19.2B | 17.9B | 17.9B | 18.4B | 19.5B | 18.3B |
| Intangible assets (JPY) | 1.31B | 1.31B | 992M | 974M | 998M | 1.05B | 1.05B | 1.08B | 984M | 878M |
| Cash flow detail | ||||||||||
| Operating cash flow (JPY) | 8.42B | 8.42B | 4.55B | 6.67B | 9.37B | 4.04B | 4.04B | 5.7B | 6.34B | 4.88B |
| Purchases of property, plant and equipment (JPY) | -3.41B | -3.41B | -3.39B | -3.24B | -4.33B | -3.82B | -3.82B | -3.05B | -1.68B | -2.09B |
| Purchases of intangible assets (JPY) | -627M | -627M | -527M | -408M | -376M | -377M | -377M | -446M | -330M | -343M |
| Change in receivables (cash effect) (JPY) | -101M | -101M | -82.8M | 7.2M | 9.29M | -213M | -213M | 88.9M | 59.6M | 30.6M |
| Change in inventories (cash effect) (JPY) | 14.6M | 14.6M | -160M | -498M | 734M | -457M | -457M | 67M | 179M | 203M |
| Change in payables (cash effect) (JPY) | -22.3M | -22.3M | 14.3M | 45.2M | 11.7M | 13.1M | 13.1M | -55.5M | -25M | -47.7M |
| Dividends paid (cash effect) (JPY) | -849M | -849M | -849M | -849M | -849M | -1.19B | -1.19B | -1.19B | -1.19B | -849M |
| Share buybacks (cash effect) (JPY) | -168,000 | -168,000 | -6,000 | -257,000 | -47,000 | -113,000 | -113,000 | — | -258,000 | — |
| Interest paid (cash effect) (JPY) | -14.3M | -14.3M | -15.9M | -29.3M | -23.2M | -24.3M | -24.3M | -21.8M | -21.2M | -14.9M |
| Income taxes paid (cash effect) (JPY) | -141M | -141M | -1.5B | -953M | -1.62B | -2.35B | -2.35B | -1.06B | -478M | -875M |
| Operating cash flow before change in receivables (JPY) | 8.52B | 8.52B | 4.63B | 6.66B | 9.36B | 4.25B | 4.25B | 5.61B | 6.28B | 4.85B |
| Free cash flow (OCF - PPE - intangibles) (JPY) | 4.38B | 4.38B | 633M | 3.02B | 4.67B | -152M | -152M | 2.2B | 4.32B | 2.46B |
| Income detail | ||||||||||
| Total comprehensive income (JPY) | 2.1B | 2.1B | 1.26B | 2.62B | 3.9B | 2.19B | 2.19B | 1.62B | 1.31B | 1.29B |
| Comprehensive income to owners (JPY) | 2.03B | 2.03B | 1.18B | 2.56B | 3.83B | 2.18B | 2.18B | 1.62B | 1.3B | 1.29B |
| Provision for credit losses (JPY) | -934,000 | -934,000 | 9.84M | 5.16M | 2.18M | 41M | 41M | 6.01M | 1.19M | 1.81M |
| Credit cost ratio (credit losses / average receivables) (%) | 0.1% | 0.1% | 1.2% | 0.6% | 0.3% | 2.8% | 2.8% | 0.3% | 0.1% | 0.1% |
| Reported | May 29, 2019 | May 29, 2020 | May 31, 2021 | May 31, 2021 | May 27, 2022 | May 31, 2023 | May 29, 2024 | May 28, 2025 | May 28, 2025 | May 27, 2026 |
Sign up to see institutional holdings
Sign UpPodcast Mentions
Sign up to see podcast mentions and sentiment
Sign UpTimely disclosures published on TDnet, newest first, titles as filed in Japanese. The link opens the disclosure on TDnet. Filings with EDINET (periodic reports, extraordinary reports, offerings, holding and buy-back reports), newest first, titles as filed in Japanese. The link opens the filing on EDINET. Press releases from the company's own website, newest first.
2026年9月の月次売上高等について
Bull 2
Bear 0
Results
当社の2026年9月(2026年9月1日から2026年9月30日まで)の月次売上高お
よび出店状況について、次の通りお知らせいたします。 1.2026年9月の売上高・前年同月比(個別) (1) 各月売上高・前年比等
(単位:百万円)
月次売上高(A)
前年同月売上高(B)
前年同月比(A)/(B)
3月度
2,559
2,667
95.9%
4月度
2,170
2,207
98.3%
5月度
2,498
2,423
103.1%
6月度
2,415
2,018
119.6%
7月度
1,756
1,696
103.5%
8月度
2,027
2,221
91.3%
9月度
3,010
2,360
127.5%
10月度
3,284
11月度
4,562
12月度
3,107
1月度
1,679
2月度
1,773
通期計
30,002
(2) 今年度累計売上高・前年比等
(単位:百万円)
月次累計売上高(A)
前年同月売上高(B)
前年同月比(A)/(B)
3月度
2,559
2,667
95.9%
4月度
4,729
4,875
97.0%
5月度
7,227
7,298
99.0%
6月度
9,643
9,317
103.5%
7月度
11,399
11,014
103.5%
8月度
13,426
13,235
101.4%
9月度
16,436
15,596
105.4%
10月度
18,880
11月度
23,442
12月度
26,550
1月度
28,229
2月度
30,002
(注)① 売上高は直営店舗(393店舗)の売上高、ならびに、FC店舗(9店舗)からのロ イヤリティおよびFC店舗への什器備品等の供給高の合計です。 ② 売上高の数値は未監査です。 ③ 売上高の数値のうち店舗売上高は、撮影基準により算出しており、完成基準の適用等、 所要の会計上の修正は行っていません。 (撮影基準の売上高とは、毎月1日から月末ま での受注金額をいい、完成基準の売上高とは、当月に仕入高が計上された受注金額を いいます。 ) ④ 通期計および累計値は、決算修正の数値を含んでおります。 2.2026年9月の撮影件数(客数)、お買上単価の前年比 (1) 全店 撮影件数(客数):127.0%、お買上単価:101.4% (2) 既存店 撮影件数(客数):128.6%、お買上単価:101.5% 3.2026年9月の出店等の状況 (1) 移転 〔スタジオアリス〕 ① 新下関店〔旧シーモール下関店〕 (山口県) 2026年9月11日開店 (2) 統廃合による退店 〔スタジオアリスBaby〕 ① イオンモール神戸南店(兵庫県)
2026年9月6日退店
以
上


 予約・検索は
 富士フイルム・





 スタジオアリス、



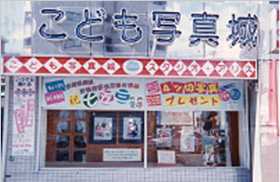 *
 お子さまとご家族の今までにないファンタジックな写真館であることを「こども写真城」という名称で強くアピールした1号店。

 シンボルマークと社名表示のロゴタイプ
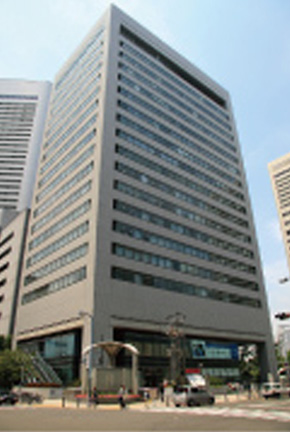 大阪駅前・第一生命ビル
 *

 *

 *
 *
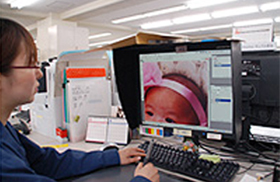
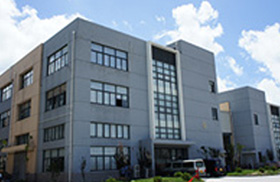
 すべてはお客様の笑顔のために。座学と実習を積み重ねる施設、研修センター
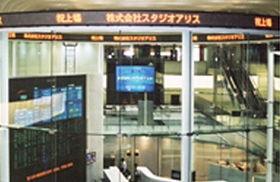 東京証券取引所、祝上場のメッセージ
 *


 *
 *



 *

 *



 *



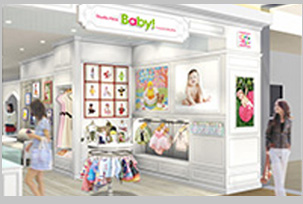





 *





 © Disney

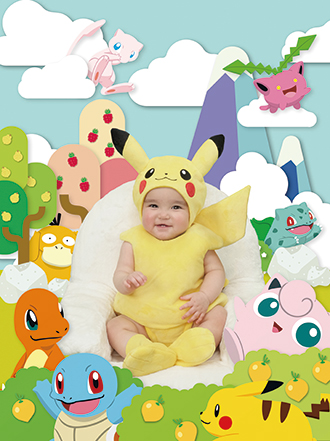 *
 © 2021 Pokémon. © 1995-2023 Nintendo/Creatures Inc./GAME FREAK inc. © 1999 Nintendo/HAL Laboratory, Inc. Developed by BANDAI NAMCO Studios Inc. ポケットモンスター・ポケモン・Pokémonは任天堂・クリーチャーズ・ゲームフリークの登録商標です。







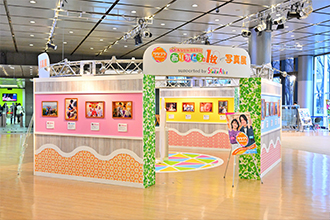
 © Nintendo










 ](
 ](














 ](


 ](
 ](
 ](
 ](


 ](

















 ](



 ](



































 ](



 ](




 ](
 ](














Prompts
Click prompts to add them under the company line, click again to take one out, then copy the result into your AI chat. Shared by Asian Century Stocks and Uncovered Thai Stocks. Thank you.
STUDIO ALICE Co., Ltd. (ticker 2305), listed in Japan.
Copied
ETFs Holding STUDIO ALICE Co., Ltd.
Exchange-traded funds whose newest published daily portfolio holds one of the company's listings, largest weight first.
| ETF | Weight in ETF | Shares | Market value | As of |
|---|---|---|---|---|
| DFIS | 0.00% | 15,100 | $ 173.381K | Nov 12, 2026 |
| DFIC | 0.00% | 11,000 | $ 126.304K | Nov 12, 2026 |
| DFAX | 0.00% | 7,400 | $ 84.968K | Nov 12, 2026 |
| DFAI | 0.00% | 1,200 | $ 13.779K | Nov 12, 2026 |
| AVDE | 0.00% | 2,000 | $ 23.132K | Nov 16, 2026 |
| AVDV | 0.00% | 11,800 | $ 136.48K | Nov 16, 2026 |
| AVSD | 0.00% | 100 | $ 1,156.61 | Nov 16, 2026 |