プリマハムグループ 統合報告書 2 0 2 6 INDE X 02 トップメッセージ Section 1 価値創造ストーリー 07 プリマハムが大切にしていること 08 成長戦略のロードマップ 09 私たちのあゆみ 10 ビジネスモデルと強み 12 価値創造プロセス 13 経営資本と成長戦略の関係…
プリマハムグループ 統合報告書 2 0 2 6
INDE X
02 トップメッセージ
Section 1 価値創造ストーリー
07 プリマハムが大切にしていること
08 成長戦略のロードマップ
09 私たちのあゆみ
10 ビジネスモデルと強み
12 価値創造プロセス
13 経営資本と成長戦略の関係
Section 2 成長戦略
15 中期経営計画
財務戦略
17 財務担当役員メッセージ
事業戦略
19 本部長メッセージ
21 Highlight 1
加工食品事業の競争力を支える
「挑戦力」
と
「収益力」
23 加工食品事業
25 Highlight 2
食肉事業の新たな競争力を築く
「変革力」
と
「成長力」
27 食肉事業
人材戦略
29 人材強化に向けた目標と取り組み
サステナビリティ戦略
31 Sustainability Issues
宮城農場から始まる資源循環
33 プリマハムグループのサステナビリティ
34 重要課題(マテリアリティ)への取り組み
35 健康で豊かな食生活を創造する/
地球環境の保全に貢献する
36 サプライチェーン・マネジメントを強化する/
人権デュー・ディリジェンス
37 アニマルウェルフェア/食育の取り組み
38 環境負荷の全体像
39 気候変動・自然関連課題への対応
Section 3 コーポレートガバナンス
41 社外取締役メッセージ
43 企業統治体制の全体像
47 役員一覧
51 リスクマネジメント
Appendix データ編
53 11年間の連結財務サマリー
55 サステナビリティデータハイライト
56 会社情報/株式情報
プリマハムグループ 統合報告書2026
本年度の統合報告書には、
トップメッセージを起点に、
数字で見るプリマハムグループ
創業
2030年に向けた当社グループの成長の方向性を示す
「成
長戦略のロードマップ」
を掲載しました。
また、経営資本と
連結従業員数
14,262
1,463
国内
年
成長戦略の関係を新たに整理するとともに、中期経営計
海外
連結売上高 ※ 数値の前提条件はP.53参照
4,756
国内
0.2
%
名
66
件
10
件
28
※ 2026年8月1日現在
しい情報、将来の出来事などに基づき、これらの将来予測を更新す
る義務を負うものではありません。
1
位
2
Section 2 成長戦略
表紙について
当社グループの目指す姿である
「おいし
さと感動で、食文化と社会に貢献」
の実
現に向けて、研究開発から生産、物流、
販売にいたるまでの事業活動を通じて、
対象組織:プリマハム(株)およびプリマハムグループ会社
おいしさや健康、しあわせな時間の創
発行:2026年9月
(次回発行予定 2027年9月)
出に貢献していくことを表しています。
事業戦略
19 本部長メッセージ
21 Highlight 1
加工食品事業の競争力を支える
「挑戦力」
と
「収益力」
情報開示体系
27 食肉事業
1
ストーリー性
統合報告書
価値創造のストーリーを
拠点
※ 2026年8月1日現在
人材戦略
IRサイト
サステナビリティサイト
株主・投資家に向けて、決
算短信や決算説明会資料
などの最新情報を掲載して
います。当社グループの強
みも紹介し、HPでの積極
的な情報開示とコミュニ
ケーションに努めています。
https://www.primaham.
co.jp/ir/
ESGの 取り組みやデ ータ
集、TCFD/TNFD関連情報
など、環境・社会・ガバナン
スに関する非財務情報を網
羅的に掲載。持続可能な
社会の実現に向けた取り
組みを発信しています。
https://www.primaham.
co.jp/sustainability/
統合報告書
財務
情報
統合的に開示。プリマハム
の原点やあゆみの紹介か
ら、サステナビリティを含
有価証券報告書
HP IRサイト
決算説明会資料
決算短信 など
む成長戦略まで、企業 の
非財務
情報
HP サステナ
ビリティサイト
ESGデータ集
TCFDレポート
など
全体像をわかりやすく伝え
網羅性
ます。
29 人材強化に向けた目標と取り組み
サステナビリティ戦略
31 Sustainability Issues
宮城農場から始まる資源循環
33 プリマハムグループのサステナビリティ
34 重要課題(マテリアリティ)への取り組み
35 健康で豊かな食生活を創造する/
地球環境の保全に貢献する
36 サプライチェーン・マネジメントを強化する/
人権デュー・ディリジェンス
37 アニマルウェルフェア/食育の取り組み
38 環境負荷の全体像
39 気候変動・自然関連課題への対応
Section 3 コーポレートガバナンス
INDEX
Section 2 成長戦略
02 トップメッセージ
15 中期経営計画
07 プリマハムが大切にしていること
08 成長戦略のロードマップ
09 私たちのあゆみ
10 ビジネスモデルと強み
12 価値創造プロセス
13 経営資本と成長戦略の関係
財務戦略
17 財務担当役員メッセージ
統合報告書に関するお問い合わせ 代表:03-6386-1800
プリマハムグループ 統合報告書 2 026
Section 1 価値創造ストーリー
15 中期経営計画
23 加工食品事業
25 Highlight 2
軸に、財務・非財務情報を
シンガポール
拠点
Section 1 価値創造ストーリー
07 プリマハムが大切にしていること
08 成長戦略のロードマップ
09 私たちのあゆみ
10 ビジネスモデルと強み
12 価値創造プロセス
13 経営資本と成長戦略の関係
食肉事業の新たな競争力を築く
「変革力」
と
「成長力」
※「インテージ SCI
ハム・ソーセージ・ベーコン・
焼豚市場2025年4月〜2026年
3月計購買金額シェア」
タイ
社
ています。
より影響を受けることがありますので、実際の業績は予測から大き
く異なる可能性があることをご承知おきください。また、当社は新
国内業界シェア
海外生産拠点数
グループ会社
ワーク」
および経済産業省「価値協創ガイダンス」
を参照し
発行日現在において入手可能な情報に基づくもので、種々の要因に
(一部に対象期間外の内容を含みます)
ハム・ソーセージ部門
%
の作成にあたっては、IFRS財団「国際統合報告フレーム
02 トップメッセージ
本統合報告書に記載されているデータや将来予測は、本報告書の
対象期間:2025年4月1日〜 2026年3月31日
※ 2026年3月31日現在
%
た価値創造の取り組みを紹介しています。なお、本報告書
見通しに関する注意事項
報告対象範囲など
海外
食肉事業
33.7
名
特許数(連結)
億円
66.2
画に基づく財務・事業・人材・サステナビリティ戦略を通じ
※ 2026年3月31日現在
加工食品事業
その他事業
INDE X
編集方針
At a glance
1931
01
プリマハムグループ 統合報告書 2 0 2 6
財務戦略
17 財務担当役員メッセージ
25 Highlight 2 食肉事業の新たな
競争力を築く「変革力」と「成長力」
27 食肉事業
人材戦略
事業戦略
29 人材強化に向けた目標と取り組み
19 本部長メッセージ
21 Highlight 1 加工食品事業の
サステナビリティ戦略
競争力を支える「挑戦力」と
「収益力」
23 加工食品事業
31 Sustainability Issues
宮城農場から始まる資源循環
33 プリマハムグループのサステナビリティ
34 重要課題(マテリアリティ)への取り組み
35 健康で豊かな食生活を創造する/
地球環境の保全に貢献する
36 サプライチェーン・マネジメントを強化する/
人権デュー・ディリジェンス
37 アニマルウェルフェア/食育の取り組み
38 環境負荷の全体像
39 気候変動・自然関連課題への対応
Section 3 コーポレートガバナンス
41 社外取締役メッセージ
43 企業統治体制の全体像
47 役員一覧
51 リスクマネジメント
41 社外取締役メッセージ
43 企業統治体制の全体像
47 役員一覧
51 リスクマネジメント
Appendix データ編
Appendix データ編
53 11年間の連結財務サマリー
55 サステナビリティデータハイライト
56 会社情報/株式情報
53 11年間の連結財務サマリー
55 サステナビリティデータハイライト
56 会社情報/株式情報
TOP MESSAGE
プリマハムグループ 統合報告書2026
02
プリマハムグループ 統合報告書 2 0 2 6
INDE X
TOP MESSAGE トップメッセージ
02 トップメッセージ
食品メーカーとしての“次のステージ”へ――
地に足のついた成長と目に見える変化
2026年6月、歴史と伝統あるプリマハムの代表取締
役社長に就任いたしました。
伊藤忠商事で35年間、
ひと筋に食品ビジネスに携わ
Section 1 価値創造ストーリー
07 プリマハムが大切にしていること
08 成長戦略のロードマップ
09 私たちのあゆみ
10 ビジネスモデルと強み
12 価値創造プロセス
13 経営資本と成長戦略の関係
Section 2 成長戦略
体的な道筋をつけることです。これまでのハム・ソー
15 中期経営計画
セージメーカーとしての歩みを足場に、
「食品業界の
財務戦略
17 財務担当役員メッセージ
トップメーカー」
という次のステージへ――その変革
り、
当社の監査役を務めた期間を経て、
このたび当社グ
を、
スピード感を持って、
「目に見える形」にして皆さま
ループの経営を担う立場となりました。
にお示ししていきたいと思います。
事業戦略
19 本部長メッセージ
21 Highlight 1
加工食品事業の競争力を支える
「挑戦力」
と
「収益力」
23 加工食品事業
25 Highlight 2
就任して改めて強く感じるのは、当社グループには
極めて大きな強みがあるということです。
ウインナー市
場において首位を誇る
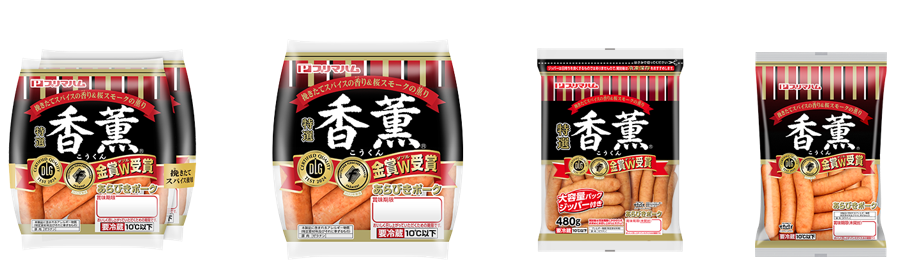
「香薫 あらびきポーク」
をはじ
私は
「率先垂範」
と
「現場主義」
を大切にしています。
私
め、
お客様に長く愛され選ばれ続けている商品があり、
にとって
「率先垂範」
は、
自ら実践し、
範を示すという意味
ハム・ソーセージ分野では国内トップクラスのシェアを
だけではなく、
「物事の本質は現場にしかない」
という前
堅持しています。食肉事業でも、徹底した品質管理のも
提に立ち、
まずは
「自分でやってみる」
「自分の手で触れて
と、独自のオリジナルブランドを育成しています。
そして
みる」
ことで理解を深める姿勢そのものと考えています。
何より、これらプリマハムの商品に深い愛着を持ち、
何事も他人任せにせず、
自ら現場に足を運び、
自分の
日々のものづくりとそれをお客様に届ける仕事を担う
目で事実を確かめたうえで判断をする。
そして、
その意
従業員の存在こそが、当社グループのかけがえのない
思決定の結果には自分自身が全責任を持つ。
この姿勢
財産です。
を大切にしながら、結果にこだわり、経営に邁進してい
こうした確かな土台がある中で、私たちはさらなる
食肉事業の新たな競争力を築く
「変革力」
と
「成長力」
「率先垂範」
と
「現場主義」
を大切に
きます。
成長の余地を残しています。
そして、社長としての私の
「なぜこの商品が売れるのか、
あるいはなぜ売れない
役割は、
「次に何を目指すのか」、
それを明らかにし、具
のか」
の本質は、
自ら商売の現場に身を置いてみなけれ
27 食肉事業
人材戦略
29 人材強化に向けた目標と取り組み
サステナビリティ戦略
31 Sustainability Issues
宮城農場から始まる資源循環
33 プリマハムグループのサステナビリティ
34 重要課題(マテリアリティ)への取り組み
35 健康で豊かな食生活を創造する/
地球環境の保全に貢献する
36 サプライチェーン・マネジメントを強化する/
人権デュー・ディリジェンス
37 アニマルウェルフェア/食育の取り組み
38 環境負荷の全体像
39 気候変動・自然関連課題への対応
Section 3 コーポレートガバナンス
代表取締役社長
社長執行役員
ABE KUNIAKI
阿部邦明
41 社外取締役メッセージ
43 企業統治体制の全体像
47 役員一覧
51 リスクマネジメント
Appendix データ編
53 11年間の連結財務サマリー
55 サステナビリティデータハイライト
56 会社情報/株式情報
TOP MESSAGE
プリマハムグループ 統合報告書2026
03
ば決して見えてきません。現場へ出向き、
お客様や従業
食卓に深く根付いた定番の食品であり、今後も市場は
も、近年、労務費や原材料費が上昇するなか、大きく変
員と同じ空間で同じものを見て、課題を能動的に把握
必ずあり続けます。人口減少や健康志向で市場のパイ
化する市場のニーズへの対応が遅れ、収益低迷が続い
することをこれまでも徹底してきました。
そのものは変化していくものの、
当社グループにはこの
ています。一方で、
これは大きな収益改善のポテンシャ
この考え方の原点は、商社時代に経験した海外での
厳しいコスト環境下でも、価格政策と販売促進の連動
ルを秘めていることも認識しています。
こちらも同様に
リンゴジュース工場の立ち上げにあります。
20代の頃、
現
により着実にシェア拡大を続けてきた実績があります。
マーケットインの視点から商品開発を進め、迅速に収
地でゼロから食品工場を建設する事業の責任者の役目
主力の「香薫 あらびきポーク」のさらなる拡大を追求
益化に向けた対策を実行してまいります。
を担っていました。
稼働初年度の大晦日に急に機械が動
しつつ、2026年春に新発売した全米No.1ウインナーブ
P.23 事業戦略/加工食品事業
かなくなるトラブルが起き、技術者が全員帰国して不在
ランド
「ジョンソンヴィル」監修による
「ジョンソンヴィル
食肉事業は、
優れた調達力と販売力を武器に売上高を
の中、
日本語の設備マニュアルを片手に、
現地スタッフと
ウインナー」
を、次の収益を支える商品へと力強く育て
大きく成長させてきましたが、収益性の面では改善が必
必死に機械と格闘しながら正月を迎えたことがありまし
てまいります。 P.21 Highlight1
02 トップメッセージ
Section 1 価値創造ストーリー
07 プリマハムが大切にしていること
08 成長戦略のロードマップ
09 私たちのあゆみ
10 ビジネスモデルと強み
12 価値創造プロセス
13 経営資本と成長戦略の関係
Section 2 成長戦略
15 中期経営計画
財務戦略
要です。鹿児島県産「恵味の黒豚」
やカナダ産「ハーブ
19 本部長メッセージ
21 Highlight 1
また、加工食品分野は、近年のヒット商品であるサラ
三元豚」
といった品位の高いオリジナルブランドの販売
えて帰国し、
自らの足でお客様に売り込みました。
「自分
ダチキンのように時代ごとの食シーンや多様化する食
構成比を高めるとともに、
苦戦が続いている国内養豚事
の手でつくり、
自分の足で売ることができた」。製造と営
ニーズに合わせた新たな商品の開発によって成長を続
業は、養豚効率改善と畜舎・設備の適切な更新により生
業という、
メーカーとしての両輪を肌感覚として感じたこ
けてきました。
この分野は多岐にわたる商品群を持って
産性を改善し、
収益力をもう一段底上げしてまいります。
のときの体験が、
今でも私の仕事の土台となっています。
おり、従来の商品に対し、
イノベーションと差別化を図
P.27 事業戦略/食肉事業
ることで、
これからも大きな成長が期待できると考えて
さらに、
これら既存事業の磨きと並行し、10年先を支
います。
この成長を実現するうえで最大の鍵となるの
INDE X
17 財務担当役員メッセージ
た。
そして修理した機械で自らつくり上げたサンプルを抱
既存事業を磨き、新たな収益源を育てる
プリマハムグループ 統合報告書 2 0 2 6
事業戦略
加工食品事業の競争力を支える
「挑戦力」
と
「収益力」
23 加工食品事業
25 Highlight 2
食肉事業の新たな競争力を築く
「変革力」
と
「成長力」
27 食肉事業
人材戦略
29 人材強化に向けた目標と取り組み
サステナビリティ戦略
える
「次なる収益の柱」
を創出したいと考えています。
そ
31 Sustainability Issues
宮城農場から始まる資源循環
現在、食品業界を取り巻く環境は、人口減少に伴い
が、
「マーケットイン」の発想です。私たち食品メーカー
のひとつは海外市場の開拓です。
これまでは主に
「日本
国内市場が縮小するなかで、原材料・副資材やエネル
の売上はお客様である消費者の皆さまからいただく1
向けの供給拠点」
として位置づけていたタイなどの海外
33 プリマハムグループのサステナビリティ
34 重要課題(マテリアリティ)への取り組み
35 健康で豊かな食生活を創造する/
ギー価格の高止まりなど厳しいコストプッシュインフレ
円の積み重ねが起点です。
この本質を忘れた売り手側
拠点を、今後は成長するアジア市場への足掛かりとし、
36 サプライチェーン・マネジメントを強化する/
の局面が続いています。
また、世界各地で緊迫化する地
の都合で考えたプロダクトアウトのものづくりは支持さ
現地の消費ニーズに根ざした独自の商品を展開してま
政学リスクにより、
これまで以上に事業環境の不確実
れません。お客様が本当に求めているニーズや形を的
いります。 P.15 中期経営計画
性が高まっています。
このような不透明な状況下におい
確に捉え、
スピーディに商品として具現化する必要があ
また、国内事業もプリマハムのドメインをハム・ソー
て、当社グループがいかにして成長を実現していくか。
ります。
「商品開発」
と
「マーケティング」の体制強化を
セージのみならず、冷凍食品を含むさまざまな加工食
その出発点は、
まずは加工食品事業と食肉事業という
急ピッチで進め、
これまでの枠にとらわれない新たな商
品と捉えなおし、食品業界トップクラスのメーカーを目
「既存の二本柱」
をしっかりと磨き上げることです。
品開発へ挑んでまいります。
指し、独自の戦略を打っていきたいと考えています。
加工食品事業の核であるハム・ソーセージは、
日本の
コンビニエンスストア向けのベンダー事業について
これらの挑戦において、当社の親会社である伊藤忠
地球環境の保全に貢献する
人権デュー・ディリジェンス
37 アニマルウェルフェア/食育の取り組み
38 環境負荷の全体像
39 気候変動・自然関連課題への対応
Section 3 コーポレートガバナンス
41 社外取締役メッセージ
43 企業統治体制の全体像
47 役員一覧
51 リスクマネジメント
Appendix データ編
53 11年間の連結財務サマリー
55 サステナビリティデータハイライト
56 会社情報/株式情報
TOP MESSAGE
プリマハムグループ 統合報告書2026
04
る収益力を継続的に磨いていきたいと考えています。
商事グループのネットワークは最大の強みのひとつで
た。
このような経緯と足元の状況を踏まえると、従来の
す。
グループのグローバルな調達網やリテールへのアク
中期経営計画で掲げてきた
「ROE 10%以上」
という目
セス力を最大限に活用することで、新たな産地の獲得
標は、
当社の現状に見合った水準ではなかったと考え、
や市場への進出、戦略的なM&Aも含めた構造変革に
まずはROE8%の早期達成を目標とし、
これを確実な足
「プリマが好き」
という従業員の力を、
成長につなげる
よる成長機会をスピーディに掴み取ってまいります。
場とした上で、
改めて10%以上を目指してまいります 。
私は社長就任以降、国内に8つある主要工場をはじ
この目標を達成するための施策は、
「課題事業の早期
め全国の主要な生産・農場拠点を回り、各拠点の本質
立て直しによる基礎収益力の強化」
です。加工食品など
的な課題を理解しつつ、そこで働く人たちの気持ちや
株主・投資家の皆さまとの対話においては、ROE(自
の強みを持つ事業を着実に伸ばす一方で、現在大きな
考えにしっかりと触れることができました。
己資本利益率)がもっとも重要な経営指標と認識して
課題となっている
「ベンダー事業の収益化」
「海外生産
基礎収益力を立て直し、ROE8%を早期達成する
P.17 財務戦略
これらの訪問を通じて、最も胸が熱くなったのは、
プ
プリマハムグループ 統合報告書 2 0 2 6
INDE X
02 トップメッセージ
Section 1 価値創造ストーリー
07 プリマハムが大切にしていること
08 成長戦略のロードマップ
09 私たちのあゆみ
10 ビジネスモデルと強み
12 価値創造プロセス
13 経営資本と成長戦略の関係
Section 2 成長戦略
15 中期経営計画
財務戦略
おります。収益力の伸長による利益の改善を主眼に置
事業会社の収益改善」
「国内養豚事業の再建」の3つに
リマハムグループで働く仲間たちが、
自らの仕事や自社
17 財務担当役員メッセージ
き、ROEが中長期的に株主資本コストを安定的に上回
ついて、時間軸を明確に区切って立て直しに向けた施
ブランドに対して強い思いを持ちながら、
日々の業務に
る状態を維持することを、経営の規律として厳格に据え
策を推進し、
収益を確実に改善したいと考えています。
取り組む真摯で頼もしい姿勢です。
「自分たちのつくる
19 本部長メッセージ
21 Highlight 1
あわせて、財務規律に基づいた適切なキャピタルア
商品に誇りがある、
自分たちの仕事がお客様の笑顔に
当社はかつて、食品の家庭内需要が非常に高まった
ロケーションを実行してまいります。食品メーカーにお
つながっている」
という、飾り気のない、非常に頼もしい
コロナ禍の時期に、収益が一時的に急拡大し、ROEが
いては、設備更新への対応や効率化を目的とした設備
愛着です。
この素晴らしい組織風土は、
これからも伸ば
14%を超えた実績がありますが、
その後の事業環境の
投資は事業の安定的な成長のために不可欠です。ま
していきたい当社の無形の資産です。2000年代前半に
ていきます。
変化により、会社の実力を示す基礎収益力は当期純利
益ベース80億円程度で、ほぼ横ばいに推移してきまし
た、維持・更新のみならず、将来の成長のための新規戦
略的投資も積極的に行う必要があります。
一方、新たに工場・設備を更新する建設コストは、資
事業戦略
加工食品事業の競争力を支える
「挑戦力」
と
「収益力」
23 加工食品事業
25 Highlight 2
食肉事業の新たな競争力を築く
「変革力」
と
「成長力」
27 食肉事業
人材戦略
29 人材強化に向けた目標と取り組み
サステナビリティ戦略
は経営危機を経験した過去がありますが、全社一丸と
31 Sustainability Issues
なった地道な努力の積み重ねによって、経営基盤は当
33 プリマハムグループのサステナビリティ
34 重要課題(マテリアリティ)への取り組み
35 健康で豊かな食生活を創造する/
時と比べ、堅固になっています。
材高騰や人手不足によって、
ここ数年で2倍近くにまで
一方で、
これまで以上に次の成長に向けて、組織とし
膨らんでいるなど、収益性とのバランスでより難しい判
てアップデートしなければならない点も明確になって
断が求められる環境にあります。
います。
目の前の業務に真摯に向き合う優れた点はあ
このようななかでも、投資基準を堅持し、投資案件一
りつつも、外部環境の急速な変化や、資本市場・社会全
つひとつにつき期待リターンが資本コストを確実に上
体から受けている
「外からの客観的な評価」
にもっと目
回るかを厳格に審査し、規律ある判断を徹底します。
な
を向けていく必要があると考えています。
お、PBR(株価純資産倍率)については、市場のひとつ
具体的には、
会社全体で
「客観的な数字」
と
「情勢の変
の目線である1倍を安定的に上回るべく、
その前提とな
化」
にもっと敏感になり、
「外からの視点」
で自分たちの仕
宮城農場から始まる資源循環
地球環境の保全に貢献する
36 サプライチェーン・マネジメントを強化する/
人権デュー・ディリジェンス
37 アニマルウェルフェア/食育の取り組み
38 環境負荷の全体像
39 気候変動・自然関連課題への対応
Section 3 コーポレートガバナンス
41 社外取締役メッセージ
43 企業統治体制の全体像
47 役員一覧
51 リスクマネジメント
Appendix データ編
53 11年間の連結財務サマリー
55 サステナビリティデータハイライト
56 会社情報/株式情報
TOP MESSAGE
事を常に見つめ直し、
より高い業務効率を目指していき
プリマハムグループ 統合報告書2026
実現し、
企業の責任を果たしてまいります。
05
変わらぬ約束と、
目に見える企業価値の向上へ
プリマハムグループ 統合報告書 2 0 2 6
INDE X
ます。
日々の業務において、
過去からのやり方を必要に応
P.31 サステナビリティ戦略
じて見直し、
目的の達成に向けてスピーディに動ける組
環境面では、当社グループの温室効果ガス(Scope
織へ、皆で変わっていきます。特に、課題のひとつである
1・2)排出量は、2025年度において2021年度比で
と考えている各本部のサイロ化も、
これらの仕事を通じ
27.1%の削減となり、
当初の2030年度目標を前倒しで
安全・安心で、間違いのない、
お客様に本当に喜んで
て解消し、
横断的に機動的な連携を実現していきます。
クリアできる確実な見通しが 立ちました。今後は、
いただける商品をお届けするという「約束」は、食品
また、
自発的な動きを継続するためには、成果が適正
2035年に向けた追加目標(38%削減)の達成に向け
メーカーとして絶対に裏切ることはできません。長年に
に組織や個人の評価や報酬に反映される仕組みづくり
て、
さらなる製造プロセスの省エネ化や再生可能エネ
わたりプリマハムを支持してくださっているすべてのお
Section 2 成長戦略
消費者であるお客様が、数ある商品のなかから私た
ちの商品を選んでくださるその一瞬がすべての商売の
起点だと考えています。
02 トップメッセージ
Section 1 価値創造ストーリー
07 プリマハムが大切にしていること
08 成長戦略のロードマップ
09 私たちのあゆみ
10 ビジネスモデルと強み
12 価値創造プロセス
13 経営資本と成長戦略の関係
客様、お取引先の皆さま、そして従業員の皆さまへの
15 中期経営計画
一人ひとりが会社の成長に参画しているという自信と
P.39 気候変動・自然関連課題への対応
「感謝」
を胸に、
引き続き
「いつも、
ずっと、
お客様に愛さ
17 財務担当役員メッセージ
誇りを持って仕事をすることでさらに成果を出し、
また
人権への取り組みにおいても、一次原料サプライ
れ、支持される会社」
を目指していきます。
新たなことに挑戦する。
この個人の成長のサイクルこそ
ヤーの人権デュー・ディリジェンスや、
当社の主要工場
も不可欠であり、
あわせて着手してまいります。従業員
ルギーへの切り替えを着実に進めてまいります。
P.07 プリマハムが大切にしていること
が、結果としてプリマハムグループ全体の強力な成長
で働く外国人技能実習生の就労実態の把握を通じ、不
国内外の情勢の変化は、
当社の事業環境に大きなう
エンジンとなると考えています。私自身も、従業員一人
当な扱いを受けている者や不快な思いをしている者が
ねりとなって影響し続けています。私たちの力強い成長
ひとりとともに新しいことに挑戦し、
この成長サイクル
一人もいないか、
踏み込んだ確認を行っていきます。
を全社一丸となって実現し、企業価値向上という目に
を育てていきたいと思います。 P.29 人材戦略
財務戦略
事業戦略
19 本部長メッセージ
21 Highlight 1
加工食品事業の競争力を支える
「挑戦力」
と
「収益力」
23 加工食品事業
25 Highlight 2
食肉事業の新たな競争力を築く
「変革力」
と
「成長力」
27 食肉事業
人材戦略
29 人材強化に向けた目標と取り組み
P.36 人権デュー・ディリジェンス
見える形で皆さまにお示ししていきたいと思います。
こ
コーポレートガバナンスの高度化については、各ス
れからの当社グループの果敢な挑戦と歩みに、ぜひご
31 Sustainability Issues
テークホルダーとの対話を強化し、透明性の確保に努
期待いただき、引き続き温かいご支援をいただけます
企業のESGやコンプライアンスの問題を考えるにあ
め、
どのような局面においても、
プリマハムグループの
ようよろしくお願い申し上げます。
33 プリマハムグループのサステナビリティ
34 重要課題(マテリアリティ)への取り組み
35 健康で豊かな食生活を創造する/
たり、
その根本において求められるべきは、特別なこと
企業価値向上にとって最適な選択を行っていきます。
基本を、地道にやり抜く
ではなく、私たち一人ひとりが日々の生活の中で実践し
P.40 コーポレートガバナンス
ている
「当たり前に正しいこと」だと思っています。
「貴
この考えを軸に、社外役員との対話をより深め、
さま
重な資源を無駄にしないこと」
「他人に迷惑をかけない
ざまな意見を伺いながら、経営に取り組んでいます。
あ
こと」
「嘘をつかないこと
(隠し事をしないこと)」
とい
わせて、経営人材の実効性のあるサクセッションプラン
う、当たり前のことに還元し、そこから考えることを大
策定、
ならびに各諮問委員会における議論の質的向上
切にしたいと思います。
それらを地道に、かつ徹底的に
についても、将来のガバナンス体制強化に向けて、腰を
やり抜くことで、ESGやコンプライアンスの目標達成を
据えた議論を重ねております。
サステナビリティ戦略
宮城農場から始まる資源循環
地球環境の保全に貢献する
36 サプライチェーン・マネジメントを強化する/
人権デュー・ディリジェンス
37 アニマルウェルフェア/食育の取り組み
38 環境負荷の全体像
39 気候変動・自然関連課題への対応
Section 3 コーポレートガバナンス
41 社外取締役メッセージ
43 企業統治体制の全体像
47 役員一覧
51 リスクマネジメント
Appendix データ編
53 11年間の連結財務サマリー
55 サステナビリティデータハイライト
56 会社情報/株式情報
プリマハムグループ 統合報告書2026
Sec tion
06
プリマハムグループ 統合報告書 2 0 2 6
INDE X
1
02 トップメッセージ
Section 1 価値創造ストーリー
07 プリマハムが大切にしていること
08 成長戦略のロードマップ
09 私たちのあゆみ
10 ビジネスモデルと強み
12 価値創造プロセス
13 経営資本と成長戦略の関係
価値創造ストーリー
Section 2 成長戦略
15 中期経営計画
財務戦略
17 財務担当役員メッセージ
事業戦略
I ND E X
07
プリマハムが大切にしていること
19 本部長メッセージ
21 Highlight 1
加工食品事業の競争力を支える
「挑戦力」
と
「収益力」
プリマハムが大切にしていること
創業以来受け継いできた理念や使命、価値観を紹介します。
当社グルー
プが事業活動を通じて実現したい社会と存在意義をお伝えします。
23 加工食品事業
25 Highlight 2
食肉事業の新たな競争力を築く
「変革力」
と
「成長力」
27 食肉事業
人材戦略
08
成長戦略のロードマップ
成長戦略のロードマップ
2030年に向けて当社グループが目指す方向性を示すとともに、
それを
背景にした中期経営計画との関連性をご報告します。
29 人材強化に向けた目標と取り組み
サステナビリティ戦略
31 Sustainability Issues
宮城農場から始まる資源循環
09
私たちのあゆみ
私たちのあゆみ
創業から現在までのあゆみを振り返りながら、時代の変化に対応しなが
ら成長を続けてきた歴史と挑戦の軌跡を紹介します。
33 プリマハムグループのサステナビリティ
34 重要課題(マテリアリティ)への取り組み
35 健康で豊かな食生活を創造する/
地球環境の保全に貢献する
10
ビジネスモデルと強み
ビジネスモデルと強み
12
価値創造プロセス
価値創造プロセス
13
経営資本と成長戦略の関係
経営資本と成長戦略の関係
原材料調達から販売までのバリューチェーンと競争優位性を整理し、
当
社グループならではの強みをご説明します。
事業活動を通じてどのような価値を生み出し、社会課題の解決と企業価
値向上につなげているのかを示します。
人的資本や製造資本などの経営資本をどのように活用し、成長戦略の推
進と企業価値向上につなげていくのかを示します。
36 サプライチェーン・マネジメントを強化する/
人権デュー・ディリジェンス
37 アニマルウェルフェア/食育の取り組み
38 環境負荷の全体像
39 気候変動・自然関連課題への対応
Section 3 コーポレートガバナンス
41 社外取締役メッセージ
43 企業統治体制の全体像
47 役員一覧
51 リスクマネジメント
Appendix データ編
53 11年間の連結財務サマリー
55 サステナビリティデータハイライト
56 会社情報/株式情報
価値創造ストーリー
プリマハムグループ 統合報告書2026
07
プリマハムグループ 統合報告書 2 0 2 6
INDE X
プリマハムが大切にしていること
私たちは何のために存在し、どんな価値を創造していくのか――。
02 トップメッセージ
プリマハムグループは、
創業以来受け継いできた価値観を、ひとつの理念体系として掲げています。
Section 1 価値創造ストーリー
プリマハムグループの価値創造は、
この想いを礎としています。
07 プリマハムが大切にしていること
08 成長戦略のロードマップ
09 私たちのあゆみ
10 ビジネスモデルと強み
12 価値創造プロセス
13 経営資本と成長戦略の関係
Section 2 成長戦略
「食」は、人の生命を支え、暮らしに喜びをもたらし
15 中期経営計画
理念体系
財務戦略
17 財務担当役員メッセージ
ます。プリマハムグループのあゆみは、この食と真摯
事業戦略
に向き合うことから始まりました。
19 本部長メッセージ
21 Highlight 1
目指す姿
「もっと体力をつけたら、日本はさらに発展する」。
加工食品事業の競争力を支える
「挑戦力」
と
「収益力」
食肉消費がまだ一般的でなかった1931年、創業者・
23 加工食品事業
25 Highlight 2
竹岸政則はそう確信し、良質な食肉を適正価格で届
一、正直で基本に忠実
ける事業を興しました。前例にとらわれず自ら道を切
一、商品と品質はプリマの命
経営理念
り拓く“進取の精神”̶̶それが、創業以来受け継が
一、絶えざる革新でお客様に貢献
れてきた私たちの原点です。
と品質はプリマの命」
「絶えざる革新でお客様に貢
- 一人一人が創造力、提案力とスピーディー
な行動力を発揮し
経営ビジョン
献」という経営理念として、今も脈々と受け継がれて
- 卓越した商品開発力と技術力を結集して、
総合力でお客様に安全でおいしい食品と
関連情報を提供し健康で豊かな食生活に
貢献する。
います。時代が移り変わっても揺らがない価値観を
未来へつなぐために、私たちは目指す姿・経営理念・
サステナビリティ基本方針
経営ビジョン、そしてサステナビリティ基本方針をひ
盤に、プリマハムグループは社会課題の解決と企業
価値の向上を両立する価値創造を進めています。
人材戦略
29 人材強化に向けた目標と取り組み
サステナビリティ戦略
31 Sustainability Issues
この創業者の想いは、
「正直で基本に忠実」
「商品
とつの理念体系として整理しています。この体系を基
食肉事業の新たな競争力を築く
「変革力」
と
「成長力」
27 食肉事業
コーポレート
ガバナンス
基本方針
食品安全・
品質方針
プリマハム
グループ
環境方針
プリマハム
グループ
人権方針
プリマハム
グループ
調達方針
- 果敢に自己変革して収益力のある総合食
品企業に脱皮する。
宮城農場から始まる資源循環
33 プリマハムグループのサステナビリティ
34 重要課題(マテリアリティ)への取り組み
35 健康で豊かな食生活を創造する/
地球環境の保全に貢献する
36 サプライチェーン・マネジメントを強化する/
人権デュー・ディリジェンス
37 アニマルウェルフェア/食育の取り組み
38 環境負荷の全体像
39 気候変動・自然関連課題への対応
Section 3 コーポレートガバナンス
41 社外取締役メッセージ
43 企業統治体制の全体像
47 役員一覧
51 リスクマネジメント
Appendix データ編
53 11年間の連結財務サマリー
55 サステナビリティデータハイライト
56 会社情報/株式情報
価値創造ストーリー
プリマハムグループ 統合報告書2026
08
INDE X
成長戦略のロードマップ
既存の二本柱(加工食品・食肉)の徹底的な収益力強化と、当社独自の戦略による
02 トップメッセージ
新たな事業領域への挑戦。それが2030年に向けたプリマハムの方向性です。
事業ポートフォリオ
中期経営計画
加工食品・食肉の収益力を高めつつ、海外と
新商品
(高付加価値等)
を次なる収益の柱として構築
P.15
P.10
香薫 ブランドの深化
創業者
精神
1
加工食品
事業
P.07
2
食肉事業
Section 1 価値創造ストーリー
2030 年の方向性
(2026〜2028年度)
ビジネスモデル
経営理念
プリマハムグループ 統合報告書 2 0 2 6
海外事業の拡充
目指す姿
新たな商品の育成
持続可能な
07 プリマハムが大切にしていること
08 成長戦略のロードマップ
09 私たちのあゆみ
10 ビジネスモデルと強み
12 価値創造プロセス
13 経営資本と成長戦略の関係
Section 2 成長戦略
15 中期経営計画
収益構造・チャネル
経営基盤の強化
財務戦略
17 財務担当役員メッセージ
マーケットイン型組織へ変革し、既存のチャネルに
とらわれない、新たな事業領域の創出
外部環境の
変化に対応した
収益基盤の構築
外食チャネルの攻略
ECビジネスの拡大
事業戦略
19 本部長メッセージ
21 Highlight 1
輸出・海外販売の強化
加工食品事業の競争力を支える
「挑戦力」
と
「収益力」
23 加工食品事業
25 Highlight 2
資本効率
成長投資と
3 グローバル展開
食肉事業の新たな競争力を築く
「変革力」
と
「成長力」
27 食肉事業
収益の
「規模」
から
「質」
へ
資本コストを意識した経営の推進
PBR・ROE改善
人材戦略
29 人材強化に向けた目標と取り組み
資本コスト経営の定着
サステナビリティ戦略
31 Sustainability Issues
宮城農場から始まる資源循環
事業ポートフォリオの質的転換、
資本効率の改善、
本質的
なサステナビリティの実践、
そして変革を牽引する自発的な
人材の育成。これらはいずれも、3年間の中期経営計画の
枠を超え、
私たちが持続的に取り組むべき経営の根幹です。
中計で打つ一手一手は、
単に目先の数値を追うためだけ
のものではありません。
現在の当社の実力を見極め、
設定し
事業ポートフォリオの変化イメージ
新商品(高付加価値)
ほか
地球環境の保全に貢献する
36 サプライチェーン・マネジメントを強化する/
成長
人権デュー・ディリジェンス
拡大
拡充途上
2030
年度
2026年度
〜2028年度
「いつも、
ずっと、
お客様に愛され、
支持される会社」
であり
食肉・養豚
収益基盤強化中
37 アニマルウェルフェア/食育の取り組み
38 環境負荷の全体像
39 気候変動・自然関連課題への対応
海外事業
海外事業
革し、
2030年の
「あるべき姿」
へと繋げる確かな布石です。
に見えて本当に変わっていくプリマハム」
を、
お示しします。
新商品(高付加価値)
ほか
育成中
た数値を確実にクリアしながら、事業の構造そのものを変
続けるために。
私たちは、
中期経営計画を通じて、
皆様に
「目
33 プリマハムグループのサステナビリティ
34 重要課題(マテリアリティ)への取り組み
35 健康で豊かな食生活を創造する/
加工食品
食肉・養豚
主力
収益改善
加工食品
維持・深化
Section 3 コーポレートガバナンス
41 社外取締役メッセージ
43 企業統治体制の全体像
47 役員一覧
51 リスクマネジメント
Appendix データ編
53 11年間の連結財務サマリー
55 サステナビリティデータハイライト
56 会社情報/株式情報
価値創造ストーリー
私たちのあゆみ
売上高(億円)
※出典:
「インテージ SCIハム・ソー
セージ・ベーコン・焼豚市場2024年
4月〜2025年3月計、2025年4月〜
2026年3月計購買金額シェア」
の見送りなどの厳しい経営状況に陥っ
2023・2024・2025
向けて徹底したコスト管理を行った
ことが、
現在の高い生産性とコ
を合理化して、良質な食肉を適正価格で皆さんに
食べていただくこと」に生涯をかけました。
3,000
ていた時期がありました。経営再建に
ム・ソーセージがなじみの薄い時代に「食肉産業
スト競争力の基盤となっ
1971
子会社を設立し
養豚事業を
スタート
2007
ています。
1983
東京ディズニーランド®開園
当初からのオフィシャル
スポンサーとして参画
1989
1972
オスカー・マイヤー社と資本・技術提携
2006
海外事業をスタート
業界で初めて商品に「賞味期限」を表示
1931 〜
1980
1970 〜
19 本部長メッセージ
21 Highlight 1
1990
2000
1980 〜
事業戦略
加工食品事業の競争力を支える
「挑戦力」
と
「収益力」
23 加工食品事業
25 Highlight 2
食肉事業の新たな競争力を築く
「変革力」
と
「成長力」
1,500
生産工場の本格的な
リニューアルを開始
27 食肉事業
人材戦略
29 人材強化に向けた目標と取り組み
サステナビリティ戦略
2019
アレルギー物質の
検査キットを発売
生産工場の
高度化工事を開始
1992
1974
1970
※出典:KSP-POS 畜肉ソーセージカテゴリー
2023年4月〜2024年3月計、2024年4月〜
2025年3月計、2025年4月〜2026年3月計販
売個数
2016・2019
「香薫 あらびきポーク」
を発売
2008
プリマウインナー号の製作
財務戦略
17 財務担当役員メッセージ
鹿児島新工場が稼動
2002
Section 2 成長戦略
15 中期経営計画
2023
食肉のオリジナル
ブランド商品を発売
コンビニエンスストア
専用工場を設立
業界初の「規格肉」を販売
当社4工場で
ISO 22000認証を
取得
Section 1 価値創造ストーリー
07 プリマハムが大切にしていること
08 成長戦略のロードマップ
09 私たちのあゆみ
10 ビジネスモデルと強み
12 価値創造プロセス
13 経営資本と成長戦略の関係
「香薫 あらびきポーク」
2個束が販売個数No.1
2000
1986
1956
創業
国内業界シェア
ハム・ソーセージ部門No.1
低迷し、
一部事業所の閉鎖や新規採用
展する――。そう確信した創業者の竹岸政則は、ハ
1962
2024・2025
当時、
プリマハムグループは業績が
もっと体力をつけたら、日本という国はさらに発
東京・大阪両証券取引所
第一部に上場
機能性表示
食品を販売
躍進のきっかけ
創業者・
竹岸政則を支えた
“進取の精神”
原料肉の輸入を開始
INDE X
02 トップメッセージ
2025
時代の変化に応じて事業領域を拡大しながら、
より多くの方に「おいしさと感動」をお届けするための挑戦を続けています。
1950
プリマハムグループ 統合報告書 2 0 2 6
4,500
業界初の規格肉の発売や国産豚肉インテグレーションの確立など、常に革新的な取り組みで業界をリードしてきたプリマハム。
1931
09
プリマハムグループ 統合報告書2026
2014・2017
DX実現に向けた
「PRIMA Next Project」
始動
タイの2工場において
JAS規格製造工場認定取得
2010
2000 〜
31 Sustainability Issues
2023
宮城農場が稼動
宮城農場から始まる資源循環
33 プリマハムグループのサステナビリティ
34 重要課題(マテリアリティ)への取り組み
35 健康で豊かな食生活を創造する/
地球環境の保全に貢献する
36 サプライチェーン・マネジメントを強化する/
人権デュー・ディリジェンス
2020
(年度)
2020 〜
豊かな暮らしへの
貢献を目指し事業をスタート
世界レベルでの
食の安全・安心を追求
暮らしとともに変化する
お客様のニーズに対応
事業再建に向けて
徹底した管理体制を構築
「目指す姿」を実現するために
次なる成長へ
日本の食肉産業界で初めて「規格肉」の販売を
開始した当社は、流通経路を工夫するなど、製
造だけでなく、販売も強化。このときの社内標
語で選ばれたのが「売るもつくるもマークはひ
とつ。われらのプリマはわれらで売ろう」という
ものでした。
品質管理で先行する海外企業との提携を基礎と
して、独自の品質管理体制を構築し、安全・安心
かつ斬新なヒット商品を次々と開発。養豚事業に
も着手し、国産豚肉のインテグレーションの礎
を築きました。
コンビニエンスストア向け専用工場、加工食品
の海外の生産拠点を設立し、事業領域を拡大。
国内生産拠点では食品安全認証を取得し、さら
なる経営基盤の構築を図りました。
厳しい経営環境のなか、当社は一部事業所の閉
鎖などの重大な決断を迫られました。経営を再
建するために、徹底したコスト管理体制を構築。
この取り組みが今日にいたる躍進につながりま
した。
多様化する消費者志向に対応するため、商品ラ
インアップの拡充を進めるとともに、生産工場
の 新築 や 養豚事業 の 拡大、さらには 海外戦
略、業務改革と将来の成長のための変革に取
り組んでいます。
37 アニマルウェルフェア/食育の取り組み
38 環境負荷の全体像
39 気候変動・自然関連課題への対応
Section 3 コーポレートガバナンス
41 社外取締役メッセージ
43 企業統治体制の全体像
47 役員一覧
51 リスクマネジメント
Appendix データ編
53 11年間の連結財務サマリー
55 サステナビリティデータハイライト
56 会社情報/株式情報
価値創造ストーリー
プリマハムグループ 統合報告書2026
10
プリマハムグループ 統合報告書 2 0 2 6
INDE X
ビジネスモデルと強み
プリマハムは、
おもな事業の柱として
「加工食品事業」と「食肉事業」の二つを展開。
02 トップメッセージ
長年培ってきた技術力とブランド力をいかし、
安全・安心で高品質な商品を提供することで、お客様の多様なニーズにお応えしています。
Section 1 価値創造ストーリー
加工食品事業
食肉事業
確かな技術力と強固なブランドを基盤に
ハム・ソーセージをはじめとする加工食品を提供
国内外調達先と連携し、安全・安心で高品質な食肉の
安定調達のネットワークを構築し、効率的な流通システムを実現
ハム・ソーセージを中心とした加工食品事業では、長年にわたって蓄積してきた製造技術と品
食肉事業では、国内外の調達ネットワークを活用し、豚肉、牛肉、鶏肉を中心とした食肉の調
質管理ノウハウを基盤に、消費者の嗜好変化や健康志向に対応した商品を開発。全国に展開
達・加工・販売を進めています。産地との長期的なパートナーシップによって安全で高品質な食
する製造拠点と効率的な物流網によって高品質な商品を安定的に供給しています。
また、
プリ
肉を開発、安定調達するとともに、国産豚肉の養豚事業も展開。
また、効率的な流通システムに
マハムブランドの高い認知度と信頼性をいかし、小売店から業務用
(外食産業、
コンビニエンス
よって小売店や外食産業などへ安全・安心で高品質な食肉の安定供給を実現し、
日本の食肉
ストア向けなど)
まで幅広い販売チャネルを通じて市場シェアを拡大しています。
流通における重要な役割を担っています。
07 プリマハムが大切にしていること
08 成長戦略のロードマップ
09 私たちのあゆみ
10 ビジネスモデルと強み
12 価値創造プロセス
13 経営資本と成長戦略の関係
Section 2 成長戦略
15 中期経営計画
財務戦略
17 財務担当役員メッセージ
事業戦略
19 本部長メッセージ
21 Highlight 1
加工食品事業の競争力を支える
「挑戦力」
と
「収益力」
強み
6
強み
2
商品
開発
強み
1
国内外
調達先
強み
2
強み
2
強み
8
品質
管理
連携
企画
強み
7
営業
ハム・
ソーセージ
工場
物流センター
加工食品
工場
物流センター
コンビニ向け
物流センター
国内
物流センター
海外
プリマハムグループ
強み
7
商品
開発
EC
サイトなど
品質
管理
29 人材強化に向けた目標と取り組み
サステナビリティ戦略
企画
営業
31 Sustainability Issues
宮城農場から始まる資源循環
33 プリマハムグループのサステナビリティ
34 重要課題(マテリアリティ)への取り組み
35 健康で豊かな食生活を創造する/
強み
4
生産
加工
流通
コンビニ
エンス
ストア
小売店、
外食産業
など
強み
5
海外の
小売店、
外食産業
など
国内外
パートナー
強み
8
食肉事業の新たな競争力を築く
「変革力」
と
「成長力」
27 食肉事業
人材戦略
強み
6
小売店、
外食産業
など
お客様
(消費者)
コンビニ
向け工場
海外加工品
工場
商社、
輸入代行
など
23 加工食品事業
25 Highlight 2
強み
3
EC
プリマハムグループ
お客様
(消費者)
地球環境の保全に貢献する
36 サプライチェーン・マネジメントを強化する/
人権デュー・ディリジェンス
37 アニマルウェルフェア/食育の取り組み
38 環境負荷の全体像
39 気候変動・自然関連課題への対応
Section 3 コーポレートガバナンス
41 社外取締役メッセージ
43 企業統治体制の全体像
47 役員一覧
51 リスクマネジメント
Appendix データ編
53 11年間の連結財務サマリー
55 サステナビリティデータハイライト
56 会社情報/株式情報
価値創造ストーリー
プリマハムグループ 統合報告書2026
11
プリマハムグループ 統合報告書 2 0 2 6
INDE X
食肉事業
加工食品事業
強み
1
最新鋭工場とコスト競争力
強み
4
自動化や生産ラインの直線化などによって
生産ラインの効率化を実現
国産豚肉のインテグレーション
繁殖から生産、処理・加工、販売までの
一貫体制で
「安全・安心・おいしさ」
を実現
ど、生産ラインの効率化を徹底するとともに、生産リードタイ
貫体制を構築。さらに宮城県の養豚農場では、科学的なデータ
ムも短縮し、高い生産能力を保有しています。
に基づく高い生産性を実現しています。
強み
2
小売
物流
独自の商品開発力
強み
5
常に市場動向やお客様のご要望を把握して
さまざまな生活スタイルや嗜好の変化に対応
外食
種豚の
繁殖
インテグレーション
一貫体制
繁殖・肥育から、と畜・解体処理、加工、製品、物流、販売まで一
箱詰め作業の自動化や生産ラインの直線化、設備の高速化な
02 トップメッセージ
消費者
Section 1 価値創造ストーリー
肥育
(生産)
と畜・
解体処理
製品
加工
Section 2 成長戦略
オリジナルブランドミート
15 中期経営計画
日本人の嗜好にあうオリジナルの食肉を共同開発
財務戦略
長年取引を行い関係を構築した調達先(パートナー)
と連携して日本人の嗜好にあうオリジナル
ハム・ソーセージ、ハンバーグ、惣菜、調理パン、デザートなど
ブランドの食肉を開発しており、恵まれた自然環境のなかにある広大な牧場で育った牛・豚・鶏
幅広い商品を提供。常に市場動向やお客様のさまざまなニー
は、お客様からも喜ばれています。また、社内の他部門と連携して、オリジナルブランドの原料を
ズに応える高付加価値な商品を開発しています。
使った商品の製造、販売にも取り組んでいます。
強み
3
オリジナルブランド数
ファン拡大を牽引する販売促進力
(2026年7月現在)
キャンペーンやSNS活用によって
“プリマ”のブランド力を向上
CMやSNSでの積極的な広報・宣伝活動に加え、東京ディズ
ニーリゾート® の貸切イベントをはじめとしたさまざまな販売
14
17 財務担当役員メッセージ
事業戦略
19 本部長メッセージ
21 Highlight 1
加工食品事業の競争力を支える
「挑戦力」
と
「収益力」
23 加工食品事業
25 Highlight 2
食肉事業の新たな競争力を築く
「変革力」
と
「成長力」
27 食肉事業
種
人材戦略
29 人材強化に向けた目標と取り組み
サステナビリティ戦略
31 Sustainability Issues
プリマハムは東京ディズニーランド®、
宮城農場から始まる資源循環
促進施策により、お客様に“おいしさの体験価値”を提供し、東京ディズニーシー ® のオフィシャル
33 プリマハムグループのサステナビリティ
34 重要課題(マテリアリティ)への取り組み
35 健康で豊かな食生活を創造する/
スポンサーです©Disney
ブランド力向上を図っています。
07 プリマハムが大切にしていること
08 成長戦略のロードマップ
09 私たちのあゆみ
10 ビジネスモデルと強み
12 価値創造プロセス
13 経営資本と成長戦略の関係
地球環境の保全に貢献する
36 サプライチェーン・マネジメントを強化する/
人権デュー・ディリジェンス
グループ共通
強み
6
食の安全管理体制
強み
7
フードチェーン全体で一貫した
管理体制を構築・運用
協業による商品・サービスの提供力
多種多様な業種の企業・人と協業して
お客様のニーズに柔軟に対応
強み
8
国内外の調達網
現地のサプライヤーとの信頼関係によって
良質な原料肉を調達
国際規格であるFSSC 22000を取り入れ、商品開
認証事業所数
伊藤忠グループと連携した調達や取引先・調達
伊藤忠グループの強みをいかし、食肉、ハム・ソーセー
発から調達、生産、物流まで一貫した管理体制を
FSSC 22000
先との共同開発、外部機関による技術指導など、
ジ、加工食品などの原料肉を世界各地から調達。調
当社グループは多種多様な業種の企業・人と協
達先と確固たる信頼関係を構築し、当社が要求する
業し、お客様のニーズに柔軟に対応しています。
品質を満たした原料肉を仕入れています。
構築・運用。また、タイの工場ではJAS規格製造
工場認定を取得しています。
19
ケ所
37 アニマルウェルフェア/食育の取り組み
38 環境負荷の全体像
39 気候変動・自然関連課題への対応
海外の調達先
北南米、
欧州、
アジアなど
Section 3 コーポレートガバナンス
41 社外取締役メッセージ
43 企業統治体制の全体像
47 役員一覧
51 リスクマネジメント
Appendix データ編
53 11年間の連結財務サマリー
55 サステナビリティデータハイライト
56 会社情報/株式情報
価値創造ストーリー
プリマハムグループ 統合報告書2026
12
INDE X
価値創造プロセス
中長期的な戦略によって強みを磨き、食品メーカーとしての持続的な成長を追求しています。
02 トップメッセージ
Section 1 価値創造ストーリー
企業価値の創出
INPUT
強み
P.13
P.10
● 最新鋭工場とコスト競争力
OUTPUT
●オリジナルブランドミート
●ファン拡大を牽引する販売促進力
ビジネスモデル
OUTCOME
● ハム・ソーセージ
市場でのシェア
維持・伸長
P.21
P.10
P.23
● 消費者ニーズに
食肉事業
加工食品事業
● 食を通じた
P.11
●● 食の安全管理体制
●● 他社と連携した商品・サービス開発力
原材料調達の
実現
人的資本
15 中期経営計画
財務戦略
● 安全・安心な食品
17 財務担当役員メッセージ
目指す姿
P.35
● 持続可能な
●● 国内外の調達網
Section 2 成長戦略
おいしさ・健康・
しあわせな時間
応える商品の
提供
知的資本
● サプライヤーとの
共創
● 従業員の自己実現
P.36
成長戦略
社会関係資本
財務戦略
事業戦略
人材戦略
P.17
P.19
P.29
持続可能な
経営基盤の
強化
2
外部環境の変化に
対応した
収益基盤の構築
サステナ
ビリティ
戦略
3
人材戦略
● 地域社会との共生
P.29
● 持続可能な
● 地球環境保全
P.36
● 安定した株主還元
削減
財務資本
社会の動向
●地政学リスクの高まり
●日本の人口動態変化
●需要の多様化
●AIなどの情報革新
●次世代たんぱく質の開発
●サステナビリティへの関心の高まり
●原材料・調達コストの上昇
P.35
サステナビリティ戦略
31 Sustainability Issues
33 プリマハムグループのサステナビリティ
34 重要課題(マテリアリティ)への取り組み
35 健康で豊かな食生活を創造する/
P.31
● 温室効果ガスの
29 人材強化に向けた目標と取り組み
宮城農場から始まる資源循環
調達・生産体制の
構築
P.22
成長投資と
グローバル
展開
加工食品事業の競争力を支える
「挑戦力」
と
「収益力」
23 加工食品事業
25 Highlight 2
食肉事業の新たな競争力を築く
「変革力」
と
「成長力」
エンゲージメント
の向上
P.31
事業戦略
19 本部長メッセージ
21 Highlight 1
27 食肉事業
● 従業員
重要課題
(マテリアリティ)
P.34
中期経営計画
P.15
1
自然資本
07 プリマハムが大切にしていること
08 成長戦略のロードマップ
09 私たちのあゆみ
10 ビジネスモデルと強み
12 価値創造プロセス
13 経営資本と成長戦略の関係
● 国産豚肉のインテグレーション
● 独自の商品開発力
製造資本
プリマハムグループ 統合報告書 2 0 2 6
P.38
創出した価値の循環による、継続的な資本増強・経営基盤の強化
プリマハムグループは、豊富な経営資本と歴史のなかで培ってきた多彩な強みをいかしながら、長年にわたっ
が重要です。
そこで、当社グループでは「プリマハムグループの重要課題(マテリアリティ)」
を特定するととも
て
「加工食品事業」
と
「食肉事業」
を展開してきました。近年、社会情勢や世界的な社会課題がめまぐるしく変
に、財務戦略や事業戦略、人材戦略、
サステナビリティ戦略からなる中期的な経営計画を立案し、PDCAを回
化するなか、私たちが今後も持続的な成長を遂げるためには、中長期的な視点でリスク・機会を把握すること
しながら、
さまざまなステークホルダーに価値を提供し続け、
目指す姿を実現することを目指しています。
地球環境の保全に貢献する
36 サプライチェーン・マネジメントを強化する/
人権デュー・ディリジェンス
37 アニマルウェルフェア/食育の取り組み
38 環境負荷の全体像
39 気候変動・自然関連課題への対応
Section 3 コーポレートガバナンス
41 社外取締役メッセージ
43 企業統治体制の全体像
47 役員一覧
51 リスクマネジメント
Appendix データ編
53 11年間の連結財務サマリー
55 サステナビリティデータハイライト
56 会社情報/株式情報
価値創造ストーリー
プリマハムグループ 統合報告書2026
13
INDE X
経営資本と成長戦略の関係
プリマハムの成長戦略は、経営資本の蓄積に裏づけられています。特に製造・知的・人的資本の強化を優先的に進めることで、
中期経営計画の実行基盤を確かなものにしていきます。
02 トップメッセージ
Section 1 価値創造ストーリー
成長戦略
07 プリマハムが大切にしていること
08 成長戦略のロードマップ
09 私たちのあゆみ
10 ビジネスモデルと強み
12 価値創造プロセス
13 経営資本と成長戦略の関係
中期経営計画(2026〜2028年度) P.15
1
持続可能な経営基盤の強化
プリマハムグループ 統合報告書 2 0 2 6
2
外部環境の変化に対応した
収益基盤の構築
3
成長投資とグローバル展開
Section 2 成長戦略
15 中期経営計画
財務戦略
17 財務担当役員メッセージ
事業戦略
・
・
・
・
加工食品事業
市場シェアNo.1の優位性をいかした
人材戦略
P.19
・
・
・
・
生産ラインの完全自動化・効率化の推進
高価格帯商品のラインアップ拡充
外食・業務用販売チャネルの強化
・
・
・
・
・
キャリア採用の強化と受け入れ体制充実
食肉事業
国産豚一貫体制
(川上から川下)
の強化
輸入畜肉の新産地開拓
営業活動の強化
P.29
高付加価値なオリジナル商品の強化
輸出を中心とした海外展開
次期経営人材の計画的育成
グローバル人材の育成
働きがい改革の継続
独自マニュアルによる労働安全教育
サステナビリティ戦略
財務戦略
P.31
・
・
・
・
・
温室効果ガス排出量削減
廃棄物の削減に向けたリサイクルの推進
サプライチェーン全体での人権尊重
アニマルウェルフェアの取り組み強化
TCFD、TNFD提言に沿った情報開示
の拡充
P.17
・
・
・
・
・
ROE目標8%以上の早期達成
安定的な株主還元
(配当性向40%以上)
戦略投資約350億円
(DX・海外展開等)
既存事業基盤構築約180億円
R&I格付「A
(安定的)」維持
事業戦略
19 本部長メッセージ
21 Highlight 1
加工食品事業の競争力を支える
「挑戦力」
と
「収益力」
23 加工食品事業
25 Highlight 2
食肉事業の新たな競争力を築く
「変革力」
と
「成長力」
27 食肉事業
人材戦略
29 人材強化に向けた目標と取り組み
サステナビリティ戦略
31 Sustainability Issues
宮城農場から始まる資源循環
33 プリマハムグループのサステナビリティ
34 重要課題(マテリアリティ)への取り組み
35 健康で豊かな食生活を創造する/
地球環境の保全に貢献する
36 サプライチェーン・マネジメントを強化する/
人権デュー・ディリジェンス
・
・
・
・
製造資本
グループ25工場による
生産体制
FSSC 22000導入拠点
19ケ所
自社開発の生産・自動化設備
国産豚インテグレーション
・
・
・
・
知的資本
ハムソー部門首位の
「香薫®」
ブランド
国内66件・海外10件の特許
独自の研究・開発ノウハウ
自社開発機器の技術蓄積
・
・
・
・
人的資本
国内14,262名・海外1,463名
の従業員
おいしさを追求する研究人材
工場生産性向上を支える技
術者
専門分野に精通したグロー
バル人材
・
・
・
・
社会関係資本
お得意先との長期的な関係
ブランドファンとの接点
国内外サプライヤーからの
安定的な供給体制
伊藤忠グループとの協業関係
蓄積資本
・
・
・
自然資本
太陽光などの再生可能
エネルギーの活用
食品残渣の循環利用
サステナブルな生産基盤
外部資本
経営資本
・
・
財務資本
営業キャッシュフロー
創出力
R&I 格付「 A( 安定的 )」に
基づく多様な資金調達手段
受託資本
37 アニマルウェルフェア/食育の取り組み
38 環境負荷の全体像
39 気候変動・自然関連課題への対応
Section 3 コーポレートガバナンス
41 社外取締役メッセージ
43 企業統治体制の全体像
47 役員一覧
51 リスクマネジメント
Appendix データ編
53 11年間の連結財務サマリー
55 サステナビリティデータハイライト
56 会社情報/株式情報
プリマハムグループ 統合報告書2026
Sec tion
14
プリマハムグループ 統合報告書 2 0 2 6
INDE X
2
02 トップメッセージ
Section 1 価値創造ストーリー
07 プリマハムが大切にしていること
08 成長戦略のロードマップ
09 私たちのあゆみ
10 ビジネスモデルと強み
12 価値創造プロセス
13 経営資本と成長戦略の関係
成長戦略
Section 2 成長戦略
15 中期経営計画
財務戦略
17 財務担当役員メッセージ
事業戦略
19 本部長メッセージ
21 Highlight 1
IN D E X
15
中期経営計画
加工食品事業の競争力を支える
「挑戦力」
と
「収益力」
23 加工食品事業
25 Highlight 2
中期経営計画
外部環境の変化に対応した収益基盤の構築、成長投資とグローバル展開、持続可
能な経営基盤の強化を通じて、企業価値向上を目指す中期経営計画を紹介します。
食肉事業の新たな競争力を築く
「変革力」
と
「成長力」
27 食肉事業
人材戦略
29 人材強化に向けた目標と取り組み
17
19
財務戦略
事業戦略
財務戦略
事業戦略
ROEなどの資本効率を重視しながら、成長投資と財務規律のバランスを図り、持続
的な企業価値向上を目指す考え方を示します。
企業価値の創出を支える各本部長が今後の取り組みを報告するとともに、加工食
品事業と食肉事業の事業戦略と最新の事例を紹介します。
サステナビリティ戦略
31 Sustainability Issues
宮城農場から始まる資源循環
33 プリマハムグループのサステナビリティ
34 重要課題(マテリアリティ)への取り組み
35 健康で豊かな食生活を創造する/
地球環境の保全に貢献する
36 サプライチェーン・マネジメントを強化する/
人権デュー・ディリジェンス
29
31
人材戦略
サステナビリティ戦略
人材戦略
サステナビリティ戦略
持続的な成長を支える人材基盤の強化に向け、人材の確保・育成・活躍を推進する
考え方と、
その実現に向けた具体的な施策を紹介します。
重要課題(マテリアリティ)に対して、何を目標にどのような取り組みを進めている
かを報告するとともに、食育などの地域活動も紹介します。
37 アニマルウェルフェア/食育の取り組み
38 環境負荷の全体像
39 気候変動・自然関連課題への対応
Section 3 コーポレートガバナンス
41 社外取締役メッセージ
43 企業統治体制の全体像
47 役員一覧
51 リスクマネジメント
Appendix データ編
53 11年間の連結財務サマリー
55 サステナビリティデータハイライト
56 会社情報/株式情報
成長戦略
中期経営計画
プリマハムグループ 統合報告書2026
15
プリマハムグループ 統合報告書 2 0 2 6
INDE X
中期経営計画
02 トップメッセージ
基礎収益力の向上と資産効率化により、
資本コストを上回る収益を確保
プリマハムグループ中期経営計画(2026〜2028年度)
2025年度売上高は主力商品の「香薫 あらびきポーク」
を中心としたハム・ソーセージの数量が拡大し、食肉事業の販売数量
基本方針
拡大も寄与し、過去最高を更新しました。2026年度は主力のハム・ソーセージのさらなる伸長に加え、課題事業の立て直しにより
収益改善を図ります。
2024年度振り返り
ループサプライヤー行動規範」
「プリマハムグループア
ニマルウェルフェアポリシー」
の制定
● TCFD提言に基づく情報開示を拡充
● 生産拠点におけるフロン対策、
太陽光発電設備の導入推進
1
課題点
● 温室効果ガス排出量
(Scope1,2)2030年目標を
1
GHG排出量(特にScope3の具体的な削減目標
策定)
と、
TCFD/TNFDの統合的開示
●「香薫
」
「スマイルUP! 」
を中心に、主力であるハム・
ソーセージの国内市場シェア向上
● 健康を軸とした高付加価値商品の開発、
当社初となる
機能性表示食品の発売
● 国産養豚事業の出荷頭数拡大
課題点
課題点
● タイ、
シンガポールの海外子会社を通じた、
海外での製造
販売強化
課題点
国内外における成長領域への投資、新技術の
開発
連結損益
2024年度実績
売上高
1
持続可能な
経営基盤の強化
温室効果ガス排出量(Scope1,2)2035年削減
目標に向けた対応
2
● 価格改定の着実な実行による単価改善
● 食肉事業におけるオリジナルブランドの拡販による
2
利益改善
※ 出典:
「インテージ SCIハム・ソーセージ・ベーコン・
焼豚市場2025年4月〜2026年3月計購買金額シェア」
課題点
Section 2 成長戦略
● 資本コストと株価を意識した経営
● 人材の確保と育成による変革意識の醸成
● 脱炭素・循環型社会の実現に向けた取り組み推進
外部環境の
変化に対応した
収益基盤の構築
● 既存事業の基礎収益力の向上
加工食品事業の競争力を支える
「挑戦力」
と
「収益力」
23 加工食品事業
25 Highlight 2
● 事業基盤の強化と次世代への布石
● 持続可能なサプライチェーンの構築
食肉事業の新たな競争力を築く
「変革力」
と
「成長力」
27 食肉事業
ベンダー事業の収益改善、
養豚事業の再建
● 次世代基幹システム
(PNP)
のグループ会社への
3
段階的導入
● 生成AIの活用
課題点
成長投資と
グローバル展開
2025年度実績
4,584 億円
4,800 億円
4,756 億円
営業利益
89 億円
120 億円
91 億円
経常利益
105 億円
130 億円
112 億円
親会社株主帰属当期純利益
71 億円
80 億円
46 億円
ROE
5.9 %
6.7 %
3.8 %
業務効率化の実現
● 伊藤忠商事とのコラボレーションを主体とした
国内外事業展開
● 成長領域への挑戦、
新技術の開発・導入
海外子会社の収益改善、
東南アジアを軸とした
海外事業モデル確立
2025年度計画
財務戦略
17 財務担当役員メッセージ
19 本部長メッセージ
21 Highlight 1
● PNP
(PRIMA Next Project)
の稼動開始と
3
15 中期経営計画
事業戦略
● ハム・ソーセージシェアNo.1※の実現
価格改定のさらなる浸透、市場ニーズ変化へ
の対応、
コスト競争力の強化
● 次世代基幹システム
(PNP)
の稼動開始に向けた対応
3
早期達成
● サラダチキンカテゴリーで健康配慮型商品の拡充
● 中堅人材強化のためキャリア採用を推進
● 市場環境の変化にあわせた、
複数回の価格改定実施
2
営業力・開発力・商品力の強化により、
売上と利益の規模と質を
高めると同時に、
サステナビリティを重視した経営を推進し、
「いつも、
ずっと、
お客様に愛され、
支持される会社」
になる。
2025年度実施内容
●「プリマハムグループ環境方針」
の改定、
「プリマハムグ
Section 1 価値創造ストーリー
07 プリマハムが大切にしていること
08 成長戦略のロードマップ
09 私たちのあゆみ
10 ビジネスモデルと強み
12 価値創造プロセス
13 経営資本と成長戦略の関係
連結損益
売上高
営業利益
サステナビリティ戦略
31 Sustainability Issues
宮城農場から始まる資源循環
33 プリマハムグループのサステナビリティ
34 重要課題(マテリアリティ)への取り組み
35 健康で豊かな食生活を創造する/
地球環境の保全に貢献する
ローリングプラン
2026年度計画
人材戦略
29 人材強化に向けた目標と取り組み
2028年度計画
36 サプライチェーン・マネジメントを強化する/
人権デュー・ディリジェンス
37 アニマルウェルフェア/食育の取り組み
38 環境負荷の全体像
39 気候変動・自然関連課題への対応
5,000 億円
5,200 億円
110 億円
150 億円
Section 3 コーポレートガバナンス
41 社外取締役メッセージ
43 企業統治体制の全体像
47 役員一覧
51 リスクマネジメント
親会社株主帰属当期純利益
75 億円
100 億円
ROE
6.1 %
7.6 %
Appendix データ編
53 11年間の連結財務サマリー
55 サステナビリティデータハイライト
56 会社情報/株式情報
成長戦略
中期経営計画
プリマハムグループ 統合報告書2026
16
プリマハムグループ 統合報告書 2 0 2 6
INDE X
1
2
3
持続可能な経営基盤の強化
外部環境の変化に対応した
収益基盤の構築
成長投資とグローバル展開
02 トップメッセージ
資本コストと株価を意識した経営
既存事業の基礎収益力の向上
PNPの稼動開始と業務効率化の実現
基礎収益力の向上、資産の効率化により、資本コストを上
資材高騰やインフレに対し、
価格改定の完遂と継続的なコ
基幹システム刷新プロジェクトである「PNP(PRIMA
回る収益を確保し、2028年度にROE8%を目指します。
ストダウンを進めます。
「香薫」
を中心とした強いブラン
Next Project)
」
の進捗は、
2026年度需給管理システムΦ
IR活動を拡充し、投資家や格付機関との対話を通じて企
ド力をいかし、販売数量の拡大、販売チャネルの多角化に
(ファイ)
パイロットを先行導入、2027年度全社会計シス
業価値の適正な評価を追求します。また、安定した営業
よりさらなる収益力の向上を図ります。同時に、利益の大
テム本稼働に向けて、
システムの品質担保と切替時の影
キャッシュフローを創出し、持続的な成長に向けた投資と
きな足かせとなっている課題事業会社
(ベンダー、
海外、
養
響を最小限に抑えるべく、統合テスト・運用テストを実施
株主還元の両立を実現します。
豚)
について、
早期黒字化に向けた再建施策を推進します。
し、
業務効率化と安定稼働を実現します。
人材の確保と育成による変革意識の醸成
事業基盤の強化と次世代への布石
新卒採用の強化に加え、中堅人材の補強に向けたキャリ
品質や事業活動に伴う重大災害の未然防止に向けた取り組
伊藤忠商事とのコラボレーションを主体とした
国内外事業展開
ア人材の計画的採用をさらに推進し、多様な経験を持つ
みを強化し、
安全で安心な事業運営を徹底します。
「香薫」
伊藤忠商事グループの有するグローバル調達力や、強力
人材の獲得を図ります。
また、
グループ経営の強化に向け
という圧倒的なブランドシェアをさらに拡大しつつ、
同業他社
な小売アクセスを最大限に活用し、戦略的M&Aも含めた
て、次期経営人材の育成と若手従業員の定着化やロー
に比べて手薄な事業領域に
「マーケットイン」
の発想で戦略
非連続な成長チャンスを積極的に掴み取っていきます。
テーションの実践、教育プログラム拡充により従業員の
的に攻め入り、
香薫 に並ぶ新たなカテゴリーを創出します。
Section 2 成長戦略
15 中期経営計画
財務戦略
17 財務担当役員メッセージ
事業戦略
19 本部長メッセージ
21 Highlight 1
加工食品事業の競争力を支える
「挑戦力」
と
「収益力」
23 加工食品事業
25 Highlight 2
食肉事業の新たな競争力を築く
「変革力」
と
「成長力」
27 食肉事業
成長領域への挑戦、新技術の開発・導入
スキルアップを支援します。
脱炭素・循環型社会の実現に向けた取り組み推進
Section 1 価値創造ストーリー
07 プリマハムが大切にしていること
08 成長戦略のロードマップ
09 私たちのあゆみ
10 ビジネスモデルと強み
12 価値創造プロセス
13 経営資本と成長戦略の関係
持続可能なサプライチェーンの構築
これまで対日輸出加工拠点であった海外を
「巨大な成長
モーダルシフトの推進や積み降ろしの効率化など物流の
市場」
として捉え直し、海外事業の拡大・自立した経営基
再生可能エネルギーを活用した温室効果ガス排出量の削
効率化に取り組み、
コスト削減と環境負荷軽減を両立さ
盤の育成に注力します。
また、EC事業の強化・拡大をはじ
減、環境配慮型商品拡充や省商材などを通じて廃棄物・
せます。
また、調達から販売にいたるサプライチェーン全
め、生成AIの業務組み込みやITスキル・リテラシーの向
水・プラスチックの削減を進めるとともに、
PDCAを強化し、
体でサステナビリティの取り組みを強化し、持続可能な
上によって競争優位性を確保します。
2030年目標の達成に向けたロードマップを整備します。
事業体制を構築します。
人材戦略
29 人材強化に向けた目標と取り組み
サステナビリティ戦略
31 Sustainability Issues
宮城農場から始まる資源循環
33 プリマハムグループのサステナビリティ
34 重要課題(マテリアリティ)への取り組み
35 健康で豊かな食生活を創造する/
地球環境の保全に貢献する
36 サプライチェーン・マネジメントを強化する/
人権デュー・ディリジェンス
グループの
「未来」
を創る、3つのチャレンジ
みらい事業創造部
2026年4月に発足した
「みらい事業創造部」
は、
ECビジ
を超えたアレルゲン検査キット事業など、
多様なチャレン
ネス・海外事業・新規事業の3領域で、
プリマハムグループ
ジを並行で推進。
PDCAを重ねながら事業の自立的成長
の次世代事業を創造する部門です。
自社ECサイトの運営
を支え、
グループの持続的成長につながる
「成長の種」
を
やミートガイ ブランドの拡大、
タイ・シンガポールにおけ
育てていきます。
る海外グループ会社の戦略支援、
さらには既存事業の枠
37 アニマルウェルフェア/食育の取り組み
38 環境負荷の全体像
39 気候変動・自然関連課題への対応
※ PHT:プリマハムタイランド、
PFT:プリマハムフーズタイランド
海外事業推進課
新規事業開発課
自社ECの運営基盤を構築
し、
ミートガイ ブランドの
オンライン事業を拡大
ECビジネス推進課
タイ・シンガポールのグルー
プ会社を戦略支援し、海外
自立経営の基盤を整備
既存事業の枠を超え、社内
の成長の種を発掘・育成し
て新事業を創造
プリマハム自社EC
PHT・PFT※
プライムテック
ミートガイ
Rudiʼs Fine Food
アレルゲン事業
Section 3 コーポレートガバナンス
41 社外取締役メッセージ
43 企業統治体制の全体像
47 役員一覧
51 リスクマネジメント
Appendix データ編
53 11年間の連結財務サマリー
55 サステナビリティデータハイライト
56 会社情報/株式情報
成長戦略
財務戦略
プリマハムグループ 統合報告書2026
17
プリマハムグループ 統合報告書 2 0 2 6
INDE X
財務担当役員メッセージ
02 トップメッセージ
強固な財務基盤を成長の推進力に、
資本効率を高め、
企業価値の向上を目指します
専務執行役員管理本部長
中島聡
PROFILE
財務・会計をはじめとした管理
部門における深い知識を有し、
総合企画室長、総合企画本部
長などを歴任。2025年4月より
現職。
為替変動に対応しつつ、
格付「A」
を維持し
安定的な財務基盤を堅持
規律ある資金調達とリスク管理を推進
2025年度は、為替が大きく変動した一年となりまし
2024年度に取得した発行体格付
「A
(安定的)
」
について
た。
ドル円相場は、2025年4月に一時1ドル=139円台
は、
2025年度に初めての更新を迎え、
A格を維持できまし
の円高を記録したのち、米国のインフレ再燃懸念や日
た。
年度当初は円金利の上昇が見込まれる局面にあり、
固
米金利差の継続を背景に、
同年後半から2026年初めに
定金利資金の確保に向けて長期社債の発行も選択肢のひ
Section 1 価値創造ストーリー
07 プリマハムが大切にしていること
08 成長戦略のロードマップ
09 私たちのあゆみ
10 ビジネスモデルと強み
12 価値創造プロセス
13 経営資本と成長戦略の関係
Section 2 成長戦略
15 中期経営計画
財務戦略
かけて再び円安方向へ大きく押し戻される展開となり
とつとして検討しました。
しかし、
ほかの調達手段や資産入
17 財務担当役員メッセージ
ました。輸入コストの大部分を占める原材料の食肉は、
れ替えによる資金調達を検討、
一部実行できたことから、
調達から加工・販売までに半年程度のタイムラグがあ
今回は社債発行を見送っています。
もっとも資金調達の選
19 本部長メッセージ
21 Highlight 1
り、為替変動が業績に与える影響は時間差で表れます。
択肢は平時から幅広く備えておくことが重要です。
その一
期初の円高局面で価格改定の機運が一時的に弱まり、
環として、
過去に実績はあるものの現在の財務部門メン
当社も値上げを手控えたことから、
期末にかけての円安
バーは経験のない社債発行も、
シミュレーションや事前調
によるコスト上昇を十分に価格へ反映することができ
査を進め、
機動的に動ける準備を整えておく方針です。
なかった点は、
次年度に向けた課題として残りました。
また、為替リスクの管理においては、個別の原材料の
事業戦略
加工食品事業の競争力を支える
「挑戦力」
と
「収益力」
23 加工食品事業
25 Highlight 2
食肉事業の新たな競争力を築く
「変革力」
と
「成長力」
27 食肉事業
人材戦略
29 人材強化に向けた目標と取り組み
サステナビリティ戦略
31 Sustainability Issues
宮城農場から始まる資源循環
一方、財務・税務の面では、約2年をかけて準備を進
輸入など契約時点で変動リスクをほぼ固める従来の個
めてきたグループ通算制度を導入し、初年度の申告を
別対応に加え、
数年前から安全な長期のドル建て債券を
33 プリマハムグループのサステナビリティ
34 重要課題(マテリアリティ)への取り組み
35 健康で豊かな食生活を創造する/
完了しました。黒字会社と欠損金会社の所得通算や税
分割購入し、
分割償還を通じて円安局面でのヘッジ効果
36 サプライチェーン・マネジメントを強化する/
効果により、親会社株主に帰属する当期純利益ベース
を目的とした包括的な手法を約3年間継続的に試行して
で数億円規模の利益の底上げにつなげることができま
きました。
現在ではドル円金利差の縮小や資金需要見通
した。今後、
グループ内の通算対象となる会社との間で
しの精査を踏まえ、
このポジションを解消しましたが、
一
は同様のメリットを享受でき、社外流出リスクの低減に
定の成果を得ました。
「事業全体を勘案してヘッジのあり
資する体制を整えられたと考えています。なお、強固な
方を考える」
という観点からの試みであり、今後も資金・
財務体質は引き続き維持しており、健全性を高い水準
為替・リスクの状況を見極め、
財務・会計・税務への影響
で保っています。
も踏まえてさまざまな適切な手法で対応してまいります。
地球環境の保全に貢献する
人権デュー・ディリジェンス
37 アニマルウェルフェア/食育の取り組み
38 環境負荷の全体像
39 気候変動・自然関連課題への対応
Section 3 コーポレートガバナンス
41 社外取締役メッセージ
43 企業統治体制の全体像
47 役員一覧
51 リスクマネジメント
Appendix データ編
53 11年間の連結財務サマリー
55 サステナビリティデータハイライト
56 会社情報/株式情報
成長戦略
財務戦略
18
プリマハムグループ 統合報告書2026
プリマハムグループ 統合報告書 2 0 2 6
INDE X
規律ある投資配分と、計画の着実な見直し
投資規律の面では、加工工場・養豚農場およびその
も頂戴しました。
従来の目標が足元の実力と乖離している
2025年度単年度では、
子会社の営業利益の悪化など
環境対策への投資について、管理部門と経営企画部門
との問題意識は財務部門としても共有しており、
2026年度
もあり、
キャッシュ創出は想定を下回りました。
投資面で
が連携して社内通達を改めて整備しました。
あわせて、
に経営環境および実力に即した当面の目標水準として掲
は、
加工食品部門の設備・機械投資が概ね計画に沿って
投資実行後の推移や改善余地を追跡・レビューする仕
げ直した
「2028年度のROE8%」
を、
財務の規律とキャッ
進捗しました。
一方で、
長期資産の見直しを進めるととも
組みも改善し、投資判断の質の向上につなげています。
シュ創出力の回復を通じて着実に達成へ導いてまいりま
す。
また、
投資家の皆様からのさまざまなご指摘は取締役
に、
新システム関連の無形固定資産投資にやや時間を要
していることから、
キャッシュアウトは計画ほど大きくは
なりませんでした。DX基盤構築プロジェクト
「PRIMA
サステナビリティと収益性の両立を追求
会とも共有し、
そこでの議論を経営にいかしていきます。
Section 1 価値創造ストーリー
07 プリマハムが大切にしていること
08 成長戦略のロードマップ
09 私たちのあゆみ
10 ビジネスモデルと強み
12 価値創造プロセス
13 経営資本と成長戦略の関係
Section 2 成長戦略
財務責任者としては、
基幹システムの安定稼動を会計
環境面では、再生可能エネルギーへの転換が着実に
02 トップメッセージ
15 中期経営計画
財務戦略
Next Project
(PNP)
」
については、
システムの品質を最優
進み、温室効果ガスの削減は計画を上回るペースで進
面から徹底的に支えることに全力を尽くします。
そのうえ
17 財務担当役員メッセージ
先に、
段階的な稼動に向けた準備を着実に進めています。
捗しています。一方、相対的にコストの高い電力を使用
で、
営業資産にとどまらず個別案件を含めて資産効率の
将来の競争力の源泉と位置づける国産豚肉のインテ
する工場もあり、
収益性を下げている側面はあります。
当
向上に積極的に取り組み、
社会からご期待いただける企
19 本部長メッセージ
21 Highlight 1
グレーション強化については、重点的な投資配分を計
社は、
環境負荷の低減とコストの最適化を同時に追求す
画どおりには進めることができませんでした。現在は、
る“調達のあり方”を模索しており、理念を掲げるだけで
国内養豚事業の全体像を改めて見直しており、計画の
なく、実際の成果や実績に結びつけることを重視してい
軌道修正も含めて検討を重ねています。
ます。
この点、電力調達では、契約をできるだけグループ
キャッシュイン
合計約650億円
キャッシュアウト
合計約650億円
資金調達(借入)
約100億円
投資
約530億円
営業CF
約550億円
株主還元
約120億円
長期的な
成長に向けた
投資
約350億円
海外展開などの
戦略投資
PNP
研究開発
国産豚肉
インテグレーション
の強化
業グループとして、
企業価値の向上に努めてまいります。
1株当たり配当金/配当性向
27 食肉事業
食肉事業の新たな競争力を築く
「変革力」
と
「成長力」
1株当たり配当金
既存事業の
成長に向けた
基盤構築
約180億円
効率化、生産能力
増強に向けた生産
設備の更新
環境関連
老朽化設備の更新
配当
約120億円
配当金 80円/株
⇒単年度約40億円
配当性向
72.5
手段を交渉するとともに、
再生可能エネルギー比率を一
定程度維持できる選択肢もあわせて追求しています。
配当方針
65
80
80
65 43.6
33.6
30%
0
2022
2023
2024
2025
社の関連部門と連携しながら安定的なコストの抑制に
ROEの推移
取り組んでいます。
(%)
10.0
(計画)
(年度)
地球環境の保全に貢献する
36 サプライチェーン・マネジメントを強化する/
人権デュー・ディリジェンス
Section 3 コーポレートガバナンス
9.0
41 社外取締役メッセージ
43 企業統治体制の全体像
47 役員一覧
51 リスクマネジメント
6.1
5.9
4.0
3.8
0
2021
33 プリマハムグループのサステナビリティ
34 重要課題(マテリアリティ)への取り組み
35 健康で豊かな食生活を創造する/
37 アニマルウェルフェア/食育の取り組み
38 環境負荷の全体像
39 気候変動・自然関連課題への対応
6.4
投資家との対話では、
資本効率について率直なご意見
2026
ROE
投資家との対話を経営にいかし、
サステナビリティ戦略
宮城農場から始まる資源循環
50.0
53.6
40%
0
2021
29 人材強化に向けた目標と取り組み
31 Sustainability Issues
80
56.8
ループの一員であることの強みもいかし、同グループ会
企業価値向上へ
(%)
100.0
87.6
65
人材戦略
配当性向 40%以上
(円)
100
50
こうした交渉や専門的な視点では、伊藤忠商事グ
加工食品事業の競争力を支える
「挑戦力」
と
「収益力」
23 加工食品事業
25 Highlight 2
全体で集約し、
ボリュームディスカウントの効く調達先・
2026〜2028年度中期経営計画
連結キャピタルアロケーション
(26〜28年度合計)
事業戦略
2022
2023
2024
2025
2026
(計画)
(年度)
Appendix データ編
53 11年間の連結財務サマリー
55 サステナビリティデータハイライト
56 会社情報/株式情報
成長戦略
事業戦略
プリマハムグループ 統合報告書2026
19
プリマハムグループ 統合報告書 2 0 2 6
INDE X
本部長メッセージ
02 トップメッセージ
Section 1 価値創造ストーリー
営業本部
新たな経営体制のもと、食品メーカーとしての
“シェアNo.1”を礎に、
カテゴリーリーダーへ進化する
次のステージへと歩み始めたプリマハムグループ。
営業本部が果たすべきミッションは、ハム・ソーセー
ジ市販用シェアNo.1を維持しながら、惣菜・ベーカ
中長期的な成長戦略を“目に見える変化”へと結実させる原動力は、
リー・外食といった新たな領域へ販売を広げることで
価値づくりの最前線に立つ各本部にあります。
す。2025年度は市販用市場でシェアNo.1を獲得し、主
力の「香薫®あらびきポーク」
も大袋の定着により前年
市場の変化を捉え、収益基盤を鍛え、安全・安心を支える̶̶
各本部長が、
自部門の役割と成長に向けて
何に取り組むのかを語ります。
専務執行役員営業本部長
新川裕二
入社以来営業一筋で、営業部門で
の豊富な経験と知識を有し、数多く
の取引先と強固な関係を築く。中部
支店長や東日本支社長を歴任後、
2021年4月に営業本部長就任。
比112%と数量を伸ばすことができました。今後は、お
いしさを追求した
「ジョンソンヴィルウインナー」
や手に
取りやすい生活応援商品などを通じて、二極化が進む
需要に的確にお応えするとともに、
カテゴリーリーダー
07 プリマハムが大切にしていること
08 成長戦略のロードマップ
09 私たちのあゆみ
10 ビジネスモデルと強み
12 価値創造プロセス
13 経営資本と成長戦略の関係
Section 2 成長戦略
15 中期経営計画
財務戦略
17 財務担当役員メッセージ
事業戦略
19 本部長メッセージ
21 Highlight 1
加工食品事業の競争力を支える
「挑戦力」
と
「収益力」
として皆様のさらなる信頼に応える食品メーカーへと
23 加工食品事業
25 Highlight 2
進化してまいります。
27 食肉事業
食肉事業の新たな競争力を築く
「変革力」
と
「成長力」
人材戦略
29 人材強化に向けた目標と取り組み
生産本部
挑戦を糧に、“つくる力”でグループの成長を支える
専務執行役員生産本部長
田悟敏弘
当社および業界に関する深い知識
を有する。生産工場や総合企画室
での勤務経験に加え、茨城工場長
を歴任。2021年4月に生産本部長
就任。
サステナビリティ戦略
食肉事業本部
31 Sustainability Issues
経営基盤を強化し、持続的に成長する食肉事業へ
生産本部は、安全・安心な製品を安定してお届けし、
畜肉相場や為替の変動、中東情勢など厳しい事業環
グループの成長を
「つくる力」
で支えることを使命として
境が続くなか、食肉事業本部は経営基盤の強化と収益
います。この力を担うのは、ものづくりの現場で働く
力の向上を通じて、持続的に成長する事業への進化を
人々です。労働力不足や原材料高が続くなか、生産効率
目指しています。販売事業では固定費単価の圧縮に向
の向上と品質保証を土台に、働きやすい職場づくりを
けた販売数量の拡大に、国産豚生産事業では生産性向
進めています。今後も前例のない課題に失敗をおそれ
ず挑み、一つひとつを糧に、
自動化・機械化による負担
軽減や階層別研修の実施、多様な人材の登用を進め、
一人ひとりが力を発揮できる組織を育てます。
また、脱
炭素・循環型社会に向けた生産体制づくりも進め、変化
に強いものづくりを実現していきます。
専務執行役員食肉事業本部長
上による収益改善に注力しています。2025年度は厳し
網野真
い為替環境のもとでも販売数量を大きく伸ばし、食肉
総合商社および当社食肉部門での
豊富な経験と深い知識を有する。
2021年4月に食肉生産事業部長、
2023年4月に食肉事業本部長就任。
も、喫緊の課題である国産豚生産事業の収益改善を最
セグメントで3年連続の増収増益を達成しました。今後
優先に、構造改革と戦略的投資を推し進め、
グループ一
丸で強い食肉事業を築いていきます。
宮城農場から始まる資源循環
33 プリマハムグループのサステナビリティ
34 重要課題(マテリアリティ)への取り組み
35 健康で豊かな食生活を創造する/
地球環境の保全に貢献する
36 サプライチェーン・マネジメントを強化する/
人権デュー・ディリジェンス
37 アニマルウェルフェア/食育の取り組み
38 環境負荷の全体像
39 気候変動・自然関連課題への対応
Section 3 コーポレートガバナンス
41 社外取締役メッセージ
43 企業統治体制の全体像
47 役員一覧
51 リスクマネジメント
Appendix データ編
53 11年間の連結財務サマリー
55 サステナビリティデータハイライト
56 会社情報/株式情報
成長戦略
事業戦略
プリマハムグループ 統合報告書2026
20
プリマハムグループ 統合報告書 2 0 2 6
INDE X
本部長メッセージ
02 トップメッセージ
マーケティング本部
ブランド価値を最大化し、選ばれ続ける商品を食卓へ
技術と挑戦で“次代の柱”となる商品を生み出す
マーケティング本部の役割は、市場環境を的確に捉
開発本部は、社会課題の解決に貢献しながら、価値
え、各ブランドの価値を最大化しながら、消費者に選ば
ある商品を生み出す部門です。研究成果と技術力を結
れ続ける商品と仕組みを築くことです。
ブランド戦略の
集し、変化する市場にスピード感を持って対応するとと
強化やデジタルマーケティングの推進、加工食品・新規
もに、新たな挑戦を続けています。圧倒的なNo.1を目
指し、主力の「香薫®あらびきポーク」のブラッシュアッ
チャネルに向けた商品開発と販促に注力し、2025年度
執行役員 マーケティング本部長
寺村博之
当社および業界に関する広範かつ
深い知識を有する。商品企画部門
での経験に加え、営業部門ではフー
ドサービス事業部長、東日本支社長
を歴任。2026年4月にマーケティン
グ本部長就任。
Section 1 価値創造ストーリー
開発本部
は配荷・売上の拡大とともに、KPI管理や組織連携を深
めてきました。今後は、新規カテゴリーの攻略と人材育
成を進め、商品と販促の連動をさらに高めます。
また、
「香薫 ®あらびきポーク」などの主力商品を軸に、SNS
なども活用した情報発信で、皆様の食卓へ新しい価値
をお届けしてまいります。
常務執行役員開発本部長
笹嶋恵子
業務用商品の開発と製造現場(海
外工場)
への落とし込みを長く担当。
業界を越えた食品全般から製造設
備 に い たるまで の 知識 は 豊富。
2022年4月に開発本部長就任。
プと、次なる柱商品や海外にも通用する商品の開発を
進めています。2025年度は基礎研究所と商品開発部が
一体となり、新しいカテゴリーの商品化に道筋をつけ
ました。人材育成とノウハウの伝承、
デジタルやAIの活
07 プリマハムが大切にしていること
08 成長戦略のロードマップ
09 私たちのあゆみ
10 ビジネスモデルと強み
12 価値創造プロセス
13 経営資本と成長戦略の関係
Section 2 成長戦略
15 中期経営計画
財務戦略
17 財務担当役員メッセージ
事業戦略
19 本部長メッセージ
21 Highlight 1
加工食品事業の競争力を支える
「挑戦力」
と
「収益力」
用を通じて、
もっと便利に、
また買いたいと思える商品
23 加工食品事業
25 Highlight 2
を生み出し続けていきます。
27 食肉事業
食肉事業の新たな競争力を築く
「変革力」
と
「成長力」
人材戦略
29 人材強化に向けた目標と取り組み
「守り」
と
「攻め」
を融合し、確かな安心を届ける
執行役員品質保証本部長
井元慎介
品質保証に関する豊富な経験と深
い知識を有する。入社以来品質管
理部門で勤務し、グループ会社社
長、品質企画部長、品質管理部長
を歴任。2026年4月に品質保証本
部長。
サステナビリティ戦略
総合企画本部
品質保証本部
31 Sustainability Issues
全社目線で課題を解き、次なる成長の柱を育てる
品質保証本部は、安全・安心な商品を安定してお届
総合企画本部は、経営方針とトップメッセージを実
けし、
グループのブランド価値と信頼を支え続けること
現するため、各本部と密接に連携する実働部隊です。重
をミッションとしています。私たちが目指すのは、DXに
点テーマは基礎収益力の早期改善と拡大であり、課題
よって業務を標準化・自動化することで「守り」を効率
事業を中心に各本部と要因を分析し、対策を進めてい
化し、
そこで生まれた余力を新たな価値創出という
「攻
ます。事業環境がめまぐるしく変わるなか、全社横断の
め」に再投資するという“好循環”です。2025年度は全
部門の協働で食品安全目標を達成し、主力工場で電子
帳票化も進みました。今後はデータの資産化を軸に、生
成AIの活用や点検システムの共通化・自動化を推進
し、皆様に確かな安心をお届けしていきます。
取締役専務執行役員総合企画本部長
鯛健一
総合商社において海外駐在を経験
し、生鮮食品部門長を歴任。畜産を
はじめ生鮮食品全般の専門知識を
有する。当社では食肉事業本部、営
業本部を経て、2024年8月に総合
企画本部長就任。
コミュニケーションを強化し、素早く正確な情報共有で
全体最適の解決を図ります。2025年度は各施策が奏
功し、連結売上高は過去最高を更新しました。次世代シ
ステムであるPNPの本稼動を全員参加で完遂するとと
もに、
「みらい事業創造部」で次の柱を描き、企業価値
の向上を牽引していきます。
宮城農場から始まる資源循環
33 プリマハムグループのサステナビリティ
34 重要課題(マテリアリティ)への取り組み
35 健康で豊かな食生活を創造する/
地球環境の保全に貢献する
36 サプライチェーン・マネジメントを強化する/
人権デュー・ディリジェンス
37 アニマルウェルフェア/食育の取り組み
38 環境負荷の全体像
39 気候変動・自然関連課題への対応
Section 3 コーポレートガバナンス
41 社外取締役メッセージ
43 企業統治体制の全体像
47 役員一覧
51 リスクマネジメント
Appendix データ編
53 11年間の連結財務サマリー
55 サステナビリティデータハイライト
56 会社情報/株式情報
成長戦略
Highlight 1
プリマハムグループ 統合報告書2026
21
INDE X
加工食品事業の競争力を支える
「挑戦力」
と
「収益力」
加工食品事業は現在、成長の柱づくりと収益基盤の強化という2つの挑戦を進めています。全米No.1ブランドとの協業による
「ジョンソンヴィル
02 トップメッセージ
ウインナー」
で高価格帯市場を切り拓く一方、独自に定義した「生産効率」指標を軸に“現場のムダ取り”を進めています。新市場を開拓する
「挑戦
Section 1 価値創造ストーリー
力」
と、
それを足元で支える
「収益力」
という2つの力で、加工食品事業の競争力を高めています。
07 プリマハムが大切にしていること
08 成長戦略のロードマップ
09 私たちのあゆみ
10 ビジネスモデルと強み
12 価値創造プロセス
13 経営資本と成長戦略の関係
挑戦力 ――「ジョンソンヴィルウインナー」を開発・販売
全米No.1ブランドと挑む、高価格帯市場
プリマハムグループ 統合報告書 2 0 2 6
力・販売網を掛け合わせ、
協業が動き出しました。
ウインナー市場が横ばいで推移するなか、
流通側から
焦点は
「香薫®」
との差別化と、
ジョンソンヴィル社と製
は
「単価アップにつながる高付加価値商品」
が求められ、
法の異なる自社工場でそのブランドをどう表現するかで
し、熱処理のスモークムラも品質管理課と解消。再現性
のある製造条件を確立しました。
Section 2 成長戦略
15 中期経営計画
財務戦略
営業においては、
競合が確立した売場に正面からぶつ
消費者の間では“プチ贅沢”志向が高まっていました。
そ
した。
そこで原料肉を選び直し、専用スパイスに加えて日
けず、
「ちょっとした贅沢に選ぶサブ需要」
という住み分
こで当社は、
これら双方のニーズを満たす領域として
「高
本で親しまれている従来のスパイスも配合。弾力のある
けを提案。
他社と併売しながら売場全体を伸ばせる存在
価格帯 2個束」
という新たな価値提案に着目しました。
肉感と香薫®で培ったジューシーさを融合させることで、
だと説き、
新たな棚を切り開きました。
この価値提案を形にするには、確かなブランドと商品力
こだわりの一本が完成しました。
ある導入先の分析では、競合からの買い替えに加え、
17 財務担当役員メッセージ
事業戦略
19 本部長メッセージ
21 Highlight 1
加工食品事業の競争力を支える
「挑戦力」
と
「収益力」
23 加工食品事業
25 Highlight 2
食肉事業の新たな競争力を築く
「変革力」
と
「成長力」
27 食肉事業
が要ります。そこで、
タッグを組んだのが、全米No.1ブ
量産を担う茨城工場では、
充填工程が関門でした。
圧・
約25%が新規顧客でした。
カテゴリーが前年を割り込む
ランドで長年パートナーシップを重ねてきたジョンソン
速度・ねじりが複雑に絡み、
ひとつを変えれば別の不具合
なかでも、
導入店舗では客単価が上がり、
売上の落ち込
が出ます。勘ではなく実績で最適値を突き止めて標準化
みを抑えています。
「香薫®」
に次ぐ第二の柱への挑戦は、
31 Sustainability Issues
始まったばかりです。
33 プリマハムグループのサステナビリティ
34 重要課題(マテリアリティ)への取り組み
35 健康で豊かな食生活を創造する/
ヴィル社。
同社のブランド力と、
当社が日本で培った開発
お得意先様への
新たな価値提案
営業
ブランドを表現する
新たなこだわり
企画
ジョンソン
ヴィル
ウインナー
プロジェクト
販促
開発
生産
再現性のある
製造条件の確立
各部門とジョンソンヴィル
「香薫」
に次ぐ看板商品
試行錯誤の末、根拠に基
すべてのプロモーション
社の間に立ち、認識の齟
をつくろうと、部署の垣
づく製造条件を確立で
で統一したメッセージを
お店の売上と新しいお
客様の獲得につながる
齬なくプロジェクトを推
根を越えて一丸となって
きました。
「調整すれば
発信し、
「手に取ってみた
「価値ある提案」ができ
進する旗振り役を担いま
取り組 めたことが 大き
改善できる」
という手応
い」
「食 べ てみ たい 」と
たことが自信になりまし
した。部門を越えた“オー
な学びです。
この経験を
えを胸に、さらなる品質
思っていただける表現づ
た。
「ジョンソンヴィルウ
くりに尽力しました。
ルプリマ”の連携に当社の
ほかの商品にも広げて
の安定化に貢献していき
底力を感じています。
いきます。
ます。
マーケティング本部
商品企画部
第一課担当課長
開発本部
商品開発部
第三課係長
生産本部
茨城工場
製造2部
製造3課
マーケティング本部
マーケティング部
販促企画課
課長
営業本部
東日本支社
関東量販部
第三課
伊藤賢太
白須直樹
多和田健人
原島喬
白坂奈々
企画
開発
生産
インナー」を大きな柱へ
と育てていきます。
販促
営業
人材戦略
29 人材強化に向けた目標と取り組み
サステナビリティ戦略
宮城農場から始まる資源循環
地球環境の保全に貢献する
36 サプライチェーン・マネジメントを強化する/
人権デュー・ディリジェンス
37 アニマルウェルフェア/食育の取り組み
38 環境負荷の全体像
39 気候変動・自然関連課題への対応
Section 3 コーポレートガバナンス
41 社外取締役メッセージ
43 企業統治体制の全体像
47 役員一覧
51 リスクマネジメント
Appendix データ編
53 11年間の連結財務サマリー
55 サステナビリティデータハイライト
56 会社情報/株式情報
成長戦略
Highlight 1
22
プリマハムグループ 統合報告書2026
プリマハムグループ 統合報告書 2 0 2 6
INDE X
収益力 ―― 独自に定義した「生産効率」指標
現場のムダ取りを、
収益力に変える
02 トップメッセージ
より
「あるべき姿」が期初に設定したときの水準を上回
に相当します。稼動日を1日減らせる̶̶それは労務費
収益力の土台は、
日々の生産現場にあります。
プリマ
ることとなる場合があります。
このとき、翌年度に改めて
だけでなく、設備を動かすエネルギーコストの低減にも
ハムは長年、労働時間あたりの生産量を示す
「人時生産
設定する
「あるべき姿」
の水準は、前年度の100%を超え
直結します。定番の「香薫®あらびきポーク」
をはじめ、
性」
を効率の指標としてきました。
しかし近年、
この指標
ることになります。
このため、期初のスタート時の起点と
「ジョンソンヴィルウインナー」のような高価格帯商品
では現場の実力を正しく測れない場面が増えてきまし
なる前期末値の生産効率は、下方に洗い替えされ、改め
など、複数品種をひとつのラインで支えられるのも、最
た。実質的な価格改定に伴う内容量の見直しでパック
て新年度の基準で改善に取り組む姿になります。
これを
新設備に加え、滞留を生まない直線型のライン設計が
あたりの重量が減り、同じ働きでも数値上は生産性が
毎年繰り返し行うことで、継続的な改善が可能となって
あるからこそ。攻めの商品戦略を、確かな収益力が足元
下がって見えることに加え、付加価値は高いが手間のか
います。
から支えています。
かるトップシール商品が増え、商品構成の変化で過去
との比較も難しくなりました。
この指標を現場に結びつけるのが「PI(プリマ・イノ
そこで当社では、改善そのものを目的とした独自指標
とつずつ取り除き、100%との差を埋めていく取り組み
「生産効率」
へと管理の軸足を移しました。
ラインごとに
で、
フィルム交換時間の短縮など小さな改善の積み重ね
「あるべき姿」
を100%と定め、現状とのギャップを改善
が生産効率を着実に押し上げます。
こうした活動を通じ
の余地として捉える社内指標です。他社と比べる数字で
て、現場では“ムダを省く意識”も高まっています。
はなく、各工場が自らの“伸びしろ”を見つけ、改善に挑
むための「ものさし」。年度当初からの向上幅で成果を
効率改善のインパクトは小さくありません。工場全体
で生産効率が5%向上すれば、月20稼動日のうち1日分
測ります。
しばしば、期中に最新機器の導入やライン変更等に
90
加工食品事業の競争力を支える
「挑戦力」
と
「収益力」
23 加工食品事業
25 Highlight 2
改善の
余地
改善の
余地
食肉事業の新たな競争力を築く
「変革力」
と
「成長力」
改善の
余地
27 食肉事業
70
人材戦略
60
29 人材強化に向けた目標と取り組み
50
サステナビリティ戦略
40
31 Sustainability Issues
30
宮城農場から始まる資源循環
前期末値
期末値
前期末値
2023年度
生産効率(実績)
期末値
2024年度
改善の余地
前期末値
期末値
2025年度
改善
あるべき姿
期中に最新機器の導入やライン変更等により
「あるべき姿」が期初に設定した100%を超えた
場合は、
翌年度のスタート時の起点となる生産効
率は、
前年度末の値を下方に洗い替えされます。
一人ひとりが改善への挑戦を
続けていきます!
生産効率の取り組みは、
「あるべき姿」
と現状の差を埋
める日常的な改善活動として定着しています。
一人ひとりの小さな気づきや工夫が改善につながりま
生産
効率
生産
効率
前期末値
N年度
期末値
33 プリマハムグループのサステナビリティ
34 重要課題(マテリアリティ)への取り組み
35 健康で豊かな食生活を創造する/
地球環境の保全に貢献する
生産効率取り組みのイメージ
改善の余地
財務戦略
17 財務担当役員メッセージ
事業戦略
100
80
Section 2 成長戦略
15 中期経営計画
19 本部長メッセージ
21 Highlight 1
生産効率の期初・期末比較(過去3年)
ベーション)活動」
です。
これは既存設備に潜むムダをひ
Section 1 価値創造ストーリー
07 プリマハムが大切にしていること
08 成長戦略のロードマップ
09 私たちのあゆみ
10 ビジネスモデルと強み
12 価値創造プロセス
13 経営資本と成長戦略の関係
生産
効率
生産
効率
前期末値
期末値
N+1年度
改善
す。
これからも改善への挑戦を続けていきます。
洗替
生産本部
製造・技術部技術課長
米島祐一郎
36 サプライチェーン・マネジメントを強化する/
人権デュー・ディリジェンス
37 アニマルウェルフェア/食育の取り組み
38 環境負荷の全体像
39 気候変動・自然関連課題への対応
Section 3 コーポレートガバナンス
41 社外取締役メッセージ
43 企業統治体制の全体像
47 役員一覧
51 リスクマネジメント
Appendix データ編
53 11年間の連結財務サマリー
55 サステナビリティデータハイライト
56 会社情報/株式情報
成長戦略
事業戦略
加工食品事業
ハム・ソーセージ
「香薫 ® あらびきポーク」をはじめとする
ハム・ソーセージ類の製造・販売を担う中
核事業。量販店や小売店を通じて全国の
食卓へ商品を届けています。
加工食品
ハンバーグやミートボール、サラダチキン
など、
ハム・ソーセージ以外の調理加工食
品を手がけており、多様化する食のニーズ
に応えています。
ベンダー事業
コンビニエンスストア向けにサラダや軽
食、調理パン、デザート、
スムージーを製
造・供給しています。
プリマハムグループ 統合報告書2026
億円
前年差
+11 億円
200
3,000 2,856 141
前年差
3,007
102
2,000
億円
セグメント営業利益(億円)
売上高(億円)
4,000
セグメント営業利益
79
INDE X
売上高・営業利益推移
売上高
3,146
23
3,122
3,135
3,146
111
79
79
150
100
50
1,000
+0 億円
0
0
2021
2022
2023
2024
2025 (年度)
2025 年度の振り返り
・生産シェア・SCIシェアトップ
・営業活動の強化
・人時生産性の向上・生産能力の拡大
Section 2 成長戦略
財務戦略
価格改定と販売拡大で、収益を改善
自動化投資とPI活動で、安定供給を継続
価格改定や販売数量の拡大、人時生産性の向上に取
主力ブランド
「香薫®あらびきポーク」
を中心に数量・
り組み、
ハム・ソーセージを中心とした主力商品の売上
収益ともに順調に増加するなか、
将来の労働力不足を見
が伸長し、合計43億円の収益改善効果を生み出しまし
据え、省人化投資や新ラインの導入を推進しました。独
た。一方、原材料費や物流費のコストアップへの対応は
自のPI
(プリマ・イノベーション)
活動※を全社規模で展開
継続的な課題となっています。
ハム・ソーセージ
「香薫®」
の伸長で、
シェアNo.1を堅守
● 価格政策と販促策が奏功し、コンシュー
目標・KPI
Section 1 価値創造ストーリー
07 プリマハムが大切にしていること
08 成長戦略のロードマップ
09 私たちのあゆみ
10 ビジネスモデルと強み
12 価値創造プロセス
13 経営資本と成長戦略の関係
17 財務担当役員メッセージ
マ商品が伸長
● 市場シェアを1.0pt拡大し、
No.1を獲得
●「香薫®あらびきポーク」
は大袋の発売10周
年の期間限定増量等が寄与し前年比112%
●「香薫®」
を中心に数量・収益ともに順調に
増加
● ベーコン群は原料相場の上昇等により
苦戦
事業戦略
19 本部長メッセージ
21 Highlight 1
加工食品事業の競争力を支える
「挑戦力」
と
「収益力」
23 加工食品事業
25 Highlight 2
食肉事業の新たな競争力を築く
「変革力」
と
「成長力」
27 食肉事業
人材戦略
し、
生産改善で着実な成果を上げています。
一方、
安定生
29 人材強化に向けた目標と取り組み
産に向けた外部環境への対応や、
自動化設備の拡充と増
31 Sustainability Issues
目指す未来
健康で豊かな食生活を提供
02 トップメッセージ
15 中期経営計画
産に伴う人材教育の強化が課題となっています。
多様なニーズに応えながら
プリマハムグループ 統合報告書 2 0 2 6
加工食品
ベンダー事業
機能性とフードサービスで数量が拡大
収益回復への布石として、構造改革に着手
● 価格政策と販促策が奏功し、
コンシュー
● 工場間での生産商品移管・集約など構
マ・業務用ともに数量が拡大
● ミートボール群が前年比111%、
ハンバー
グ群も好調。
「連タイプのサラダチキン」
が
大きく伸長し、売上を牽引
● 業務用はコンビニエンスストアのファスト
フードカウンター向けが販売に貢献
● 原料・包装資材などの価格高騰が課題
造改革に着手も、売上高減少に加え、原
材料・労務費の改善努力が追いつかず
減益
● 原材料・エネルギー価格の高騰への対
応、CVS市場全体の成長が頭打ちである
ことが課題
※PI活動: “ムダをなくすこと”を目的に、設備の稼動率や作業効率といった定量指標をさまざまな方法で改善する活動
サステナビリティ戦略
宮城農場から始まる資源循環
33 プリマハムグループのサステナビリティ
34 重要課題(マテリアリティ)への取り組み
35 健康で豊かな食生活を創造する/
地球環境の保全に貢献する
36 サプライチェーン・マネジメントを強化する/
人権デュー・ディリジェンス
37 アニマルウェルフェア/食育の取り組み
38 環境負荷の全体像
39 気候変動・自然関連課題への対応
Section 3 コーポレートガバナンス
41 社外取締役メッセージ
43 企業統治体制の全体像
47 役員一覧
51 リスクマネジメント
Appendix データ編
53 11年間の連結財務サマリー
55 サステナビリティデータハイライト
56 会社情報/株式情報
成長戦略
事業戦略
プリマハムグループ 統合報告書2026
今後に向けた事業戦略
市場シェアの拡大
フードサービス事業の拡大
24
INDE X
2026 年度の業績予想
加工食品の拡大
事業効率化・精度向上
項目
2026年度計画
前年差
増減率
売上高
3,440億円
+294億円
+9.3%
営業利益
98億円
+19億円
営業利益率
2.8%
+0.3pt
+23.6%
Section 1 価値創造ストーリー
07 プリマハムが大切にしていること
08 成長戦略のロードマップ
09 私たちのあゆみ
10 ビジネスモデルと強み
12 価値創造プロセス
13 経営資本と成長戦略の関係
15 中期経営計画
強み
|
「香薫」
の圧倒的なブランド認知度と、国内トップクラスの強固な基礎
収益力
|現場主導の
「PI活動」
による、徹底したコスト競争力と高い生産性
|伊藤忠グループと連携したグローバル調達網とリテール・CVSへのアクセス
|お取引先との信頼関係およびスポンサー先企業を活用した販売促進
Weaknesses
弱み
|特定分野に限定的な商品カテゴリー
|ベンダー事業における売上変動
|コスト上昇に対する価格転嫁の難しさ
|建設・資材コスト高騰下での設備維持更新の負担
O pportunities
ブランド育成と販路拡大で、成長を描く
AI検査と工場増強で、原価を低減
ハム・ソーセージのコンシューマシェアNo.1を継続
安全・安心を前提とした生産効率のさらなる向上を
し、
「香薫 ® 」をNo.1ブランドへ育てます。また、加工食
最優先に、収益基盤の強化と強固な生産・供給体制の
品ではeコマースや冷食・惣菜、業務用商材を成長領域
構築を進めます。AIを応用した検査でラインの省人化
と位置づけ、本部間で連携し、成功事例を全国へ水平
と衛生改善を同時に実現し、茨城・北海道両工場の能
展開していきます。
さらに、
フードサービス事業では外
力増強と新たな製造設備・ラインにより原価低減を図
食の新規・深耕開拓を進めてコンビニエンスストア依存
ります。あわせて人的資本への投資と組織の活性化を
からの脱却を図っていきます。
進め、
つくる力で事業の成長を支えます。
脅威
|長期化する円安と世界的なインフレ継続に伴う、輸入原料肉・資材コスト
の上昇
|地政学リスク緊迫化による原油高、および包装フィルム・ユーティリティ
価格の急騰
|世界的な家畜伝染性疾病
(ASF等)
発生に伴う、国際的な原料肉調達競争
の激化
|国内の人口減少に伴う市場縮小と、深刻な人手不足に伴う人件費・物流
費の上昇
財務戦略
17 財務担当役員メッセージ
事業戦略
19 本部長メッセージ
21 Highlight 1
加工食品事業の競争力を支える
「挑戦力」
と
「収益力」
23 加工食品事業
25 Highlight 2
食肉事業の新たな競争力を築く
「変革力」
と
「成長力」
27 食肉事業
人材戦略
29 人材強化に向けた目標と取り組み
サステナビリティ戦略
31 Sustainability Issues
宮城農場から始まる資源循環
33 プリマハムグループのサステナビリティ
34 重要課題(マテリアリティ)への取り組み
35 健康で豊かな食生活を創造する/
機会
|健康志向の定着や簡便化ニーズに伴う、高付加価値・冷凍惣菜の市場拡大
|インバウンド本格回復に伴う、外食・フードサービス向け業務用食材需要
の急拡大
|自動化・省人化技術や生成AI等の劇的な進化による、生産効率向上の機会
|アジア等新興国市場の成長と、高品質な日本仕様の加工食品ニーズ拡大
Threats
02 トップメッセージ
Section 2 成長戦略
SWOT 分析
S trengths
プリマハムグループ 統合報告書 2 0 2 6
ハム・ソーセージ
加工食品
ベンダー事業
「香薫®」
の販促と供給体制で、
No.1ブランドへ
サラダチキンと業務用商品で数量を拡大
商品開発力を磨き、収益基盤を立て直し
● キャンペーンなどの販促による認知向上
● フードサービス
(外食・問屋・業務用)
の新
● 得意先政策と連動したメニュー開発プロ
と販売数量拡大。
●「ジョンソンヴィルウインナー」
のテレビ
CM展開と、高価格帯市場における確固
たるポジションの確立
● 製造体制の集約、
およびラインの自動化・
連続化の推進による製造原価の低減
● 検査機器の高度化による品質改善
規開拓と既存取引先の深耕
● GABA・MCTを配合した機能性表示食品
(サラダチキンバー等)のラインアップ拡
充による、新規需要の獲得
● 主力商品の品位改善による販売数量の
拡大
セスの強化、
および新規採用品数の最大化
● 工場間における最適メニュー移管および
生産拠点の集約・適正化による徹底した
生産効率の改善
● 一部不採算商品のSKU削減によるコスト
低減
地球環境の保全に貢献する
36 サプライチェーン・マネジメントを強化する/
人権デュー・ディリジェンス
37 アニマルウェルフェア/食育の取り組み
38 環境負荷の全体像
39 気候変動・自然関連課題への対応
Section 3 コーポレートガバナンス
41 社外取締役メッセージ
43 企業統治体制の全体像
47 役員一覧
51 リスクマネジメント
Appendix データ編
53 11年間の連結財務サマリー
55 サステナビリティデータハイライト
56 会社情報/株式情報
成長戦略
Highlight 2
25
プリマハムグループ 統合報告書2026
INDE X
食肉事業の新たな競争力を築く
「変革力」
と
「成長力」
食肉事業は現在、収益基盤の強化と成長領域の開拓という2つの挑戦が進んでいます。養豚事業では組織横断プロジェクトによる
02 トップメッセージ
収益構造改革を推進している一方、北海道での交雑牛短期肥育プログラムの開発や牛肉輸出の拡大にも取り組んでいます。
Section 1 価値創造ストーリー
そうした
「変革力」
と
「成長力」
の両輪を回しながら、食肉事業は次の成長ステージへと歩みを進めています。
07 プリマハムが大切にしていること
08 成長戦略のロードマップ
09 私たちのあゆみ
10 ビジネスモデルと強み
12 価値創造プロセス
13 経営資本と成長戦略の関係
変革力 ―― 養豚事業再建に向けて
聖域なき構造改革へ――
プリマハムグループ 統合報告書 2 0 2 6
養豚事業再建組織横断プロジェクト
全部門結集の養豚事業再建プロジェクトが始動
Section 2 成長戦略
15 中期経営計画
財務戦略
養豚事業は、設備の老朽化や疾病対策費用の増加が
複数の将来予測での検証を行うにあたり、各拠点で
コストを圧迫し、
厳しい事業環境が続きました。
業界全体
個別に管理していた資料を集約してバリューチェーンで
でも将来的な調達難による食肉価格の上昇が予測され
の収益構造を分析する
「インテグレーションPLモデル」
るなか、
コスト競争力の強化は生き残りの絶対条件です。
を作成しています。すでに簡易モデルの作成を完了し、
自社単独での改善には限界があるという危機感から、
当
各エリアの実績KPIから収益のボトルネックを特定する
社グループでは既存の延長線上ではない“抜本的な構造
検証を経て、最終的な事業戦略の策定を進めています。
改革”を推進すべく、全部門を巻き込む組織横断プロ
将来的にはサプライチェーン全体の利益率を統合的な
ジェクトを立ち上げました。
KPIに据え、強固な収益基盤の確立を目指します。
プロジェクトでは、社長をリーダーに、食肉事業本部
の食肉商品事業部・国産ポーク部と生産現場を熟知し
た太平洋ブリーディング(株)
・
(有)肉質研究牧場、
そし
て全社戦略を担う総合企画部が参画。外部企業との協
業検討では伊藤忠商事にも加わってもらい、客観的な
視点を取り入れた議論を重ねています。
現在は、鹿児島、東北・北海道、愛媛・宮崎などエリア
の「実態調査」、
「損益検証」を本格化させ、現状農場の
めています。
プロジェクト
リーダー
(社長)
事業戦略
19 本部長メッセージ
21 Highlight 1
プロジェクト
全体を統括
加工食品事業の競争力を支える
「挑戦力」
と
「収益力」
23 加工食品事業
25 Highlight 2
食肉事業の新たな競争力を築く
「変革力」
と
「成長力」
27 食肉事業
食肉商品
事業部
国産ポーク部
PLモデルの
分析を牽引
“強い国産豚肉事業”へと進化を遂げていきます!
太平洋
ブリーディング・
肉質研究牧場
29 人材強化に向けた目標と取り組み
事業戦略を
支援
31 Sustainability Issues
飼養管理・設備の
知見を供給
伊藤忠商事
Section 3 コーポレートガバナンス
財務視点・外部協業の検討
(ボトルネックの解消)
決意です!
田丸和幸
地球環境の保全に貢献する
人権デュー・ディリジェンス
われない柔軟な変革力が欠かせません。本プロジェク
食肉事業本部
食肉商品事業部国産ポーク部長
宮城農場から始まる資源循環
33 プリマハムグループのサステナビリティ
34 重要課題(マテリアリティ)への取り組み
35 健康で豊かな食生活を創造する/
37 アニマルウェルフェア/食育の取り組み
38 環境負荷の全体像
39 気候変動・自然関連課題への対応
安定供給に応え続けるためには、過去のやり方にとら
した利益を創出できる強い食肉事業へと進化していく
サステナビリティ戦略
36 サプライチェーン・マネジメントを強化する/
検討を同時に進める大きな転換点にあります。食肉の
トを必ず成功させ、いかなる市場環境においても安定
人材戦略
総合
企画部
養豚事業は今、構造改革と最適投資・アライアンスの
改善や農場の集約・整理、外部企業との協業強化といっ
た複数シナリオに基づく戦略策定を、聖域を設けずに進
17 財務担当役員メッセージ
インテグレーションPLモデル
41 社外取締役メッセージ
43 企業統治体制の全体像
47 役員一覧
51 リスクマネジメント
生産〜販売の損益を統合把握
Appendix データ編
53 11年間の連結財務サマリー
55 サステナビリティデータハイライト
56 会社情報/株式情報
成長戦略
Highlight 2
プリマハムグループ 統合報告書2026
26
プリマハムグループ 統合報告書 2 0 2 6
INDE X
成長力 ―― 国産牛の可能性を、世界へ
“次世代へ誇れる畜産”の実現を目指して
この取り組みを通じて創造したいのは、環境にも配慮した
“短期肥育×輸出拡大”で国産牛の新たな可能性を切り拓く
「サステナブルな畜産モデル」
という価値です。生産者様と
の連携による変革は、
コスト競争力の強化にとどまらず、未
飼料価格の高騰や国内市場の縮小を背景に、食肉事
これら2つの取り組みを両輪に、国産牛の新たな価
業では「生産性の向上」
と
「海外需要の獲得」が急務と
値を追求します。短期肥育で培ったノウハウは他農場
なっています。
プリマハムが進めている北海道での交雑
へ水平展開して持続可能な生産モデルへと広げ、輸出
牛短期肥育プログラムの開発と牛肉輸出の強化は、
そ
の拡大により国産牛のグローバル化を牽引していき
れぞれの課題に応える2つの取り組みです。
来の食を支える社会的価値に直結します。今後も新たな可
能性を切り拓き、企業価値の向上に努めてまいりますので、
引き続きご支援をお願いいたします。
牛」
を対象に、佐々木畜産(株)
との協業で、通常より約5
Section 2 成長戦略
食肉事業本部
食肉商品事業部 ビーフ部長
ます。
財務戦略
金子雅彦
17 財務担当役員メッセージ
事業戦略
19 本部長メッセージ
21 Highlight 1
牛肉輸出の強化
短期肥育プログラム
ケ月の肥育期間短縮を目標に商品開発を進めてきまし
た。従来、期間短縮には肉質低下という課題がありまし
たが、最適な飼料配合とデータ管理によって品質維持
食肉事業の新たな競争力を築く
「変革力」
と
「成長力」
通常
肥育
人材戦略
哺育期
育成期
肥育期
(脂肪交雑・肉質向上)
出荷
和牛需要が高まる
29 人材強化に向けた目標と取り組み
東南アジアや北米へ
31 Sustainability Issues
ながら、
「おいしさ」
と
「効率」の最適解を追求しました。
すでにテスト出荷を完了し、今後は飼料コストと温室効
もう1つは、海外需要を取り込む牛肉輸出の強化で
す。和牛需要が高まる東南アジアや北米を中心に、主力
短期
肥育
哺育期
育成期
肥育期
出荷
5
工・物流までを一貫管理できるサプライチェーンと、特
です。現地からの評価は高く、取引は拡大しています。
宮城農場から始まる資源循環
33 プリマハムグループのサステナビリティ
34 重要課題(マテリアリティ)への取り組み
35 健康で豊かな食生活を創造する/
地球環境の保全に貢献する
36 サプライチェーン・マネジメントを強化する/
交雑牛
37 アニマルウェルフェア/食育の取り組み
38 環境負荷の全体像
39 気候変動・自然関連課題への対応
飼料コストの削減
最適な飼料配合×データ管理
Section 3 コーポレートガバナンス
牛の健康を第一に給餌を微調整
温室効果ガスの削減
連携
生産・加工・物流を一貫管理
サステナビリティ戦略
人権デュー・ディリジェンス
黒毛
和牛
定の地域・ブランドに固執せず全国の協力生産者・協力
工場と連携する安定供給体制が、
当社の競争力の源泉
輸出
強化
約 ケ月
短縮!
の黒毛和牛に、おいしさと価格競争力を兼ね備えた交
雑牛を加えて提案し、新市場を開拓します。生産から加
加工食品事業の競争力を支える
「挑戦力」
と
「収益力」
23 加工食品事業
25 Highlight 2
27 食肉事業
と早期出荷を両立。牛の健康を第一に給餌を微調整し
果ガスの削減を目指します。
Section 1 価値創造ストーリー
07 プリマハムが大切にしていること
08 成長戦略のロードマップ
09 私たちのあゆみ
10 ビジネスモデルと強み
12 価値創造プロセス
13 経営資本と成長戦略の関係
15 中期経営計画
1つは、生産性向上を目指す交雑牛の短期肥育プロ
グラムです。黒毛和種と乳用種を掛け合わせた「交雑
02 トップメッセージ
協力生産者
41 社外取締役メッセージ
43 企業統治体制の全体像
47 役員一覧
51 リスクマネジメント
Appendix データ編
53 11年間の連結財務サマリー
55 サステナビリティデータハイライト
56 会社情報/株式情報
成長戦略
事業戦略
食肉事業
食肉販売
国内外から牛・豚・鶏を仕入れ、全国の
量販店や外食・加工メーカーへ販売す
る事業。多彩なオリジナルブランドを強
みとしています。
養豚事業
国産豚肉の一貫生産を担う事業。
自社グ
ループ農場での生産から加工・物流・販売
まで、
川上から川下までを一貫して手がけ
ています。
プリマハムグループ 統合報告書2026
27
INDE X
売上高・営業利益推移
売上高
1,601
159
億円前年差 +
億円
セグメント営業利益(億円)
売上高(億円)
2,000
1,500
40
1,347
1,442
1,356
1,296
1,601
1,000
セグメント営業利益
19
13
500
19
億円
前年差
+7 億円
12
8
30
20
10
0
0
▲2
2021
2022
プリマハムグループ 統合報告書 2 0 2 6
▲10
2023
2024
2025 (年度)
02 トップメッセージ
Section 1 価値創造ストーリー
07 プリマハムが大切にしていること
08 成長戦略のロードマップ
09 私たちのあゆみ
10 ビジネスモデルと強み
12 価値創造プロセス
13 経営資本と成長戦略の関係
Section 2 成長戦略
15 中期経営計画
2025 年度の振り返り
財務戦略
17 財務担当役員メッセージ
販売数量を拡大し、収益性を改善
国産ポーク第二課で、再建に着手
事業戦略
19 本部長メッセージ
21 Highlight 1
食肉販売事業は、激しい為替変動や不透明な物流環
国内生産・養豚事業には、
川上から川下にいたるバリュー
境が続くなか、販売数量拡大による固定費単価の圧縮
チェーンの最適化を推進すべく、
「国産ポーク第二課」
を新設
を徹底的に推進しました。特にカナダ最大の養豚企業
し、
機動的な生産・販売調整など一定の成果を得ました。
一
食肉に関する
であるハイライフ社との強固なパートナーシップをい
方、
農場における疾病影響の継続により、
減耗頭数が増加。
“高付加価値な提案”をする企業へ
かした輸入豚肉や、
当社オリジナルブランドである
「タイ
出荷頭数が減少し、養豚事業は減益を余儀なくされました。
29 人材強化に向けた目標と取り組み
産米どり」
の輸入鶏肉が顧客のニーズを捉え、販売が飛
飼養管理の平準化や生産成績改善は今一歩およばず、
次年
31 Sustainability Issues
躍的に伸長しました。
度に向けた明確な最優先解決課題として認識しています。
目指す未来
目標・KPI
・養豚出荷頭数の向上
・養豚生産成績の向上
・食肉販売数量の拡大
・新規調達先の拡大・深耕
食肉販売
養豚事業
輸入豚肉や
「米どり」
の伸長で、数量が増加
一貫体制の最適化を進め、養豚の生産改善は途上
● 販売数量の拡大による固定費単価の圧縮
● 国産ポーク第二課を新設し、
川上から川下までの拠点最適化を
● 販売数量を拡大し、
食肉トレードの収益性を改善
推進
● ハイライフ社とのパートナーシップをいかした輸入豚肉が伸長
● 生産調整などによって一定の成果を獲得
● オリジナルブランド
「タイ産米どり」
の輸入鶏肉が伸長
● 川上から川下の最適化に取り組んだものの、
生産成績の改善は
継続課題
加工食品事業の競争力を支える
「挑戦力」
と
「収益力」
23 加工食品事業
25 Highlight 2
食肉事業の新たな競争力を築く
「変革力」
と
「成長力」
27 食肉事業
人材戦略
サステナビリティ戦略
宮城農場から始まる資源循環
33 プリマハムグループのサステナビリティ
34 重要課題(マテリアリティ)への取り組み
35 健康で豊かな食生活を創造する/
地球環境の保全に貢献する
36 サプライチェーン・マネジメントを強化する/
人権デュー・ディリジェンス
37 アニマルウェルフェア/食育の取り組み
38 環境負荷の全体像
39 気候変動・自然関連課題への対応
Section 3 コーポレートガバナンス
41 社外取締役メッセージ
43 企業統治体制の全体像
47 役員一覧
51 リスクマネジメント
Appendix データ編
53 11年間の連結財務サマリー
55 サステナビリティデータハイライト
56 会社情報/株式情報
成長戦略
事業戦略
プリマハムグループ 統合報告書2026
INDE X
今後に向けた事業戦略
養豚事業の再建
28
2026 年度の業績予想
販売数量拡大方針の継続
持続的に成長する新たな収益基盤の構築
項目
2026年度計画
前年差
売上高
1,550億円
△51億円
営業利益
28億円
+9億円
営業利益率
1.8%
+0.6pt
増減率
△3.2%
+45.0%
Section 1 価値創造ストーリー
07 プリマハムが大切にしていること
08 成長戦略のロードマップ
09 私たちのあゆみ
10 ビジネスモデルと強み
12 価値創造プロセス
13 経営資本と成長戦略の関係
15 中期経営計画
強み
|全国規模で展開する、業界屈指の国産豚肉一貫インテグレーション
|ハイライフ社(カナダ)等、海外一流サプライヤーとの強固な信頼関係
|ハムソー No.1を梃子(てこ)
にした、取扱数量と盤石な量販店販売網
|少数精鋭の営業体制と、徹底した仕入・在庫管理が生む高い資産効率
Weaknesses
弱み
|自社保有の牛・鶏生産拠点がなく、特定の輸入調達先に依存しやすい構造
|販売チャネル
(特定の量販店ルート)
への偏りと、外食・ECの開拓不足
|自社物流網の限定性と、2024年問題等に伴う中長期的な物流コスト負担
O pportunities
財務戦略
養豚事業再建と数量拡大で、100周年への収益基盤を構築
17 財務担当役員メッセージ
事業戦略
ここ数年の課題である養豚事業の再建については、
いった新たな領域へ販路を広げ、変容する事業環境に
科学的見地と現場に根差した改善を全社一丸で進め、
対応できる販売ポートフォリオを構築します。創業100
不退転の構えで養豚を収益の柱として再構築します。
ま
周年の節目となる2031年に向けて、持続的に成長する
た、成果を上げてきた販売数量の拡大方針を継続し、固
新たな収益基盤を築き、食肉に関する“高付加価値な
定費単価の圧縮と競争力の向上、数量拡大の好循環を
提案”をする企業を目指します。
回します。さらに、一次加工品や輸出、外食・業務用と
脅威
|長期化する為替の円安基調と、地政学リスク等に伴う輸入調達コストの
上昇
|世界的な家畜伝染性疾病(ASF等)
の拡大に伴う、国際的な食肉争奪戦
の激化
|トランプ関税導入等、世界的な保護貿易主義の台頭に伴う国際需給の急変
|国内の畜産業従事者の減少に伴う、将来的な国産原料肉の調達ひっ迫
懸念
19 本部長メッセージ
21 Highlight 1
加工食品事業の競争力を支える
「挑戦力」
と
「収益力」
23 加工食品事業
25 Highlight 2
食肉事業の新たな競争力を築く
「変革力」
と
「成長力」
27 食肉事業
人材戦略
29 人材強化に向けた目標と取り組み
サステナビリティ戦略
31 Sustainability Issues
機会
|インバウンドの本格回復に伴う、外食向け国産牛肉・豚肉需要の急拡大
|新興国の中間層拡大に伴う、高品質な日本産・日本監修ブランドの輸出
好機
|生活者の健康・たんぱく質摂取志向の定着による需要拡大
|アニマルウェルフェア
(WOAH指針等)
浸透に伴う、自社一貫管理肉の差
別化機会
|第一次産業におけるAI技術導入に伴う生産性向上期待の高まり
Threats
02 トップメッセージ
Section 2 成長戦略
SWOT 分析
S trengths
プリマハムグループ 統合報告書 2 0 2 6
宮城農場から始まる資源循環
33 プリマハムグループのサステナビリティ
34 重要課題(マテリアリティ)への取り組み
35 健康で豊かな食生活を創造する/
食肉販売
養豚事業
一次加工品と外食・輸出で、販売先を多様化
外部専門家を招き、収益の柱へ再構築
● 販売数量拡大方針の継続による、
固定費単価の圧縮とコスト競
●「養豚事業再建プロジェクト」
の推進と、疾病対策・飼育技術の
争力のさらなる向上
● タレ漬け・ポーションカット等の簡便性に応える
「一次加工品
(国産・輸入)」
の提案強化
● アジア
(東南アジア)
や北米市場をターゲットとした、国産交雑
牛・和牛等の輸出事業の拡大
● 外食産業や大手惣菜加工メーカーへの直接アプローチによる、
安定的な販売チャネルの多角化
標準化
●「インテグレーションPLモデル」
を用いた、バリューチェーン全
体での収益ボトルネックの特定と解消
● 外部専門家の科学的知見と、
現場の飼養ノウハウを融合した改
善策の即時実行
● 老朽化した畜舎の計画的な設備更新と、
酷暑を乗り切るための
暑熱対策投資の徹底
地球環境の保全に貢献する
36 サプライチェーン・マネジメントを強化する/
人権デュー・ディリジェンス
37 アニマルウェルフェア/食育の取り組み
38 環境負荷の全体像
39 気候変動・自然関連課題への対応
Section 3 コーポレートガバナンス
41 社外取締役メッセージ
43 企業統治体制の全体像
47 役員一覧
51 リスクマネジメント
Appendix データ編
53 11年間の連結財務サマリー
55 サステナビリティデータハイライト
56 会社情報/株式情報
成長戦略
人材戦略
プリマハムグループ 統合報告書2026
29
プリマハムグループ 統合報告書 2 0 2 6
INDE X
人材強化に向けた目標と取り組み
02 トップメッセージ
経営戦略の実現を牽引する人材戦略の推進
Section 1 価値創造ストーリー
07 プリマハムが大切にしていること
08 成長戦略のロードマップ
09 私たちのあゆみ
10 ビジネスモデルと強み
12 価値創造プロセス
13 経営資本と成長戦略の関係
当社は、従来のハム・ソーセージ業界のトップ企業にと
具体的には、
キャリア採用の規模を従来の3倍以上に拡大
今後もこれらの人材戦略を組織全体に深く定着させ、
海
どまらず、
「食品業界のトップメーカー」
へ飛躍すべく、新た
して多様な知見を組織に取り入れるとともに、
DX等の特定
外展開やDXを含めた、次の成長ドライバーを牽引する次
な収益の柱の創出や海外展開、DX推進などの成長戦略を
分野では専門性に見合った給与体系を再構築し、
競争力の
世代リーダーが多数活躍する企業体へと進化を遂げてい
力強く推し進めています。
ある人材獲得を進めています。
あわせて、
次世代リーダーの
きます。人的資本への能動的かつ継続的な投資を通じて、
早期登用を推進することで、変化の激しい市場環境にも迅
株主・投資家の皆様の期待
(資本コスト)
を上回る成果を生
Section 2 成長戦略
ばの中堅層不足に加え、新規ビジネスやDXを担うIT人
速かつ柔軟に対応できる強靭な組織基盤を構築しています。
み出し、
持続的な企業価値の向上を実現してまいります。
15 中期経営計画
材、生産技術エンジニア、
グローバル人材の確保が喫緊の
私たちが目指すのは、従業員一人ひとりが自ら考え行動
課題となっています。国内市場の縮小が見込まれるなか、
する
「自律共創型マネジメント」の確立です。旧態依然のや
一方で、過去の採用抑制に起因する30代半ば〜40代半
財務戦略
17 財務担当役員メッセージ
事業戦略
19 本部長メッセージ
21 Highlight 1
現状の延長線上ではない新たな視点で自律的に挑戦でき
り方にとらわれず、
一人ひとりの創意工夫が成果を生み、
そ
る人材が必要不可欠です。
こうした課題認識のもと、当社
れが会社の業績向上、
ひいては個人の正当な評価や報酬へ
は人的資本経営の舵を切り、経営戦略のドライバーとして
と還元される仕組みづくりを進めます。
これによって各人が
執行役員
管理本部
人事部長
「価値創造への能動的投資」
を推進しています。
自らの仕事に自信と誇りを持てる環境を整えてまいります。
佐藤仁
加工食品事業の競争力を支える
「挑戦力」
と
「収益力」
23 加工食品事業
25 Highlight 2
食肉事業の新たな競争力を築く
「変革力」
と
「成長力」
27 食肉事業
人材戦略
29 人材強化に向けた目標と取り組み
課題
目標
● プリマハムグループの方針や戦略、
各部署の方針など
ビジョン・
戦略の共有
への理解が不十分
● 業績低迷期の影響で中堅従業員が少ない
● 生産技術を担うエンジニアやDXを推進するIT人材が
必要
● 次世代のリーダーの早期育成や優秀な人材教育の強
化が必要
● 男性育児休業の取得が進んでいない
人材の確保・
次世代人材の
育成
ダイバーシティ&
インクルージョン
おもな取り組み
● 方針発表会の開催
● イントラによる情報発信
● 学生向け職場体験の充実
● キャリア採用の強化
● カムバック・社員紹介制度の整備
● 海外留学制度の拡充
● 資格報奨金の増額
● 経済紙閲読促進
● 管理職登用の早期化
● 男性育児休業に関するアンケート実施
● 男性育児休業取得対象者への個別案内の実施
● 男性育休取得率100%達成目標年度の前倒し
● 育児支援制度の拡充検討
(パパ応援休暇・育児応援給付金の新設)
● 有休を取得しやすい職場環境の整備が必要
● 転居を伴う異動者に対する負担軽減と支援体制が必要
働きがいの向上
● 年次有給休暇取得率の低い事業所への取得促進施策
の実施
● 転居を伴う異動者への金銭的支援拡充
※青字の項目は次ページで詳しく紹介
2025年度実績
2030年度目標・KPI
‒
‒
女性採用比率
女性採用比率
42%
40%以上
男性育休取得率
男性育休取得率
管理職に占める女性比率
管理職に占める女性比率
年次有給休暇取得率
年次有給休暇取得率
80%
7.1%
77%
100%
10%
90%
サステナビリティ戦略
31 Sustainability Issues
宮城農場から始まる資源循環
33 プリマハムグループのサステナビリティ
34 重要課題(マテリアリティ)への取り組み
35 健康で豊かな食生活を創造する/
地球環境の保全に貢献する
36 サプライチェーン・マネジメントを強化する/
人権デュー・ディリジェンス
37 アニマルウェルフェア/食育の取り組み
38 環境負荷の全体像
39 気候変動・自然関連課題への対応
Section 3 コーポレートガバナンス
41 社外取締役メッセージ
43 企業統治体制の全体像
47 役員一覧
51 リスクマネジメント
Appendix データ編
53 11年間の連結財務サマリー
55 サステナビリティデータハイライト
56 会社情報/株式情報
成長戦略
人材戦略
プリマハムグループ 統合報告書2026
30
プリマハムグループ 統合報告書 2 0 2 6
INDE X
人材の確保
次世代人材の育成
02 トップメッセージ
中堅層・専門人材の確保に向け、キャリア採用を強化
30代半ば〜40代半ばの中堅層の人員
留学制度の拡充で、実践的なグローバル人材を育成
中期経営計画 で 掲 げ た「成長投資とグ
不足と、それに伴う直近および将来の管
キャリア入社した従業員の声
ローバル展開」の実現に向けて、年間4名を
海外派遣に参加した従業員の声
北米留学で培った多様な価値観や主体
理職不足という課題を背景に、定期採用
異業種からのキャリアチェンジで、想定
派遣する北米語学留学制度の内容を強化。
中心だった採用方針を見直し、即戦力と
外の挑戦に出会えました。自分起点で
カリキュラムも語学修得に加え、現地の市
性をいかし、海外視点を取り入れた新た
なるキャリア採用を強化。2025年度は23
発信していくおもしろさを日々実感して
場・文化分析やビジネス調査を組み込んだ
な価値提案に取り組んでいきたいです。
名(前年比約3.3倍)
を採用しました。
あわ
います。
実践的な内容へと刷新しました。また、推薦
せて、退職者を再び受け入れる
「カムバッ
時に「派遣後のビジョン」の明確化を必須と
ク制度」、従業員の人的ネットワークをい
し、留学で得た知見を組織へ還元する仕組
かす
「社員紹介制度」
も新設。多様な経験
Section 1 価値創造ストーリー
07 プリマハムが大切にしていること
08 成長戦略のロードマップ
09 私たちのあゆみ
10 ビジネスモデルと強み
12 価値創造プロセス
13 経営資本と成長戦略の関係
Section 2 成長戦略
15 中期経営計画
財務戦略
17 財務担当役員メッセージ
事業戦略
みを整備。多様な価値観を吸収した人材を、
を持つ人材の獲得を通じて、持続的な成
マーケティング本部
マーケティング部
販促企画課
将来の海外事業を牽引する中核人材へと育
マーケティング本部
商品企画部第二課
長を支える経営基盤を固めていきます。
新垣舞
成していきます。
德永 はるか
19 本部長メッセージ
21 Highlight 1
加工食品事業の競争力を支える
「挑戦力」
と
「収益力」
23 加工食品事業
25 Highlight 2
食肉事業の新たな競争力を築く
「変革力」
と
「成長力」
27 食肉事業
人材戦略
ダイバーシティ&インクルージョン
働きがいの向上
29 人材強化に向けた目標と取り組み
サステナビリティ戦略
育休取得を後押しする新制度を導入
「見える化」
と
「後押し」で、有休取得率 90%を目指す
男性育休取得率100%(2030年度目
標)の達成に向け、2026年4月に新制度
を導入。配偶者が出産した男性従業員を
対象に、5日間の有給休暇「パパ応援休
年次有給休暇取得率90%(2030年度目
パパ応援休暇を取得した男性従業員の声
分割取得で妻の退院・通院にも柔軟に対応でき、
職場への負担も抑えられました
暇」を新設するとともに、出産準備のた
めの休暇取得可能期間を予定日の1ケ月
前へ拡大しました。また、男女を問わず
育休取得者(連続1ケ月以上)の業務を
代替した従業員に対し、半年ごとに10万
円を支給する
「育児応援給付金」を設け、
取得する側と支える側の双方が前向き
になれる環境を整えました。
産後で動けない妻に代わり家事を担いつつ、
生まれたばかりの娘との貴重な時間を過ごせました
標)の達成に向け、各部署の取得状況を定期
関西量販部に所属する従業員の声
的に共有し、低取得率の部署への働きかけ
休日の旅行で新しい価値観に触れ心身を
リフレッシュ。仕事と休暇のメリハリが、
日々のパフォーマンスにつながっています。
を進めています。西日本支社・関西量販部デ
リカフローズン課では 、業務 の 見える化と
チーム内の情報共有によって、担当者が不在
でも相互にサポートできる体制を構築。気兼
今まで以上に、家庭と職場のバランスの
大切さに気づかされました
業務の質向上へつなげる意識を、
グループ全
体に浸透させていきます。
宮城農場から始まる資源循環
33 プリマハムグループのサステナビリティ
34 重要課題(マテリアリティ)への取り組み
35 健康で豊かな食生活を創造する/
地球環境の保全に貢献する
36 サプライチェーン・マネジメントを強化する/
人権デュー・ディリジェンス
37 アニマルウェルフェア/食育の取り組み
38 環境負荷の全体像
39 気候変動・自然関連課題への対応
Section 3 コーポレートガバナンス
ねなく申請できる風土のもと、高い取得率を
実現しました。今後も心身のリフレッシュを
31 Sustainability Issues
営業本部西日本支社
関西量販部
デリカフローズン課
田中宙
41 社外取締役メッセージ
43 企業統治体制の全体像
47 役員一覧
51 リスクマネジメント
Appendix データ編
53 11年間の連結財務サマリー
55 サステナビリティデータハイライト
56 会社情報/株式情報
成長戦略
Sustainability Issues
プリマハムグループ 統合報告書2026
31
プリマハムグループ 統合報告書 2 0 2 6
INDE X
宮城農場から始まる資源循環
02 トップメッセージ
Section 1 価値創造ストーリー
東日本大震災の津波被害を受けた宮城県亘理郡の亘理町・山元町。
07 プリマハムが大切にしていること
08 成長戦略のロードマップ
09 私たちのあゆみ
10 ビジネスモデルと強み
12 価値創造プロセス
13 経営資本と成長戦略の関係
太平洋ブリーディング(株)は、
この地に宮城農場を建設し、
養豚事業から排出される家畜排泄物を加工して堆肥として地域に還元するとともに、
地元農家が育てた飼料用米を豚の飼料とする
循環型農畜産業を展開しています。
Section 2 成長戦略
15 中期経営計画
財務戦略
17 財務担当役員メッセージ
事業戦略
震災復興の思いから生まれた農場
プリマハムグループの養豚事業を担う太平洋ブリー
ディング(株)は、2011年に発生した東日本大震災に
こうした経緯から宮城農場は地元とのつながりが深
く、町役場や近隣の農家・住民との対話を重ねながら、
費用が収入に変わり、農場は飼料費を抑えられ、地元
地域と共生する農場運営を続けています。
農家にはより良質な堆肥が届くという、“三方良し”の仕
組みです。
さらに、堆肥を圧縮成形したペレット堆肥の
よって福島県内の本社農場の操業休止を余儀なくされ
ましたが、
「いつか東北の地で農場を再建したい」
とい
未利用資源を提供する企業にとっては廃棄物の処理
未利用資源をいかした飼料配合・良質な堆肥づくり
製造にも着手しました。風の強い沿岸部でも飛散しにく
19 本部長メッセージ
21 Highlight 1
加工食品事業の競争力を支える
「挑戦力」
と
「収益力」
23 加工食品事業
25 Highlight 2
食肉事業の新たな競争力を築く
「変革力」
と
「成長力」
27 食肉事業
人材戦略
29 人材強化に向けた目標と取り組み
サステナビリティ戦略
農場で日々発生する家畜排泄物は、場内で堆肥化し
く土壌に浸透しやすいため、津波による塩害からの地
31 Sustainability Issues
らの復興に向けて企業誘致を進めていた宮城県亘理
て地元農家に販売しています。特長は、地域の未利用資
力回復を目指す地元のニーズに応える商品として需要
町・山元町の願いと合致。両町にそれぞれ約13ヘク
源の活用です。近隣の飲料工場から出るコーヒー粕や
が広がっています。
33 プリマハムグループのサステナビリティ
34 重要課題(マテリアリティ)への取り組み
35 健康で豊かな食生活を創造する/
タールの「繁殖農場」
( 2022年稼動)と「肥育農場」
茶殻、製麺会社の乾麺くずなど、従来は廃棄物として処
(2023年稼動)
からなる
「宮城農場」
を建設し、繁殖から
理されていたものを買い取り、堆肥の発酵促進や飼料
出荷までを一貫して担っています。
の代替原料として再利用しています。
う思いを持ち続けてきました。
その思いが、津波被害か
「行き先が見える」
ことが農家の信頼に
この堆肥が“循環の輪”をつくるきっかけとなりまし
場の豚は、
ブランド豚として育てられており、その飼育
条件のひとつが、
「国産飼料用米を一定割合給与する」
堆肥を圧縮成形したペレット堆
肥。風の強い沿岸部でも飛散し
にくく、土壌に浸透しやすい
地球環境の保全に貢献する
36 サプライチェーン・マネジメントを強化する/
た。
きっかけは、販売先からのある条件でした。宮城農
地元農家との会合で
は、当社の方針を伝
えるだけでなく、地元
の方々の意見もいた
だくなど対話を重視
宮城農場から始まる資源循環
こととなっています。そこには「国内農家を元気にした
い」
という販売先の思いがあり、当社グループもこれに
人権デュー・ディリジェンス
37 アニマルウェルフェア/食育の取り組み
38 環境負荷の全体像
39 気候変動・自然関連課題への対応
Section 3 コーポレートガバナンス
41 社外取締役メッセージ
43 企業統治体制の全体像
47 役員一覧
51 リスクマネジメント
Appendix データ編
53 11年間の連結財務サマリー
55 サステナビリティデータハイライト
56 会社情報/株式情報
成長戦略
Sustainability Issues
共鳴しました。
そして稼動を開始した2022年に飼料用
プリマハムグループ 統合報告書2026
INDE X
現場の声
“循環モデル”を全国の農場へ
米の自社調達を開始し、堆肥を届けた同じ地域の農家
こうした取り組みは、地域への貢献にとどまりま
から米を買い取る体制を構築。堆肥が地域の土を肥や
せん。未利用資源の活用と飼料用米の自社調達は、輸
し、
その土地で育った米が豚を育てる――という、資源
入原料の価格高騰に対するリスクヘッジとなり、飼料コ
が地域のなかで一巡する“循環の輪”が完成しました。
ストと調達基盤の安定化という経営面の価値も生み出
当初は約500トンだった調達量は、2024年以降は4
しています。
プリマハムグループも地域資源をいかした
倍以上の2,000トン強に拡大しました。
その原動力は、
循環の輪を広げることを予定しており、
すでに愛媛県で
「自分のつくった米が、店頭に並ぶ豚肉になっている」
と
は、地元製紙会社から出る灰を堆肥づくりに活用する
いう地域の農家の方々の共感でした。丹精込めてつくっ
32
地域の農家の皆さんとの信頼関係が
深まったことが、何よりの喜びです。
当社の農場から出る堆肥を、地元の田畑に還元して、
そこから飼料を育ててもらう――この循環モデルを
構築するなかで、地域の農家の皆さんとの信頼関係
が非常に深まったことが、何よりの喜びです。農業を
取り巻く環境はめまぐるしく変化し、一筋縄ではいか
ないことも多いですが、
ここでともに踏ん張らなけれ
ば、
日本の畜産は飼料を輸入に頼り続けることになっ
てしまいます。
ですから、宮城農場で築いた"循環モデ
取り組みが始動しています。今後も、
この“循環モデル”
た米の行き先が見える。
そのことが価格だけではない、
を全国の自社農場それぞれの地域で構築し、
グループ
信頼関係を育み、調達量の拡大を支えています。
全体の飼料コスト低減と、持続可能な養豚業の実現、
プリマハムグループ 統合報告書 2 0 2 6
ル"を全国の農場に広げ、
プリマハムグループの養豚
をもっと強くしていきます!
02 トップメッセージ
Section 1 価値創造ストーリー
07 プリマハムが大切にしていること
08 成長戦略のロードマップ
09 私たちのあゆみ
10 ビジネスモデルと強み
12 価値創造プロセス
13 経営資本と成長戦略の関係
Section 2 成長戦略
15 中期経営計画
財務戦略
17 財務担当役員メッセージ
事業戦略
太平洋ブリーディング(株)
生産本部企画部担当課長
国内農業の活性化につなげていきます。
三好直亮
19 本部長メッセージ
21 Highlight 1
加工食品事業の競争力を支える
「挑戦力」
と
「収益力」
23 加工食品事業
25 Highlight 2
食肉事業の新たな競争力を築く
「変革力」
と
「成長力」
調達数量
(トン)
2026年以降も
拡大が見込まれる
3,000
家畜排泄物を活用した資源循環フロー
27 食肉事業
※ 各数値は2025年度実績
29 人材強化に向けた目標と取り組み
人材戦略
廃棄物
2,500
2,000
配合飼料
7,081トン
1,500
宮城農場から始まる資源循環
宮城農場
排泄物
(糞尿)
養豚
1,000
500
協力会社
0
2022年
2023年
2024年
2025年 2026年目標
サステナビリティ戦略
31 Sustainability Issues
外国産飼料
(コーン、大豆粕、乾麺くず)
宮城農場の
飼料配合施設
宮城農場の
堆肥化施設
飼料用米+外国産飼料配合
堆肥化(糞尿+コーヒー粕等)
協力会社
コーヒー粕、
木くず
33 プリマハムグループのサステナビリティ
34 重要課題(マテリアリティ)への取り組み
35 健康で豊かな食生活を創造する/
地球環境の保全に貢献する
36 サプライチェーン・マネジメントを強化する/
人権デュー・ディリジェンス
37 アニマルウェルフェア/食育の取り組み
38 環境負荷の全体像
39 気候変動・自然関連課題への対応
Section 3 コーポレートガバナンス
当初500トンだった飼料用米の
調達数量は、2024年以降は4倍
以上に拡大
飼料用米
2,400トン
地元農家
家畜排泄物由来の
堆肥を用いた飼料用米生産
堆肥
510トン
41 社外取締役メッセージ
43 企業統治体制の全体像
47 役員一覧
51 リスクマネジメント
Appendix データ編
53 11年間の連結財務サマリー
55 サステナビリティデータハイライト
56 会社情報/株式情報
成長戦略
サステナビリティ戦略
プリマハムグループ 統合報告書2026
33
プリマハムグループ 統合報告書 2 0 2 6
INDE X
プリマハムグループのサステナビリティ
02 トップメッセージ
取締役会からの諮問を受けて、将来のリスクを低減す
基本的な考え方
組んでいます。
プリマハムグループは、持続的な成長を通じて持続
るとともに、新たな事業機会を創出することをミッ
取り組みの状況は、
サステナビリティ委員会で確認し、
可能な社会の実現に貢献するという考えのもと、事業
ションとして、重要課題(マテリアリティ)の解決に向け
PDCAサイクルを回しながら取り組みを進めていきます。
活動に取り組んでいます。
た目標の設定、活動計画の策定、その進捗状況の確認
2020年9月には、中長期的な視点で当社グループの
とともに、重要課題(マテリアリティ)を適宜見直しま
方針策定から実行フェーズへ。
成長への影響が大きいリスク・機会を把握、分析し、経
す。また、本委員会の主要な諮問事項は定期的に取締
事業を通じた価値創造で、
営戦略とともに優先的に取り組むべき重要課題(マテリ
アリティ)
を特定。
また、2021年10月にはサステナビリ
なお、本委員会は代表取締役社長を委員長とし、
メン
ティ推進の根幹となる
「サステナビリティ基本方針」を
バーは関係する執行役員・主管者によって構成され、同
定め、持続的な成長を図っています。
委員会の管下には6つの分科会が設置されています。
WEB
サステナビリティ基本方針
https://www.primaham.co.jp/sustainability/policy.html
当社グループの中長期的な企業価値向上を図るた
め、2021年11月に
「サステナビリティ委員会」
を設置し
ました。
同委員会は、
取締役会の任意の諮問機関として、
重要課題(マテリアリティ)の特定
2021年10月
サステナビリティ基本方針の制定
2021年11月
サステナビリティ委員会の設置
2022年 8月
重要課題に関する目標・KPI設定
2022年12月
TCFD提言に基づき情報を開示
2023年 3月
アクションプラン設定
当社の取り組みは方針の「策定」から、
アクションプ
ランに基づく具体的な「実行」のフェーズへと移行し
ました。気候変動や生物多様性など、当社を取り巻
く社会課題は複雑化しています。私たちはこれらを
単なるリスクと捉えるのではなく、企業価値向上の
深め、全社一丸となって
「持続可能な食」の未来を切
まえ、3項目を追加し、現在は全13項目について目標・
り拓いていきます。
温室効果ガス削減目標
人権デュー・ディリジェンスの
連携
TNFD提言に基づき情報を開示
取り組み状況
品質・
開発
分科会
環境
分科会
調達
分科会
人材
分科会
コンプラ
イアンス
分科会
ガバナンス
分科会
連携
連携
連携
連携
連携
連携
加工原料
会議
人事委員会
コンプラ
イアンス
委員会
情報
セキュリティ
委員会
品質安全
会議
環境
委員会
・
・
・
・
・
・
目標・KPIの進捗、実績評価
答申
委員長:代表取締役社長社長執行役員
メンバー:関係執行役員・主管者/事務局:サステナビリティ推進部
「プリマハムグループサプライヤー行動規範」の制定重要課題に
「水使用量
2024年 4月 の削減」
「プラスチック使用量の削減」
「生物多様性の保全」の3つの課題を追
加「プリマハムグループ環境方針」
の改定
19 本部長メッセージ
21 Highlight 1
加工食品事業の競争力を支える
「挑戦力」
と
「収益力」
23 加工食品事業
25 Highlight 2
食肉事業の新たな競争力を築く
「変革力」
と
「成長力」
27 食肉事業
人材戦略
29 人材強化に向けた目標と取り組み
サステナビリティ戦略
31 Sustainability Issues
宮城農場から始まる資源循環
サステナビリティ委員会のおもな議題
取締役会
諮問
財務戦略
17 財務担当役員メッセージ
33 プリマハムグループのサステナビリティ
34 重要課題(マテリアリティ)への取り組み
35 健康で豊かな食生活を創造する/
KPIを定め、
その達成に向けたアクションプランに取り
2023年 9月「プリマハムグループ人権方針」
「プリマハムグループ調達方針」
の制定
サステナビリティ推進部を設置
機会と位置づけています。委員会と各部門が連携を
特定した後、
その後の社会情勢や事業環境の変化を踏
サステナビリティ委員会
2024年 7月「プリマハムグループアニマルウェルフェアポリシー」
の制定
岡元純児
事業戦略
サステナビリティマネジメント体制
2020年 9月
15 中期経営計画
2025年4月にサステナビリティ推進部が新設され、
重要課題(マテリアリティ)
サステナビリティ推進のあゆみ
2025年 4月
執行役員管理本部 サステナビリティ推進部長
2020年9月に10項目の重要課題(マテリアリティ)
を
推進体制
Section 2 成長戦略
持続可能な社会に貢献します。
役会に答申します。
Section 1 価値創造ストーリー
07 プリマハムが大切にしていること
08 成長戦略のロードマップ
09 私たちのあゆみ
10 ビジネスモデルと強み
12 価値創造プロセス
13 経営資本と成長戦略の関係
サプライヤー調査の結果
外部評価機関のESG評価と
今後の対応
エシカル戦略
地球環境の保全に貢献する
36 サプライチェーン・マネジメントを強化する/
人権デュー・ディリジェンス
37 アニマルウェルフェア/食育の取り組み
38 環境負荷の全体像
39 気候変動・自然関連課題への対応
Section 3 コーポレートガバナンス
41 社外取締役メッセージ
43 企業統治体制の全体像
47 役員一覧
51 リスクマネジメント
Appendix データ編
53 11年間の連結財務サマリー
55 サステナビリティデータハイライト
56 会社情報/株式情報
成長戦略
サステナビリティ戦略
34
プリマハムグループ 統合報告書2026
INDE X
重要課題(マテリアリティ)への取り組み
02 トップメッセージ
進捗実績
カテゴリー
重要課題
食の安全・安心の確保
P.35
健康で豊かな
食生活を創造する 健康に配慮した商品の提案
温室効果ガス排出量の抑制
(Scope1,2)
2030年度目標・KPI
● 主要な生産工場および農場における食品安全マネジメント
システム導入率100%
● 健康配慮型商品のラインアップ拡充
● 2030年度までに温室効果ガス排出量24.3%削減
(2021年度比)
※海外拠点・豚生体由来は除く
● 2035年度までに温室効果ガス排出量38%削減
(2021年度比)
※グループ全体
● 廃棄物排出量
(廃プラスチック・食品廃棄物)5%削減
(2021年度比)
P.35
地球環境の
保全に貢献する
廃棄物排出量の削減
● リサイクル率
(食品廃棄物)98%以上
※排出量ベース
水使用量の削減
プラスチック使用量の削減
生物多様性の保全
P.38
※製造数量あたりの原単位
サプライチェーン・持続可能な原材料調達の実現
マネジメントを
アニマルウェルフェアへの対応
強化する
● 水使用量3%削減
(2021年度比)
※製造数量あたりの原単位
● 包装資材に用いるプラスチック使用量削減
● 温室効果ガス、
水使用量、廃棄物等の削減の取り組みを通じ、
生物多様性への負荷を軽減
● 重要一次食肉サプライヤーの自主監査率100%
● 国際基準
(WOAHコード)に沿った自社養豚事業の飼養管理実施
● アニマルウェルフェアに配慮した原材料調達
● 年次有給休暇取得率90%、
年間実総労働時間の削減
2021年度
(基準年)
● 食品安全マネジメント
システム導入率(%)
̶̶̶
● 温室効果ガス排出量
(千トン-CO2e)
● 温室効果ガス排出量
(千トン-CO2e)
● 廃プラスチック削減
(kg/トン)
● 食品廃棄物削減
(kg/トン)
● リサイクル率
(食品廃棄物)
(%)
● 水使用量
(㎥/トン)
※男性育休取得率は5日以上で取得としてカウント
多様な働き方の尊重、推進
P.29
※対象はプリマハム(株)の社員
● 障がい者雇用率2.7%の達成
※対象はプリマハム(株)(特例子会社を含む)
働きがいのある
職場環境をつくる
● 人権に関する従業員教育実施率100%、
人権デュー・ディリジェンス
の実施
(年1回)
※対象は全グループ会社
優秀な人材の雇用と育成
心身の健康に配慮した
労働安全衛生
● 管理職に占める女性比率10%
※対象はプリマハム(株)の社員
● 従業員および家族が心と体も健康で、
充実した生活をおくれるよう、
P.43
コーポレートガバナンスの強化
93
健康配慮商品の
開発を推進
̶
154
173
2021年比11.0%削減
242
2021年比13.6%削減
34.6
209
2024年度
93
機能性表示食品
2品目を発売
135
2021年比21.9%削減
189
2021年比22.2%削減
2025年度
2026年度計画
93
95
栄養機能食品
5品目を発売
125
2021年比27.8%削減
177
2021年比27.1%削減
149
2021年比13.5%削減
210
2021年比13.5%削減
2021年比4.3%削減
2021年比8.4%削減
2021年比2.8%削減
33.6
60.6
62.2
55.4
63.4
17 財務担当役員メッセージ
19 本部長メッセージ
21 Highlight 1
33.2
33.1
31.7
2021年比4.7%削減
2021年比15%削減
2021年比2.8%削減
90.3
96.4
96.7
96.9
94.6
15.3
2021年比2.0%増加
̶
15.6
16.0
2021年比4.6%増加
15.8
2021年比3.2%増加
15.1
2021年比1.7%削減
包装パッケージの薄肉化や縮小化、
ラベルレス化などを継続的に推進
TNFD提言に基づく
情報開示
(4月)
0
● 自主監査率
(%)
プリマハムグループ
調達方針を制定
(9月)
86
プリマハムグループ
アニマルウェルフェア
ポリシーを制定
̶
94
飼養管理チェックリストに
基づき5農場を点検
TCFD・TNFD提言に基づく
統合的情報開示
国内サプライヤーの実地調査実施。
海外サプライヤーには
深堀アンケートを実施
と畜場点検を実施
50
64
67
77
80
● 男性育休取得率
(%)
5
56
61
80
100
● 女性採用比率
(%)
12
32
47
36
(2026年度実績)
2.3
2.3
2.5
● 年次有給休暇取得率
(%)
● 障がい者雇用率
(%)
̶̶̶
● 管理職に占める女性
比率(%)
2.4
単体4工場の全技能
実習生・特定技能547名
に実施
̶
2.8
4.7
6.0
7.1
42
2.7
(上期)
国内グループ会社
アンケート実施
アンケート結果に基づき実地調査
7.7
̶̶̶
̶
コンプライアンス委員会の定期開催
● 従業員一人ひとりのコンプライアンス意識のさらなる醸成に向けた
̶̶̶
̶
内部通報制度の適正運用と運営強化
● ステークホルダーへの適切な情報開示とESG評価機関の評価向上
̶̶̶
̶
CDP評価
CDP評価
CDP評価
ESG評価機関からの評価向上に
(気候変動:D、
水・森林:C) (気候変動・水:B、
森林:C) (気候変動・水:B、
森林:C)
向けた情報開示を推進
● TCFD提言およびTNFD提言に沿った情報開示による開示充実
̶̶̶
̶
財務戦略
事業戦略
加工食品事業の競争力を支える
「挑戦力」
と
「収益力」
23 加工食品事業
25 Highlight 2
食肉事業の新たな競争力を築く
「変革力」
と
「成長力」
27 食肉事業
人材戦略
29 人材強化に向けた目標と取り組み
サステナビリティ戦略
31 Sustainability Issues
宮城農場から始まる資源循環
33 プリマハムグループのサステナビリティ
34 重要課題(マテリアリティ)への取り組み
35 健康で豊かな食生活を創造する/
地球環境の保全に貢献する
36 サプライチェーン・マネジメントを強化する/
人権デュー・ディリジェンス
37 アニマルウェルフェア/食育の取り組み
38 環境負荷の全体像
39 気候変動・自然関連課題への対応
Section 3 コーポレートガバナンス
̶
取り組みを推進
Section 2 成長戦略
2021年比4.0%削減
2021年比7.1%削減
̶̶̶
Section 1 価値創造ストーリー
07 プリマハムが大切にしていること
08 成長戦略のロードマップ
09 私たちのあゆみ
10 ビジネスモデルと強み
12 価値創造プロセス
13 経営資本と成長戦略の関係
15 中期経営計画
65.2
̶
̶̶̶
2023年度
̶̶̶
健康維持・健康増進の活動を推進
● 公正、
透明、
自由な競争ならびに適正な取引の遂行
経営基盤を
強化する
83
̶̶̶
※対象はプリマハム(株)の全従業員
● 男性育休取得率100%、
女性採用比率40%以上
プリマハムグループ 統合報告書 2 0 2 6
TCFD提言に基づく
情報開示
TCFD提言に基づく
情報開示
TCFD/TNFD提言に
基づく情報開示
41 社外取締役メッセージ
43 企業統治体制の全体像
47 役員一覧
51 リスクマネジメント
TCFD/TNFD提言に
基づく情報開示
Appendix データ編
53 11年間の連結財務サマリー
55 サステナビリティデータハイライト
56 会社情報/株式情報
成長戦略
サステナビリティ戦略
プリマハムグループ 統合報告書2026
35
プリマハムグループ 統合報告書 2 0 2 6
INDE X
重要課題(マテリアリティ)への取り組み
02 トップメッセージ
健康で豊かな食生活を創造する
2025 年度の振り返り
健康価値商品の拡充で、
食生活ニーズに対応
地球環境の保全に貢献する
今後に向けて
新たなたんぱく源の提案で、
健康価値を創出
2025 年度の振り返り
脱炭素目標を新設し、
省エネ・廃棄物削減を着実に推進
Section 1 価値創造ストーリー
今後に向けて
環境投資を拡大し、
循環型社会の実現へ
開発分科会では、糖質ゼロ・減塩・高たん
今後も、塩分や糖質を抑える「引き算型」
2025年度は、
温室効果ガスの2035年削減目
2026年度から稼動する茨城工場の環境エ
ぱく・機能性を軸とした健康配慮型商品の開
と、たんぱく質や機能性成分を付加する
「足
標を新たに設定し、
脱炭素への取り組み方針を
リアにも環境投資枠を適用し、
動物性残渣や廃
07 プリマハムが大切にしていること
08 成長戦略のロードマップ
09 私たちのあゆみ
10 ビジネスモデルと強み
12 価値創造プロセス
13 経営資本と成長戦略の関係
Section 2 成長戦略
15 中期経営計画
財務戦略
17 財務担当役員メッセージ
発を推進しています。2025年度は、機能性表
し算型」の両面から新商品を開発し、健康価
定めました。
また、
設備面では建物への遮熱塗
プラスチックの廃棄物排出量削減と温室効果
示食品や栄養機能食品のラインアップを拡
値の創出を進めます。
また、将来的な動物性
装を導入し、
冷房コストと温室効果ガスを同時
ガス
(Scope3)
の削減を見込んでいます。
遮熱
充し、
「プリマヘルシー 」商品の展開も強化。
たんぱく質の供給不足を見据え、大豆をはじ
に削減するとともに、
廃プラスチックをはじめと
塗装による省エネ改善も継続的に展開し、
再生
健康意識の高まりに応えながら、栄養価だ
めとする植物性たんぱく質や次世代たんぱ
する廃棄物の削減・資源化にも積極的に取り
可能エネルギーのさらなる導入拡大や廃棄物
けでなく
「おいしさ」
との両立を追求し、多様
く質の研究・発掘を推進し、多様なたんぱく
組み、
産業廃棄物の削減と循環利用を推進し
リサイクルも推進します。
2030年・2035年の温
23 加工食品事業
25 Highlight 2
な食生活ニーズへの対応を進めています。
源の提案を通じて健康で豊かな食生活の実
ました。
引き続き環境投資枠を有効活用しなが
室効果ガス削減目標の達成に向け、
グループ
27 食肉事業
現に貢献していきます。
ら、
グループ全体の環境負荷低減を進めます。
全体で環境課題への対応を加速していきます。
事業戦略
19 本部長メッセージ
21 Highlight 1
加工食品事業の競争力を支える
「挑戦力」
と
「収益力」
食肉事業の新たな競争力を築く
「変革力」
と
「成長力」
人材戦略
29 人材強化に向けた目標と取り組み
サステナビリティ戦略
「しっとり」
を科学し、食の新たな魅力を発信する
茨城工場発、廃プラ削減への挑戦
ハムの商品パッケージには「しっとり」
という言葉が多く使われ
城工場に廃プラ破砕洗浄機・脱水機・造粒機を導入しました。決
の感覚を客観的に測ろうと未経験だった“摩擦の物理の世界”
め手となったのは、何度もメーカーに足を運んでテストを重ね、
に踏み込み、測定装置の開発に携わる大学の先生との縁から博
これまで廃棄していたプラスチックを再生材料として有価で販
士後期課程で学びながら研究を進めています。
ヒトの舌を模し
売できる目途が立ったことです。特に造粒機はリサイクル業者が
た接触子で摩擦を測ると、
しっとり感は摩擦特性と強く結びつく
ヒトの舌を模した接触子で、ハ
ムのしっとり感を測定
使用するような機械で、食品業界での活用例はほとんどありま
せんでしたが、最終工程で熱を加えることにより、洗浄後の水分
た。今後、商品開発やリニューアルの現場でこの評価法を活用し
や臭いの問題を解決しました。稼動から日が浅く実績の集計は
ていきたいと考えていますが、最終的に
「おいしい」
と感じるのは
これからですが、
月間約20トンの産業廃棄物削減と、処分費・運
人ですから、官能評価と組み合わせてより実態に近い評価を目
指しています。
日本人特有の“繊細な感覚”を数値化して共有し、
消費者のニーズにきめ細かく応えながら、食の魅力発信につな
げていきたいと考えています。
宮城農場から始まる資源循環
33 プリマハムグループのサステナビリティ
34 重要課題(マテリアリティ)への取り組み
35 健康で豊かな食生活を創造する/
2026年4月、廃プラスチック類の産業廃棄物を削減するため、茨
ているものの、
その正体は長く曖昧なままでした。
そこで私は、
こ
とわかり、ハムのしっとり感を数値で評価できるようになりまし
31 Sustainability Issues
地球環境の保全に貢献する
36 サプライチェーン・マネジメントを強化する/
人権デュー・ディリジェンス
茨城工場に導入した廃プラ破砕
洗浄機・脱水機
(左)
と、生成さ
れた再生プラスチック原料
(右)
搬費で約90万円のコスト削減を見込んでいます。廃棄物の削減
開発本部
基礎研究所
殘華久美子
は、
当社だけでなく社会全体の課題です。産業廃棄物だったもの
をプラスチック材料として再生できるようになったことは、資源
循環型社会の実現に向けた一歩と考えています。
生産本部
茨城工場
生産技術部長
柴田亨
37 アニマルウェルフェア/食育の取り組み
38 環境負荷の全体像
39 気候変動・自然関連課題への対応
Section 3 コーポレートガバナンス
41 社外取締役メッセージ
43 企業統治体制の全体像
47 役員一覧
51 リスクマネジメント
Appendix データ編
53 11年間の連結財務サマリー
55 サステナビリティデータハイライト
56 会社情報/株式情報
成長戦略
サステナビリティ戦略
プリマハムグループ 統合報告書2026
36
プリマハムグループ 統合報告書 2 0 2 6
INDE X
重要課題(マテリアリティ)への取り組み
02 トップメッセージ
サプライチェーン・マネジメントを強化する
2025 年度の振り返り
実態把握と対話を通じ、
調達基盤を強化
今後に向けて
対話と共創を深め、
持続可能な調達を推進
Section 1 価値創造ストーリー
人権デュー・ディリジェンス
実態把握を起点に、人権尊重の取り組みを深化
技能実習生をはじめとする外国人労働者の人権尊重は、食品産業における重要なサス
テナビリティ課題のひとつです。
プリマハムグループでは、2023年の人権リスクアセスメン
トを起点に、人権デュー・ディリジェンスの取り組みを体系的に推進しています。
調達分科会では、
「持続可能な原材料調達
2026年度は、
国内サプライヤーへの訪問・
の実現」
と
「アニマルウェルフェアへの対応」
対話を通じた相互理解の促進と、海外サプ
人、
あわせて547名を対象としたアンケート調査と外部専門家による対面インタビューを
を重点テーマに掲げています。2025年度は
ライヤーに対する人権分野に焦点を絞った
実施しました。
その結果、労働環境や安全衛生、差別・ハラスメントのない職場づくりについ
重要一次食肉サプライヤーへのアセスメン
深掘り調査を実施します。
また、
サプライヤー
ては概ね良好な状況が確認され、深刻な人権侵害は見受けられませんでした。
ト調査を本格的に推進し、未回答先への丁
とのオリジナルブランド開発も引き続き推進
寧な説明や対話を重ねた結果、回収率94%
し、調達関係を価値創造の場へと発展させ
を達成しました。
また、安定的かつ強靭な調
ます。
アニマルウェルフェアについても、国際
達体制の構築を目指し、
サプライチェーン全
基準に基づく自主基準のもとPDCAを継続
体の実態把握を進めるとともに、仕入先原産
し、運用の質と適用範囲の両面で前進を図
国の多様化にも取り組みました。
ります。
2025年度は、
ダッカ原則※1を参考に本体4工場※2で働く技能実習生、特定技能1号外国
一方、会社側が周知できていると考えていた相談窓口について、技能実習生や特定技能
外国人における認知が不十分であることが判明しました。
この内容を受け、2025年度の人
権啓発教育にこれらを追加し、動画教材も用いて周知・啓発を実施しました。
2026年度は、
グループ会社の技能実習生・特定技能メンバーに対してアンケートとイン
タビューを実施しました。
また、調査対象を委託先へ広げるとともに、調達先における労働
環境の把握にも着手しました。引き続き、アンケートと対話を継続しながら、サプライ
チェーン全体での人権尊重の取り組みを推進していきます。
対応時期
2025年度は原則すべての重要一次食肉サプライヤーを対象に、
2023年6月
人権・労働・環境・コンプライアンスに関するアセスメント調査を実
施しました。
調査を通じて、
サステナビリティへの取り組み状況に
実施内容
人権リスクアセスメント実施
おもな内容
当社グループにおける重要人権テーマを特定
① 外国人労働者への適切な労働環境・文化的配慮
② 委託先(調達・製造・物流・廃棄等)
を含む
サプライチェーン全体の労働環境
③ 調達先における労働環境および近隣住民への環境配慮
は地域差があることが判明しました。
例えば、
海外の主要サプライ
2023年9月
「プリマハムグループ
人権方針」
制定
人権デュー・ディリジェンス推進の基本方針を整備
ヤーでは方針や管理体制の整備が進む一方、
国内では実際の取り
2025年5〜6月
外国人労働者アンケート実施
ダッカ原則を参考に、本体4工場※2 の技能実習生、特定技能
1号外国人、あわせて547名を対象に実態調査を実施
2025年7月
外部専門家による
対面インタビュー実施
茨城・三重工場で外国人労働者へのインタビューを実施
2026年4月27日〜
5月15日
グループ会社の技能実習生、
特定技能メンバーに働く
環境アンケートを実施
ダッカ原則を参考に、グループ会社8社の技能実習生、
特定技能メンバーを対象にアンケート調査を実施
対象人数: 303名回答数:271名回答率:89.4%
2026年7月8日〜
7月10日
外部専門家による
対面インタビュー実施
グループ会社3社で外国人労働者へのインタビューを実施
組みが十分に文書化・可視化されていないケースもありました。
調査に向けた打ち合わせの様子
また、調査票だけでは把握しきれない実態も明らかになりまし
た。回答結果を踏まえてサプライヤーとの対話を重ね、相互理解
を深めることが、実態に即したリスク把握・改善につながると考
えています。2026年度は、人権やサプライチェーン管理に焦点を
絞った深掘り調査を実施するとともに、対話を重ねながら、持続
可能なサプライチェーンの構築を目指します。
食肉事業本部
食肉商品事業部
企画統轄課
山中理央奈
Section 2 成長戦略
15 中期経営計画
財務戦略
17 財務担当役員メッセージ
事業戦略
19 本部長メッセージ
21 Highlight 1
加工食品事業の競争力を支える
「挑戦力」
と
「収益力」
23 加工食品事業
25 Highlight 2
食肉事業の新たな競争力を築く
「変革力」
と
「成長力」
27 食肉事業
人材戦略
29 人材強化に向けた目標と取り組み
サステナビリティ戦略
プリマハムグループの人権デュー・ディリジェンスの取り組み
対話を通じて、持続可能な調達を!
07 プリマハムが大切にしていること
08 成長戦略のロードマップ
09 私たちのあゆみ
10 ビジネスモデルと強み
12 価値創造プロセス
13 経営資本と成長戦略の関係
※1 ダッカ原則:人権とビジネスに関する研究所
(IHRB)
が企業・NGO・労働組合・政府との協議を経て2012
年12月に発表した、移住労働者の人権を尊重するための原則です。
※2 北海道工場、茨城工場、三重工場、鹿児島工場
31 Sustainability Issues
宮城農場から始まる資源循環
33 プリマハムグループのサステナビリティ
34 重要課題(マテリアリティ)への取り組み
35 健康で豊かな食生活を創造する/
地球環境の保全に貢献する
36 サプライチェーン・マネジメントを強化する/
人権デュー・ディリジェンス
37 アニマルウェルフェア/食育の取り組み
38 環境負荷の全体像
39 気候変動・自然関連課題への対応
Section 3 コーポレートガバナンス
41 社外取締役メッセージ
43 企業統治体制の全体像
47 役員一覧
51 リスクマネジメント
Appendix データ編
53 11年間の連結財務サマリー
55 サステナビリティデータハイライト
56 会社情報/株式情報
成長戦略
サステナビリティ戦略
プリマハムグループ 統合報告書2026
重要課題(マテリアリティ)への取り組み
37
プリマハムグループ 統合報告書 2 0 2 6
INDE X
食育の取り組み
02 トップメッセージ
食生活の変化や生活習慣の多様化が進むなか、子どもたちが食の安全や健康的な食習慣を学ぶ
機会の重要性が高まっています。
プリマハムグループは、
「おいしさと感動で、
食文化と社会に貢献」
アニマルウェルフェア
という目指す姿のもと、
学校と連携し、
食への関心や正しい知識を育む食育活動を推進しています。
国際基準に基づき、
アニマルウェルフェアを着実に高める
プリマハムグループは、2024年7月に
「プリマハムグループ アニマルウェルフェア
ポリシー」
を制定し、国際基準(WOAHコード)
や農林水産省の指針に基づく自社基
準のもと、
「5つの自由」の確保に取り組んでいます。特に飼育環境の改善に向けて
は、妊娠豚用フリーストールや可動式分娩クレートの導入を推進しています。
また、
暑熱対策として豚舎への遮熱塗装・遮光カーテン設置や輸送時間の短縮による高温
対策など、近年の猛暑に対応した実践的な施策を講じています。
体制面では、太平洋ブリーディング(株)の直営農場にアニマルウェルフェア担当
者を配置し、本社が全農場の進捗を一元管理する仕組みを構築しました。2025年
度は同社独自のアニマルウェルフェア方針を掲げ、進捗チェックや実地研修を通じ、
従業員一人ひとりへの意識浸透を図っています。
また、飼養管理チェックリストを用
いた年1回の農場点検も実施し、適切な飼養管理とアニマルウェルフェアへの対応
状況を確認。現在は全農場での運用確立を優先課題と位置づけています。
食品の適切な取り扱いを学ぶ出前授業の実施
2014年から、
当社従業員が講師となり、小
学校で出前授業「冷蔵庫をのぞいてみよう」
を実施しています。身近な冷蔵庫のなかの食
品を題材に保存方法や扱い方、食品表示につ
いて学ぶプログラムで、
○ クイズの正解を班
ごとに考え、その理由を話し合って発表する
アクティブラーニング型の授業です。
これまで
に累計264校・17,448名が受講し、子どもた
ちが自ら考え学ぶことで、食への関心と理解
を深めています。今後は各地域での展開も見
据え、活動の拡充を図っていきます。
Section 2 成長戦略
15 中期経営計画
財務戦略
17 財務担当役員メッセージ
事業戦略
授業の最後には商品を通じて理解を深め
る機会も設けています
出前授業の実績(2026年7月までの累計)
学校訪問数
264校
授業実施数
264回
受講生徒数
17,448名
2025年度従業員教育の様子
食肉事業の新たな競争力を築く
「変革力」
と
「成長力」
27 食肉事業
人材戦略
29 人材強化に向けた目標と取り組み
宮城農場から始まる資源循環
朝食習慣の定着を促す食育プログラムの展開
係留場屋根へ遮熱対策を実施
加工食品事業の競争力を支える
「挑戦力」
と
「収益力」
23 加工食品事業
25 Highlight 2
31 Sustainability Issues
等の課題に対しても継続的にPDCAを回し、取り組みレベルの向上と情報開示の強
妊娠豚用フリーストールが導入された
農場
19 本部長メッセージ
21 Highlight 1
サステナビリティ戦略
2026年度は輸送負荷の軽減にも取り組む予定です。投資を伴うハード面の整備
化を図っていきます。
Section 1 価値創造ストーリー
07 プリマハムが大切にしていること
08 成長戦略のロードマップ
09 私たちのあゆみ
10 ビジネスモデルと強み
12 価値創造プロセス
13 経営資本と成長戦略の関係
生活リズムや健康の基盤となる朝食の重要性を伝え
るため、2026年4月から食育教材「朝ごはんを食べよう」
を小学校に無償提供しています。文部科学省の調査でも
朝食を毎日食べていない小・中学生の存在が明らかに
なっており、食育を通じた健康課題への対応が求められ
ています。本プログラムは、栄養バランスのとれた献立を
考えるグループワークを取り入れた体験型の内容が特
長です。提供開始以降、学校からの問い合わせが寄せら
れており、2026年秋以降は各地で出前授業の展開を予
定しています。今後は対象の拡大も視野に入れ、食習慣
の改善に貢献していきます。
33 プリマハムグループのサステナビリティ
34 重要課題(マテリアリティ)への取り組み
35 健康で豊かな食生活を創造する/
地球環境の保全に貢献する
36 サプライチェーン・マネジメントを強化する/
人権デュー・ディリジェンス
37 アニマルウェルフェア/食育の取り組み
38 環境負荷の全体像
39 気候変動・自然関連課題への対応
Section 3 コーポレートガバナンス
学習指導要領に準拠し、指
導者用ガイドやワークシー
トも同梱するなど、教育現
場ですぐに活用できるよう
に工夫された教材
41 社外取締役メッセージ
43 企業統治体制の全体像
47 役員一覧
51 リスクマネジメント
Appendix データ編
53 11年間の連結財務サマリー
55 サステナビリティデータハイライト
56 会社情報/株式情報
成長戦略
サステナビリティ戦略
プリマハムグループ 統合報告書2026
環境負荷の全体像
2023年度
2024年度
地球環境の保全をプリマハムグループの重要課題と位置づけ、脱炭素社会、資源循環社会、自然共生社会を目指した環境経営を推進しています。
INPUT
飼料投入量
566
万m
15
3
571万m 578 万m
3
事業活動に使用する資源・エネルギー
主原料(豚・牛・鶏)
(単体) エネルギー消費量
19
万トン
15 万トン 16 万トン
3
INDE X
02 トップメッセージ
2025年度
水使用量
38
プリマハムグループ 統合報告書 2 0 2 6
9
万トン
17 万トン 18 万トン
Section 1 価値創造ストーリー
電力使用量
25,272
原油
換算
万kL
9 万kL 9 万kL
プラスチック容器
使用量(単体)
うち 再エネ使用量
9,637
万kWh
0.6
万kWh
24,380 万kWh 25,584 万kWh
3,587 万kWh 6,634 万kWh
万トン
0.6 万トン 0.6 万トン
07 プリマハムが大切にしていること
08 成長戦略のロードマップ
09 私たちのあゆみ
10 ビジネスモデルと強み
12 価値創造プロセス
13 経営資本と成長戦略の関係
Section 2 成長戦略
15 中期経営計画
財務戦略
17 財務担当役員メッセージ
事業戦略
19 本部長メッセージ
21 Highlight 1
事業活動
加工食品事業の競争力を支える
「挑戦力」
と
「収益力」
SHOP
生産数量
生産・飼育
調達
生産
23 加工食品事業
25 Highlight 2
食肉事業の新たな競争力を築く
「変革力」
と
「成長力」
27 食肉事業
27
物流
万トン
人材戦略
販売
29 人材強化に向けた目標と取り組み
27 万トン 27 万トン
サステナビリティ戦略
31 Sustainability Issues
宮城農場から始まる資源循環
OUTPUT
排水量
425
15.91
CO2
万m3
434万m 446 万m
3
3
原単位
m3/トン
16.03 m /トン 16.68 m /トン
3
3
事業活動を通じて排出された環境負荷
CO2 排出量
Scope1・2
18
0.66
万トン-CO2e
Scope3
344
万トン-CO2e
21万トン-CO2e 19 万トン-CO2e 371 万トン-CO2e/トン 321 万トン-CO2e/トン
原単位
トン-CO2e/トン
0.78 トン-CO2e/トン 0.71 トン-CO2e/トン
33 プリマハムグループのサステナビリティ
34 重要課題(マテリアリティ)への取り組み
35 健康で豊かな食生活を創造する/
廃棄物
排出量
3.5
万トン
3.9万トン 3.7 万トン
地球環境の保全に貢献する
うち
うち
廃プラスチック
排出量
食品廃棄物排出量
1.4
0.05
万トン
1.6万トン 1.6 万トン
原単位
トン/トン
0.06 トン/トン 0.06 トン/トン
※「単体」
と示している数値以外はすべて連結ベース ※「飼料投入量」
は概算 ※「生産数量」
はグループ会社のハムソー工場、加工食品工場、食肉処理・加工場の合計(養豚生産は含まず)
※ 原単位=生産数量1t当たりの排出量 ※「廃プラスチック排出量」
は、容器以外のプラスチックも含む
36 サプライチェーン・マネジメントを強化する/
0.8
96.9 0.03
食品
リサイクル率
%
96.4% 96.7 %
万トン
0.9万トン 0.9 万トン
原単位
トン/トン
0.03 トン/トン 0.03 トン/トン
人権デュー・ディリジェンス
37 アニマルウェルフェア/食育の取り組み
38 環境負荷の全体像
39 気候変動・自然関連課題への対応
Section 3 コーポレートガバナンス
41 社外取締役メッセージ
43 企業統治体制の全体像
47 役員一覧
51 リスクマネジメント
Appendix データ編
53 11年間の連結財務サマリー
55 サステナビリティデータハイライト
56 会社情報/株式情報
成長戦略
サステナビリティ戦略
プリマハムグループ 統合報告書2026
39
気候変動・自然関連課題への対応(TCFD・TNFD提言に基づく情報開示)
プリマハムグループ 統合報告書 2 0 2 6
INDE X
02 トップメッセージ
は重要課題(マテリアリティ)の解決に向けた目標設定
締役会はリスク懸念事象について審議し、当社グルー
気候変動や生物多様性の損失をはじめとする自然資
や活動計画の策定、進捗確認を担うとともに、必要に応
プの環境課題への対応方針や実行計画などを決定・承
本への影響は、世界全体で取り組むべき喫緊の課題で
じて重要課題の見直しを実施しています。2025年度は
認しています。
あり、
プリマハムグループの事業継続や戦略にとっても
3回開催し、
自然関連課題への対応や脱炭素、
アニマル
極めて大きな影響をおよぼす重要課題であると認識し
ウェルフェアなどについて議論を進めました。
基本的な考え方
ています。
プリマハム
(株)は、2022年9月にTCFD提言への賛
また、気候変動や自然関連のリスクは、
当社グループ
の事業や業績に影響をおよぼす全社的な経営リスクと
位置づけています。取締役会で決定した方針は、
サステ
戦略
同を表明し、
さらに2025年4月にはTNFD提言への賛
プリマハムグループの中期経営計画では
「脱炭素・循
同表明と初期的開示を実施しました。気候変動と生物
環型社会の実現に向けた取り組み推進」
を掲げていま
多様性の損失は互いに深く影響し合っており、一方の
す。
サプライチェーン全体における自然資本への影響を
ナビリティ委員会および分科会を通じて具体的な施策
へ展開し、継続的な管理・改善につなげています。
指標と目標
みの対策では不十分です。自然資本への負荷を減らし
より明確化し、調達先である生産者様や地域社会と連
プリマハムグループは、
「温室効果ガス排出量の抑
ネイチャーポジティブ(自然再興)
へ向かうためには、気
携した持続可能な原材料調達、環境配慮型商品の開発
制」
を重要課題に位置づけています。Scope1・2(連結)
候変動対策と生物多様性の保全・回復を一体となって
などをさらに強化してまいります。今後も、
自然と調和し
においては、従来の2030年度目標に加え、
日本政府の
進めることが不可欠です。
このような認識のもと、今後
た事業活動を通じて環境価値と企業価値の双方を高
削減目標に整合する形で、2035年度までに
「2021年度
は、両提言が共通する4つの柱(ガバナンス、戦略、
リス
ク管理、指標と目標)に沿って、気候変動と自然資本を
め、
ステークホルダーの皆様とともに豊かな自然と食の
未来を次世代へ引き継ぐ責任を果たしてまいります。
一体的に捉えた取り組みと情報開示を進めていきます。
リスク管理
ガバナンス
サステナビリティ委員会は、
プリマハムグループを取
プリマハム(株)は、取締役会の任意の諮問機関とし
り巻く気候変動や自然関連に係るリスクや機会につい
てサステナビリティ委員会を設置しています。本委員会
て協議し、取締役会へ報告しています。
これを受けて、取
Section 1 価値創造ストーリー
07 プリマハムが大切にしていること
08 成長戦略のロードマップ
09 私たちのあゆみ
10 ビジネスモデルと強み
12 価値創造プロセス
13 経営資本と成長戦略の関係
Section 2 成長戦略
15 中期経営計画
財務戦略
17 財務担当役員メッセージ
事業戦略
19 本部長メッセージ
21 Highlight 1
加工食品事業の競争力を支える
「挑戦力」
と
「収益力」
23 加工食品事業
25 Highlight 2
食肉事業の新たな競争力を築く
「変革力」
と
「成長力」
27 食肉事業
人材戦略
29 人材強化に向けた目標と取り組み
サステナビリティ戦略
比38%削減(連結ベース)」
とする追加目標の達成を目
31 Sustainability Issues
指しています。2025年度実績においても、再生可能エ
ネルギー由来の電力調達やフロン対策投資などの効果
33 プリマハムグループのサステナビリティ
34 重要課題(マテリアリティ)への取り組み
35 健康で豊かな食生活を創造する/
を継続させ、
さらなる排出量の低減を進めています。
36 サプライチェーン・マネジメントを強化する/
宮城農場から始まる資源循環
地球環境の保全に貢献する
人権デュー・ディリジェンス
WEB
気候変動(TCFD提言に基づく情報開示)
https://www.primaham.co.jp/sustainability/environment/tcfd.html
WEB
生物多様性(TNFD提言に基づく情報開示)
https://www.primaham.co.jp/sustainability/environment/tnfd.html
37 アニマルウェルフェア/食育の取り組み
38 環境負荷の全体像
39 気候変動・自然関連課題への対応
Section 3 コーポレートガバナンス
41 社外取締役メッセージ
43 企業統治体制の全体像
47 役員一覧
51 リスクマネジメント
Appendix データ編
53 11年間の連結財務サマリー
55 サステナビリティデータハイライト
56 会社情報/株式情報
プリマハムグループ 統合報告書2026
Sec tion
40
プリマハムグループ 統合報告書 2 0 2 6
INDE X
3
02 トップメッセージ
Section 1 価値創造ストーリー
07 プリマハムが大切にしていること
08 成長戦略のロードマップ
09 私たちのあゆみ
10 ビジネスモデルと強み
12 価値創造プロセス
13 経営資本と成長戦略の関係
コーポレート
ガバナンス
Section 2 成長戦略
15 中期経営計画
財務戦略
17 財務担当役員メッセージ
事業戦略
19 本部長メッセージ
21 Highlight 1
加工食品事業の競争力を支える
「挑戦力」
と
「収益力」
23 加工食品事業
25 Highlight 2
食肉事業の新たな競争力を築く
「変革力」
と
「成長力」
IN D E X
41
43
社外取締役メッセージ
企業統治体制の全体像
27 食肉事業
人材戦略
29 人材強化に向けた目標と取り組み
社外取締役メッセージ
企業統治体制の全体像
社外取締役3名に、当社グループの現状や課題、今後期待することなど、独立
した立場から見た評価や提言を伺いました。
コーポレートガバナンスの考え方や体制、監督機能の強化に向けた取り組み
のほか、
スキルマトリックスを通じた役員構成の考え方をお伝えします。
サステナビリティ戦略
31 Sustainability Issues
宮城農場から始まる資源循環
33 プリマハムグループのサステナビリティ
34 重要課題(マテリアリティ)への取り組み
35 健康で豊かな食生活を創造する/
地球環境の保全に貢献する
36 サプライチェーン・マネジメントを強化する/
人権デュー・ディリジェンス
47
役員一覧
51
リスクマネジメント
役員一覧
リスクマネジメント
当社の持続的な成長を支える取締役・監査役の経歴や専門性の紹介をはじ
め、実効性評価などについて報告します。
事業活動に影響をおよぼす主要なリスクとその対応策のほか、
リスク管理体
制や事業継続(BCP)への取り組みをお伝えします。
37 アニマルウェルフェア/食育の取り組み
38 環境負荷の全体像
39 気候変動・自然関連課題への対応
Section 3 コーポレートガバナンス
41 社外取締役メッセージ
43 企業統治体制の全体像
47 役員一覧
51 リスクマネジメント
Appendix データ編
53 11年間の連結財務サマリー
55 サステナビリティデータハイライト
56 会社情報/株式情報
コーポレートガバナンス
プリマハムグループ 統合報告書2026
41
プリマハムグループ 統合報告書 2 0 2 6
INDE X
社外取締役メッセージ
02 トップメッセージ
Section 1 価値創造ストーリー
当社は、透明性・客観性の高い
コーポレートガバナンスを実現するため、
さまざまな知識・経験を有する独立社外取締役を
選任しています。
当社グループの現状に対する評価や課題認識、
今後期待することなどについて、社外取締役3名に
語っていただきました。
社外取締役
社外取締役
社外取締役
井出雄三
辻田淑乃
西本強
1977年に(株)ワコール(現(株)ワコールHD)
外資系証券会社での勤務を経て、日本たばこ
日比谷パーク法律事務所パートナー。おもに
産業(株)で経営企画部部長、IR広報部長など
コーポレートガバナンス、M& A、システム開
を歴任。2020年3月に(株)ルリエを設立し、着
発、企業がかかわる紛争処理などを取り扱う。
物関連ビジネスで起業。2022年6月に当社の
複数の上場企業で社外役員を務めるほか、公
社外取締役に就任。
益財団法人日本サッカー協会常務理事を兼
入社。20 06年4月から(株)ワコール(事業会
社)の執行役員を務めた後、2014年4月に取
締役副社長執行役員、2014 年6月に(株)ワ
コールHDの常務取締役などを歴任。2020年
任。2026年6月に当社の社外取締役に就任。
6月に当社の社外取締役に就任。
07 プリマハムが大切にしていること
08 成長戦略のロードマップ
09 私たちのあゆみ
10 ビジネスモデルと強み
12 価値創造プロセス
13 経営資本と成長戦略の関係
Section 2 成長戦略
15 中期経営計画
財務戦略
17 財務担当役員メッセージ
事業戦略
19 本部長メッセージ
21 Highlight 1
加工食品事業の競争力を支える
「挑戦力」
と
「収益力」
23 加工食品事業
25 Highlight 2
食肉事業の新たな競争力を築く
「変革力」
と
「成長力」
27 食肉事業
人材戦略
「従業員が誇れるものづくり」こそがメーカーの本質。それを経営に問い続ける。
社外取締役に就任して以来、
業種は違えど同じくメーカーで経験
いて、
人材育成の観点からも問い直してほしいと伝えています。
を積み重ねてきた立場から、取締役会などでは、消費者の「お客様
こうした課題意識に応えるように、2026年度から経営を担う阿
目線」と、現場で働く「従業員目線」を大事にしてほしいと折に触れ
部社長が現場に深く入り込み、
多面的な視点から経営を丁寧に見直
て提言してきました。
している姿勢を、私は高く評価しています。さらに、経営のさらなる
2025年度では、さらに根本へ立ち返り、
「自社の商品を、従業員
高度化を進めながら、プロパー人材の育成・登用も積極的に進めて
自身が誇りを持って手に取っているか」
という点をより注視するよう
いただきたいと思います。
海外戦略においても強みである国内の安
社外取締役
になりました。
価値観が多様化し、
さまざまな情報があふれるなか、
全・安心な生産基盤を軸に、輸入と現地生産基盤の強化のバラン
井出雄三
現場の従業員自身が迷うことなく、自信を持ってものづくりに携わ
スが取れた推進に期待しています。
り、自社商品に揺るぎない信頼を寄せているのか、そこに一貫性が
今後も社外取締役として、
メーカーの本質を経営に問い続け、
“も
あるのか、メーカーの根幹である本質的なものづくりのあり方につ
のづくりの原点”を思い起こさせる存在でありたいと考えています。
29 人材強化に向けた目標と取り組み
サステナビリティ戦略
31 Sustainability Issues
宮城農場から始まる資源循環
33 プリマハムグループのサステナビリティ
34 重要課題(マテリアリティ)への取り組み
35 健康で豊かな食生活を創造する/
地球環境の保全に貢献する
36 サプライチェーン・マネジメントを強化する/
人権デュー・ディリジェンス
37 アニマルウェルフェア/食育の取り組み
38 環境負荷の全体像
39 気候変動・自然関連課題への対応
Section 3 コーポレートガバナンス
41 社外取締役メッセージ
43 企業統治体制の全体像
47 役員一覧
51 リスクマネジメント
Appendix データ編
53 11年間の連結財務サマリー
55 サステナビリティデータハイライト
56 会社情報/株式情報
コーポレートガバナンス
プリマハムグループ 統合報告書2026
42
プリマハムグループ 統合報告書 2 0 2 6
INDE X
社外取締役メッセージ
02 トップメッセージ
Section 1 価値創造ストーリー
経営体制の刷新は“変革”の好機。会社の挑戦を“攻めと守りの両面”から支えたい。
社外取締役に就任した当初と比較して、
取締役会への上程議案の
くださっていることを実感しました。世界に誇るジャパンクオリティ
資料や説明が、
リスクなどを多面的に吟味された内容へと進化してお
には大きなポテンシャルがあります。ターゲットとする東南アジア
り、取締役会の運営体制が成熟してきていると実感しています。ま
市場で当社ならではのものづくりの強みを発揮し、
ぜひ中長期的な
た、
取締役会における阿部社長の発言からも
「攻め」
の姿勢が強く感
成長につなげていただきたいと考えています。
07 プリマハムが大切にしていること
08 成長戦略のロードマップ
09 私たちのあゆみ
10 ビジネスモデルと強み
12 価値創造プロセス
13 経営資本と成長戦略の関係
Section 2 成長戦略
15 中期経営計画
じられます。
経営体制の刷新を好機に、
従業員の皆さんにも、
新しい
私自身も、プリマハムの変革の機運の高まりを受け、社外取締役
挑戦に向けてぜひ自ら声を上げていただきたいと期待しています。
として監督機能を発揮しつつ、挑戦すべきと感じたところを積極的
成長戦略については、主力の加工食品事業は競争が激化するな
に後押しする、攻めの側面にも力を入れたいと考えています。新規
社外取締役
か、さらなる差別化・プレミアム化が求められていくものと考えてい
事業の確立や海外戦略に注力をする新たなフェーズに入るなか、
辻田淑乃
ます。また、海外に目を向けると、2025年度にタイの生産拠点を視
投資家からも、その役割を期待されていると捉えており、“守りと攻
察した際、
現地の消費者の方々が
「Made in Japan」
を高く評価して
めの両面”から、
会社・経営の挑戦をサポートしてまいります。
財務戦略
17 財務担当役員メッセージ
事業戦略
19 本部長メッセージ
21 Highlight 1
加工食品事業の競争力を支える
「挑戦力」
と
「収益力」
23 加工食品事業
25 Highlight 2
食肉事業の新たな競争力を築く
「変革力」
と
「成長力」
27 食肉事業
人材戦略
29 人材強化に向けた目標と取り組み
サステナビリティ戦略
果断なリスクテイクを後押しし、会社の“成長ストーリー”の実現に貢献する。
31 Sustainability Issues
2026年6月から、プリマハムの社外取締役を拝命いたしました。
当社においても社外取締役には独立性・専門性を発揮してモニタ
これまで弁護士として歩んできた四半世紀のキャリアにおいては、
リング機能を強化していくことが求められています。こうしたなか
33 プリマハムグループのサステナビリティ
34 重要課題(マテリアリティ)への取り組み
35 健康で豊かな食生活を創造する/
宮城農場から始まる資源循環
地球環境の保全に貢献する
コーポレートガバナンス、M&A、システム開発、企業がかかわる紛
で、今取締役会に期待されているのは、リスク管理や不祥事防止と
36 サプライチェーン・マネジメントを強化する/
争処理などをおもな業務の柱としてきました。そのほか、スポーツ
いった守りのガバナンスにとどまりません。会社の“成長ストー
やエンターテインメントなどの法分野にも取り組んでまいりまし
リー”、すなわち勝ち筋がどこにあるのかを十分に議論し、社内外
37 アニマルウェルフェア/食育の取り組み
38 環境負荷の全体像
39 気候変動・自然関連課題への対応
た。当社においても、M&Aも視野に入れた海外戦略やガバナンス
に示していくことが必要であると考えています。長い歴史のなかで
強化を進めていることから、これまで蓄積してきた知見をいかして
日本の食文化に貢献してきたプリマハムは、今まさに次のフェーズ
社外取締役
いければと考えています。
へと進もうとしています。さまざまな経営課題と向き合いながら、
西本強
今般のコーポレートガバナンス・コードの改訂においては、独立
社外取締役の機能強化がひとつのポイントとしてあげられており、
適正な形での迅速果断なリスクテイクを後押しし、企業価値の向
上に寄与していけるよう尽力してまいります。
人権デュー・ディリジェンス
Section 3 コーポレートガバナンス
41 社外取締役メッセージ
43 企業統治体制の全体像
47 役員一覧
51 リスクマネジメント
Appendix データ編
53 11年間の連結財務サマリー
55 サステナビリティデータハイライト
56 会社情報/株式情報
コーポレートガバナンス
43
プリマハムグループ 統合報告書2026
プリマハムグループ 統合報告書 2 0 2 6
INDE X
企業統治体制の全体像
02 トップメッセージ
基本的な考え方
当社は、変化に対応した意思決定を適切かつ機動的に実
Section 1 価値創造ストーリー
コーポレートガバナンス体制
行し、監督機能の実効性確保と適切な情報開示に取り組
07 プリマハムが大切にしていること
08 成長戦略のロードマップ
09 私たちのあゆみ
10 ビジネスモデルと強み
12 価値創造プロセス
13 経営資本と成長戦略の関係
株主総会
み、透明性の高い誠実な経営を実践することで、コーポ
選任・解任
レートガバナンスの強化、充実に努めています。また、コー
ポレートガバナンスのあり方の検証と必要な施策を実行
選任・解任
連携
会計監査人
し、プリマハムグループの持続的な成長と中長期の企業価
選任・解任
諮問
監督
監査役会
P.44
答申
値向上を図っていきます。
監督
なお、
「コーポレートガバナンス基本方針」
は当社Webサ
会計監査
取締役会
監督
サステナビリティ委員会
P.33
答申
コーポレートガバナンス基本方針
連携
https://www.primaham.co.jp/ir/library/attaches/pdf/20211109̲2.pdf
連携
Section 2 成長戦略
15 中期経営計画
財務戦略
諮問
イトに公開しています。
WEB
経営諮問委員会
17 財務担当役員メッセージ
事業戦略
19 本部長メッセージ
21 Highlight 1
連携
選定・解職・監督
選任・解任
加工食品事業の競争力を支える
「挑戦力」
と
「収益力」
23 加工食品事業
25 Highlight 2
食肉事業の新たな競争力を築く
「変革力」
と
「成長力」
コーポレートガバナンス体制
報告
監査部
代表取締役社長
社長執行役員
指示
取締役会
性・透明性を確保し、法令上および経営に関する重要事項
経営会議
業務監査
を決定するとともに、職務の執行状況を監督しています。
● 品質安全会議
● 環境委員会
● 加工原料会議
● 人事委員会
● コンプライアンス委員会
● 情報セキュリティ委員会
諮問
答申
取締役会は、経営全般の監督機能を担い、経営の公正
各種委員会
執行指示
上程
独立社外取締役は3名で、当社「コーポレートガバナンス基
人権デュー・ディリジェンス
2025年度取締役会のおもな議題
経営戦略
れた環境に応じ選任していきます。
とサステナビリティ委員会を設置しています
(経営諮問委員
会 P.44 、サステナビリティ委員会
P.33 )
。
宮城農場から始まる資源循環
33 プリマハムグループのサステナビリティ
34 重要課題(マテリアリティ)への取り組み
35 健康で豊かな食生活を創造する/
37 アニマルウェルフェア/食育の取り組み
38 環境負荷の全体像
39 気候変動・自然関連課題への対応
ています P.47 。
また、取締役会の任意の諮問機関として経営諮問委員会
サステナビリティ戦略
31 Sustainability Issues
36 サプライチェーン・マネジメントを強化する/
多様性および専門性の確保にも配慮したメンバーで構成し
今後のメンバー構成については、社会情勢や当社の置か
人材戦略
29 人材強化に向けた目標と取り組み
地球環境の保全に貢献する
各事業部門
本方針」
の指名方針に沿って企業経営経験者や弁護士など
27 食肉事業
●
中期経営計画
●
サステナビリティ関連
●
職務執行状況報告
(TCFD・TNFD提言に基づく情報開示、人権デュー・ディリジェンスの実施)
●
重要課題(マテリアリティ)
への対応状況
●
環境団体CDPによるESG評価結果
ガバナンス
●
役員報酬
●
マルチステークホルダー方針
●
上場政策保有株式の保有意義の検証
●
コーポレートガバナンス・コード対応状況の見直し
●
執行役員業績評価
●
●
Section 3 コーポレートガバナンス
業績連動型株式報酬制度
取締役会実効性評価
●
内部統制システム
41 社外取締役メッセージ
43 企業統治体制の全体像
47 役員一覧
51 リスクマネジメント
Appendix データ編
53 11年間の連結財務サマリー
55 サステナビリティデータハイライト
56 会社情報/株式情報
コーポレートガバナンス
プリマハムグループ 統合報告書2026
経営会議および各種委員会
経営諮問委員会
44
独立した立場から厳正に監査しています。
また、必要に応じ
プリマハムグループ 統合報告書 2 0 2 6
INDE X
当社は、人事、報酬等に関する事項の審議において独立
取締役会による適切かつ迅速な意思決定がなされるよ
性・客観性を確保するために、代表取締役社長と独立社外
う、経営会議と各種委員会を設置しています。経営会議の
取締役3名をメンバーとし、指名委員会、報酬委員会に相当
メンバーは、取締役、執行役員などで構成しています。経営
Section 1 価値創造ストーリー
に関する重要事項は経営会議や各種委員会において十分
07 プリマハムが大切にしていること
08 成長戦略のロードマップ
09 私たちのあゆみ
10 ビジネスモデルと強み
12 価値創造プロセス
13 経営資本と成長戦略の関係
する経営諮問委員会を設置しています。
に審議し、
かつ重要な業務執行状況は経営会議において報
おもな審議対象事項
告を受けています。
● 人事に関する事項
代表取締役社長が提案した取締役・監査役、
および執行役員の
選任・解任に関する審議
● 報酬に関する事項
株主総会にて決議された年間総額の範囲内で、取締役の具体
的な個別の金額を審議
● 後継者計画に関する事項
● コーポレートガバナンスに関する重要事項
● 支配株主の利益相反に関する事項
てグループ会社へ報告を求めるほか、内部監査を担う監査
部や会計監査人とも連携を深めています。
役員トレーニング、
サポート体制
取締役・執行役員は、
外部機関の研修などを活用し、
より高
いリーダーシップの発揮と戦略的視野の養成を図っています。
監査役は、各種セミナーや他業種との意見交換会に積極
監査役会
的に参加することで、監査スキルの向上に努めています。
当社は、取締役会および業務執行から独立した監査役会
社外取締役には、各部門から事業・業務内容・課題などに
を設置しています。
監査役会は、
取締役会および職務の執行
ついて随時説明するほか、取締役会に先立った審議事項の
を監督することで、
経営目標達成に向けた透明性の高い経営
事前通知や重要な上程案件の事前説明会を行っています。
を確立します。
監査役は4名で、
うち2名は社外監査役で構成
また、社外取締役と社外監査役による、専門的な知見に基
され、取締役会、経営会議、主要な各種委員会に出席してお
づいた意見交換会を実施しています。
2023年度
2024年度
2025年度
第1回
第2回
第3回
第4回
第5回
第6回
第7回
第8回
第9回
第1回
第2回
第3回
第4回
第5回
第6回
第1回
第2回
第3回
第4回
第5回
第6回
第7回
Section 2 成長戦略
15 中期経営計画
財務戦略
17 財務担当役員メッセージ
事業戦略
19 本部長メッセージ
21 Highlight 1
加工食品事業の競争力を支える
「挑戦力」
と
「収益力」
23 加工食品事業
25 Highlight 2
り、
取締役、
執行役員からの定期的かつ随時の報告を受けて、
食肉事業の新たな競争力を築く
「変革力」
と
「成長力」
経営諮問委員会のおもな議題
開催回
02 トップメッセージ
議題
2022年度配当および配当方針
2022年度執行役員評価
役員株式給付規定一部改定/関連当事者との取引状況
2023年度役員報酬額決定/執行役員異動
コーポレートガバナンス・コード対応
執行役員異動
コーポレートガバナンス・コード対応
執行役員異動
取締役・執行役員選任/執行役員異動
2023年度執行役員評価
関連当事者との取引状況
2024年度役員報酬額決定
コーポレートガバナンス・コード対応
執行役員異動
取締役・監査役・執行役員選任/執行役員異動
2024年度執行役員評価
関連当事者との取引状況
2025年度役員報酬額決定
コーポレートガバナンス・コード対応
執行役員異動
執行役員異動
取締役・監査役・執行役員選任/取締役委嘱業務変更/執行役員異動
27 食肉事業
社外役員による現場視察
当社事業への理解を深めていただくため、当社グ
ループ会社施設の視察および現場従業員との対話
の機会を設けています。2025年度は3ケ所の視察を
行いました。
人材戦略
29 人材強化に向けた目標と取り組み
サステナビリティ戦略
31 Sustainability Issues
宮城農場から始まる資源循環
33 プリマハムグループのサステナビリティ
34 重要課題(マテリアリティ)への取り組み
35 健康で豊かな食生活を創造する/
地球環境の保全に貢献する
36 サプライチェーン・マネジメントを強化する/
人権デュー・ディリジェンス
37 アニマルウェルフェア/食育の取り組み
38 環境負荷の全体像
39 気候変動・自然関連課題への対応
Section 3 コーポレートガバナンス
プライムデリカ
(株)龍ケ崎工場視察時の集合写真
左から坂井監査役、辻田取締役、井出取締役、下澤監査役、
プライムデリ
カ
(株)
の井上常務取締役
41 社外取締役メッセージ
43 企業統治体制の全体像
47 役員一覧
51 リスクマネジメント
Appendix データ編
53 11年間の連結財務サマリー
55 サステナビリティデータハイライト
56 会社情報/株式情報
コーポレートガバナンス
プリマハムグループ 統合報告書2026
45
INDE X
ガバナンス強化の変遷
当社は「持続的な成長と中長期的な企業価値の向上」
を
客観性の向上です。
取締役会には、
企業経営経験者や弁護士
経営の公正性を着実に高めています。
また、毎年実施してい
目指し、激変する事業環境に機動的に対応する
「攻めの経
など多様な専門知見を持つ独立社外取締役を選任し、
多角的
る取締役会実効性評価を通じて課題を再認識し、取締役会
営」
と、透明性の高い誠実な「守りの経営」を両立すべく、
な視点から議論を深める体制を構築しました。
さらに、
役員人
の実効性を継続的に高めています。
コーポレートガバナンスを継続的に進化させてきました。
事・報酬の透明性を担保する独立した経営諮問委員会や、
非
これまで強化してきた最大の柱は、監督機能の実効性と
財務資本の価値向上を担うサステナビリティ委員会を設置し、
ガバナンス強化の変遷
取り組み
2012
●
社外取締役の選任
2015
●
コーポレートガバナンス基本方針の制定
2016
●
社外取締役の増員
2018
●
●
●
●
2019
2020
●
今後も投資家の皆様との建設的な対話を深めながら、持
続的な企業価値の向上に取り組んでいきます。
社外取締役/社外監査役
(女性)
年度
2017
●
社外役員の独立性基準の制定
取締役※1
●
社外監査役の増員
目的取締役会の透明性向上
取締役会実効性評価を開始目的取締役会の実効性向上
目的人事、報酬における独立性・客観性の確保
経営諮問委員会の設置
業績連動型株式報酬制度(BBT)
の導入
目的中長期的な業績向上と企業価値向上に貢献するという取締役の意識高揚
社外取締役比率
17%
5
1
社外取締役/社外監査役
(男性)
2
2
監査役※1
2
7
社外監査役比率
66%
(2名/3名)
1
2
3
2022
2023
2024
●
●
●
2025
●
2026
●
社外取締役の増員
●
スキルマトリックスの開示
社外取締役の比率向上(過半数) ● プロパー社員からの監査役選任
スキルマトリックスのスキル見直し
社外取締役の比率維持(過半数)
代表取締役の異動
※1 取締役数および監査役数は株主総会で選任された各年度の人数
3
3
事業戦略
加工食品事業の競争力を支える
「挑戦力」
と
「収益力」
100
%
(3名/3名)
3
22%
人材戦略
29 人材強化に向けた目標と取り組み
2
66%
(2名/3名)
1
50%
3
1
75%
(3名/4名)
2
(3名/5名)
3
2
(3名/5名)
60%
60%
50%
宮城農場から始まる資源循環
地球環境の保全に貢献する
36 サプライチェーン・マネジメントを強化する/
人権デュー・ディリジェンス
37 アニマルウェルフェア/食育の取り組み
38 環境負荷の全体像
39 気候変動・自然関連課題への対応
60%
3
サステナビリティ戦略
31 Sustainability Issues
33 プリマハムグループのサステナビリティ
34 重要課題(マテリアリティ)への取り組み
35 健康で豊かな食生活を創造する/
(3名/6名)
(3名/5名)
食肉事業の新たな競争力を築く
「変革力」
と
「成長力」
27 食肉事業
(2名/9名)
2
3
財務戦略
17 財務担当役員メッセージ
25%
3
3
Section 2 成長戦略
15 中期経営計画
23 加工食品事業
25 Highlight 2
40%
(2名/5名)
コーポレートガバナンス基本方針の改定
目的経営陣幹部の選解任規定および最高経営責任者の後継者計画の制定による、役員指名プロセスの透明性向上
● 社外監査役の増員
Section 1 価値創造ストーリー
07 プリマハムが大切にしていること
08 成長戦略のロードマップ
09 私たちのあゆみ
10 ビジネスモデルと強み
12 価値創造プロセス
13 経営資本と成長戦略の関係
19 本部長メッセージ
21 Highlight 1
取締役を減員
目的経営の監督機能と業務執行機能の分離明確化による、
経営の意思決定の迅速化および機動的な業務執行の実現
社外取締役の比率を高めることによる、
取締役会の監督機能強化とコーポレートガバナンスレベルの向上
コーポレートガバナンス基本方針の改定目的 ステークホルダーの利益保護など
02 トップメッセージ
(1名/6名)
(2名/8名)
6
社内取締役/社内監査役
●
2021
プリマハムグループ 統合報告書 2 0 2 6
2
2
50%
(2名/4名)
Section 3 コーポレートガバナンス
41 社外取締役メッセージ
43 企業統治体制の全体像
47 役員一覧
51 リスクマネジメント
(3名/6名)
Appendix データ編
53 11年間の連結財務サマリー
55 サステナビリティデータハイライト
56 会社情報/株式情報
コーポレートガバナンス
プリマハムグループ 統合報告書2026
46
プリマハムグループ 統合報告書 2 0 2 6
INDE X
取締役・監査役のスキルマトリックス
当社は、中期経営計画の確実な遂行と中長期的な企業
価値の向上を実現するため、取締役・監査役が備えるべき
取締役会では特定の視点に偏らない、多角的で質の高い議
を継続的に見直すことが重要であると認識しています。
こう
論が展開されています。
した客観的な課題認識を踏まえ、指名方針に基づき、最適
知見を特定しています。各スキル項目には、
中期経営計画の
一方で、
現状の構成を定期的に見直し、
常に次なる成長を
実現や持続可能な経営基盤の強化に向けた明確な意図が
見据えた評価を続けています。
今後、
事業モデル変革を牽引し
あり、各々が持つ多様な専門性が相互に補完し合うことで、
ていくためには、
市場環境の変化に応じて求められるスキル
な役員構成に向けてガバナンス体制を継続的に強化してい
きます。
02 トップメッセージ
Section 1 価値創造ストーリー
07 プリマハムが大切にしていること
08 成長戦略のロードマップ
09 私たちのあゆみ
10 ビジネスモデルと強み
12 価値創造プロセス
13 経営資本と成長戦略の関係
Section 2 成長戦略
15 中期経営計画
取締役・監査役スキルマトリックス
多様性
年齢
取締役会長
千葉尚登
代表取締役社長
阿部邦明
取締役
取締役
鯛健一
社外取締役(非常勤)
井出雄三
社外取締役(非常勤)
辻田淑乃
社外取締役(非常勤)
西本強
監査役
坂井尚文
監査役
社外監査役
下澤秀樹
監査役(非常勤)
上垣内義博
社外監査役(非常勤)
須永明美
67
57
59
71
財務戦略
2026年6月25日現在
スキル
性別
男
男
男
男
61
女
52
男
62
男
経営
●
●
●
●
●
グローバル
財務・経理
男
●
64
女
●
●
●
●
●
●
●
●
●
●
●
●
53
営業・
マーケ
ティング
●
●
●
男
内部統制・
法務・
コンプ
ライアンス
●
●
●
63
サステナ
ビリティ・
人的資本
●
●
●
(参考)
2025年度実績
●
●
●
●
●
●
●
各スキルの選定理由
●
取締役会
監査役会
出席
回数
出席率
(%)
出席
回数
出席率
(%)
15/15
100
‑
‑
15/15
11/11
15/15
100
100
100
15/16
‑
‑
93.8
‑
‑
経営
経営に関する重要事項を決定し、職務の執行
状況を監督するにあたり、経営の見識・経験
が必要であるため
グローバル
中期経営計画で掲げる
「成長投資とグローバ
ル展開」を実現するにあたり、グローバルの
見識・経験が必要であるため
財務・経理
持続可能な経営基盤の強化を実現するにあ
たり、財務・経理の見識・経験が必要であるた
め
15/15
100
‑
‑
サステナビリティ・人的資本
‑
‑
‑
‑
サステナビリティを重視した経営の推進にあ
たり、サステナビリティ・人的資本関連の見
識・経験が必要であるため
15/15
100
16/16
100
内部統制・法務・コンプライアンス
事業活動に伴うさまざまなリスクに適切に対
応し、健全な事業運営の監督を行うための専
門的な見識・経験が必要であるため
15/15
100
16/16
100
‑
‑
‑
‑
15/15
100
16/16
100
※ 阿部邦明の取締役会出席回数は当社監査役としての出席回数です
営業・マーケティング
売上と利益の規模と質を高めるにあたり、営
業・マーケティングの見識・経験が必要である
ため
17 財務担当役員メッセージ
事業戦略
19 本部長メッセージ
21 Highlight 1
加工食品事業の競争力を支える
「挑戦力」
と
「収益力」
23 加工食品事業
25 Highlight 2
食肉事業の新たな競争力を築く
「変革力」
と
「成長力」
27 食肉事業
人材戦略
29 人材強化に向けた目標と取り組み
サステナビリティ戦略
31 Sustainability Issues
宮城農場から始まる資源循環
33 プリマハムグループのサステナビリティ
34 重要課題(マテリアリティ)への取り組み
35 健康で豊かな食生活を創造する/
地球環境の保全に貢献する
36 サプライチェーン・マネジメントを強化する/
人権デュー・ディリジェンス
37 アニマルウェルフェア/食育の取り組み
38 環境負荷の全体像
39 気候変動・自然関連課題への対応
Section 3 コーポレートガバナンス
41 社外取締役メッセージ
43 企業統治体制の全体像
47 役員一覧
51 リスクマネジメント
Appendix データ編
53 11年間の連結財務サマリー
55 サステナビリティデータハイライト
56 会社情報/株式情報
コーポレートガバナンス
47
プリマハムグループ 統合報告書2026
プリマハムグループ 統合報告書 2 0 2 6
INDE X
役員一覧
取締役
02 トップメッセージ
Section 1 価値創造ストーリー
07 プリマハムが大切にしていること
08 成長戦略のロードマップ
09 私たちのあゆみ
10 ビジネスモデルと強み
12 価値創造プロセス
13 経営資本と成長戦略の関係
千葉尚登
阿部邦明
取締役会長
1983年4月
2014年4月
2015年4月
2016年4月
2018年6月
2019年6月
2026年4月
2026年6月
代表取締役社長
伊藤忠商事(株)
入社
同社執行役員食品流通
部門長
Dole Asia Holdings
Pte.Ltd.出向
(EXECUTIVE VICE
PRESIDENT,
DIRECTOR)
当社常務執行役員
加工食品事業本部分掌、
食肉事業本部分掌、
監査部担当
当社代表取締役社長
当社代表取締役社長
社長執行役員
当社代表取締役会長
当社取締役会長(現)
1991年4月
2011年4月
2016年4月
2019年4月
2022年4月
2023年4月
2023年6月
2024年4月
2026年4月
2026年6月
伊藤忠商事(株)
入社
同社食品流通部門
食品流通戦略室長
伊藤忠商事(株)食品開発
部長
同社食料経営企画部長
同社執行役員食料経営企
画部長
同社執行役員生鮮食品部
門長
当社監査役
同社上席執行理事
生鮮食品部門長
当社社長執行役員
(現)
当社代表取締役社長
(現)
選任理由
総合商社において生鮮食品部門長を
選任理由
当社の業績の向上に功績を残すとと
もに、経営者として豊富な経験と実
績を有しています。
また、取締役会議
長として、取締役会を適切に運営して
きました。
当社グループのさらなる企
業価値の向上を担う取締役として適
任と考えています。
歴任するなど、畜産をはじめとする生
鮮食品全般に関する豊富な経験と高
い専門知識を有しております。また、
当社監査役として経営を監督する立
場から、当社グループの経営課題や
事業上の重要論点について十分な見
識を有しており、
さらなる企業価値の
向上を担う取締役として適任と考え
当社株式保有数 51,090株
ています。
(うち、所有する当社株式の数
当社株式保有数 0株
33,461株
井出雄三
鯛健一
取締役
取締役
非常勤
1989年4月伊藤忠商事(株)入社
2014年4月伊藤忠商事(株)畜産部長
2019年4月同社生鮮食品部門長
2019年6月当社取締役
2021年4月伊藤忠商事(株)執行役員
2023年4月当社常務執行役員食肉
事業本部食肉営業事業部長
2024年4月当社常務執行役員営業本部
東日本支社長
2024年8月当社常務執行役員総合企画
本部長兼総合企画室長兼
PRIMA Next Project Manager
2025年4月当社常務執行役員総合企画
本部長兼総合企画部長兼
PRIMA Next Project Manager
2025年6月当社取締役常務執行役員総合
企画本部長兼総合企画部長兼
PRIMA Next Project Manager
2026年4月当社取締役専務執行役員総合企画
本部長兼PRIMA Next Project
Manager
(現)
選任理由
総合商社において海外駐在の経験や、
生鮮食品部門長を歴任するなど、
畜産
をはじめとする生鮮食品全般に関す
る高い専門的知見を有し、
それらをい
かし、
当社において総合企画を担当し
ています。その経験と見識が当社グ
ループのさらなる企業価値向上を担
う取締役として適任と考えています。
交付予定株式の数
当社株式保有数 3,278株
17,629株 )
(うち、
所有する当社株式の数 1,390株
業績連動型株式報酬制度に基づく
交付予定株式の数
独立
1977年4月 (株)ワコール(現(株)
ワコールHD)入社
2006年4月 (株)
ワコール
(事業会社)
執行役員
2008年4月同社取締役
専務執行役員
2014年4月同社取締役
副社長執行役員
2014年6月 (株)ワコールHD常務
取締役
(株)
社外取締役
(現)
2020年5月 コスモ
2020年6月当社取締役(現)
選任理由
グローバルな大手製造業の企業経営
を担い、豊富な経験と海外事業展開
や経営戦略に関する深い見識を有し
ています。
当社の経営戦略を推進して
いくうえで、独立した立場から監視、
支援および適切な助言を期待できる
えています。
当社株式保有数 2,612株
非常勤
1987年3月
1989年1月
1999年6月
2001年2月
2002年3月
2006年6月
2014年9月
2016年4月
2020年3月
2020年4月
2022年6月
2022年9月
2026年6月
独立
15 中期経営計画
取締役
社外
スイス銀証券会社入社
ソロモン・ブラザーズ・
アジア証券会社入社
チェース・マンハッタン
銀行 バイス・プレジデント
JPモルガン証券会社
バイス・プレジデント
日本たばこ産業(株)入社
同社経営企画部部長
同社コンプライアンス
統括室長
同社IR広報部長
(株)
ルリエ代表取締役
(現)
ユキグニファクトリー
(株)
社外取締役(現)
当社取締役(現)
ユカイ工学
(株)
取締役
(現)
㈱マツキヨココカラ&カン
パニー社外取締役(現)
選任理由
国内外企業におけるグローバルで豊
富な経験と、経営および多様性に関
する深い見識、財務・経理に関する高
度な専門知識を有しています。当社
の経営戦略を推進していくうえで、独
立した立場から監視、支援および適
切な助言を期待できることから、社
外取締役として適任と考えています。
当社株式保有数 1,938株
Section 2 成長戦略
西本強
取締役
社外
ことから、社外取締役として適任と考
業績連動型株式報酬制度に基づく
※1
辻田淑乃
非常勤
独立
社外
2000年4月西村総合法律事務所
2002年12月日比谷パーク法律事務所
2006年 5月米国コロンビア大学
ロースクール修士課程
(LL.M.)修了
2006年 9月 ヒューズ・ハバード・
アンド・リード法律事務所
(ニューヨーク)
にて客員
弁護士
2007年2月 ニューヨーク州弁護士登録
2007年4月日比谷パーク法律事務所
復帰(現)
エニグモ社外監査役
2011年1月 (株)
2018年3月公益財団法人日本サッカー
協会監事
ブロードリーフ社外
2018年3月 (株)
監査役(現)
2020年6月 (株)島津製作所社外監
査役(現)
エニグモ社外取締役
2022年4月 (株)
(監査等委員)
2024年3月公益財団法人日本サッカー
協会理事
2026年3月公益財団法人日本サッカー
協会常務理事(現)
2026年6月当社取締役(現)
選任理由
国内外において弁護士として豊富な
経験と高度な専門知識を有しており、
独立した立場から当社経営の監視・監
督を期待できることから社外取締役と
して適任と考えています。
当社株式保有数 0株
1,888株 )
※1
※1 業績連動型株式報酬制度に基づく交付予定株式の数には、
2026年3月31日時点における業績連動型株式報酬制度における付与済みの確定したポイント数に相当する株式の数
(退任時に金銭報酬として支給する部分に相当する株式の数を含みます)
を記載しています
なお、
2026年6月25日開催の第79回定時株主総会において承認をいただいたとおり、
当社は業績連動型株式報酬制度を改定していますが、
上記株式の数は当該改定前の制度に基づく当該改定前の時点のものとなります
財務戦略
17 財務担当役員メッセージ
事業戦略
19 本部長メッセージ
21 Highlight 1
加工食品事業の競争力を支える
「挑戦力」
と
「収益力」
23 加工食品事業
25 Highlight 2
食肉事業の新たな競争力を築く
「変革力」
と
「成長力」
27 食肉事業
人材戦略
29 人材強化に向けた目標と取り組み
サステナビリティ戦略
31 Sustainability Issues
宮城農場から始まる資源循環
33 プリマハムグループのサステナビリティ
34 重要課題(マテリアリティ)への取り組み
35 健康で豊かな食生活を創造する/
地球環境の保全に貢献する
36 サプライチェーン・マネジメントを強化する/
人権デュー・ディリジェンス
37 アニマルウェルフェア/食育の取り組み
38 環境負荷の全体像
39 気候変動・自然関連課題への対応
Section 3 コーポレートガバナンス
41 社外取締役メッセージ
43 企業統治体制の全体像
47 役員一覧
51 リスクマネジメント
Appendix データ編
53 11年間の連結財務サマリー
55 サステナビリティデータハイライト
56 会社情報/株式情報
コーポレートガバナンス
プリマハムグループ 統合報告書2026
48
プリマハムグループ 統合報告書 2 0 2 6
INDE X
監査役
02 トップメッセージ
Section 1 価値創造ストーリー
執行役員
07 プリマハムが大切にしていること
08 成長戦略のロードマップ
09 私たちのあゆみ
10 ビジネスモデルと強み
12 価値創造プロセス
13 経営資本と成長戦略の関係
社長執行役員
阿部邦明
下澤秀樹
坂井尚文
常勤監査役
常勤監査役
1987年9月
2014年4月
2019年4月
2023年4月
2023年6月
当社入社
当社営業本部営業統轄
部長
当社食肉事業本部
食肉統轄部長
当社総合企画本部
総合企画室長付
当社常勤監査役
(現)
独立
上垣内義博
監査役
非常勤
社外
1986年4月
三井信託銀行(株)
(現三井住友信託銀行
(株))入社
2008年7月中央三井信託銀行(株)
高松支店長
2009年11月同社本店営業五部長
2011年2月同社融資企画部長
2019年6月当社常勤監査役(現)
1996年4月
2017年4月
2020年4月
2022年4月
2023年4月
2026年4月
選任理由
選任理由
業界における豊富な経験と専門知識
金融機関における豊富な経験と高度
を有し、
当社ビジネスに長く従事して
な専門知識を有しているため、社外
おり、内部統制を広く経験しているこ
監査役としての任に相応しい人物と
とから、監査役としての任に相応しい
判断しています。
人物と判断しています。
当社株式保有数 3,245株
当社株式保有数 1,694株
須永明美
2026年6月
伊藤忠商事(株)入社
同社食料部門食糧戦略
室長
同社食料・穀物部長代行
同社食料経営企画部長
代行
同社食料経営企画部長
兼CP・CITIC戦略室
同社執行役員生鮮食品
部門長(現)
当社監査役(現)
選任理由
総合商社における豊富な経験と高度
な専門知識を有しているため、監査
役としての任に相応しい人物と判断
しています。
当社株式保有数 0株
監査役
非常勤
独立
社外
1989年10月青山監査法人監査部門
入所
1991年2月中央監査法人監査部門
入所
1993年8月公認会計士登録
1994年10月税理士登録
1994年11月須永公認会計士事務所
開業所長(現)
丸の内ビジネス
1996年11月 (株)
コンサルティング設立
代表取締役(現)
2012年1月税理士法人丸の内
ビジネスコンサルティング
設立代表社員
(現)
マツモトキヨシホール
2016年6月 (株)
ディングス社外監査役
2017年6月丸の内監査法人統括
代表社員
(株)
2020年6月 ウシオ電機
社外取締役監査等委員
(現)
(株)
社外取締役
2020年6月養命酒製造
監査等委員
(現)
2021年6月当社監査役(現)
(現)
2022年1月丸の内監査法人代表社員
(株)
社外取締役
(現)
2022年6月 カヤバ
(株)
社外監査役
(現)
2023年3月 ライオン
専務執行役員
Section 2 成長戦略
新川裕二
15 中期経営計画
営業本部長
田悟敏弘
生産本部長
網野真
食肉事業本部長
中島聡
管理本部長
鯛健一
事業戦略
総合企画本部長兼
PRIMA Next Project Manager
知識および豊富な経験を有している
ため、
社外監査役としての任に相応し
い人物と判断しています。
当社株式保有数 1,213株
※ 監査役の下澤秀樹氏、須永明美氏は、東京証券取引所が定める一般株主と利益相反の生じるおそれがあると判断される事項
に該当しておらず、
当社の社外役員の独立性に関する基準を満たしています
19 本部長メッセージ
21 Highlight 1
加工食品事業の競争力を支える
「挑戦力」
と
「収益力」
常務執行役員
23 加工食品事業
25 Highlight 2
笹嶋恵子
食肉事業の新たな競争力を築く
「変革力」
と
「成長力」
開発本部長
27 食肉事業
人材戦略
執行役員
古賀愼一
総合企画本部特命
担当
(PNP)
林吉彦
佐々木伸
寺村博之
営業本部
フードサービス
事業部長
マーケティング
本部長
片桐修二
伊藤正幸
生産本部
茨城工場長
マーケティング本部
分掌
松本昭雄
山口直樹
日野和昭
井元慎介
佐藤仁
岡元純児
プリマハムミート
ファクトリー
(株)
代表取締役社長
生産本部
三重工場長
食肉事業本部
食肉営業事業部長
営業本部
西日本支社長
選任理由
公認会計士、
税理士としての専門的な
財務戦略
17 財務担当役員メッセージ
品質保証本部長
渡部格
管理本部財経部長
管理本部人事部長
管理本部
サステナビリティ
推進部長
29 人材強化に向けた目標と取り組み
サステナビリティ戦略
31 Sustainability Issues
宮城農場から始まる資源循環
33 プリマハムグループのサステナビリティ
34 重要課題(マテリアリティ)への取り組み
35 健康で豊かな食生活を創造する/
地球環境の保全に貢献する
36 サプライチェーン・マネジメントを強化する/
人権デュー・ディリジェンス
37 アニマルウェルフェア/食育の取り組み
38 環境負荷の全体像
39 気候変動・自然関連課題への対応
Section 3 コーポレートガバナンス
41 社外取締役メッセージ
43 企業統治体制の全体像
47 役員一覧
51 リスクマネジメント
Appendix データ編
53 11年間の連結財務サマリー
55 サステナビリティデータハイライト
56 会社情報/株式情報
コーポレートガバナンス
49
プリマハムグループ 統合報告書2026
INDE X
役員の選任
選任・解任プロセス
経営陣幹部の選解任と取締役・監査役、執行役員候補の
問委員会の答申内容を踏まえて株主総会で決議された報
しています。
社外取締役・社外監査役の選任理由
02 トップメッセージ
つ健全に行われるよう、取締役会において決議された
「内部
WEB
第79回定時株主総会招集ご通知
https://www.primaham.co.jp/ir/docs/20260529̲1.pdf
統制システムの基本方針」に基づいて内部統制システムを
整備・運用しています。
るバランス・能力などを総合的に考慮しています。手続きに
ついては、経営諮問委員会で審議のうえ、取締役会で決議
内部統制システム
当社グループの業務が法令および定款に適合し、適正か
酬額の範囲内で決定しています。
指名方針は、必要な知識・経験、適切なリスク管理、業務執
行と監視および会社の各機能と各事業部門をカバーでき
当社は、中長期的な企業価値の向上に向けたコミット
当社監査部では、運用状況の評価や、問題点の改善・是
メントを強化すべく、2026年6月開催の第79回定時株主総
正状況、再発防止策の状況を確認するなど、
グループ全体
会にて承認を経て、取締役および執行役員の一部を対象と
のシステムの維持・強化に向けた指導・支援をしています。
する業績連動型株式報酬制度を改定しました。従来の退任
なお、
当社監査部は、
当社主管組織への
「本部監査」
、
支店・
当社は、業務執行や取締役の職務執行に対する監督機
時一括給付から、在任中に毎年株式を給付する仕組み
工場・物流センターなどへの
「エリア監査」、営業所などへの
能を強化するため、社外取締役3名、社外監査役2名をそれ
(BBT-RS)へと移行し、退任時まで譲渡制限を付します。
こ
「拠点監査」
と、
「グループ会社監査」
の4つの形態で内部統制
ぞれ選任しています。各取締役、監査役の選任理由はP.47
れにより役員は在任中から議決権等の株主としての権利を
を行い、
改善に対するフォローアップも実施しています。
〜48で示しています。
有し、
株主の皆様と利害を共有することで、
中長期的な企業
価値の向上に向けた取り組みを強力に推進していきます。
役員報酬
当社の取締役(社外取締役および非常勤取締役を除く)
の報酬等は、固定報酬と業績連動報酬等により構成してい
ます。
固定報酬は、
月例の固定報酬とし、役位・責務に応じて他
業績連動報酬等
固定報酬
累計ポイント相当分の報酬を退任時に支給します。短期的
な業績向上に対しては、賞与を支給する場合があります。
+
業績連動型
株式報酬
③事業活動にかかわる
法令等の順守
+
統制環境統制活動
賞与
モニタ
リング
リスクの
評価と対応
情報と
伝達
ITへの
対応
目標達成度※に
応じた係数
(百万円) 対象となる
報酬等の 報酬等の種類別の総額
総額
役員の員数
業績連動
賞与
(百万円) 固定報酬
(名)
報酬
取締役
145
(36)
133
(36)
11
(‑)
‑
(‑)
5
(3)
監査役
49
(26)
49
(26)
‑
(‑)
‑
(‑)
4
(2)
合計
194
(63)
183
(63)
11
(‑)
‑
(‑)
9
(5)
表取締役社長が委任を受けるものとし、取締役の個人別の
(うち社外監査役)
(うち社外役員)
当社は、政策保有株式の保有意義について、毎年取締役
会で確認しています。商取引の利益や配当が資本コストを
上回っているか、定性的な便益が得られるかを踏まえて検
証しています。
役員報酬等(2025年度)
(うち社外取締役)
財務戦略
17 財務担当役員メッセージ
事業戦略
19 本部長メッセージ
21 Highlight 1
加工食品事業の競争力を支える
「挑戦力」
と
「収益力」
23 加工食品事業
25 Highlight 2
食肉事業の新たな競争力を築く
「変革力」
と
「成長力」
27 食肉事業
サステナビリティ戦略
31 Sustainability Issues
宮城農場から始まる資源循環
(支給する場合がある)
※ 業績目標は、
中期経営計画の連結営業利益予算を指標としています
役員区分
Section 2 成長戦略
15 中期経営計画
29 人材強化に向けた目標と取り組み
政策保有株式
役位別基準
ポイント
個人別の報酬額については、取締役会決議に基づいて代
報酬等の内容についての決定に関する方針および経営諮
②財務報告の
財務報告の
信頼性
信頼性
Section 1 価値創造ストーリー
07 プリマハムが大切にしていること
08 成長戦略のロードマップ
09 私たちのあゆみ
10 ビジネスモデルと強み
12 価値創造プロセス
13 経営資本と成長戦略の関係
人材戦略
業績連動報酬等は、業績連動型株式報酬と賞与としてい
業利益の目標達成度合いに応じてポイントを付与し、
その
①業務の有効性および
業務の有効性
効率性
および効率性
内部統制の要素
合的に勘案して決定しています。
向上に連動した株式報酬制度です。事業年度ごとの連結営
内部統制の目的
報酬の体系
社水準、
当社の業績、従業員給与の水準を考慮しながら、総
ます。業績連動型株式報酬は、中長期的な業績と企業価値
プリマハムグループ 統合報告書 2 0 2 6
2025年度は、検証の結果、保有する株式のうち、非上場
33 プリマハムグループのサステナビリティ
34 重要課題(マテリアリティ)への取り組み
35 健康で豊かな食生活を創造する/
地球環境の保全に貢献する
36 サプライチェーン・マネジメントを強化する/
人権デュー・ディリジェンス
37 アニマルウェルフェア/食育の取り組み
38 環境負荷の全体像
39 気候変動・自然関連課題への対応
株式3銘柄、上場株式1銘柄を売却しました。
そのほかの銘
Section 3 コーポレートガバナンス
柄は、採算に課題があるものもありますが、一定の保有意
41 社外取締役メッセージ
43 企業統治体制の全体像
47 役員一覧
51 リスクマネジメント
義があり、直ちに売却すべき状況にはないと判断したため、
引き続き保有します。
2026年度も保有意義の検証を続けていきます。
Appendix データ編
53 11年間の連結財務サマリー
55 サステナビリティデータハイライト
56 会社情報/株式情報
コーポレートガバナンス
プリマハムグループ 統合報告書2026
50
プリマハムグループ 統合報告書 2 0 2 6
INDE X
取締役会の実効性評価
・機関設計と取締役会の構成
なくできている」
と評価し、
また取締役会の総合的な有効性
・取締役会の役割・資質
にかかわる質問にも比較的高い評価が得られました。以上
・取締役会の運営
の結果から、
当社取締役会の実効性は概ね確保されている
てアンケートを実施しました。回答は、外部機関に直接行う
・経営陣の育成と承継計画
との評価結果となりました。
ことで匿名性を確保しています。
アンケートは右記の5つの
・取締役会の役割・責務遂行の有効性
当社は、取締役会の機能向上を図るため、毎年すべての
取締役、
監査役が取締役会の実効性を評価しています。
2025年度の評価は、2026年4月に外部機関の助言を得
大項目で構成されており、取締役会の実効性を多面的に評
価しています。
一方で、改善の余地があるとの指摘もなされました。各課
外部機関による集計結果を踏まえて、
同年6月の取締役会お
題の対応方針を以下のとおり定め、取締役会のさらなる実
よび経営諮問委員会において分析・議論・評価を行いました。
効性向上、コーポレートガバナンスのより一層の強化を
真摯な議論の結果、取締役・監査役が8割超の項目を
「問題
図っていきます。
02 トップメッセージ
Section 1 価値創造ストーリー
07 プリマハムが大切にしていること
08 成長戦略のロードマップ
09 私たちのあゆみ
10 ビジネスモデルと強み
12 価値創造プロセス
13 経営資本と成長戦略の関係
Section 2 成長戦略
15 中期経営計画
財務戦略
17 財務担当役員メッセージ
事業戦略
2024年度実効性評価で
認識した課題への対応状況
2025年度実効性評価で認識した課題と今後の対応
加工食品事業の競争力を支える
「挑戦力」
と
「収益力」
機関設計の選択と有効性
取締役会の多様性や専門性の不足、
中期議論の拡充
に関する指摘を受け、議案に関係する本部長同席に
より多角的・専門的な議論を追求します。
プロパー人
材の登用を検討しつつ、
人的資本戦略や後継者計画、
機関設計の検討を深め、監督体制の強化と議論の質
向上を図ります。
取締役会の議事進行、取締役への情報提供
投資家目線の議論不足や資料遅延の指摘に対し、早
期共有の徹底や議案数の平準化で議論時間を確保し
ます。
また、
取締役会と経営会議の同日・別日開催の是
非については、
監督機能と審議効率の双方の観点から
利害を整理し、
最適な開催方法の検討を継続します。
投資家の声の反映
株主との対話報告が不足しているとの指摘に対し、
四半期に一度、投資家・アナリストとのコミュニケー
ション記録を記載・報告しており、今後も適切な情報
共有に努めます。
19 本部長メッセージ
21 Highlight 1
●
経営陣の育成と後継者計画
取締役会および経営会議の運営、
機関設計の見直し
社長の後継者要件や執行役員に
●
取締役会および経営会議を同日開催することは議論
経営計画・事業ポートフォリオの議論
●
中期経営計画および事業ポートフォリオに
求める人材要件の審議について
の内容を深く把握できる点において一定の評価を得
関する議論が不足しているとの指摘があり
課題感が示されました。
当社が求
られた一方で、取締役会が業務執行の面に偏重するこ
ました。取締役会事前説明会の場などを活
める取締役・執行役員候補に合
とや議論の質の低下への懸念が指摘されました。別日
用し、
これらを審議・議論する場を設けると
致した人材選定を引き続き進め
開催とすることで、
コーポレートガバナンス・コードが
ともに、定期的なレビューを実施します。
るとともに、人材要件を議論する
求める
「監督と執行の分離」
を推進し、取締役会をより
場の提供を検討します。また、経
企業価値向上に向けた建設的な議論の場とすること
営陣の多様性の観点から、女性
を検討します。
取締役・執行役員のさらなる登用
や社内財務担当役員の選任も含
●
取締役会資料の提供遅れが指摘されました。資料作
成の早期化に加え、経営会議の議論内容および取締
めて検討します。
役会に上程予定の案件を、
より丁寧に事前説明できる
よう運用を改善します。
●
プライム市場において監査等委員会設置会社が増加
しているなか、
当社が監査役会設置会社を継続するこ
との説明責任についてご指摘がありました。当社のガ
バナンス体制のあり方等を検討し、その結論を株主・
投資家の皆様に共有する場を設けます。
投資家の声の反映
●
投資家やアナリストの具体的な意見・要望
をより詳細に把握し、審議に反映させたい
という意向が示されました。事務局が投資
家との対話で得られた具体的な意見・要望
を把握し、個別の審議に反映する仕組みを
整えます。
23 加工食品事業
25 Highlight 2
食肉事業の新たな競争力を築く
「変革力」
と
「成長力」
27 食肉事業
人材戦略
29 人材強化に向けた目標と取り組み
サステナビリティ戦略
31 Sustainability Issues
宮城農場から始まる資源循環
33 プリマハムグループのサステナビリティ
34 重要課題(マテリアリティ)への取り組み
35 健康で豊かな食生活を創造する/
地球環境の保全に貢献する
36 サプライチェーン・マネジメントを強化する/
人権デュー・ディリジェンス
37 アニマルウェルフェア/食育の取り組み
38 環境負荷の全体像
39 気候変動・自然関連課題への対応
Section 3 コーポレートガバナンス
41 社外取締役メッセージ
43 企業統治体制の全体像
47 役員一覧
51 リスクマネジメント
Appendix データ編
53 11年間の連結財務サマリー
55 サステナビリティデータハイライト
56 会社情報/株式情報
コーポレートガバナンス
プリマハムグループ 統合報告書2026
51
INDE X
リスクマネジメント
基本的な考え方
発生しうる被害を最小限に留めるため、
リスク抑制策とリス
当社グループの経営成績および財務状態に影響を与えるリスクには、
おもに以下のようなものがあります。
項目
説明
原材料価格の市況変動
重点リスク
当社グループは販売用食肉、
ハム・ソーセージ、加工食品等の製造・販売をしており
原材料となる畜産物の市況や商品・原油市況の高騰が業績に影響を与える
● 畜産物の相場変動
● 畜産物の疾病問題
● 輸入原料肉の緊急輸入制限措置
(セーフガード) ● 農場の飼料価格
● 包装資材
● 工場稼動における燃料費、
電気代 ● 物流費
為替の変動
当社グループは原材料、商品を米国、欧州、
中国等から輸入しており、為替レートの
変動が業績に影響を与える。海外子会社の現地通貨建ての業績が円換算される際
に影響がある
クが顕在化した際の効率的で最適な対応方法を定めた
「リ
リスクの顕在化とは
事業環境
スク管理規定」
を制定しています。
- 会社の過失により取引先および消費者に多大なる損害を与えたとき
- 法令違反を犯し、
その責任を問われたとき
- 財務報告の信頼性が確保されなかったとき
食の安全・安心の確保
重点リスク
- 自然災害によって多大な損害を受けたとき
- 重要な情報が外部に流出、漏えいしたとき
- その他会社の存続にかかわる重大な事案が発生したとき
事業運営
リスクへの対応
当社グループは、
「リスク管理規定」においてリスクを要
のれん、
固定資産の減損
公的な規制への対応
重点リスク
因ごとに分類し、
社内諸規定やマニュアル、通達によって、
リ
スク顕在化の未然防止方法を示しています。
また、経営理念
を実践する行動指針として
「プリマハム行動規範」を策定
し、食品安全に基づいたおいしい食品を食卓へお届けする
災害・事故・事件
重点リスク
ために
「食品安全・品質方針」
を定めています。
リスクが顕在化したときには、
「リスク発生時の対応マ
法を定めています。被害が甚大な場合は、事業継続計画
(BCP)
を発動し、代表取締役社長を本部長とする危機対策
環境・災害
ニュアル」に従い、予測される被害の程度に応じて、対応方
02 トップメッセージ
事業等のリスク
分類
当社グループは、想定される
「企業リスク」
を抑制し、
また
感染症
重点リスク
当社グループが製造・販売する商品において
● 重大な品質問題
● 品質問題の長期化
● アレルギー物質の混入等が発生することで、
お客様の健康を損ねる懸念や社会
的信頼が失墜し、
事業継続が困難になる
当社グループの有形固定資産および無形固定資産が事業計画と乖離し、
期待どおり
のキャッシュ・フローを生み出さない場合、
業績および財政状態に悪影響を及ぼす
● 買収子会社の事業計画未達
● 事業用資産の事業計画乖離
当社グループの事業活動を行う上で、
法令違反は会社に甚大な影響を与える
● 食品衛生法、
食品表示法等の違反による行政処分、
信頼失墜
● 輸出入関連法の違反による行政処分、
生産・販売への影響
● 独占禁止法の違反による行政処分、
取引制限と信頼失墜
● 労働関連法規の違反による行政処分、
信頼失墜
● 環境・
リサイクル関連法の違反による行政処分、原状復帰、生産への影響と信頼
失墜
当社グループおよび仕入先が災害・事故・事件の発生により、人的・物的被害を受
けると、商品供給の遅延停止、生産物流拠点や事業所の停止により、業績に甚大な
悪影響を及ぼす
● 気候変動:台風・集中豪雨、
大量降雪、
落雷等 ● 災害:地震・噴火等
● 事故
:火災・爆発・交通機関等 ● 事件:テロ・誘拐・脅迫等 ● 武力闘争:戦争・内乱等
当社グループにおいて、感染症が蔓延した場合、事業活動の継続が困難となり、業
績に甚大な悪影響を及ぼす
● 重要業務以外の一時停止
● 生産ラインと商品供給の停止
● 事業所の稼働停止
本部を設置し、関連部署と連携して対応にあたります。
なお、当社の従業員に毎年配布する手帳には、
リスクが
顕在化したときの対応として
「緊急対応時の初期動作(重
大クレーム編、食中毒編、労働災害編、交通事故編、
自然災
害編)
」
を掲載しています。
プリマハムグループ 統合報告書 2 0 2 6
大規模システム障害
重点リスク
当社グループにおいて、大規模システム障害(サイバー攻撃を含む)が発生した場
合、
事業活動の継続が困難となり、
業績に甚大な悪影響を及ぼす
● 重要業務以外の一時停止
● 生産ラインと商品供給の停止
● 企業、
取引先、
個人情報の漏えい
対策
原材料の複数仕入先からの購買
● 代替原材料の選定、
確保
● 在庫基準の見直し
● 適正在庫の確保
● 商品売価への適正な反映
●
短期的な変動抑制を目指した為替予約
● 商品売価への適正な反映
●
品質管理手法の実践
(HACCP、
ISO 22000、
FSSC 22000)
● 商品パッケージの内容表示、
当社HPにおける情報開示
● 問題発生時は、
迅速な情報伝達と再発防止体制を整備
●
経営会議等における買収金額の審議・決定
買収後の管理手法定着
● 経営会議等の投資案件レビューによる進捗モニタ
リング
●
●
Section 1 価値創造ストーリー
07 プリマハムが大切にしていること
08 成長戦略のロードマップ
09 私たちのあゆみ
10 ビジネスモデルと強み
12 価値創造プロセス
13 経営資本と成長戦略の関係
Section 2 成長戦略
15 中期経営計画
財務戦略
17 財務担当役員メッセージ
事業戦略
19 本部長メッセージ
21 Highlight 1
加工食品事業の競争力を支える
「挑戦力」
と
「収益力」
23 加工食品事業
25 Highlight 2
食肉事業の新たな競争力を築く
「変革力」
と
「成長力」
品質管理手法の遵守
● 行動規範の浸透、
コンプライアンス委員会による意識
の醸成と定着、
コンプライアンス教育活動
● 社内規則の整備、
通達の運用徹底、
ハラスメント防止研
修
● 環境マネジメントシステム、
環境委員会の運用
27 食肉事業
適正在庫の確保
● 重要仕入品の複数仕入先・複数地域からの購買推進
● 事業継続計画の強化および訓練
33 プリマハムグループのサステナビリティ
34 重要課題(マテリアリティ)への取り組み
35 健康で豊かな食生活を創造する/
●
人材戦略
29 人材強化に向けた目標と取り組み
サステナビリティ戦略
31 Sustainability Issues
宮城農場から始まる資源循環
●
地球環境の保全に貢献する
◇従業員・家族の感染防止策
● 健康管理、
注意喚起
● 会議・業務の制限、
出張禁止
◇事業継続対応
● 事業継続計画の強化および訓練
● 各拠点運営体制の整備
● 他部署からの生産応援
● 在宅・時差勤務での業務処理
● 取締役会等のテレビ会議対応
バックアップ体制の確立
複数個所でのデータ受信方法の確立
● サイバーセキュリティ強化
● 事業継続計画の強化および訓練
●
●
※「項目」
欄に記載されている
「重点リスク」
は、
リスク発生時に影響の大きさが懸念される特に重要なリスク項目と定義しています
36 サプライチェーン・マネジメントを強化する/
人権デュー・ディリジェンス
37 アニマルウェルフェア/食育の取り組み
38 環境負荷の全体像
39 気候変動・自然関連課題への対応
Section 3 コーポレートガバナンス
41 社外取締役メッセージ
43 企業統治体制の全体像
47 役員一覧
51 リスクマネジメント
Appendix データ編
53 11年間の連結財務サマリー
55 サステナビリティデータハイライト
56 会社情報/株式情報
プリマハムグループ 統合報告書2026
52
プリマハムグループ 統合報告書 2 0 2 6
INDE X
Appendix
02 トップメッセージ
Section 1 価値創造ストーリー
07 プリマハムが大切にしていること
08 成長戦略のロードマップ
09 私たちのあゆみ
10 ビジネスモデルと強み
12 価値創造プロセス
13 経営資本と成長戦略の関係
データ編
Section 2 成長戦略
15 中期経営計画
財務戦略
17 財務担当役員メッセージ
事業戦略
19 本部長メッセージ
21 Highlight 1
加工食品事業の競争力を支える
「挑戦力」
と
「収益力」
23 加工食品事業
25 Highlight 2
食肉事業の新たな競争力を築く
「変革力」
と
「成長力」
IN D E X
53
11年間の連結財務サマリー
27 食肉事業
人材戦略
29 人材強化に向けた目標と取り組み
11年間の主要財務データを掲載しています。売上高や利益、財務指標の
11年間の連結財務サマリー
推移を通じて、当社グループの成長のあゆみと経営基盤の変化をご確認
いただけます。
55
サステナビリティデータハイライト
会社情報/株式情報
宮城農場から始まる資源循環
33 プリマハムグループのサステナビリティ
34 重要課題(マテリアリティ)への取り組み
35 健康で豊かな食生活を創造する/
地球環境の保全に貢献する
サステナビリティ
56
サステナビリティ戦略
31 Sustainability Issues
データハイライト
会社情報/株式情報
環境・社会に関する主要データを掲載しています。温室効果ガス排出量や
人的資本に関する指標の推移から、
サステナビリティへの取り組みの進捗
をご覧いただけます。
会社概要や事業拠点、株式の状況など、当社グループの企業概要や株主
構成についてご確認いただけます。
36 サプライチェーン・マネジメントを強化する/
人権デュー・ディリジェンス
37 アニマルウェルフェア/食育の取り組み
38 環境負荷の全体像
39 気候変動・自然関連課題への対応
Section 3 コーポレートガバナンス
41 社外取締役メッセージ
43 企業統治体制の全体像
47 役員一覧
51 リスクマネジメント
Appendix データ編
53 11年間の連結財務サマリー
55 サステナビリティデータハイライト
56 会社情報/株式情報
データ編
プリマハムグループ 統合報告書2026
53
プリマハムグループ 統合報告書 2 0 2 6
INDE X
11年間の連結財務サマリー
02 トップメッセージ
Section 1 価値創造ストーリー
連結財務
(百万円)
2015年度
2016年度
2017年度
2018年度
2019年度
2020年度
2021年度
2022年度
2023年度
2024年度
2025年度
売上高
361,223
363,336
394,534
413,023
418,060
418,147
420,717
430,740
448,429
458,354
475,574
売上原価
310,871
303,483
333,426
350,266
351,290
360,167
367,971
382,986
398,289
409,868
422,998
業績状況
07 プリマハムが大切にしていること
08 成長戦略のロードマップ
09 私たちのあゆみ
10 ビジネスモデルと強み
12 価値創造プロセス
13 経営資本と成長戦略の関係
Section 2 成長戦略
15 中期経営計画
売上総利益
50,351
59,853
61,108
62,756
66,769
57,980
52,745
47,753
50,140
48,486
52,575
販売費および一般管理費
42,104
44,287
47,978
49,588
51,132
36,504
38,708
38,028
38,320
39,537
43,444
営業利益
8,247
15,565
13,129
13,168
15,636
21,475
14,037
9,725
11,820
8,948
9,131
営業外収益
930
859
873
1,173
1,044
1,246
1,189
1,232
1,587
1,965
2,421
営業外費用
401
322
356
512
722
310
342
447
523
411
366
経常利益
8,776
16,102
13,646
13,829
15,959
22,411
14,883
10,510
12,884
10,502
11,185
23 加工食品事業
25 Highlight 2
税金等調整前当期純利益
10,029
15,337
14,790
13,944
15,338
21,916
15,106
5,900
13,427
10,921
8,673
親会社株主帰属当期純利益
27 食肉事業
6,429
10,009
10,413
8,287
8,823
14,165
9,718
4,505
7,489
7,076
4,587
投資・研究
設備投資(含むソフトウェア)
14,102
16,347
22,448
19,549
13,378
12,364
16,563
23,875
14,703
12,970
19,383
減価償却費
6,467
7,001
8,578
8,459
9,729
9,923
10,451
10,958
11,338
11,452
11,809
研究開発費
473
399
381
396
376
381
335
389
366
365
391
営業活動によるキャッシュ・フロー
5,209
26,003
10,866
23,786
22,304
27,248
16,739
11,719
22,542
14,211
19,752
投資活動によるキャッシュ・フロー
(12,617)
(14,790)
(21,373)
(14,887)
(5,875)
(12,205)
(23,713)
(15,089)
(19,420)
(13,574)
(13,762)
(フリー・キャッシュ・フロー)
(7,408)
11,213
(10,507)
8,899
16,429
15,043
(6,973)
(3,370)
3,122
636
5,990
財務活動によるキャッシュ・フロー
9,347
1,335
3,187
(7,347)
(7,924)
(7,509)
(6,616)
1,206
(7,574)
(4,202)
(6,377)
現金および現金同等物の期末残高
6,927
19,468
12,168
13,732
22,214
29,773
16,230
14,098
9,765
6,266
5,917
ネット有利子負債
12,672
2,801
16,453
14,313
1,035
(10,833)
(4,960)
7,505
6,353
9,657
9,779
キャッシュ・フロー状況
財務戦略
17 財務担当役員メッセージ
事業戦略
19 本部長メッセージ
21 Highlight 1
加工食品事業の競争力を支える
「挑戦力」
と
「収益力」
食肉事業の新たな競争力を築く
「変革力」
と
「成長力」
人材戦略
29 人材強化に向けた目標と取り組み
サステナビリティ戦略
31 Sustainability Issues
宮城農場から始まる資源循環
33 プリマハムグループのサステナビリティ
34 重要課題(マテリアリティ)への取り組み
35 健康で豊かな食生活を創造する/
地球環境の保全に貢献する
本統合報告書では、以下の条件で算出
※2020年度実績(同年度は未監査)
から収益認識会計基準を採用
※2020年度まで配合飼料価格安定制度に係る収入・費用は
「営業外収益」
「営業外費用」
に表示。2021年度から
「売上高」
「販売費および一般管理費」
に表示
36 サプライチェーン・マネジメントを強化する/
人権デュー・ディリジェンス
37 アニマルウェルフェア/食育の取り組み
38 環境負荷の全体像
39 気候変動・自然関連課題への対応
Section 3 コーポレートガバナンス
41 社外取締役メッセージ
43 企業統治体制の全体像
47 役員一覧
51 リスクマネジメント
Appendix データ編
53 11年間の連結財務サマリー
55 サステナビリティデータハイライト
56 会社情報/株式情報
データ編
プリマハムグループ 統合報告書2026
54
プリマハムグループ 統合報告書 2 0 2 6
INDE X
02 トップメッセージ
Section 1 価値創造ストーリー
連結財務
07 プリマハムが大切にしていること
08 成長戦略のロードマップ
09 私たちのあゆみ
10 ビジネスモデルと強み
12 価値創造プロセス
13 経営資本と成長戦略の関係
2015年度
2016年度
2017年度
2018年度
2019年度
2020年度
2021年度
2022年度
2023年度
2024年度
2025年度
流動資産
69,241
78,113
79,329
82,857
87,310
98,747
95,828
95,311
103,192
99,561
103,670
有形固定資産
66,231
73,852
89,724
100,275
89,259
91,060
97,204
102,309
98,961
97,006
94,187
Section 2 成長戦略
財政状態(会計年度末)
(百万円)
1,282
1,371
1,155
1,288
1,146
1,666
4,854
7,308
12,386
14,248
22,074
15 中期経営計画
総資産
153,511
170,919
189,751
203,862
198,530
214,542
221,721
229,887
244,793
239,610
241,280
17 財務担当役員メッセージ
負債合計
83,481
91,721
100,477
109,226
98,396
99,781
99,154
106,692
114,580
109,382
110,743
自己資本
63,158
72,019
81,180
86,114
90,573
103,632
111,860
113,169
119,313
119,382
121,932
純資産
70,030
79,198
89,274
94,635
100,134
114,761
122,567
123,194
130,213
130,228
130,536
131.68
198.80
206.85
164.78
175.57
281.90
193.41
89.66
149.03
140.79
91.28
1,254.38
1,430.45
1,612.51
1,713.26
1,802.47
2,062.41
2,226.09
2,252.09
2,374.23
2,375.15
2,425.93
無形固定資産
1株当たり情報(円)※1
当期純利益
純資産
配当金
20
30
50
60
60
※2
85
65
65
65
80
80
主要指標
事業戦略
19 本部長メッセージ
21 Highlight 1
加工食品事業の競争力を支える
「挑戦力」
と
「収益力」
23 加工食品事業
25 Highlight 2
食肉事業の新たな競争力を築く
「変革力」
と
「成長力」
27 食肉事業
人材戦略
29 人材強化に向けた目標と取り組み
サステナビリティ戦略
31 Sustainability Issues
営業利益率(%)
2.3
4.3
3.3
3.2
3.7
5.0
3.3
2.3
2.6
2.0
1.9
自己資本当期純利益率(ROE)(%)
11.4
14.8
13.6
9.9
10.0
14.6
9.0
4.0
6.4
5.9
3.8
総資産当期純利益率(ROA)(%)
4.4
6.2
5.8
4.2
4.4
6.9
4.5
2.0
3.2
2.9
1.9
投下資本利益率(ROIC)(%)
9.9
12.5
10.4
9.0
9.7
13.2
8.7
3.3
5.9
4.6
5.1
自己資本比率(%)
41.1
42.1
42.8
42.2
45.6
48.3
50.5
49.2
48.7
49.8
50.5
ネット有利子負債資本倍率(倍)
0.18
0.04
0.18
0.15
0.01
(0.09)
(0.04)
0.05
0.05
0.08
0.08
配当性向(%)
15.2
15.1
24.2
36.4
34.2
30.2
33.6
72.5
43.6
56.8
87.6
期末株価(円)
1,425
2,460
3,050
2,054
2,453
3,490
2,202
2,201
2,303
2,222
2,730
1.14
1.72
1.89
1.20
1.36
1.69
0.99
0.98
0.97
0.94
1.13
株価純資産倍率(PBR)(倍)※3
財務戦略
※1 2015年6月26日付第三者割当による新株式発行を実施。
2018年10月1日付にて株式併合(普通株式5株を1株に併合)
を実施。株式併合前の1株当たり情報は株式併合が行われたと仮定し修正
※2 記念配当20円を含む
※3 期末株価で算出
宮城農場から始まる資源循環
33 プリマハムグループのサステナビリティ
34 重要課題(マテリアリティ)への取り組み
35 健康で豊かな食生活を創造する/
地球環境の保全に貢献する
36 サプライチェーン・マネジメントを強化する/
人権デュー・ディリジェンス
37 アニマルウェルフェア/食育の取り組み
38 環境負荷の全体像
39 気候変動・自然関連課題への対応
Section 3 コーポレートガバナンス
41 社外取締役メッセージ
43 企業統治体制の全体像
47 役員一覧
51 リスクマネジメント
Appendix データ編
53 11年間の連結財務サマリー
55 サステナビリティデータハイライト
56 会社情報/株式情報
データ編
55
プリマハムグループ 統合報告書2026
プリマハムグループ 統合報告書 2 0 2 6
INDE X
サステナビリティデータハイライト
02 トップメッセージ
温室効果ガス排出量※1
Scope1
エネルギー消費量
Section 1 価値創造ストーリー
水使用量
Scope2
(トン-CO2e)
(原油換算kℓ)
300,000
100,000
242,400
209,300
102,800
108,700
188,700
94,600
140,300
133,700
114,700
0
2022
2023
176,800
82,800
71,400
105,900
105,400
100,000
2021
92,669
243,100
200,000
2024
(千m3)
90,936
85,464
86,015
6,000
85,218
50,000
5,687
5,596
5,713
5,779
5,656
3,000
Section 2 成長戦略
15 中期経営計画
0
2025(年度)
再生可能エネルギー比率※2
財務戦略
0
2021
2022
2023
2024
2025(年度)
2021
2022
2023
2024
2025(年度)
女性管理職
(%)
37.3
40.0
77
25.9
20.0
0.2
1.4
2021
2022
61
60
14.7
2021
新卒採用者数
60
60
36
50
42
0
0
2023
2022
2023
2024
2025(年度)
2024
2025
うち離職者数
18.2
2026(入社年度)
※1 グループ会社
※2 太陽光発電(オンサイトPPAを含む)
および電力会社の再生可能エネルギープランの購買
※3 出向を含む
※4 新卒者が対象
※5 5回以上の取得を対象
20.0
10.0
4.7
3.4
2022
56
47
2023
4.3
3
2
2023
2024
3
食肉事業の新たな競争力を築く
「変革力」
と
「成長力」
人材戦略
29 人材強化に向けた目標と取り組み
2024
2025(年度)
31 Sustainability Issues
宮城農場から始まる資源循環
※5
男性育児休業取得率
(単体)
33 プリマハムグループのサステナビリティ
34 重要課題(マテリアリティ)への取り組み
35 健康で豊かな食生活を創造する/
(%)
(%)
36 サプライチェーン・マネジメントを強化する/
10.0
80.0
地球環境の保全に貢献する
80.0
55.6
5.4
加工食品事業の競争力を支える
「挑戦力」
と
「収益力」
23 加工食品事業
25 Highlight 2
サステナビリティ戦略
0
2021
事業戦略
27 食肉事業
7.1
離職率
6.0
30
23
15.9
0
2025(年度)
(名)
32
16.0
6.0
4.0
新卒採用者の入社3年目までの離職率
(単体)
47
17.5
67
40
2024
(%)
2022
16.8
50
※4
女性採用比率
(単体)
30
64
8.0
(%)
2.8
2023
女性係長
(%)
80
17 財務担当役員メッセージ
19 本部長メッセージ
21 Highlight 1
※3
女性管理職・係長比率
(単体)
有給休暇取得率
(単体)
(%)
0
07 プリマハムが大切にしていること
08 成長戦略のロードマップ
09 私たちのあゆみ
10 ビジネスモデルと強み
12 価値創造プロセス
13 経営資本と成長戦略の関係
5.0
0
2025(入社年度)
60.6
40.0
0
5.0
5.0
2021
2022
人権デュー・ディリジェンス
37 アニマルウェルフェア/食育の取り組み
38 環境負荷の全体像
39 気候変動・自然関連課題への対応
Section 3 コーポレートガバナンス
2023
2024
2025(年度)
41 社外取締役メッセージ
43 企業統治体制の全体像
47 役員一覧
51 リスクマネジメント
Appendix データ編
53 11年間の連結財務サマリー
55 サステナビリティデータハイライト
56 会社情報/株式情報
データ編
56
プリマハムグループ 統合報告書2026
会社情報(2026年3月31日現在)
プリマハムグループ 統合報告書 2 0 2 6
INDE X
株式情報
02 トップメッセージ
商号
プリマハム株式会社
本社
東京都品川区東品川4丁目12番2号
GRC品川イノベーションパーク
TEL : 03-6386-1800
代表者
事業内容
代表取締役社長社長執行役員阿部邦明
ハム・ソーセージ、食肉および加工食品の製造販売
持株数持株比率
(千株) (%)
株主名
〒140-8529
伊藤忠商事株式会社
23,336
46.36
日本マスタートラスト
信託銀行株式会社(信託口)
3,216
6.39
伊藤忠食品株式会社
2,262
4.50
学校法人竹岸学園
900
1.79
株式会社日本カストディ銀行(信託口)
853
1.70
株式会社サンショク
700
1.39
創業
1931年9月1日
STATE STREET BANK AND TRUST
COMPANY 505001
510
1.01
設立
1948年7月9日
日本生命保険相互会社
446
0.89
JP MORGAN CHASE BANK 385781
393
0.78
UBS AG LONDON A/C IPB
SEGREGATED CLIENT ACCOUNT
392
0.78
資本金
従業員数
79億8百万円
2,177名
※ 執行役員および臨時従業員の年間平均雇用人数を含めています
東日本支社東北支店(宮城)
・関東支店(東京)
支社・支店
物流センター
研究機関
発行可能株式総数
70,000,000株
発行済株式の総数
50,524,399株(自己株式189,451株)
株主数
29,844名
所有者別株式分布状況(2026年3月31日現在)
証券会社
自己名義株式
3.9%
17.6%
外国人
12.9%
北海道工場・茨城工場・三重工場・鹿児島工場
関東物流センター(茨城)
・三重物流センター・
福岡物流センター
10.4%
19 本部長メッセージ
21 Highlight 1
その他
国内法人
23 加工食品事業
25 Highlight 2
54.9%
事業戦略
加工食品事業の競争力を支える
「挑戦力」
と
「収益力」
食肉事業の新たな競争力を築く
「変革力」
と
「成長力」
27 食肉事業
人材戦略
株価・出来高推移
(東京証券取引所)
(円)
31 Sustainability Issues
サステナビリティ戦略
株価
宮城農場から始まる資源循環
5,000
33 プリマハムグループのサステナビリティ
34 重要課題(マテリアリティ)への取り組み
35 健康で豊かな食生活を創造する/
4,000
地球環境の保全に貢献する
3,000
36 サプライチェーン・マネジメントを強化する/
人権デュー・ディリジェンス
2,000
37 アニマルウェルフェア/食育の取り組み
38 環境負荷の全体像
39 気候変動・自然関連課題への対応
1,000
0
(百万株)
2021
2022
2023
2024
2025
2026
出来高
60
30
https://www.primaham.co.jp/company/group̲company.html
0
2021
Section 3 コーポレートガバナンス
41 社外取締役メッセージ
43 企業統治体制の全体像
47 役員一覧
51 リスクマネジメント
90
グループ会社の情報はこちら
財務戦略
17 財務担当役員メッセージ
29 人材強化に向けた目標と取り組み
基礎研究所(茨城)
・
製造・技術部(機械開発担当部門)
(茨城)
15 中期経営計画
0.4%
金融機関
個人・その他
07 プリマハムが大切にしていること
08 成長戦略のロードマップ
09 私たちのあゆみ
10 ビジネスモデルと強み
12 価値創造プロセス
13 経営資本と成長戦略の関係
Section 2 成長戦略
西日本支社中部支店(愛知)
・関西支店(大阪)
・
中四国支店(広島)
・九州支店(福岡)
工場
Section 1 価値創造ストーリー
株式の状況(2026年3月31日現在)
大株主の状況 (2026年3月31日現在)
2022
2023
2024
2025
2026
Appendix データ編
53 11年間の連結財務サマリー
55 サステナビリティデータハイライト
56 会社情報/株式情報