2026 0 100 Illustration: Machi Yanagida 2026 2026 100 Prologue Morinaga Milk Group Integrated Report 2026 03 CONTENTS Chapter 01 Chapter 02 Chapter 03 Chapter 04 Appendix 2026 Prologue Message from Management Chapter 04 3 59 62 65 66 71 72 CONTENTS…
2026
0
100
Illustration: Machi Yanagida
2026
2026
100
Prologue
Morinaga Milk Group Integrated Report 2026
03
CONTENTS
Chapter
01
Chapter
02
Chapter
03
Chapter
04
Appendix
2026
Prologue
Message from Management
Chapter
04
3
59
62
65
66
71
72
CONTENTS
https://www.morinagamilk.co.jp/ir/library/annual.html
IR
https://www.morinagamilk.co.jp/ir/
https://www.morinagamilk.co.jp/sustainability/
https://www.morinagamilk.co.jp/
2027
3
2026
5
13
Prologue
2026
01
03
04
05
Message from the President,
Chief Executive Officer
Message from
the Officer in Charge of Finance
08
09
13
Message from Management
Chapter
01
1
2
18
19
21
26
Chapter
02
202528
30
31
33
40
Chapter
03
DX
51
55
57
Appendix
11
75
77
78
79
IR
Morinaga Milk Group Integrated Report 2026
04
CONTENTS
Chapter
01
Chapter
02
Chapter
03
Chapter
04
Appendix
2026
Prologue
Message from Management
2026
/
3
2026
/
3
345
6
.
0
%
2026
/
3
2
0
2
5
2
8
M
e
r
i
h
a
r
i
A
t
a
G
l
a
n
c
e
M
O
R
I
N
A
G
A
M
I
L
K
5
,
715
2026
/
3
8
.
4
%
ROE
2026
/
3
6
.
3
%
ROIC
2026
/
3
85
%
51
%
15
%
49
%
36
%
2026
/
3
40
%
Prologue
Morinaga Milk Group Integrated Report 2026
05
CONTENTS
Chapter
01
Chapter
02
Chapter
03
Chapter
04
Appendix
2026
Prologue
Message from Management
1
SRI+
2025
4
2026
3
2
2026
1
PubMed
WEB
3
2021
3
22
PubMed
WEB
4
Absolute Reports
2025
MILEI GmbH
5
2026
3
16
WEB
PubMed
A
t
a
G
l
a
n
c
e
M
O
R
I
N
A
G
A
M
I
L
K
7
,
345
2026
3
31
1
1
37
%
32
2026
3
31
10
50
1
2
1
4
BB
536
30
5
MCC
1274
3
BB
536
300
M-
16
V
140
MCC
1274
17
2026
3
2026
3
31
Prologue
Morinaga Milk Group Integrated Report 2026
06
CONTENTS
Chapter
01
Chapter
02
Chapter
03
Chapter
04
Appendix
2026
Prologue
Message from Management
Message
from Management
P.08
P.09
Message from the President, Chief Executive Officer
P.13
Message from the Officer in Charge of Finance
Morinaga Milk Group Integrated Report 2026
07
CONTENTS
PROLOGUE
Message from the President,
Chief Executive Officer
Message from
the Officer in Charge of Finance
Message from Management
Chapter
01
Chapter
02
Chapter
03
Chapter
04
Appendix
2029
3
6
.
3
%
7
.
0
%
2026
3
ROIC
Merihari
2026
3
2025
28
2026
3
25
%
49
%
2025
3
2026
3
25
%
Message from Management
Morinaga Milk Group Integrated Report 2026
08
CONTENTS
PROLOGUE
Message from the President,
Chief Executive Officer
Message from
the Officer in Charge of Finance
Message from Management
Chapter
01
Chapter
02
Chapter
03
Chapter
04
Appendix
26
/
3
SNS
2026
3
1
26
/
3
4
2025
28
Merihari-
CEO
Message from the President,
Chief Executive Officer
1983
2015
2021
2026
CEO
Message from Management
Morinaga Milk Group Integrated Report 2026
09
CONTENTS
PROLOGUE
Message from the President,
Chief Executive Officer
Message from
the Officer in Charge of Finance
Message from Management
Chapter
01
Chapter
02
Chapter
03
Chapter
04
Appendix
3
.
6
%
29
/
3
440
7
%
2025
28
BtoB
BtoC
50
2025
28
2025
28
3
2025
28
26
/
3
5
,
715
1
.
8
%
345
16
.
3
%
6
.
0
%
MILEI
Message from the President, Chief Executive Officer
Message from Management
Morinaga Milk Group Integrated Report 2026
10
CONTENTS
PROLOGUE
Message from the President,
Chief Executive Officer
Message from
the Officer in Charge of Finance
Message from Management
Chapter
01
Chapter
02
Chapter
03
Chapter
04
Appendix
40
BtoC
8
26
/
3
26
/
3
26
/
3
25
%
MILEI
BtoB
MILEI
2026
4
BtoB
MILEI
27
/
3
MILEI
Message from the President, Chief Executive Officer
Message from Management
Morinaga Milk Group Integrated Report 2026
11
CONTENTS
PROLOGUE
Message from the President,
Chief Executive Officer
Message from
the Officer in Charge of Finance
Message from Management
Chapter
01
Chapter
02
Chapter
03
Chapter
04
Appendix
Morinaga Milk Awards
2026
100
1
2025
28
4
26
/
3
Message from the President, Chief Executive Officer
Message from Management
Morinaga Milk Group Integrated Report 2026
12
CONTENTS
PROLOGUE
Message from the President,
Chief Executive Officer
Message from
the Officer in Charge of Finance
Message from Management
Chapter
01
Chapter
02
Chapter
03
Chapter
04
Appendix
Message from
the Officer in Charge of Finance
1988
2016
2019
2020
2021
2022
2026
2025
4
1
M&A
M&A
Message from Management
Morinaga Milk Group Integrated Report 2026
13
CONTENTS
PROLOGUE
Message from the President,
Chief Executive Officer
Message from
the Officer in Charge of Finance
Message from Management
Chapter
01
Chapter
02
Chapter
03
Chapter
04
Appendix
26
/
3
1
1
2025
28
1
,
800
200
MILEI
4
.
5
%
25
/
3
3
.
6
%
26
/
3
Message from the Officer in Charge of Finance
1
2
3
25
20
15
10
5
0
22
/
3
23
/
3
24
/
3
25
/
3
26
/
3
27
/
3
%
14
.
3
17
.
1
10
.
2
10
.
7
19
.
4
18
.
4
4
.
54
.
5
3
.
63
.
2
3
.
0
5
.
1
30
25
20
15
10
5
0
22
/
3
23
/
3
24
/
3
25
/
3
26
/
3
27
/
3
%
ROE
ROIC
16
.
7
1
24
.
5
2
2
.
0
3
7
.
9
8
.
47
.
1
5
.
4
6
.
35
.
5
7
.
0
5
.
75
.
7
Message from Management
Morinaga Milk Group Integrated Report 2026
14
CONTENTS
PROLOGUE
Message from the President,
Chief Executive Officer
Message from
the Officer in Charge of Finance
Message from Management
Chapter
01
Chapter
02
Chapter
03
Chapter
04
Appendix
Message from the Officer in Charge of Finance
ROA
1
ROA
CF
2025
28
40
%
24
/
3
26
/
3
100
27
/
3
2026
6
30
1
4
27
/
3
25
/
300
250
200
150
100
50
0
120
.
0
100
.
0
80
.
0
60
.
0
40
.
0
20
.
0
0
.
0
15
/
3
16
/
3
17
/
3
18
/
3
19
/
3
20
/
3
21
/
3
22
/
3
23
/
3
24
/
3
25
/
3
26
/
3
27
/
3
1
100
.
0
100
.
0
90
.
0
60
.
0
45
.
0
40
.
0
35
.
0
30
.
0
27
.
5
25
.
0
22
.
5
17
.
517
.
5
5
.
4
5
.
3
5
.
8
6
.
56
.
5
5
.
15
.
3
5
.
5
6
.
5
2017
10
1
5
1
2023
12
1
1
2
1
2015
3
2026
7
1
27
/
3
1
25
40
.
3
%
36
.
2
%
2019
21
20
%
2022
24
30
%
2025
28
40
%
26
/
3
2019
21
2022
24
2025
28
27
/
3
10
17
/
3
26
/
3
21
/
3
22
/
3
21
/
3
ROA
1
.
4
1
.
3
1
.
2
1
.
1
1
.
0
0
.
9
10
8
6
4
2
0
%
%
ROA
18
/
3
19
/
3
20
/
3
21
/
3
22
/
3
23
/
3
24
/
3
25
/
3
26
/
3
29
/
3
27
/
3
28
/
3
Message from Management
Morinaga Milk Group Integrated Report 2026
15
CONTENTS
PROLOGUE
Message from the President,
Chief Executive Officer
Message from
the Officer in Charge of Finance
Message from Management
Chapter
01
Chapter
02
Chapter
03
Chapter
04
Appendix
Message from the Officer in Charge of Finance
ROIC
Message from Management
Morinaga Milk Group Integrated Report 2026
16
CONTENTS
PROLOGUE
Message from the President,
Chief Executive Officer
Message from
the Officer in Charge of Finance
Message from Management
Chapter
01
Chapter
02
Chapter
03
Chapter
04
Appendix
P.18
P.19
P.21
1
P.26
2
Where We Begin
Chapter
01
Morinaga Milk Group Integrated Report 2026
17
CONTENTS
PROLOGUE
Message from Management
1
2
Chapter
01
Chapter
02
Chapter
03
Chapter
04
Appendix
8
1
2
3
4
5
6
7
8
8
Chapter
01
Morinaga Milk Group Integrated Report 2026
18
CONTENTS
PROLOGUE
Message from Management
1
2
Chapter
01
Chapter
02
Chapter
03
Chapter
04
Appendix
1917
MILEI
1917
1947
1949
1955
1971
1972
1978
1978
1993
2014
2019
2025
1976
1921
19721972
19711971
19761976
19171917
19211921
MILEI
2012
2025
28
Merihari
2026
2
Chapter
01
Morinaga Milk Group Integrated Report 2026
19
CONTENTS
PROLOGUE
Message from Management
1
2
Chapter
01
Chapter
02
Chapter
03
Chapter
04
Appendix
2010
350
300
250
200
150
100
50
0
7
,
000
6
,
000
5
,
000
4
,
000
3
,
000
2
,
000
1
,
000
0
05
/
3
06
/
3
07
/
3
08
/
3
09
/
3
25
/
3
24
/
3
23
/
3
22
/
3
21
/
3
20
/
3
19
/
3
18
/
3
17
/
3
16
/
3
15
/
3
14
/
3
13
/
3
12
/
3
11
/
3
10
/
3
26
/
3
%
26
/
3
49
.
3
%
17
/
3
2
.
4
%
6
.
0
5
.
3
5
.
1
4
.
6
4
.
9
5
.
9
4
.
3
3
.
8
2
.
4
1
.
7
1
.
4
1
.
8
3
.
7
1
.
1
1
.
4
1
.
1
1
.
5
3
.
6
2
.
0
1
.
5
2
.
1
1
.
2
16
/
3
22
/
3
15
/
3
20
/
3
22
/
3
23
/
3
25
/
3
2025
28
26
/
3
SKU
2
16
/
3
19
/
3
170
175
Chapter
01
Morinaga Milk Group Integrated Report 2026
20
CONTENTS
PROLOGUE
Message from Management
1
2
Chapter
01
Chapter
02
Chapter
03
Chapter
04
Appendix
M&A
26
/
3
19
.
4
%
2026
/
3
MILEI
NutriCo Morinaga
MNF-Vietnam
MNF
P.
77
TOFU
MNF
BtoB
MILEI
NutriCo Morinaga
MNF -Vietnam
1
,
500
1
,
200
900
600
300
0
20
.
0
%
16
.
0
%
12
.
0
%
8
.
0
%
4
.
0
%
0
.
0
%
2025
3
201
https://www.morinagamilk.co.jp/ir/library/business.html
2022
/
3
2021
/
3
4
2021
2023
2021
/
3
2022
/
3
2023
/
3
2024
/
3
2025
/
3
2026
/
3
6
.
4
%
8
.
7
%
11
.
3
%
11
.
0
%
12
.
5
%
19
.
4
%
15
.
3
%
15
.
0
%
14
.
3
%
17
.
1
%
10
.
2
%
10
.
7
%
368
439
594
604
699
875
55
63
101
62
75
170
MILEI
2026
3
1
Chapter
01
Morinaga Milk Group Integrated Report 2026
21
CONTENTS
PROLOGUE
Message from Management
1
2
Chapter
01
Chapter
02
Chapter
03
Chapter
04
Appendix
MILEI GmbH
MILEI
BtoB
Absolute Reports
2025
2022
2024
2022
12
1972
MILEI
4
2012
2014
2016
2018
2021
2022
2024
/
3
2025
/
3
2026
/
3
2027
/
3
364
407
561
517
40
,
000
t
40
,
000
t
25
,
000
t
25
,
000
t
15
,
000
t
15
,
000
t
6
,
500
t
6
,
500
t
170
t
170
t
MILEI
2025
28
MILEI GmbH WEB
https://www.milei.de/
MILEI
Chapter
01
Morinaga Milk Group Integrated Report 2026
22
CONTENTS
PROLOGUE
Message from Management
1
2
Chapter
01
Chapter
02
Chapter
03
Chapter
04
Appendix
BtoB
1978
2017
NutriCo Morinaga
2019
2023
P.
26
1921
18
/
3
=
100
18
/
3
100
21
/
3
22
/
3
2025
28
Point
1
/
Point
2
Point
3
2025
/
3
2029
/
3
100
%
2025
28
Point
1
Point
2
Point
3
2025
/
3
2029
/
3
18
/
3
20
/
3
22
/
3
24
/
3
26
/
3
29
/
3
100
135
165
198
475
298
25
%
25
/
3
100
%
2024
/
3
2025
/
3
2026
/
3
2027
/
3
68
79
88
96
NutriCo Morinaga
70
%
Chapter
01
Morinaga Milk Group Integrated Report 2026
23
CONTENTS
PROLOGUE
Message from Management
1
2
Chapter
01
Chapter
02
Chapter
03
Chapter
04
Appendix
Morinaga Nutritional Foods
MNF
Morinaga Nutritional Foods Vietnam
MNFV
1985
TOFU
2023
MNF
Turtle Island Foods
TIF
Tofurky
2021
M&A
100
%
OEM
2025
3
TIF
2025
28
2026
3
2025
28
25
/
3
1
2024
/
3
2025
/
3
2026
/
3
2027
/
3
74
98
93
94
1977
Smiles & Health for Children
2024
/
3
2025
/
3
2026
/
3
2027
/
3
43
43
45
48
MNF WEB
https://www.morinu.com/
MNFV WEB
https://morinaga-nf.com.vn/en/
1980
TOFU
MNF
MNFV
Chapter
01
Morinaga Milk Group Integrated Report 2026
24
CONTENTS
PROLOGUE
Message from Management
1
2
Chapter
01
Chapter
02
Chapter
03
Chapter
04
Appendix
MILEI
NutriCo Morinaga
2022
26
/
3
11
%
2025
28
MILEI
2026
3
25
/
3
BtoC
4
201
BtoC
Answer
Answer
Answer
Chapter
01
Morinaga Milk Group Integrated Report 2026
25
CONTENTS
PROLOGUE
Message from Management
1
2
Chapter
01
Chapter
02
Chapter
03
Chapter
04
Appendix
50
2006
2025
1996
2010
2
Chapter
01
Morinaga Milk Group Integrated Report 2026
26
CONTENTS
PROLOGUE
Message from Management
1
2
Chapter
01
Chapter
02
Chapter
03
Chapter
04
Appendix
2025
28
30
100
BtoB
3
BtoB
Chapter
01
Morinaga Milk Group Integrated Report 2026
27
CONTENTS
PROLOGUE
Message from Management
1
2
Chapter
01
Chapter
02
Chapter
03
Chapter
04
Appendix
2025
4
2026
4
3
2026
1
PubMed
WEB
50
50
1
NutraIngredients-Asia Awards
Vitafoods Innovation Awards
BtoB
GRAS
BtoB
2025
28
100
%
25
/
3
2025
4
2025
4
https://www.morinagamilk.co.jp/products/brand/b-kin/
P.
35
Chapter
01
CONTENTS
PROLOGUE
Message from Management
1
2
Chapter
01
Chapter
02
Chapter
03
Chapter
04
Appendix
P.30
P.31
P.33
2025
28
P.40
How We Create Value
Chapter
02
Morinaga Milk Group Integrated Report 2026
29
CONTENTS
PROLOGUE
Message from Management
Chapter
01
202528
Chapter
02
Chapter
03
Chapter
04
Appendix
P.
33
P.
40
2030
P.
66
Business Activities
Corporate Slogan
Input
P.
31
Output
1
29
/
3
2
31
/
3
7
%
1
ROE
10
%
1
15
%
1
Scope
1
2
CO
2
50
%
2
Scope
3
GHG
10
%
2
Outcome
1
Morinaga Milk Group Integrated Report 2026
30
CONTENTS
PROLOGUE
Message from Management
Chapter
01
202528
Chapter
02
Chapter
03
Chapter
04
Appendix
https://www.morinagamilk.co.jp/sustainability/management/
1975
110
https://www.angel110.jp/
https://www.morinagamilk.co.jp/customer/
https://www.morinagamilk.co.jp/learn_enjoy/quality_safety/
2025
28
2030
KPI
26
/
3
26
/
3
0
P.
32
P.
38
NEXT
PAG E
Web
milushi
https://milushi.morinagamilk.co.jp/
https://www.morinagamilk.co.jp/release/newsentry-4576.html
https://www.morinagamilk.co.jp/release/newsentry-4630.html
3
R
P.
78
DE&I
P.
51
P.
78
P.
26
P.
13
P.
33
2025
28
Chapter
02
Morinaga Milk Group Integrated Report 2026
31
CONTENTS
PROLOGUE
Message from Management
Chapter
01
202528
Chapter
02
Chapter
03
Chapter
04
Appendix
2026
3
M
https://www.morinagamilk.co.jp/corporate/vision/brand/
3
POINT
3
to
®
®
2026
4
to
®
®
2026
5
!
&
in
SC
Q
2024
M
Answer
M
M
Chapter
02
Morinaga Milk Group Integrated Report 2026
32
CONTENTS
PROLOGUE
Message from Management
Chapter
01
202528
Chapter
02
Chapter
03
Chapter
04
Appendix
2019-21
2022-24
2025-28
2029
3
8
5
10
ROE
1
10
7
15
10
/
2025
28
2025
28
Merihari
1
25
/
3
2
31
/
3
A
25
/
3
29
/
3
297297
440440
+
130
+
130
+
80
+
80
117
117
+
50
+
50
25
/
3
1
26
/
3
29
/
3
5
,
6125
,
7156
,
300
297345440
5
.
3
%
6
.
0
%
7
.
0
%
12
.
5
%
15
.
3
%
15
%
ROE
2
.
0
%
8
.
4
%
10
%
ROIC
5
.
7
%
6
.
3
%
7
.
0
%
BBBBB
2
Chapter
02
Morinaga Milk Group Integrated Report 2026
33
CONTENTS
PROLOGUE
Message from Management
Chapter
01
202528
Chapter
02
Chapter
03
Chapter
04
Appendix
2025
28
MILEI
PBF
26
/
3
25
/
3
26
/
3
29
/
3
25
/
3
26
/
3
29
/
3
1
,
1831
,
2455
.
2
%
1
,
55013812610
.
1
%
200
3
,
5303
,
6503
.
4
%
3
,
7501372005
.
5
%
200
899820
8
.
8
%
1
,
00022192
.
3
%
40
5
,
6125
,
7151
.
8
%
6
,
3002973456
.
0
%
440
4
,
9134
,
840
1
.
5
%
5
,
3502221753
.
6
%
290
69987525
.
1
%
9507517019
.
4
%
150
25
/
3
29
/
3
20
%
29
/
3
25
/
3
20
%
50
%
:
W
:
26
/
3
:
50
%
2
%
26
/
3
1
25
/
3
Chapter
02
Morinaga Milk Group Integrated Report 2026
34
CONTENTS
PROLOGUE
Message from Management
Chapter
01
202528
Chapter
02
Chapter
03
Chapter
04
Appendix
25
/
3
29
/
3
20
%
29
/
3
25
/
3
:
2025
:
MOW
27
/
3
:PARM
:
Variche
2025
28
+
20
%
10
%+
20
%
/
25
/
3
25
/
3
29
/
3
29
/
3
100
%
70
%
26
/
3
25
%
US
120
M
150
M
250
M
'
23
-'
2811
.
3
%
6
.
8
%
2
.
7
%
1978
2010
1979
'
23
-'
2812
.
1
%
0
.
8
%
1
.
1
%
Giract's Global Probiotic Cultures
2023
2028
Report
Euromonitor International
3
%
26
/
3
1
25
%
26
/
3
1
BF-
1
7
%
26
/
3
1
Chapter
02
Morinaga Milk Group Integrated Report 2026
35
CONTENTS
PROLOGUE
Message from Management
Chapter
01
202528
Chapter
02
Chapter
03
Chapter
04
Appendix
2025
26
/
3
P.
57
P.
26
P.
13
29
/
3
2
33
/
3
2027
4
26
/
3
2025
9
2026
3
2027
3
2027
3
25
%
26
/
3
28
/
3
27
/
3
29
/
3
50
2025
28
440
50
P.
33
2025
28
Chapter
02
CONTENTS
PROLOGUE
Message from Management
Chapter
01
202528
Chapter
02
Chapter
03
Chapter
04
Appendix
2025
28
ROIC
29
/
3
7
%
26
/
3
26
/
3
ROIC
6
.
3
%
25
/
3
5
.
7
%
P.
70
P.
51
26
/
3
ROIC
7
%
2025
28
AI
IT
CCC
ROIC
7
%
29
/
3
Chapter
02
Morinaga Milk Group Integrated Report 2026
37
CONTENTS
PROLOGUE
Message from Management
Chapter
01
202528
Chapter
02
Chapter
03
Chapter
04
Appendix
1
M&A
R&D
WACC
2
NetDER
0
.
4
0
.
5
3
40
%
30
%
26
/
3
100
26
/
3
2025
5
2026
5
2
,
000
CF
1
,
000
1
,
800
1
,
600
200
700
700
500
500
NetDER
26
/
3
0
.
33
26
/
3
36
.
2
%
26
/
3
100
2026
5
200
500500
MILEI
100
150
500350
150
800750
1
,
8001
,
600
M
A
700700
2
,
5002
,
300
30
/
3
https://www.morinagamilk.co.jp/ir/management/cost.html
2025
28
https://www.morinagamilk.co.jp/ir/management/plan.html
2025
28
Chapter
02
Morinaga Milk Group Integrated Report 2026
38
CONTENTS
PROLOGUE
Message from Management
Chapter
01
202528
Chapter
02
Chapter
03
Chapter
04
Appendix
CF
1
4
2
,
000
26
/
3
357
CCC
2
40
2026
4
2026
9
MILEI
MILEI
CF
CCC
2
27
/
3
Answer
Answer
26
/
3
27
/
3
5
,
7155
,
800
85
1
.
5
%
345320257
.
2
%
3713274411
.
9
%
2262002611
.
5
%
https://www.morinagamilk.co.jp/ir/library/presentation.html
P.
33
P.
38
1
2
2025
28
Answer
2025
28
Chapter
02
Morinaga Milk Group Integrated Report 2026
39
CONTENTS
PROLOGUE
Message from Management
Chapter
01
202528
Chapter
02
Chapter
03
Chapter
04
Appendix
27
/
3
2025
28
29
/
3
2030
KPI
10
3
5
P.
46
Chapter
02
Morinaga Milk Group Integrated Report 2026
40
CONTENTS
PROLOGUE
Message from Management
Chapter
01
202528
Chapter
02
Chapter
03
Chapter
04
Appendix
2025
28
Q
10
2026
Answer
CSR
CSR
2021
2022
2025
2026
CSR
TCFD
CSR
CSR
2016
100
2017
2023
SSBJ
SWGs
2030
2022
2022
2023
ESG
FTSE
MSCI
2023
KPI
2025
2030
29
/
3
2025
28
PRI
2006
2015
SDGs
2015
2021
KPI
2021
7
%
ROE
10
%
15
%
2029
3
10
2030
Chapter
02
Morinaga Milk Group Integrated Report 2026
41
CONTENTS
PROLOGUE
Message from Management
Chapter
01
202528
Chapter
02
Chapter
03
Chapter
04
Appendix
Q
3
4
NGO
2
7
3
Answer
Theme
1
Theme
2
Theme
3
5
3
1
GRI
SASB
ISO
26000
SDGs
Chapter
02
Morinaga Milk Group Integrated Report 2026
42
CONTENTS
PROLOGUE
Message from Management
Chapter
01
202528
Chapter
02
Chapter
03
Chapter
04
Appendix
Q
26
/
3
Answer
2
4
Q
KPI
P.
44
5
PBR
Answer
2030
25
/
3
6
DE&I
2030
Chapter
02
Morinaga Milk Group Integrated Report 2026
43
CONTENTS
PROLOGUE
Message from Management
Chapter
01
202528
Chapter
02
Chapter
03
Chapter
04
Appendix
Theme
1
26
/
3
29
/
3
31
/
3
22
/
3
1
1
.
3
1
.
5
1
.
7
22
/
3
31
/
3
26
/
3
18
3
62
6
100
100
713
23
/
3
1
/
4
500
mg
Functional Foods in Health and Disease
2
International Journal of Molecular Sciences
3
14
.
8
%
23
%
25
%
3
22
.
2
%
28
%
30
%
FSSC
22000
GFSI
4
100
%
100
%
100
%
0
0
0
Theme
2
26
/
3
29
/
3
31
/
3
Scope
1
+
2
CO
2
14
/
3
41
.
7
%
38
.
6
%
50
%
Scope
3
GHG
21
/
3
12
.
0
%
7
.
5
%
5
10
%
BCP
BCP
100
%
6
100
%
100
%
ISO
14001
100
%
100
%
100
%
14
/
3
26
.
5
%
24
%
25
%
97
.
7
%
98
%
14
/
3
11
.
0
%
13
%
5
15
%
96
.
4
%
99
%
100
%
2030
Chapter
02
Morinaga Milk Group Integrated Report 2026
44
CONTENTS
PROLOGUE
Message from Management
Chapter
01
202528
Chapter
02
Chapter
03
Chapter
04
Appendix
Theme
3
26
/
3
29
/
3
31
/
3
1
1
9
.
0
%
15
%
20
%
104
.
1
%
100
%
100
%
500
®
NPO
0
0
0
BBBBA
4
.
5
/
/
4
.
8
/
/
5
/
/
22
/
3
31
/
3
26
/
3
6
4
12
9
8
10
100
%
100
%
100
%
RSPO
83
.
0
%
7
100
%
100
%
29
/
3
FSC
99
.
7
%
98
%
100
%
41
.
5
%
76
%
100
%
223
390
500
1
Topics
https://www.morinagamilk.co.jp/sustainability/food_and_well-being/
2
2026
3
16
WEB
PubMed
3
4
5
2026
5
6
BCP
7
RSPO
26
/
3
2030
26
/
3
29
/
3
31
/
3
Chapter
02
Morinaga Milk Group Integrated Report 2026
45
CONTENTS
PROLOGUE
Message from Management
Chapter
01
202528
Chapter
02
Chapter
03
Chapter
04
Appendix
2030
1
.
5
5
KPI
1
1
1
2
2
.
2026
1
GMP
FSSC
22000
FSSC
22000
100
%
1
2026
1
PubMed
WEB
2
Elsevier
SCOPUS
lactoferrin
2026
3
16
22
/
3
23
/
3
24
/
3
25
/
3
27
/
3
28
/
3
29
/
3
30
/
3
26
/
3
31
/
3
5
1
.
11
.
1
1
.
2
1
.
3
1
.
7
1
.
5
2021
2030
3
Q
2026
3
1
Answer
https://www.morinagamilk.co.jp/learn_enjoy/research/
Chapter
02
Morinaga Milk Group Integrated Report 2026
46
CONTENTS
PROLOGUE
Message from Management
Chapter
01
202528
Chapter
02
Chapter
03
Chapter
04
Appendix
TCFD
https://www.morinagamilk.co.jp/sustainability/resources_and_the_environment/tcfd/
TNFD
https://www.morinagamilk.co.jp/sustainability/resources_and_the_environment/tnfd/
2050
CO
2
GHG
https://www.morinagamilk.co.jp/sustainability/resources_and_the_environment/
#accordion-1-heading-1
1
.
TCFD
26
/
3
TCFD
1
.
5
4
2030
2050
ICP
2
.
TCFD
TCFD
1
24
53
2025
9
16
%
2025
3
2026
6
1
.
5
4
2030
2050
2
2
2030
2030
EC
Chapter
02
Morinaga Milk Group Integrated Report 2026
47
CONTENTS
PROLOGUE
Message from Management
Chapter
01
202528
Chapter
02
Chapter
03
Chapter
04
Appendix
3
.
26
/
3
GHG
GHG
2026
2030
2
1
2
1
/
GHG
GHG
1
2
3
Chapter
02
Morinaga Milk Group Integrated Report 2026
48
CONTENTS
PROLOGUE
Message from Management
Chapter
01
202528
Chapter
02
Chapter
03
Chapter
04
Appendix
PDCA
FR
2024
Smile Together PROJECT
Future Generations
2030
1
.
26
/
3
JaCER
SWGs
Well-being Initiative
2025
10
SDGs
SWGs
Sustainable Well-being Goals
2
.
https://www.morinagamilk.co.jp/learn_enjoy/factory_tour/
https://www.morinagamilk.co.jp/sustainability/people_and_society/pdf/strategy_map.pdf
Smile Together Project
https://youtu.be/DS_cpb6_l7A?si=E5wRn5IsyXYwXWJY
Chapter
02
Morinaga Milk Group Integrated Report 2026
49
CONTENTS
PROLOGUE
Message from Management
Chapter
01
202528
Chapter
02
Chapter
03
Chapter
04
Appendix
P.51
P.55
DX
P.57
What Powers Our Journey
Chapter
03
Morinaga Milk Group Integrated Report 2026
50
CONTENTS
PROLOGUE
Message from Management
Chapter
01
Chapter
02
DX
Chapter
03
Chapter
04
Appendix
DE&I
3
DE&I
DE&I
DE&I
2025
28
Chapter
03
Morinaga Milk Group Integrated Report 2026
51
CONTENTS
PROLOGUE
Message from Management
Chapter
01
Chapter
02
DX
Chapter
03
Chapter
04
Appendix
2025
HOPE
SOON
READY
3
HOPE
SOON
READY
200200
2026
6
5050
1212
2026
6
Chapter
03
Morinaga Milk Group Integrated Report 2026
52
CONTENTS
PROLOGUE
Message from Management
Chapter
01
Chapter
02
DX
Chapter
03
Chapter
04
Appendix
26
/
3
6
25
/
3
B
29
/
3
BBB
31
/
3
A
Morinaga Milk Awards
2018
1
Mori
NEW
2022
359
2026
3
2026
4245485255586167
CCCCCCBAAAAAABBBBB
25
/
3
B
49
.
9
31
/
3
A
26
/
3
B
51
.
8
1
.
9
29
/
3
BBB
26
/
3
6
Chapter
03
Morinaga Milk Group Integrated Report 2026
53
CONTENTS
PROLOGUE
Message from Management
Chapter
01
Chapter
02
DX
Chapter
03
Chapter
04
Appendix
2025
28
23
/
3
24
/
3
25
/
3
26
/
3
KPI
BBBB
BBB
29
/
3
A
31
/
3
20
%
30
%
25
/
3
29
/
3
5
.
8
%
6
.
3
%
7
.
2
%
9
.
0
%
15
%
29
/
3
20
%
31
/
3
1
90
.
5
%
95
.
8
%
91
.
5
%
104
.
1
%
100
%
31
/
3
3
.
1
3
.
4
4
.
3
4
.
5
5
/
/
31
/
3
2
20
.
3
%
22
.
3
%
22
.
5
%
27
.
0
%
15
%
26
/
3
DE&I
LADY,
GO UP!
CEO
Answer
Answer
Answer
Answer
25
/
3
PBR
26
/
3
2025
28
Answer
Q
1
2
Chapter
03
Morinaga Milk Group Integrated Report 2026
54
CONTENTS
PROLOGUE
Message from Management
Chapter
01
Chapter
02
DX
Chapter
03
Chapter
04
Appendix
DX
DX
DX
10
KPI
AI
AI
10
2024
DX
AI
AI
AI
2026
6
DX
STEP
1
2026
3
Step
2
2028
3
Step
3
2029
3
IT
DX
10
VISION
1
VISION
2
VISION
3
AI
Chapter
03
CONTENTS
PROLOGUE
Message from Management
Chapter
01
Chapter
02
DX
Chapter
03
Chapter
04
Appendix
DX
DX
KPI
IT
DX
DX
KPI
26
/
3
40
%
3
.
3
25
/
3
26
/
3
AI
OT
AI
IT
DX
IT
IT
:
3
.
1
pt
26
/
3
5
.
0
pt
DX
IT
158
26
/
3
DX
DX
2026
6
29
/
3
26
/
3
DX Creator
100
1
2
/
20
DX Leader
700
2
3
/
1
194
:
63
DX Member
5
,
600
80
%
2
,
882
38
%
:
1
,
734
DX Entry
DX
6
,
390
85
%
:
5
,
972
AI
PARM
MOW
2025
4
AI
26
/
3
DX
DX
DX
TOPICS
Chapter
03
Morinaga Milk Group Integrated Report 2026
56
CONTENTS
PROLOGUE
Message from Management
Chapter
01
Chapter
02
DX
Chapter
03
Chapter
04
Appendix
2025
4
HAPPY
If I were you
SNS
DX
Web
AI
2025
4
2027
4
Happy
1
2025
28
4
26
/
3
Chapter
03
Morinaga Milk Group Integrated Report 2026
57
CONTENTS
PROLOGUE
Message from Management
Chapter
01
Chapter
02
DX
Chapter
03
Chapter
04
Appendix
P.59
3
P.62
P.65
P.66
P.71
P.72
Supporting Our Value Journey
Chapter
04
Morinaga Milk Group Integrated Report 2026
58
CONTENTS
PROLOGUE
Message from Management
Chapter
01
Chapter
02
Chapter
03
3
Chapter
04
Appendix
2
0
2
5
2
8
1
CEO
3
Chapter
04
CONTENTS
PROLOGUE
Message from Management
Chapter
01
Chapter
02
Chapter
03
3
Chapter
04
Appendix
2
0
2
5
4
2
0
2
6
4
I
R
3
1
2
3
Chapter
04
Morinaga Milk Group Integrated Report 2026
60
CONTENTS
PROLOGUE
Message from Management
Chapter
01
Chapter
02
Chapter
03
3
Chapter
04
Appendix
Chapter
04
Morinaga Milk Group Integrated Report 2026
61
CONTENTS
PROLOGUE
Message from Management
Chapter
01
Chapter
02
Chapter
03
3
Chapter
04
Appendix
1
CEO
2
3
4
5
6
8
7
10
9
11
12
13
14
15
45
.
5
%
5
54
.
5
%
6
26
.
7
%
4
73
.
3
%
11
8
6
5
4
2
3
12
14
15
2026
6
25
1
7
11
13
10
9
2026
6
25
2026
6
25
Chapter
04
Morinaga Milk Group Integrated Report 2026
62
CONTENTS
PROLOGUE
Message from Management
Chapter
01
Chapter
02
Chapter
03
3
Chapter
04
Appendix
11
450
100
%
13
13
1983
2011
2015
2021
2026
CEO
J
CEO
5
165
100
%
13
13
1989
2016
2018
2021
2025
4
150
100
%
13
13
1988
2016
2019
2020
2021
2022
2026
5
221
100
%
13
13
1984
2015
2021
2023
1
56
100
%
10
10
1985
1996
U FJ
2002
2016
2019
IR
2020
2025
2025
6
24
100
%
13
13
1981
2011
2020
3
10
100
%
13
13
1977
SUBARU
2011
2018
2024
6
2023
2024
185
%
1989
2018
2020
2024
2025
2026
2026
6
25
Chapter
04
1
5
2
6
3
7
4
8
Morinaga Milk Group Integrated Report 2026
63
CONTENTS
PROLOGUE
Message from Management
Chapter
01
Chapter
02
Chapter
03
3
Chapter
04
Appendix
28
%
1986
2013
2015
2016
2018
2020
2021
2022
2026
2
10
100
%
14
14
1989
1993
2022
2024
7
9
100
%
14
14
1984
1990
2004
12
2005
2025
2
2019
2025
4
6
100
%
13
13
1981
1993
2000
2002
GmbH
2022
2
46
100
%
14
14
1984
2010
2016
2018
2020
2022
2024
4
11
100
%
13
13
1981
2003
2011
2014
2022
1
1
100
%
10
10
1988
2014
2023
2024
Group Executive Specialist
2025
2026
6
25
Chapter
04
12
1110
151413
9
Morinaga Milk Group Integrated Report 2026
64
CONTENTS
PROLOGUE
Message from Management
Chapter
01
Chapter
02
Chapter
03
3
Chapter
04
Appendix
10
10
Chapter
04
Morinaga Milk Group Integrated Report 2026
65
CONTENTS
PROLOGUE
Message from Management
Chapter
01
Chapter
02
Chapter
03
3
Chapter
04
Appendix
https://www.morinagamilk.co.jp/ir/management/governance.html
https://www.morinagamilk.co.jp/ir/management/governance_board.html
2026
6
25
12
4
2026
6
25
11
6
5
4
2
2
2026
6
25
1
CEO
Chapter
04
Morinaga Milk Group Integrated Report 2026
66
CONTENTS
PROLOGUE
Message from Management
Chapter
01
Chapter
02
Chapter
03
3
Chapter
04
Appendix
2026
6
25
26
/
3
13
26
/
3
2025
28
2025
25
/
3
26
/
3
24
/
3
25
/
3
P.
70
2026
Chapter
04
Morinaga Milk Group Integrated Report 2026
67
CONTENTS
PROLOGUE
Message from Management
Chapter
01
Chapter
02
Chapter
03
3
Chapter
04
Appendix
2026
6
25
26
/
3
14
26
/
3
2
26
/
3
2
26
/
3
4
CEO
4
2
26
/
3
20
26
/
3
11
CEO
Chapter
04
Morinaga Milk Group Integrated Report 2026
68
CONTENTS
PROLOGUE
Message from Management
Chapter
01
Chapter
02
Chapter
03
3
Chapter
04
Appendix
50
%
30
%
20
%
2025
2024
2026
2025
2027
2026
50
%
30
%
30
%
50
%
50
%
40
%ROE
30
%ROE
30
%
ROE
30
%
20
%
20
%
20
%
FTSE
50
%
FTSE
30
%FTSE
15
%
MSCI
30
%MSCI
15
%
MSCI
50
%TSR
40
%
TSR
40
%
30
%
1
2
2025
28
2025
6
26
2
18
2025
7
17
6
18
,
700
26
/
3
6
153
78
62
294
5
53
53
2
48
48
2
19
19
15
275
78
62
416
36
2003
6
27
80
8
120
30
,
000
2018
6
28
95
9
2
6
2015
6
26
92
4
2
2026
6
25
2026
7
1
1
4
Chapter
04
Morinaga Milk Group Integrated Report 2026
69
CONTENTS
PROLOGUE
Message from Management
Chapter
01
Chapter
02
Chapter
03
3
Chapter
04
Appendix
CEO
CEO
Q
CEO
Answer
ROIC
7
%
25
/
3
29
/
3
5
50
%
2024
3
%
%
2026
3
4
.
6
%
50
%
2025
3
2024
3
2026
3
2029
3
42
.
8
%
0
10
20
30
40
50
44
.
0
%
%
2026
6
25
Chapter
04
Morinaga Milk Group Integrated Report 2026
70
CONTENTS
PROLOGUE
Message from Management
Chapter
01
Chapter
02
Chapter
03
3
Chapter
04
Appendix
CSR
IR
400
IR
2025
28
P.
37
FR
P.
49
26
/
3
432
https://www.morinagamilk.co.jp/sustainability/policy/
26
/
3
26
/
3
https://ssl4.eir-parts.net/doc/2264/ir_material_for_fiscal_ym4/197358/00.pdf
Chapter
04
Morinaga Milk Group Integrated Report 2026
71
CONTENTS
PROLOGUE
Message from Management
Chapter
01
Chapter
02
Chapter
03
3
Chapter
04
Appendix
https://www.morinagamilk.co.jp/ir/management/risk.html
URL
BCP
BCP
11
12
13
14
6
7
8
9
10
1
2
3
4
5
CEO
CSIRT
Chapter
04
Morinaga Milk Group Integrated Report 2026
72
CONTENTS
PROLOGUE
Message from Management
Chapter
01
Chapter
02
Chapter
03
3
Chapter
04
Appendix
10
,
000
8
,
000
6
,
000
4
,
000
2
,
000
0
21
/
3
22
/
3
23
/
3
24
/
3
25
/
3
26
/
3
7
,
801
8
,
188
8
,
051
7
,
187
8
,
151
7
,
280
NIST
Cybersecurity Framework
2
.
0
6
26
/
3
EDR
Endpoint Detection and Response
SIEM
SOC
Security Operation Center
ID
Web
25
/
3
CSIRT
CSIRT
e-
26
/
3
IT
26
/
3
4
e-
7
,
622
8
,
757
e-
Chapter
04
Morinaga Milk Group Integrated Report 2026
73
CONTENTS
PROLOGUE
Message from Management
Chapter
01
Chapter
02
Chapter
03
3
Chapter
04
Appendix
P.75
11
P.77
P.78
P.79
Data Section
Appendix
Morinaga Milk Group Integrated Report 2026
74
CONTENTS
PROLOGUE
Message from Management
Chapter
01
Chapter
02
Chapter
03
Chapter
04
11
Appendix
11
2016
/
3
2017
/
3
2018
/
3
1
2019
/
3
1
2020
/
3
2021
/
3
2
2022
/
3
3
2023
/
3
2
2024
/
3
2025
/
3
2026
/
3
601
,
499592
,
617592
,
087583
,
582590
,
892583
,
550503
,
354525
,
603547
,
059561
,
173571
,
458
419
,
454399
,
286402
,
139398
,
337401
,
538393
,
478381
,
077407
,
308415
,
100426
,
120428
,
198
14
,
31721
,
09921
,
68422
,
33125
,
35928
,
86729
,
79223
,
93927
,
83929
,
65834
,
479
%
2
.
43
.
63
.
73
.
84
.
34
.
95
.
94
.
65
.
15
.
36
.
0
14
,
95921
,
96022
,
35523
,
17425
,
86730
,
10931
,
12725
,
21828
,
10429
,
86437
,
121
15
,
78419
,
15323
,
47020
,
23026
,
50625
,
99848
,
29623
,
71988
,
57115
,
28632
,
238
10
,
57613
,
20215
,
78114
,
01718
,
65618
,
74133
,
78216
,
87561
,
3075
,
45922
,
599
4
25
,
42920
,
95624
,
39339
,
37333
,
72923
,
61517
,
98818
,
30738
,
49729
,
92639
,
337
4
16
,
75716
,
79216
,
72317
,
02717
,
63119
,
56619
,
93419
,
93920
,
96321
,
42122
,
381
4
,
9655
,
3624
,
7474
,
6484
,
7794
,
7795
,
0915
,
5585
,
9566
,
1836
,
734
28
,
22337
,
35025
,
11018
,
50629
,
20938
,
54440
,
26819
,
38256
,
583
12
,
45635
,
716
22
,
234
21
,
233
16
,
921
38
,
817
13
,
193
25
,
3058
,
371
25
,
46325
,
223
18
,
786
38
,
870
10
,
449
15
,
243
5
,
77414
,
112
10
,
843
2
,
627
44
,
5222
,
925
38
,
624
5
,
028
503
5
,
98916
,
1178
,
188
20
,
31116
,
01613
,
23848
,
639
6
,
08181
,
806
31
,
243
3
,
154
6
,
2037
,
0779
,
8383
,
3848
,
50519
,
13823
,
48620
,
97664
,
52828
,
55926
,
059
378
,
852385
,
366414
,
823432
,
256436
,
061453
,
646458
,
788487
,
441565
,
998520
,
423547
,
116
5
100
,
38688
,
23588
,
635105
,
45798
,
002101
,
63287
,
04298
,
38281
,
31298
,
707117
,
271
129
,
370142
,
846159
,
102169
,
167183
,
142202
,
503208
,
026228
,
249282
,
135271
,
103279
,
749
%
33
.
836
.
938
.
038
.
741
.
643
.
944
.
945
.
749
.
051
.
250
.
2
ROE
%
8
.
49
.
810
.
58
.
610
.
79
.
816
.
77
.
924
.
52
.
08
.
4
ROIC
%
4
.
26
.
46
.
36
.
06
.
46
.
97
.
05
.
45
.
75
.
76
.
3
D/E
6
0
.
780
.
620
.
560
.
630
.
540
.
510
.
420
.
440
.
290
.
370
.
43
D/E
7
0
.
730
.
570
.
500
.
610
.
490
.
410
.
310
.
350
.
060
.
260
.
33
PER
14
.
115
.
513
.
613
.
311
.
115
.
47
.
612
.
84
.
548
.
217
.
3
Appendix
Morinaga Milk Group Integrated Report 2026
75
CONTENTS
PROLOGUE
Message from Management
Chapter
01
Chapter
02
Chapter
03
Chapter
04
11
Appendix
11
2016
/
3
2017
/
3
2018
/
3
1
2019
/
3
1
2020
/
3
2021
/
3
2
2022
/
3
3
2023
/
3
2
2024
/
3
2025
/
3
2026
/
3
EPS
1
8
42
.
80
107
.
0
53
.
40
133
.
5
319
.
01
159
.
5
283
.
35
141
.
7
377
.
11
188
.
6
378
.
73
189
.
4
687
.
45
343
.
7
373
.
15
186
.
6
696
.
92
696
.
9
64
.
60
64
.
6
276
.
02
276
.
02
1
8
42
.
67
106
.
7
53
.
25
133
.
1
318
.
27
159
.
1
282
.
70
141
.
4
376
.
36
188
.
2
378
.
01
189
.
0
686
.
33
343
.
2
372
.
61
186
.
3
696
.
09
696
.
1
64
.
53
64
.
5
275
.
77
275
.
77
1
8
7
.
0
17
.
5
9
.
0
22
.
5
50
.
0
25
.
0
55
.
0
27
.
5
60
.
0
30
.
0
70
.
0
35
.
0
80
.
0
40
.
0
90
.
0
45
.
0
60
.
0
60
.
0
90
.
0
90
.
0
100
.
00
100
.
0
%
16
.
416
.
915
.
719
.
415
.
918
.
511
.
624
.
18
.
6139
.
336
.
2
2017
10
1
5
1
2023
12
1
1
2
1
2019
/
3
2018
/
3
2
2022
/
3
2024
/
3
2021
/
3
2023
/
3
3
2022
/
3
4
5
6
7
8
2016
/
3
2026
7
1
1
4
2015
/
3
68
MILEI
100
%
68
MILEI
2
SKU
1
,
200
1
,
000
200
100
200
10
DER
0
.
5
20
%
100
MILEI
298
CF
DER
0
.
5
MILEI
2022
2022
24
2023
/
3
2025
/
3
300
30
%
ROE
2025
/
3
ROE
2013
/
3
2015
/
3
2016
/
3
2019
/
3
2020
/
3
2022
/
3
2022
24
2023
/
3
2025
/
3
Appendix
Morinaga Milk Group Integrated Report 2026
76
CONTENTS
PROLOGUE
Message from Management
Chapter
01
Chapter
02
Chapter
03
Chapter
04
11
Appendix
2021
/
3
2022
/
3
2
2023
/
3
3
2024
/
3
2025
/
3
2026
/
3
2027
/
3
5885315325415695786136
%
11
%
13
%
13
%
12
%
12
%
11
%
4663984204434644795055
%
11
%
12
%
11
%
11
%
11
%
11
%
NutriCo Morinaga
687988969
%
NutriCo Morinaga
136142158
5455465035485445365523
%
42
%
42
%
41
%
40
%
38
%
37
%
3522602512652672622734
%
11
%
11
%
10
%
10
%
10
%
10
%
1291261331371371424
%
24625326727226929811
%
MILEI
247298415364407561517
8
%
MILEI
195229295234248305287
6
%
590448434452443410381
7
%
BtoB
8228598681
%
88797372807674
3
%
209192190183161159151
5
%
Morinaga Nutritional Foods
2935749893941
%
Morinaga Nutritional Foods
2526536260
Morinaga Nutritional Foods Vietnam
3548434345488
%
Morinaga Nutritional Foods Vietnam
6
,
8568
,
5847
,
4266
,
9017
,
618
1
1
SRI+
2020
4
2026
3
2
2022
/
3
2022
/
3
2022
24
2022
/
3
3
2023
/
3
2022
/
3
Appendix
Morinaga Milk Group Integrated Report 2026
77
CONTENTS
PROLOGUE
Message from Management
Chapter
01
Chapter
02
Chapter
03
Chapter
04
11
Appendix
2023
/
3
2024
/
3
2025
/
3
2026
/
3
2029
/
3
2031
/
3
Scope
1
+
2
CO
2
14
/
3
%
23
.
027
.
515
.
541
.
738
.
6
%
50
%
Scope
1
-CO
2
205
.
3188
.
2252
.
3231
.
5
Scope
2
-CO
2
88
.
688
.
8105
.
215
.
4
Scope
1
+
2
-CO
2
293
.
9277
.
0357
.
5246
.
8
-CO
2
0
.
6300
.
5690
.
6370
.
432
Scope
3
GHG
21
/
3
%
10
.
09
.
910
.
712
.
07
.
5
%
10
%
Scope
3
-CO
2
e
2
,
088
.
12
,
090
.
42
,
186
.
1
2
,
154
.
0
Scope
1
+
2
2
Scope
3
1
1
Scope
1
,
2
25
/
3
26
/
3
MILEI GmbH
Pacific
Nutritional Foods, Inc.
Morinaga Nutritional Foods Vietnam Joint Stock Company
NutriCo Morinaga
Private
Limited
Turtle Island Foods,
Inc.
Scope
3
2
GHG
2
3
4
:
2
3
.
6
GJ
1000
kWh
2
1
,
658
,
769
MWh
26
/
3
239
,
511
MWh
CO
2
GHG
2023
/
3
2024
/
3
2025
/
3
2026
/
3
2029
/
3
2031
/
3
14
/
3
3
%
22
.
925
.
624
.
926
.
524
%
25
%
m
3
16
,
16915
,
69715
,
49817
,
626
m
3
34
.
732
.
331
.
530
.
8
14
/
3
%
14
.
116
.
617
.
711
.
013
%
15
%
m
3
14
,
90914
,
36314
,
28416
,
328
2
4
MWh
1
,
291
,
1091
,
230
,
4251
,
732
,
1241
,
603
,
006
MWh
2
.
7692
.
5283
.
0872
.
805
39
.
736
.
234
.
534
.
7
2023
/
3
2024
/
3
2025
/
3
2026
/
3
2029
/
3
2031
/
3
5
,
2865
,
5285
,
5115
,
378
1
,
7541
,
8871
,
9421
,
967
7
,
0407
,
4157
,
4537
,
345
2
,
6592
,
6202
,
5972
,
609
666682713767
3
,
3253
,
3023
,
3103
,
376
46515976
%
5
.
86
.
37
.
29
.
015
%
20
%
1
1
:
1
.
121
:
1
.
101
:
1
.
121
:
1
.
12
1
1
:
1
.
191
:
1
.
171
:
1
.
171
:
1
.
20
%
2
.
22
.
82
.
82
.
6
3
%
9
.
010
.
89
.
616
.
8
2
86918676
2
%
90
.
595
.
891
.
5104
.
1100
%
100
%
2
25312832
2
%
100
.
0100
.
0100
.
0100
.
0
2
%
95
.
097
.
496
.
391
.
5
/
3
.
13
.
44
.
34
.
54
.
85
.
0
1
2
3
31
4
1
3
31
2022
6
2023
6
2024
6
2025
6
2026
6
1112111111
%
36
.
433
.
336
.
445
.
545
.
5
1516151515
22244
%
13
.
312
.
513
.
326
.
726
.
7
ESG
ESG
https://www.morinagamilk.co.jp/sustainability/data/
Appendix
Morinaga Milk Group Integrated Report 2026
78
CONTENTS
PROLOGUE
Message from Management
Chapter
01
Chapter
02
Chapter
03
Chapter
04
11
Appendix
2264
4
1
3
31
6
9
30
3
31
288
,
000
,
000
81
,
058
,
132
5
,
121
,
654
28
,
575
U FJ
%
11
,
197
13
.
81
6
,
179
7
.
62
2
,
657
3
.
28
2
,
4453
.
02
2
,
224
2
.
74
1
,
7962
.
22
1
,
3751
.
70
1
,
345
1
.
66
1
,
237
1
.
53
1
,
2001
.
48
2025
/
3
2026
7
1
1
4
2026
3
31
5
,
121
,
654
J-ESOP
E
38
.
0
%
27
.
6
%
18
.
0
%
10
.
5
%
5
.
9
%
45
,
000
30
,
000
15
,
000
0
445566778899101011111212112233
1
,
500
1
,
000
500
0
90
,
000
60
,
000
30
,
000
0
2024
2025
2026
2026
3
31
Appendix
Morinaga Milk Group Integrated Report 2026
79
CONTENTS
PROLOGUE
Message from Management
Chapter
01
Chapter
02
Chapter
03
Chapter
04
11
Appendix
2026
3
31
5
2
1917
6
9
1
1949
24
4
13
21
,
821
3
,
376
2
,
609
767
7
,
345
5
,
378
1
,
967
URL
https://www.morinagamilk.co.jp/
1998
2025
https://www.morinagamilk.co.jp/corporate/map/
https://www.morinagamilk.co.jp/corporate/affiliates/
https://www.morinagamilk.co.jp/corporate/oversea/
https://www.morinagamilk.co.jp/ir/stock/bond.html
IR
TEL
03
6281
4683
https://www.morinagamilk.co.jp/ir/contact/
Appendix
CONTENTS
PROLOGUE
Message from Management
Chapter
01
Chapter
02
Chapter
03
Chapter
04
11
Appendix
www.morinagamilk.co.jp
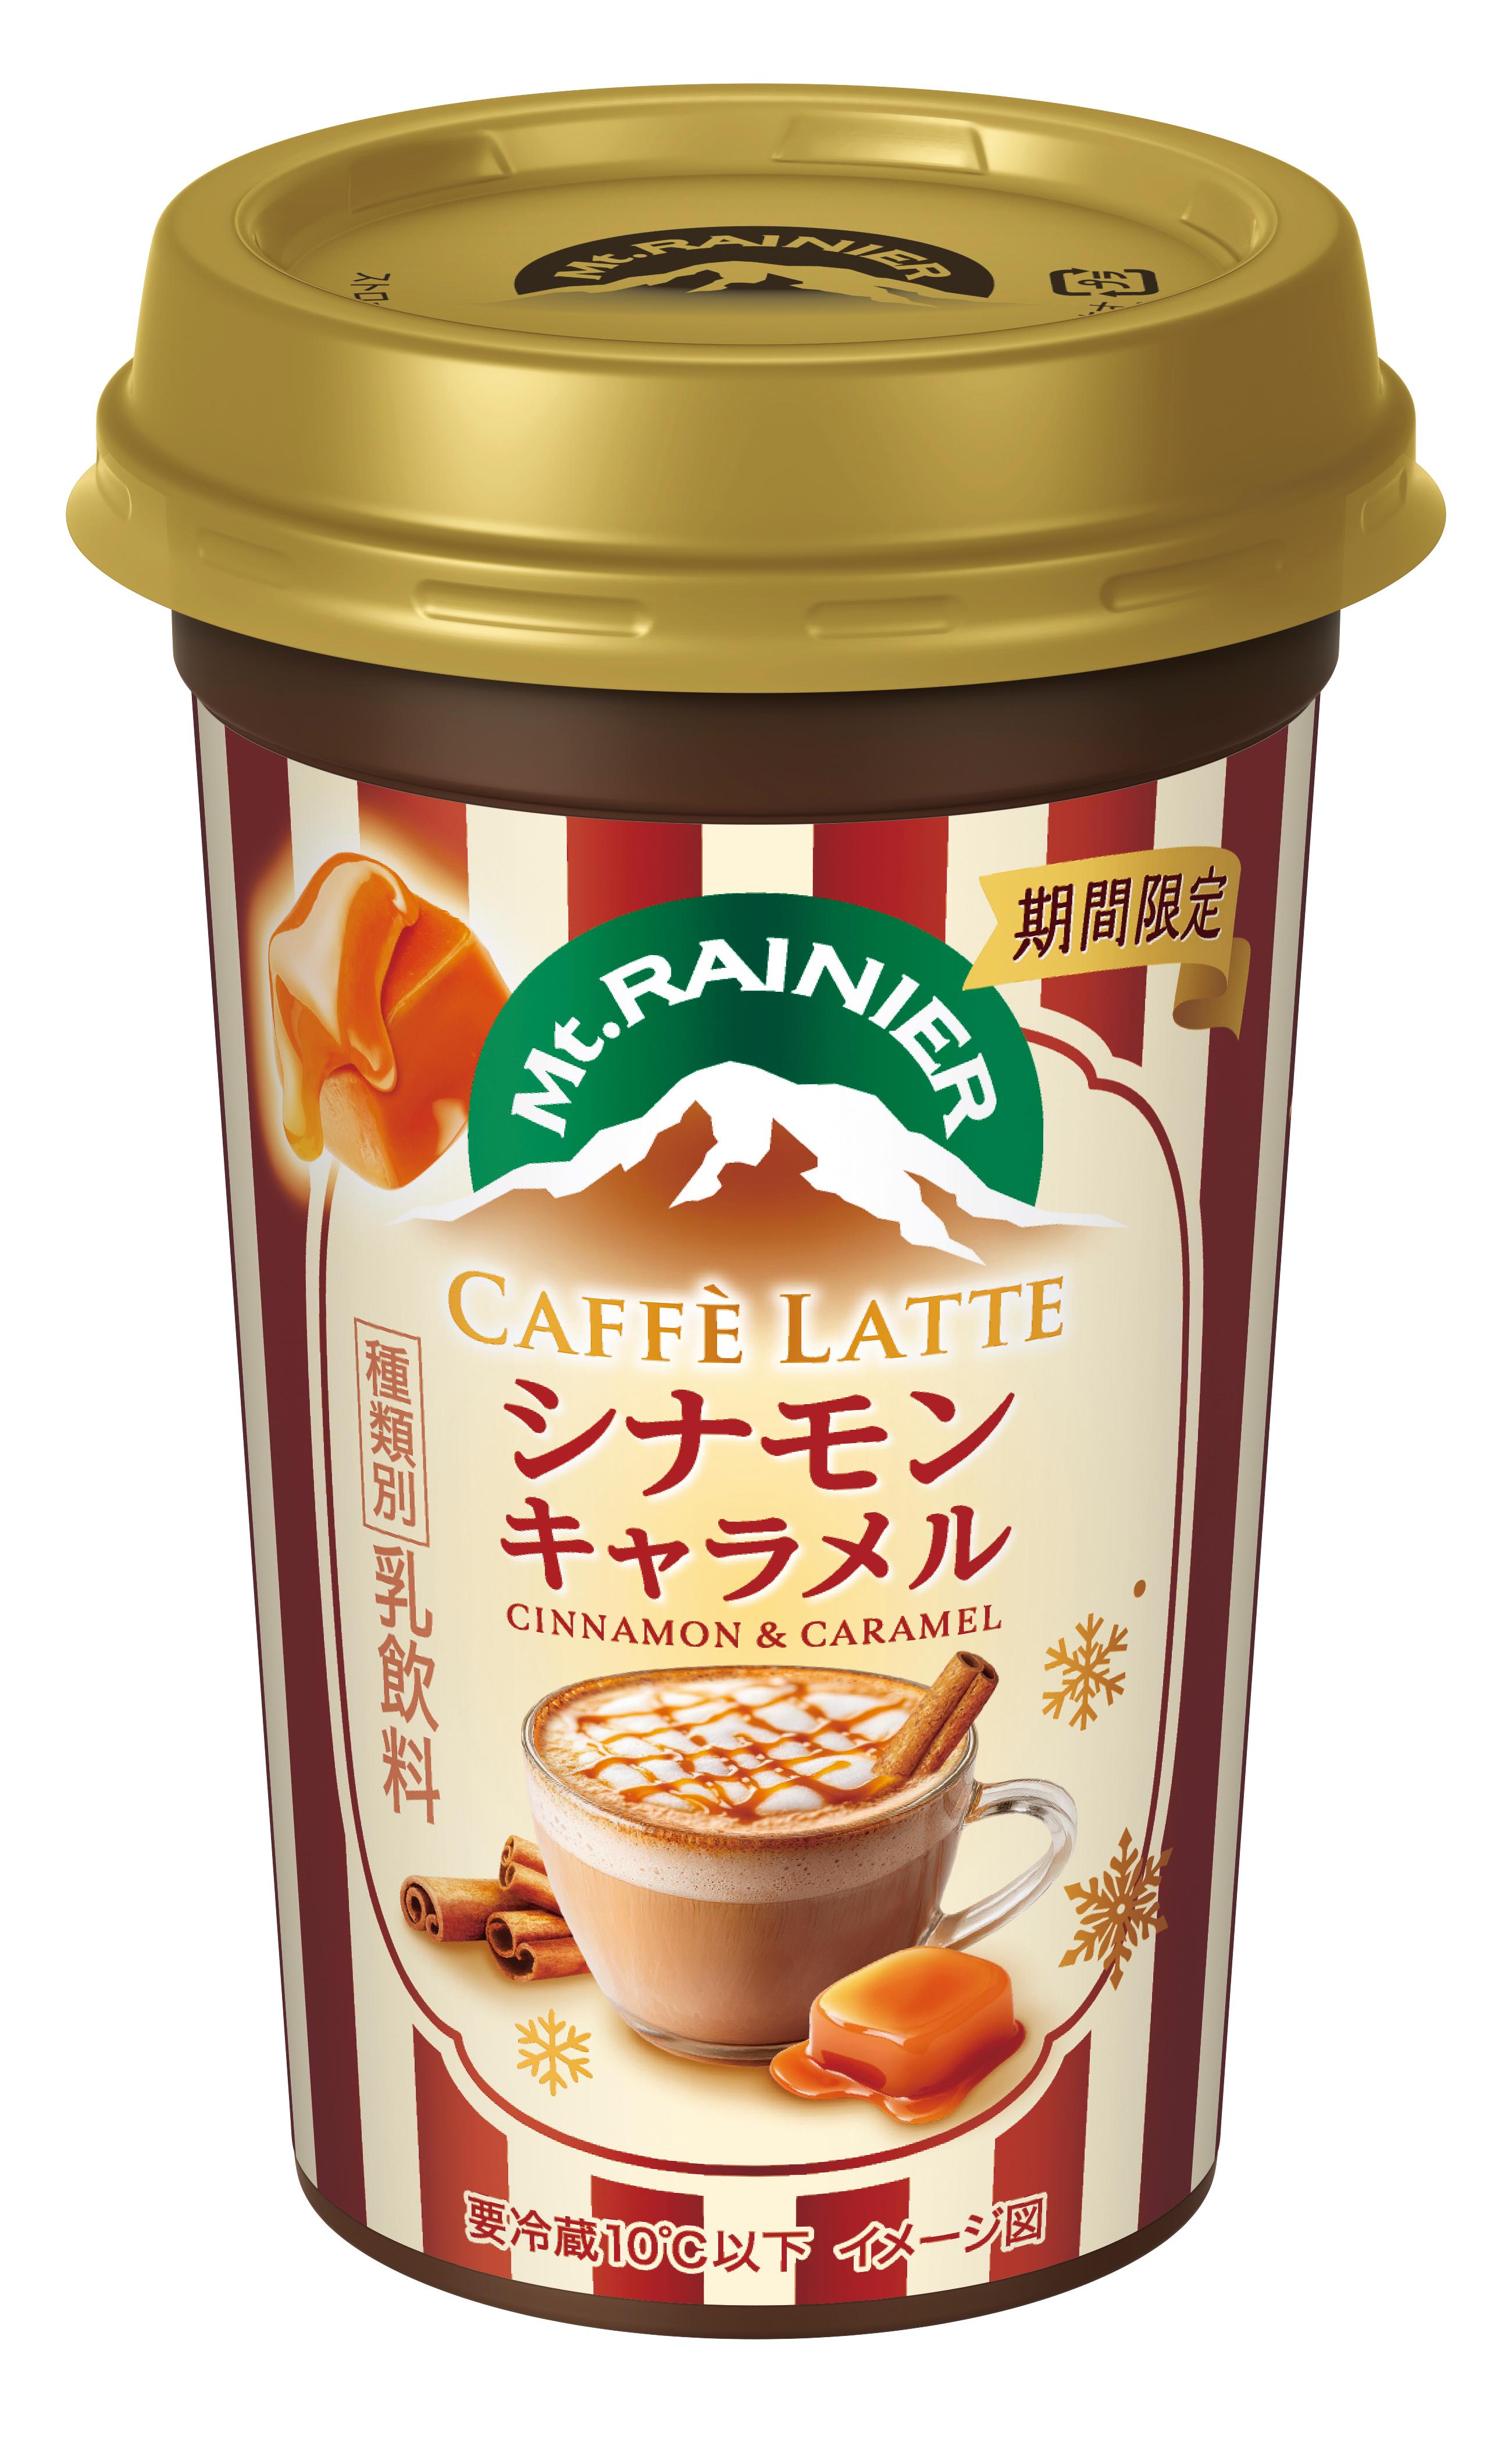

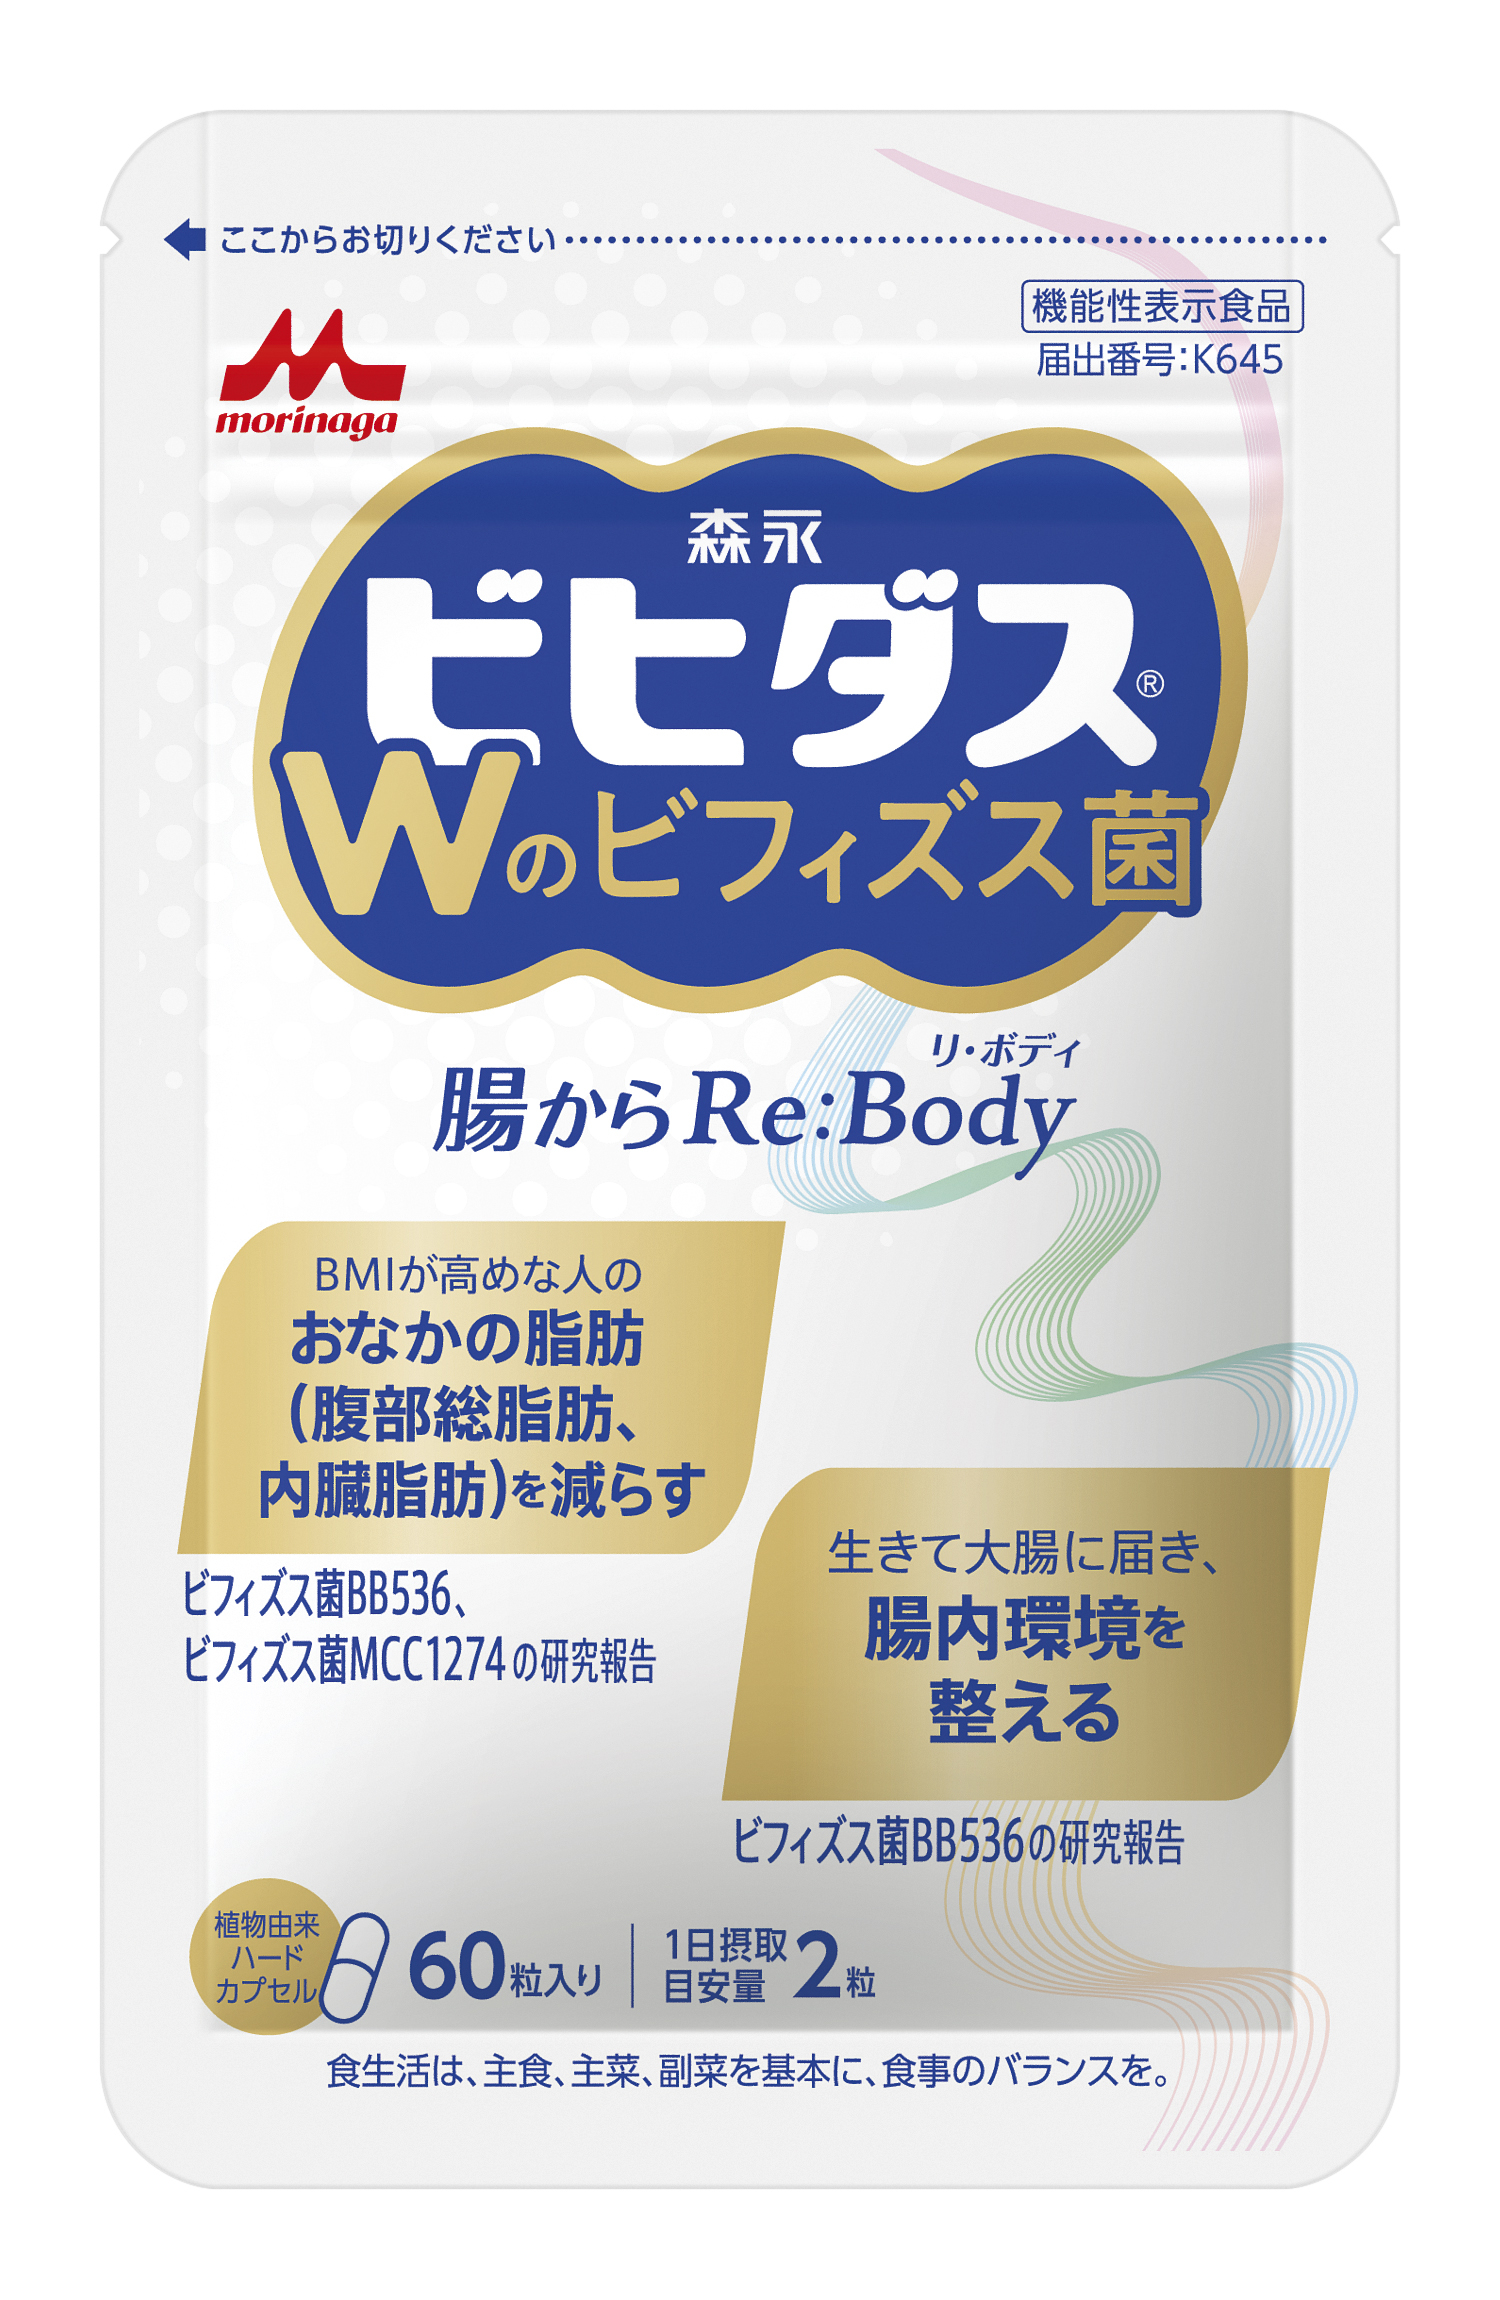
 「ピノ チョコアソートのアーモンドをもっと食べたい」という願いをかなえる、50周年ならではの「ピノ ぜんぶアーモンド」を、ぜひこの機会にお楽しみください。
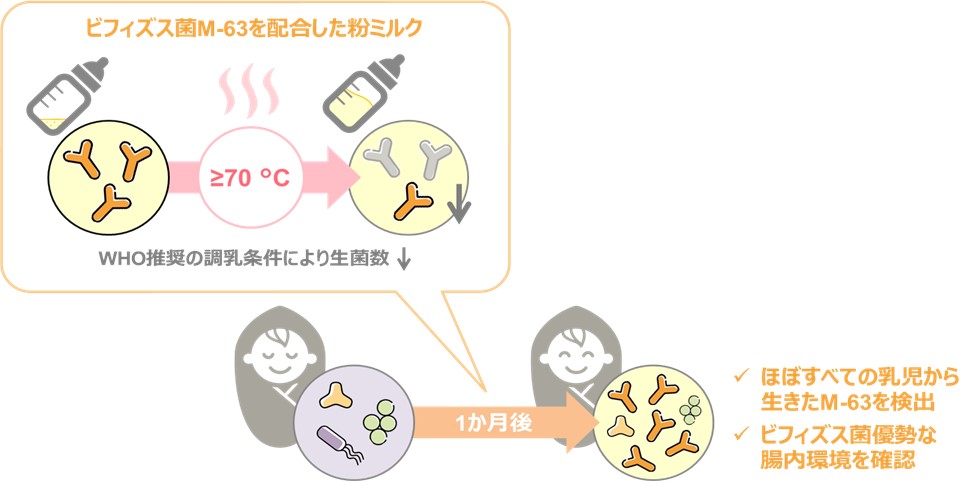
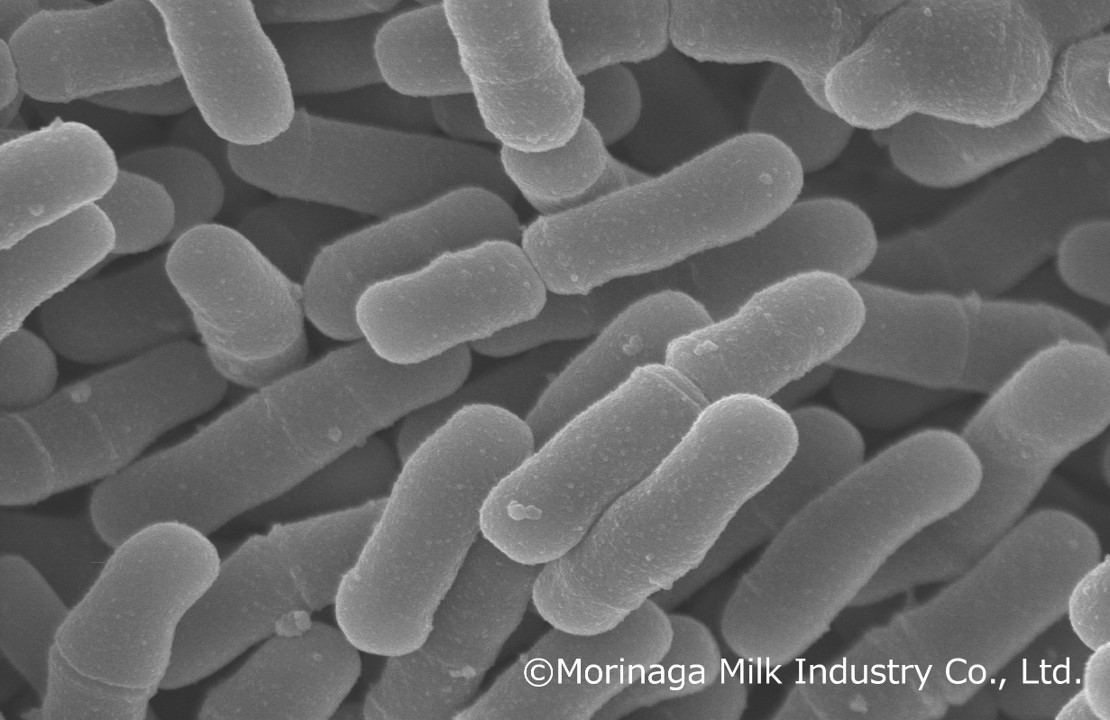 ビフィズス菌M-63
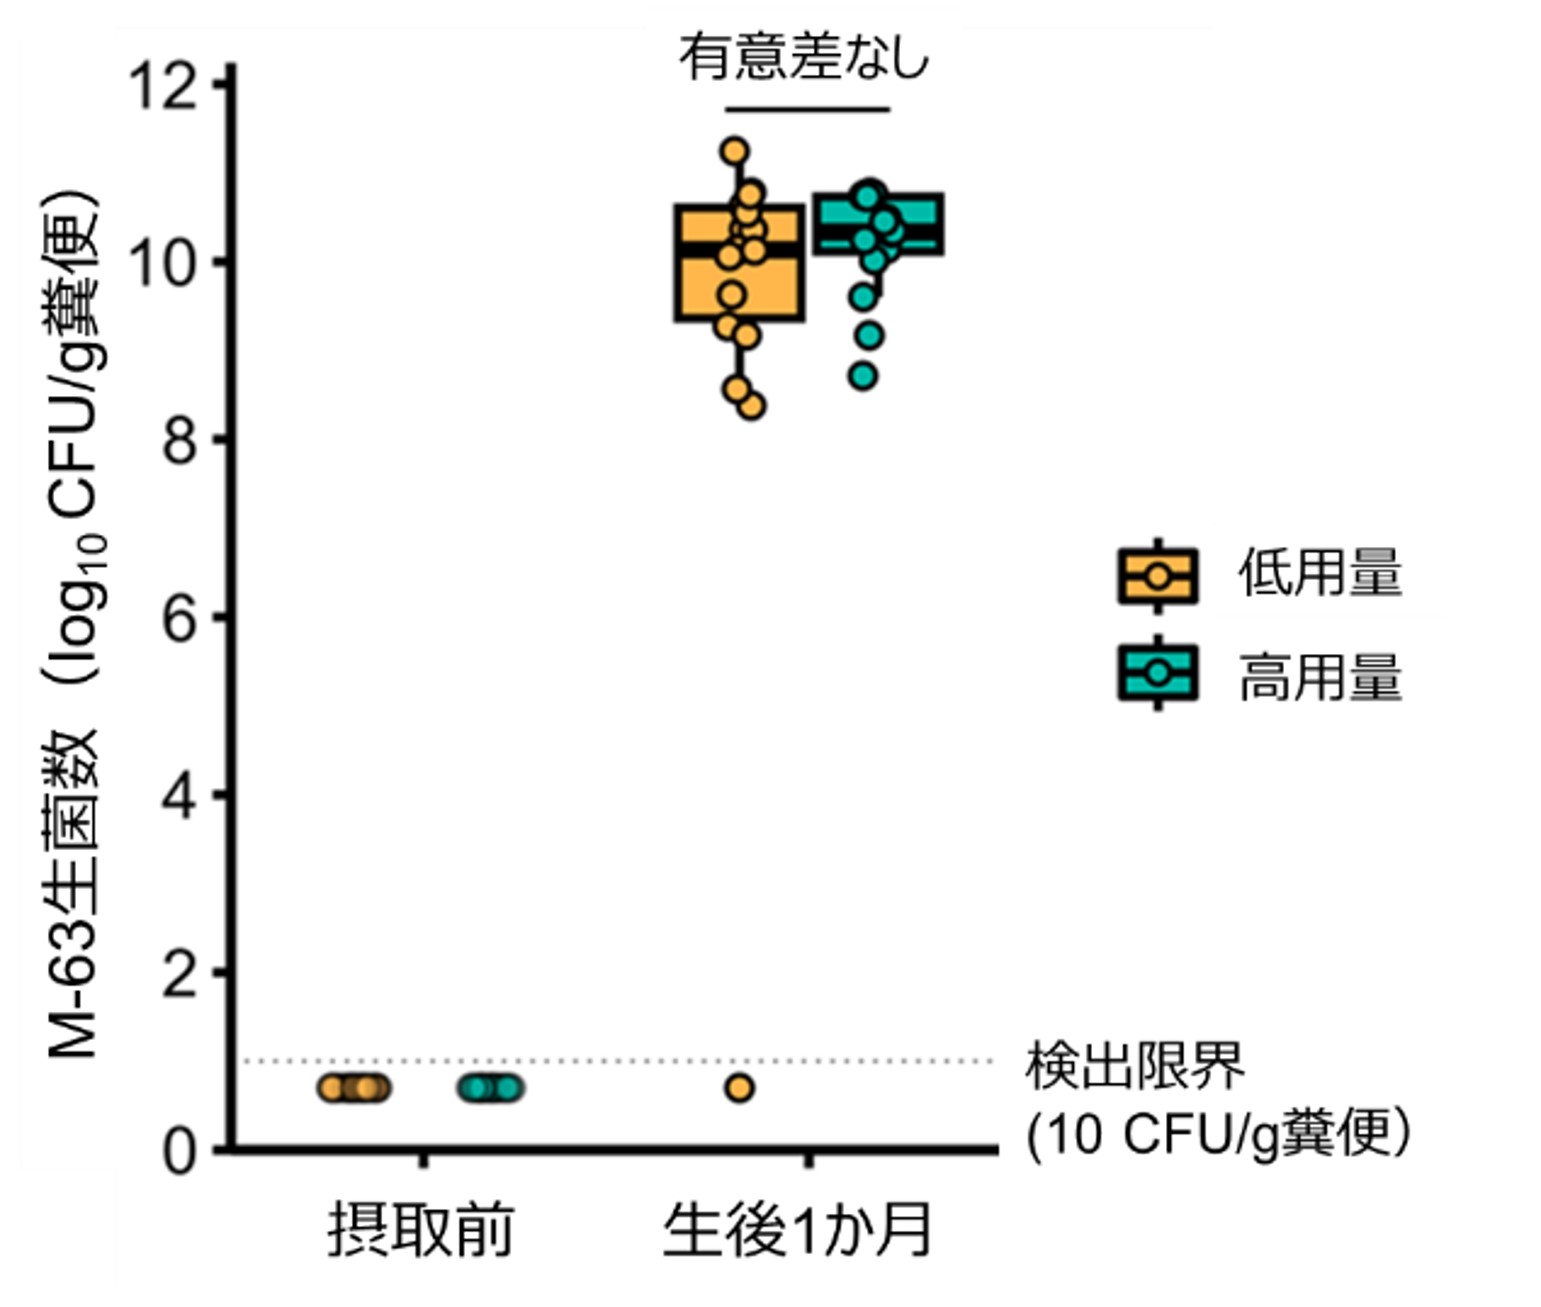 図1:糞便中のビフィズス菌M-63生菌数
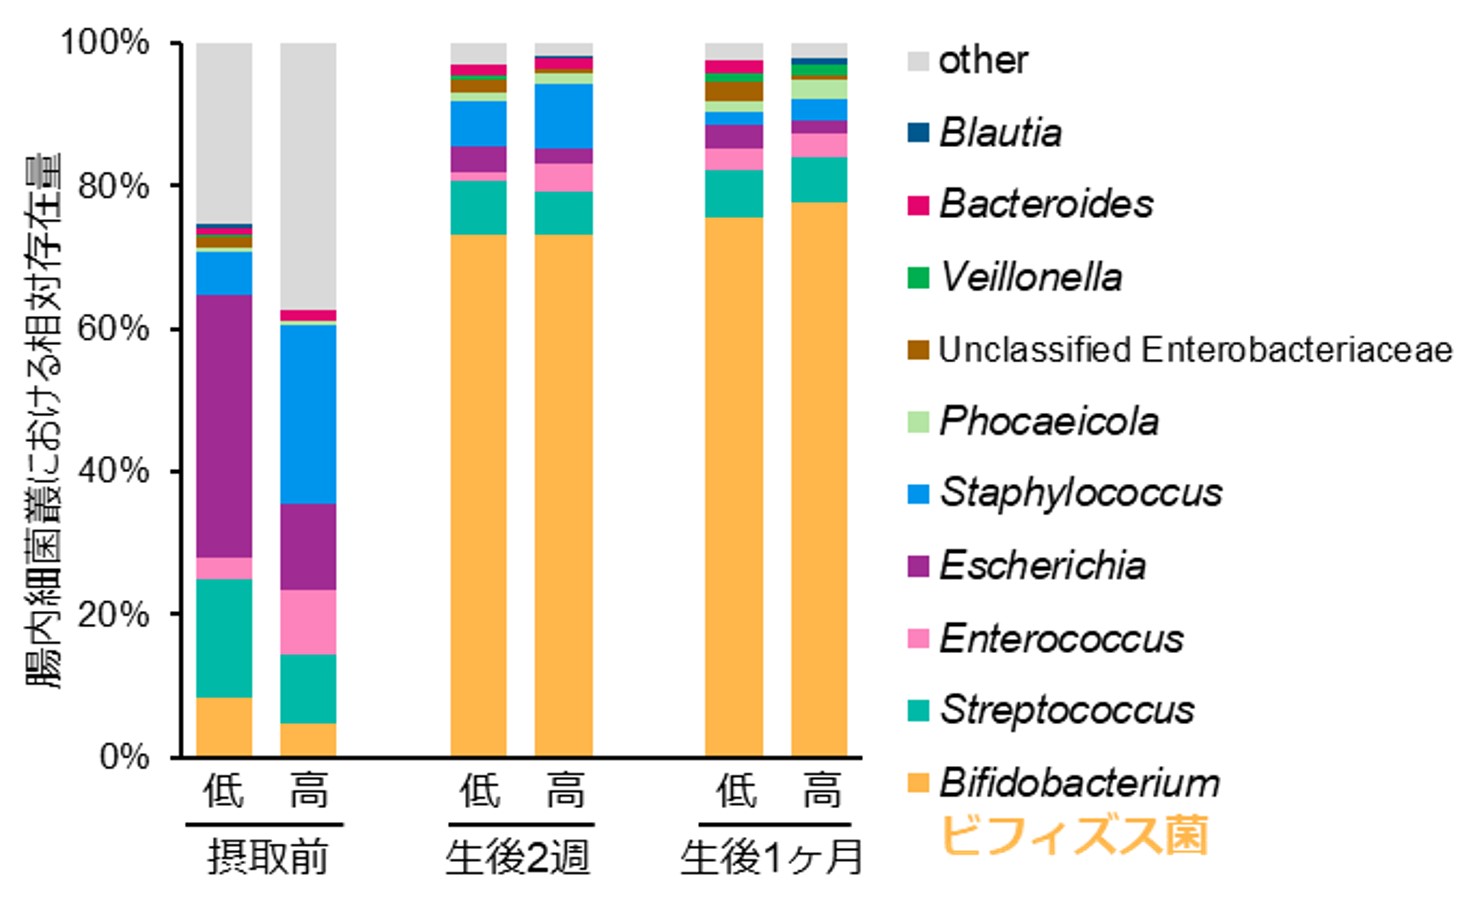 図2:腸内細菌叢におけるビフィズス菌の割合 ※各群の平均値
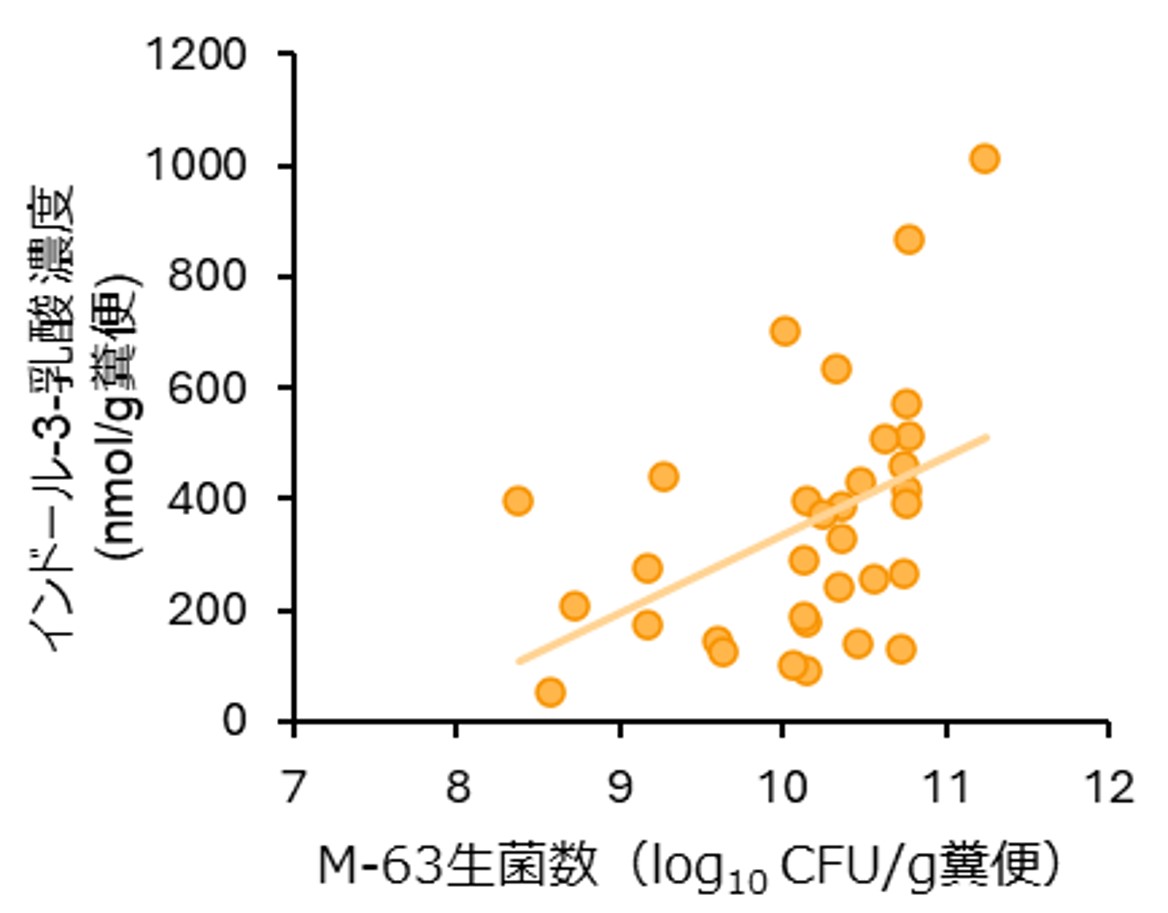
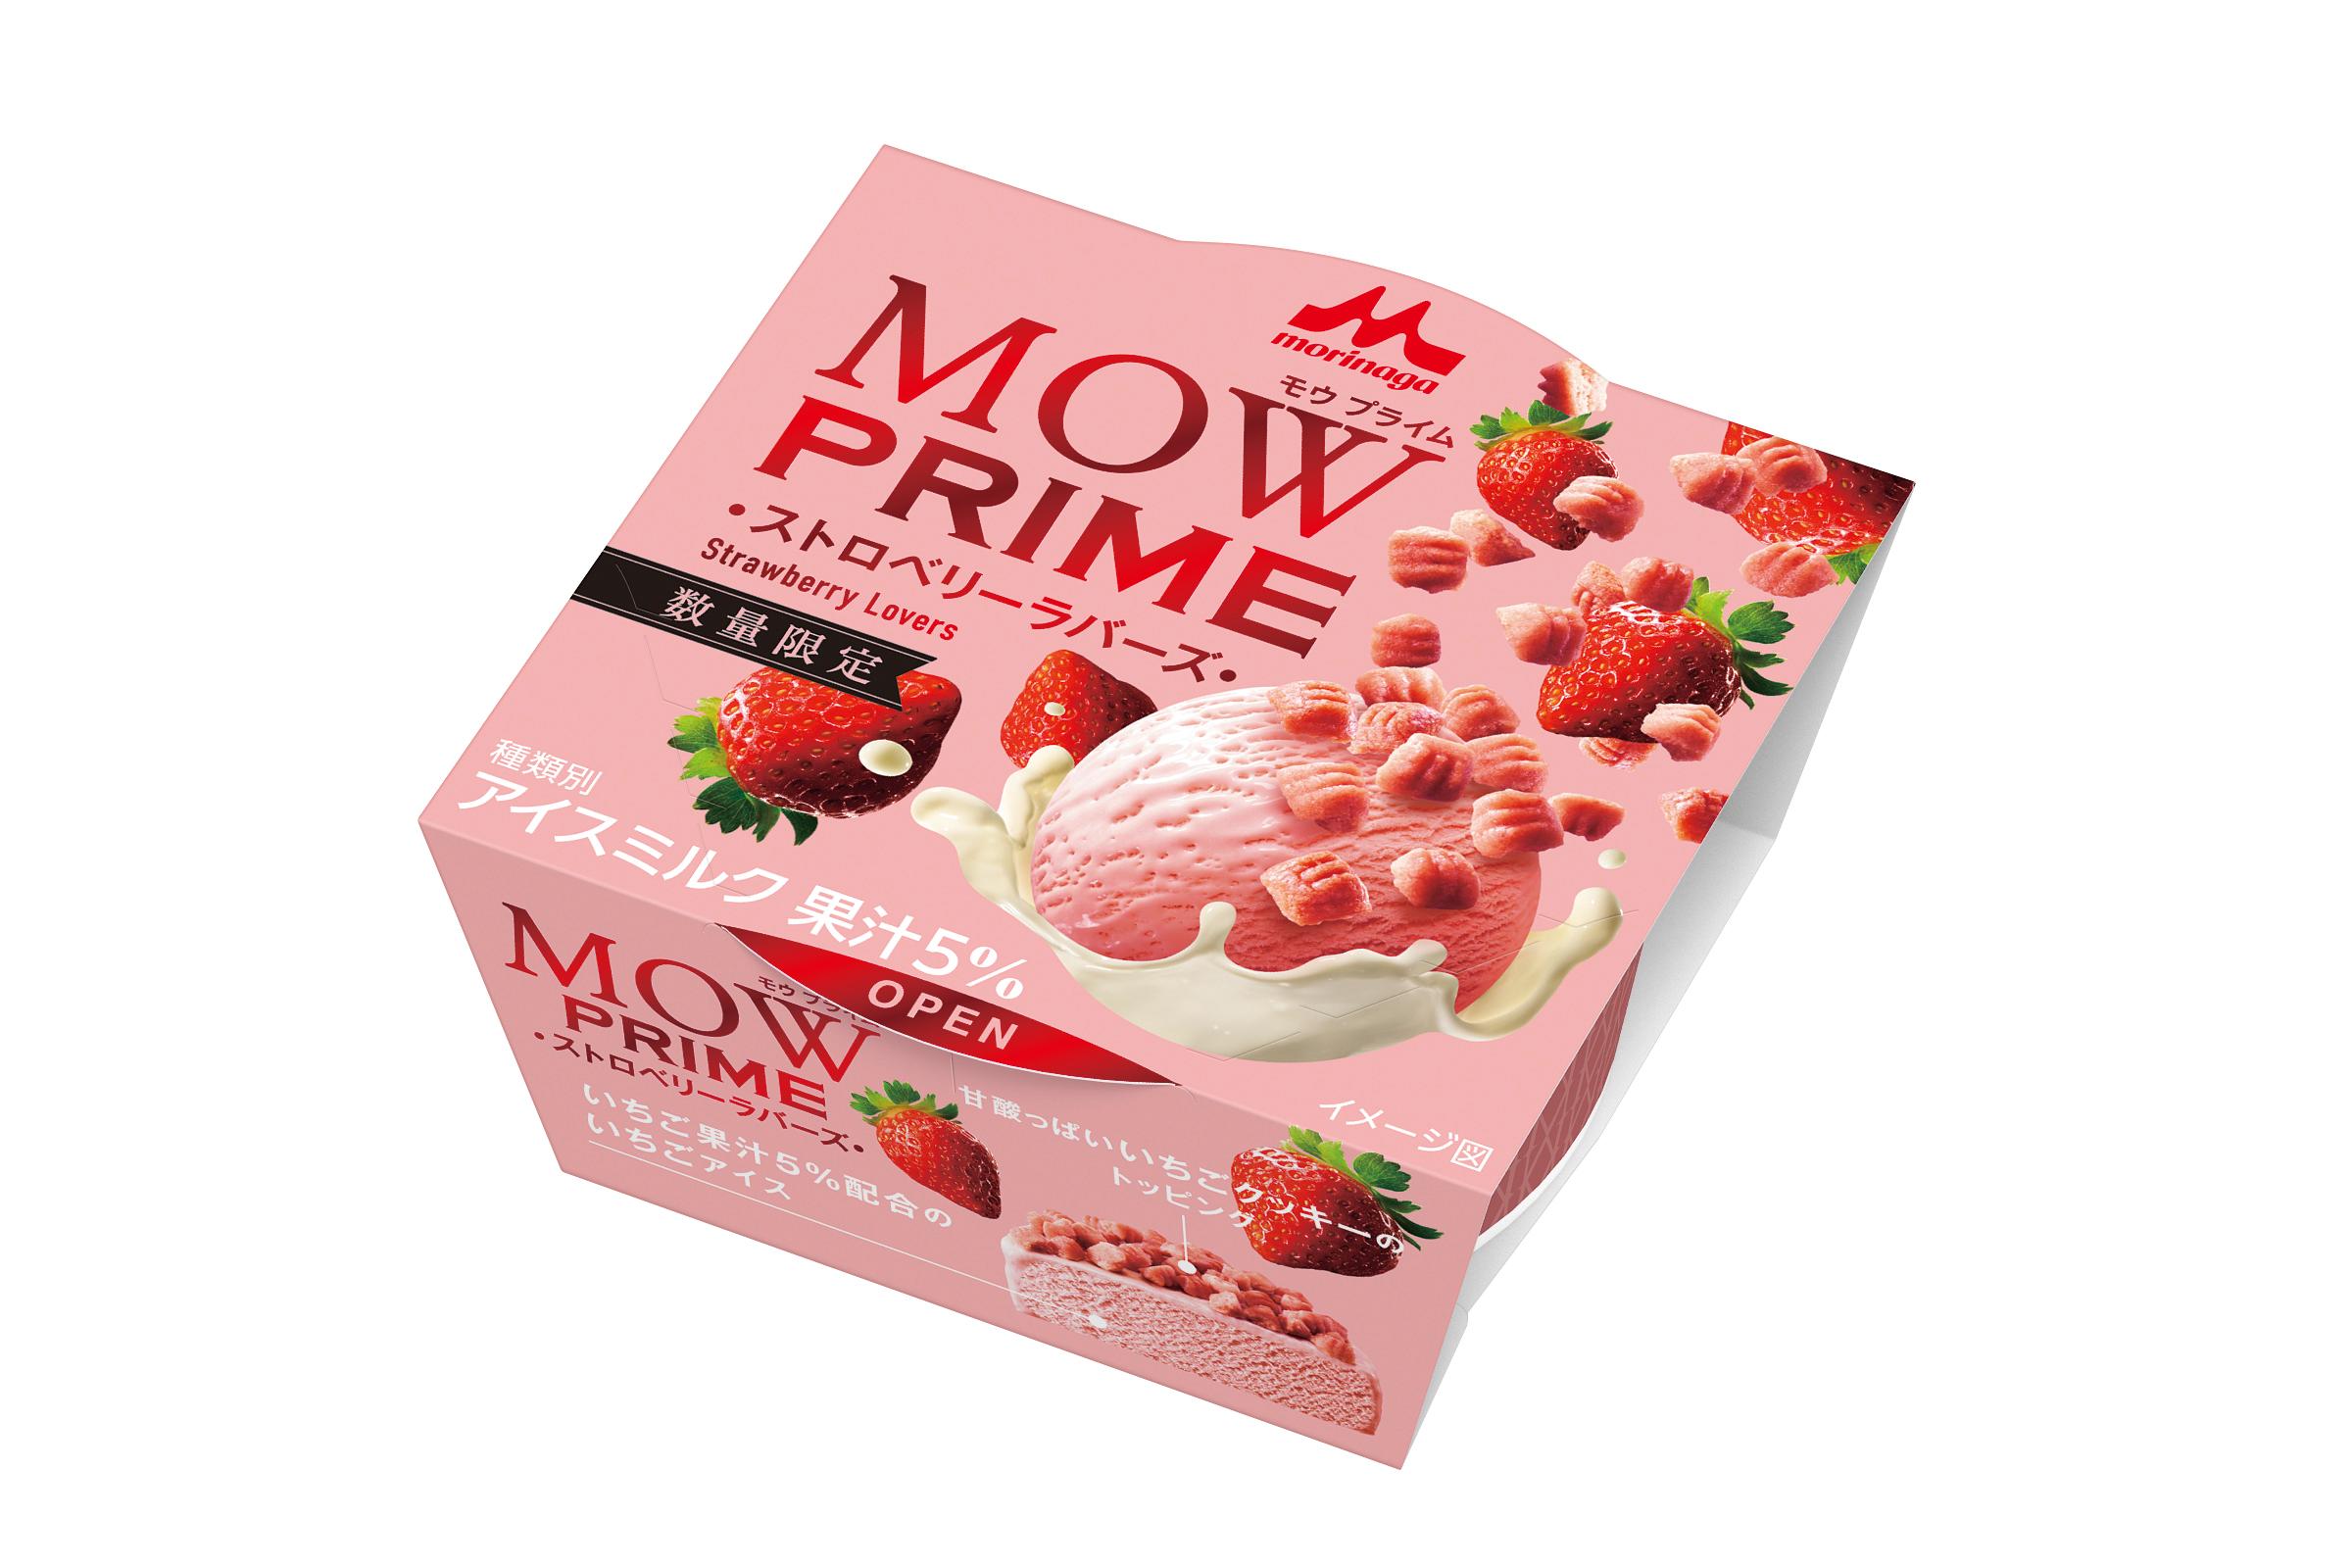
 一覧へ
 閉じる