|
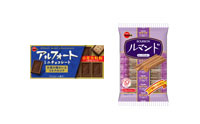
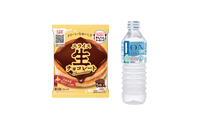
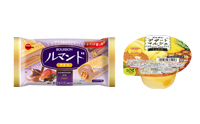
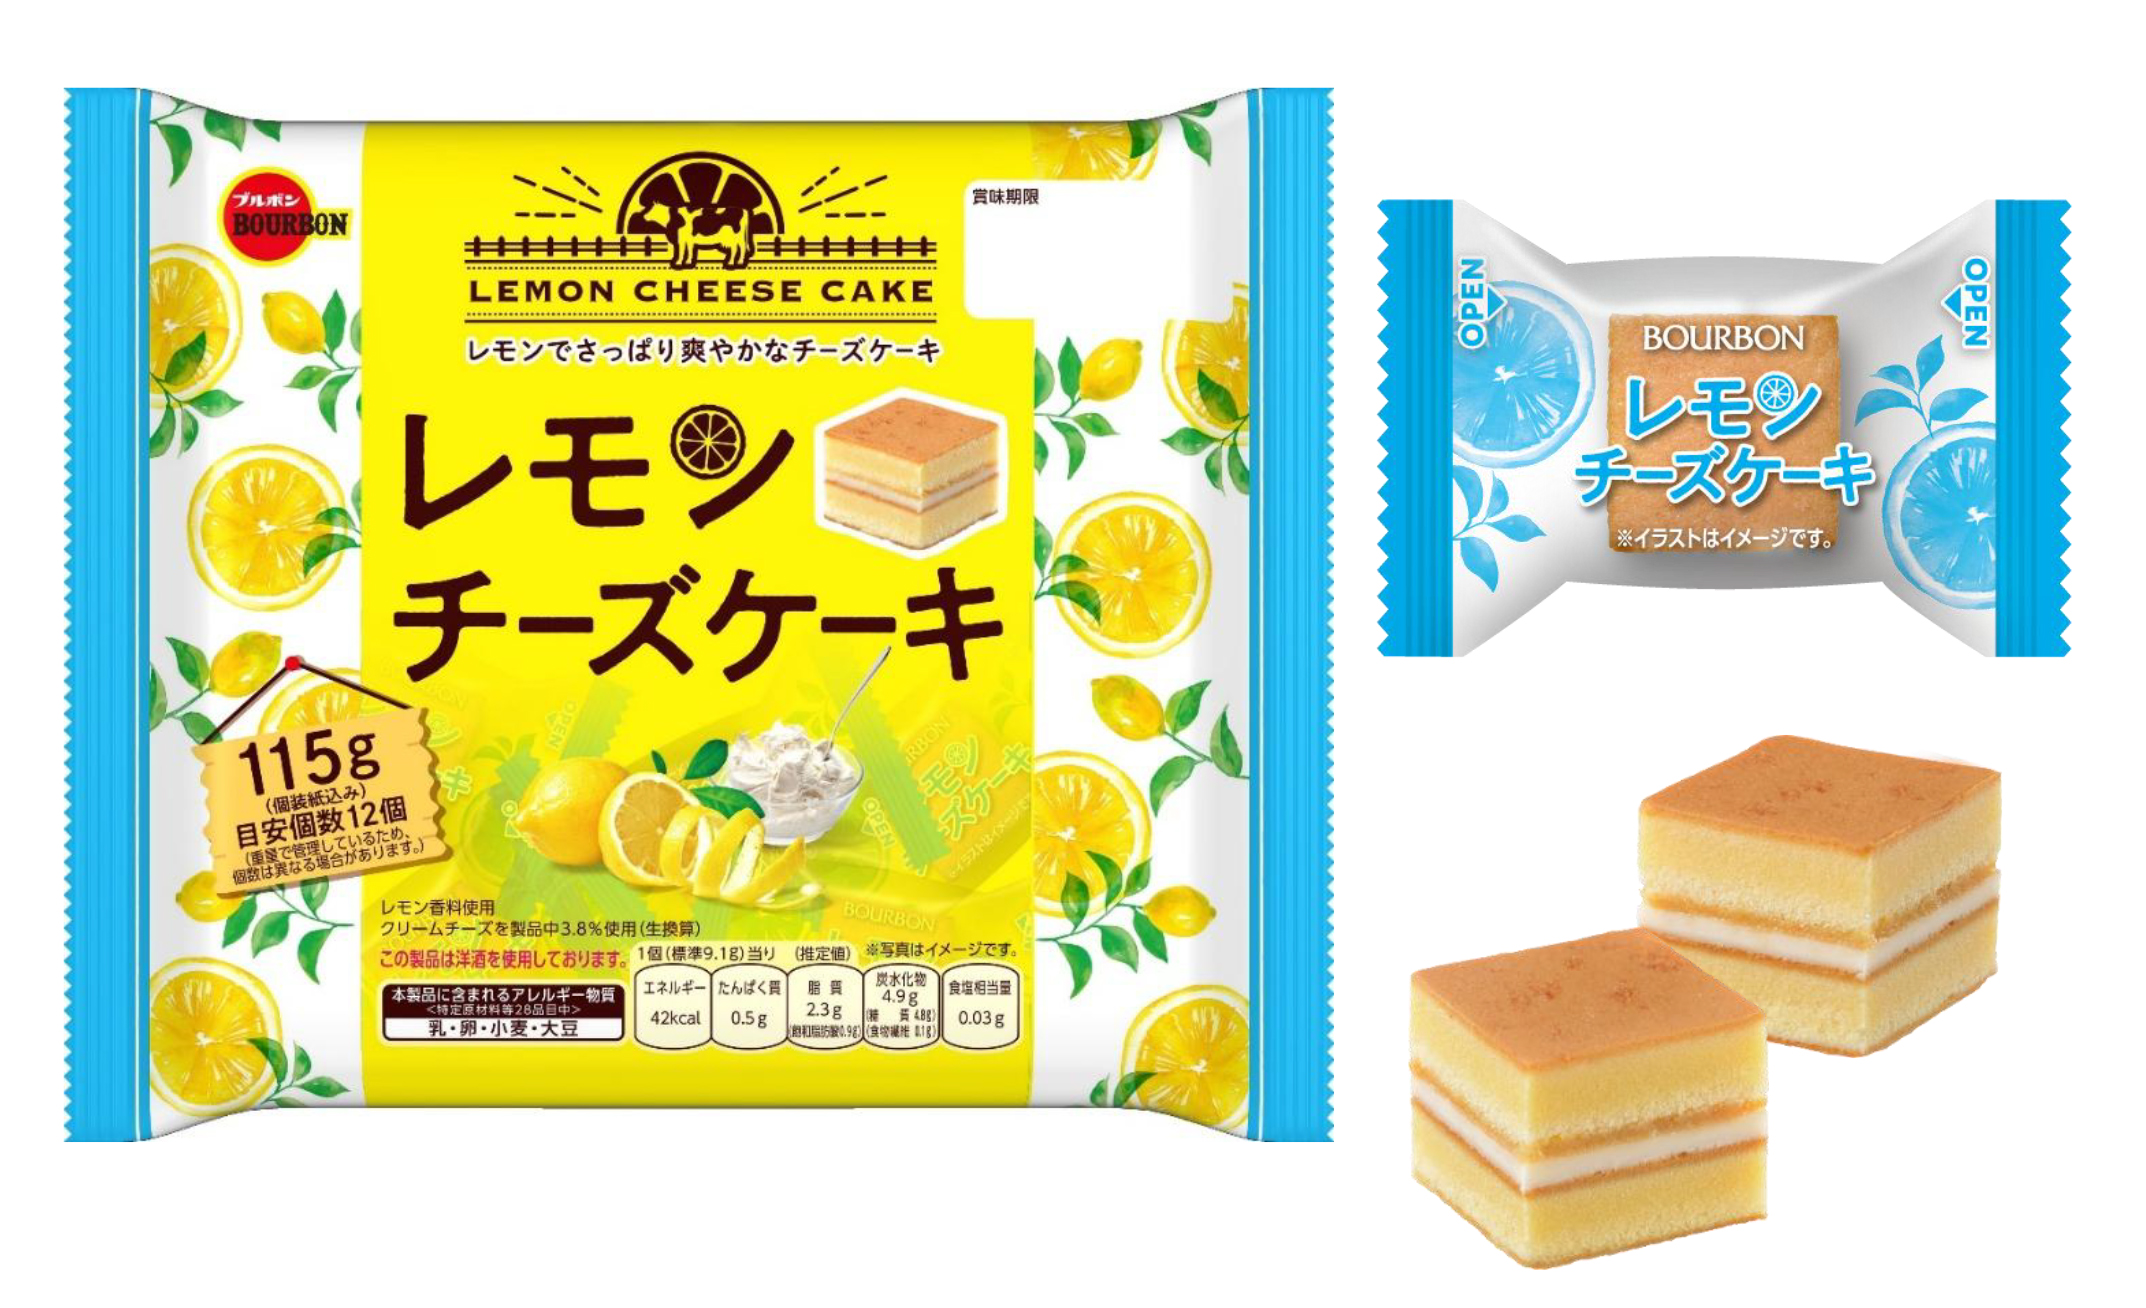
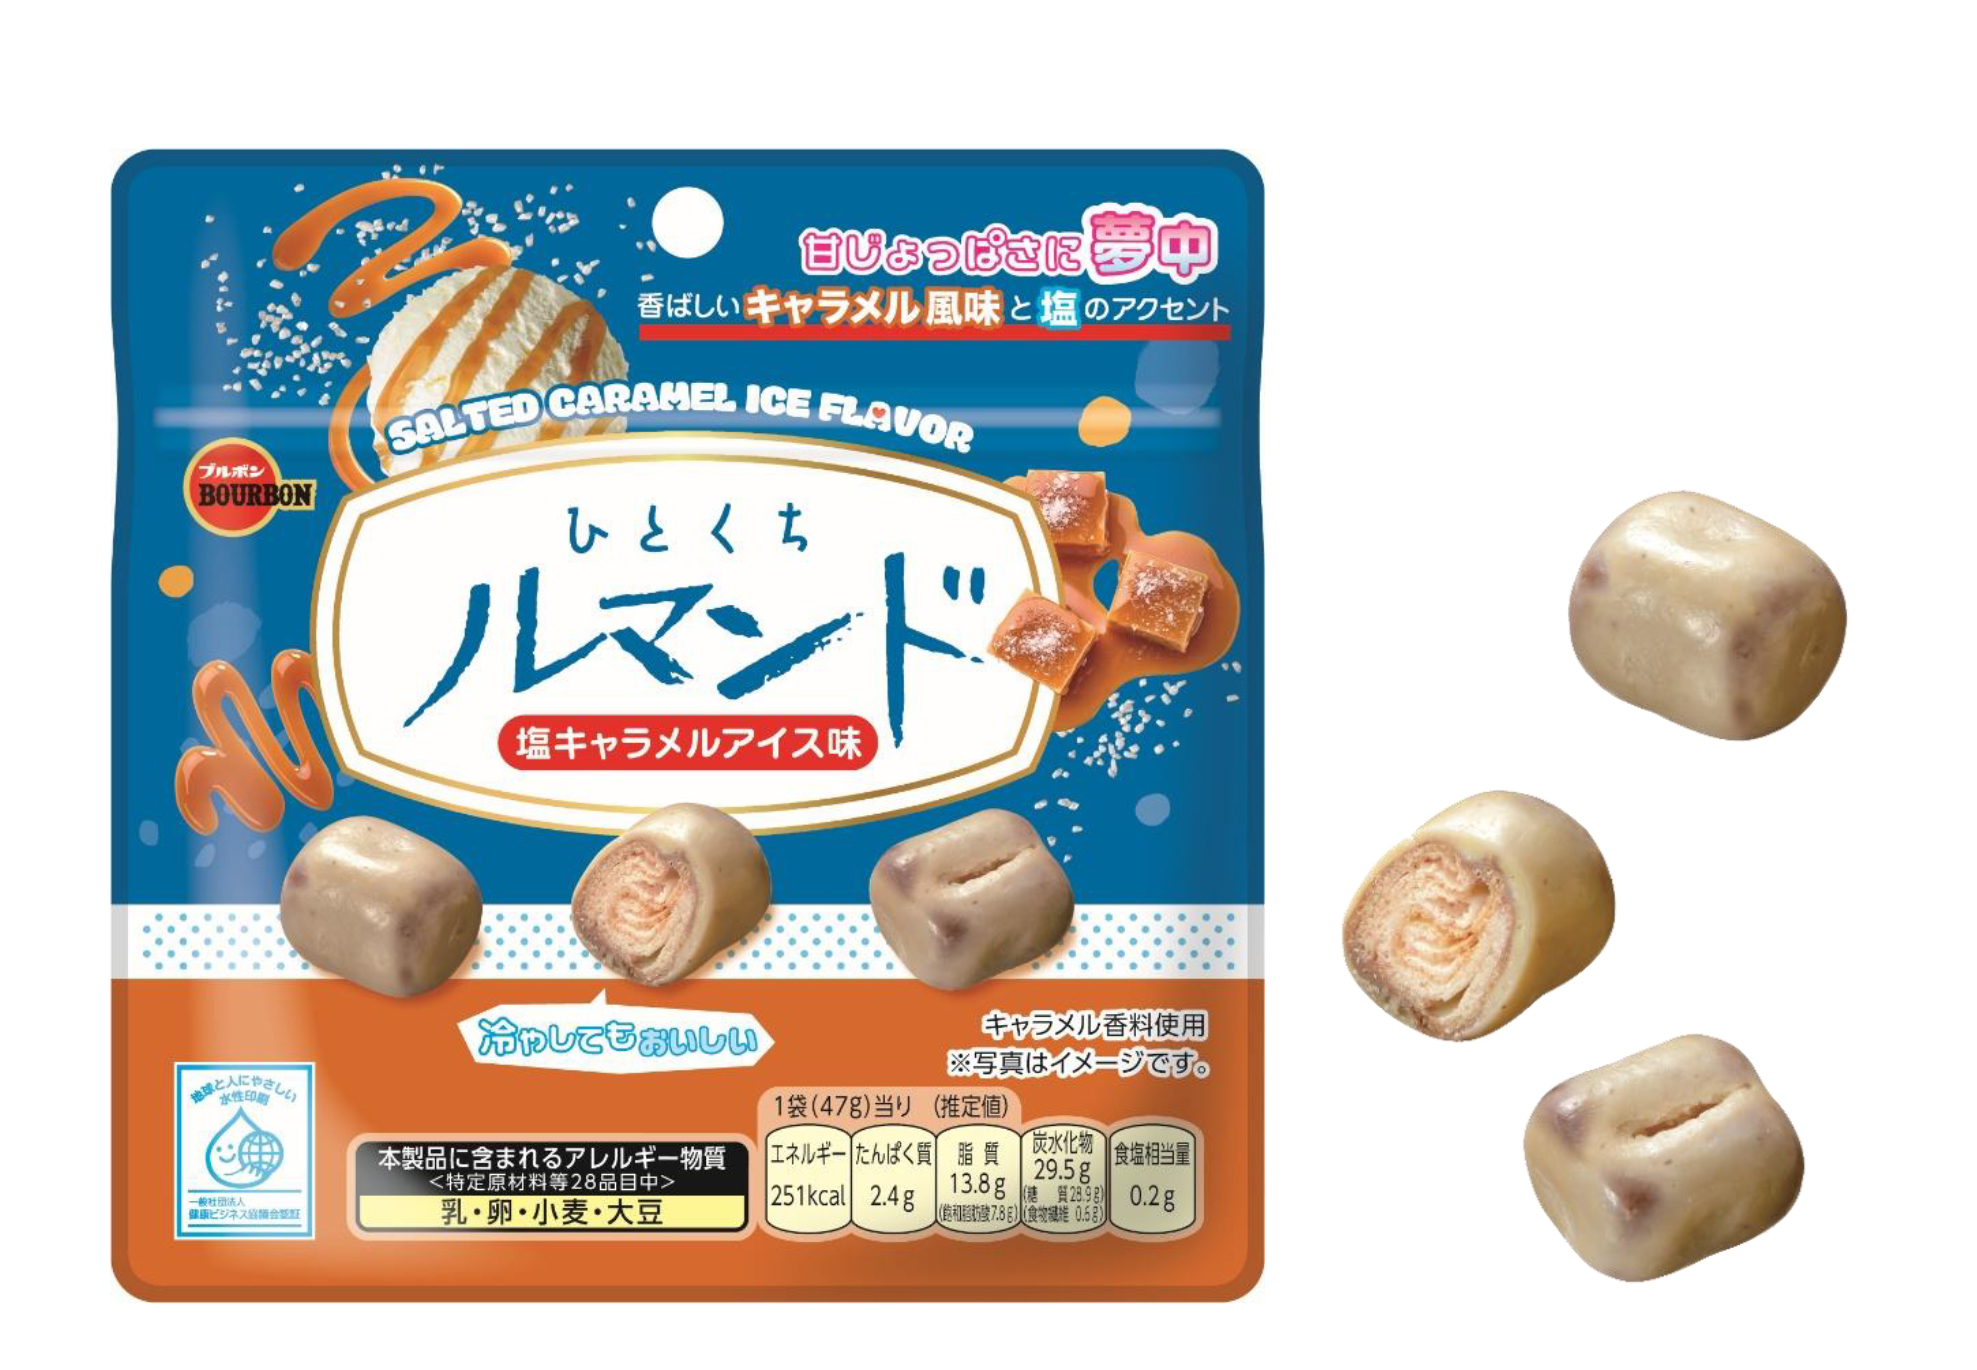
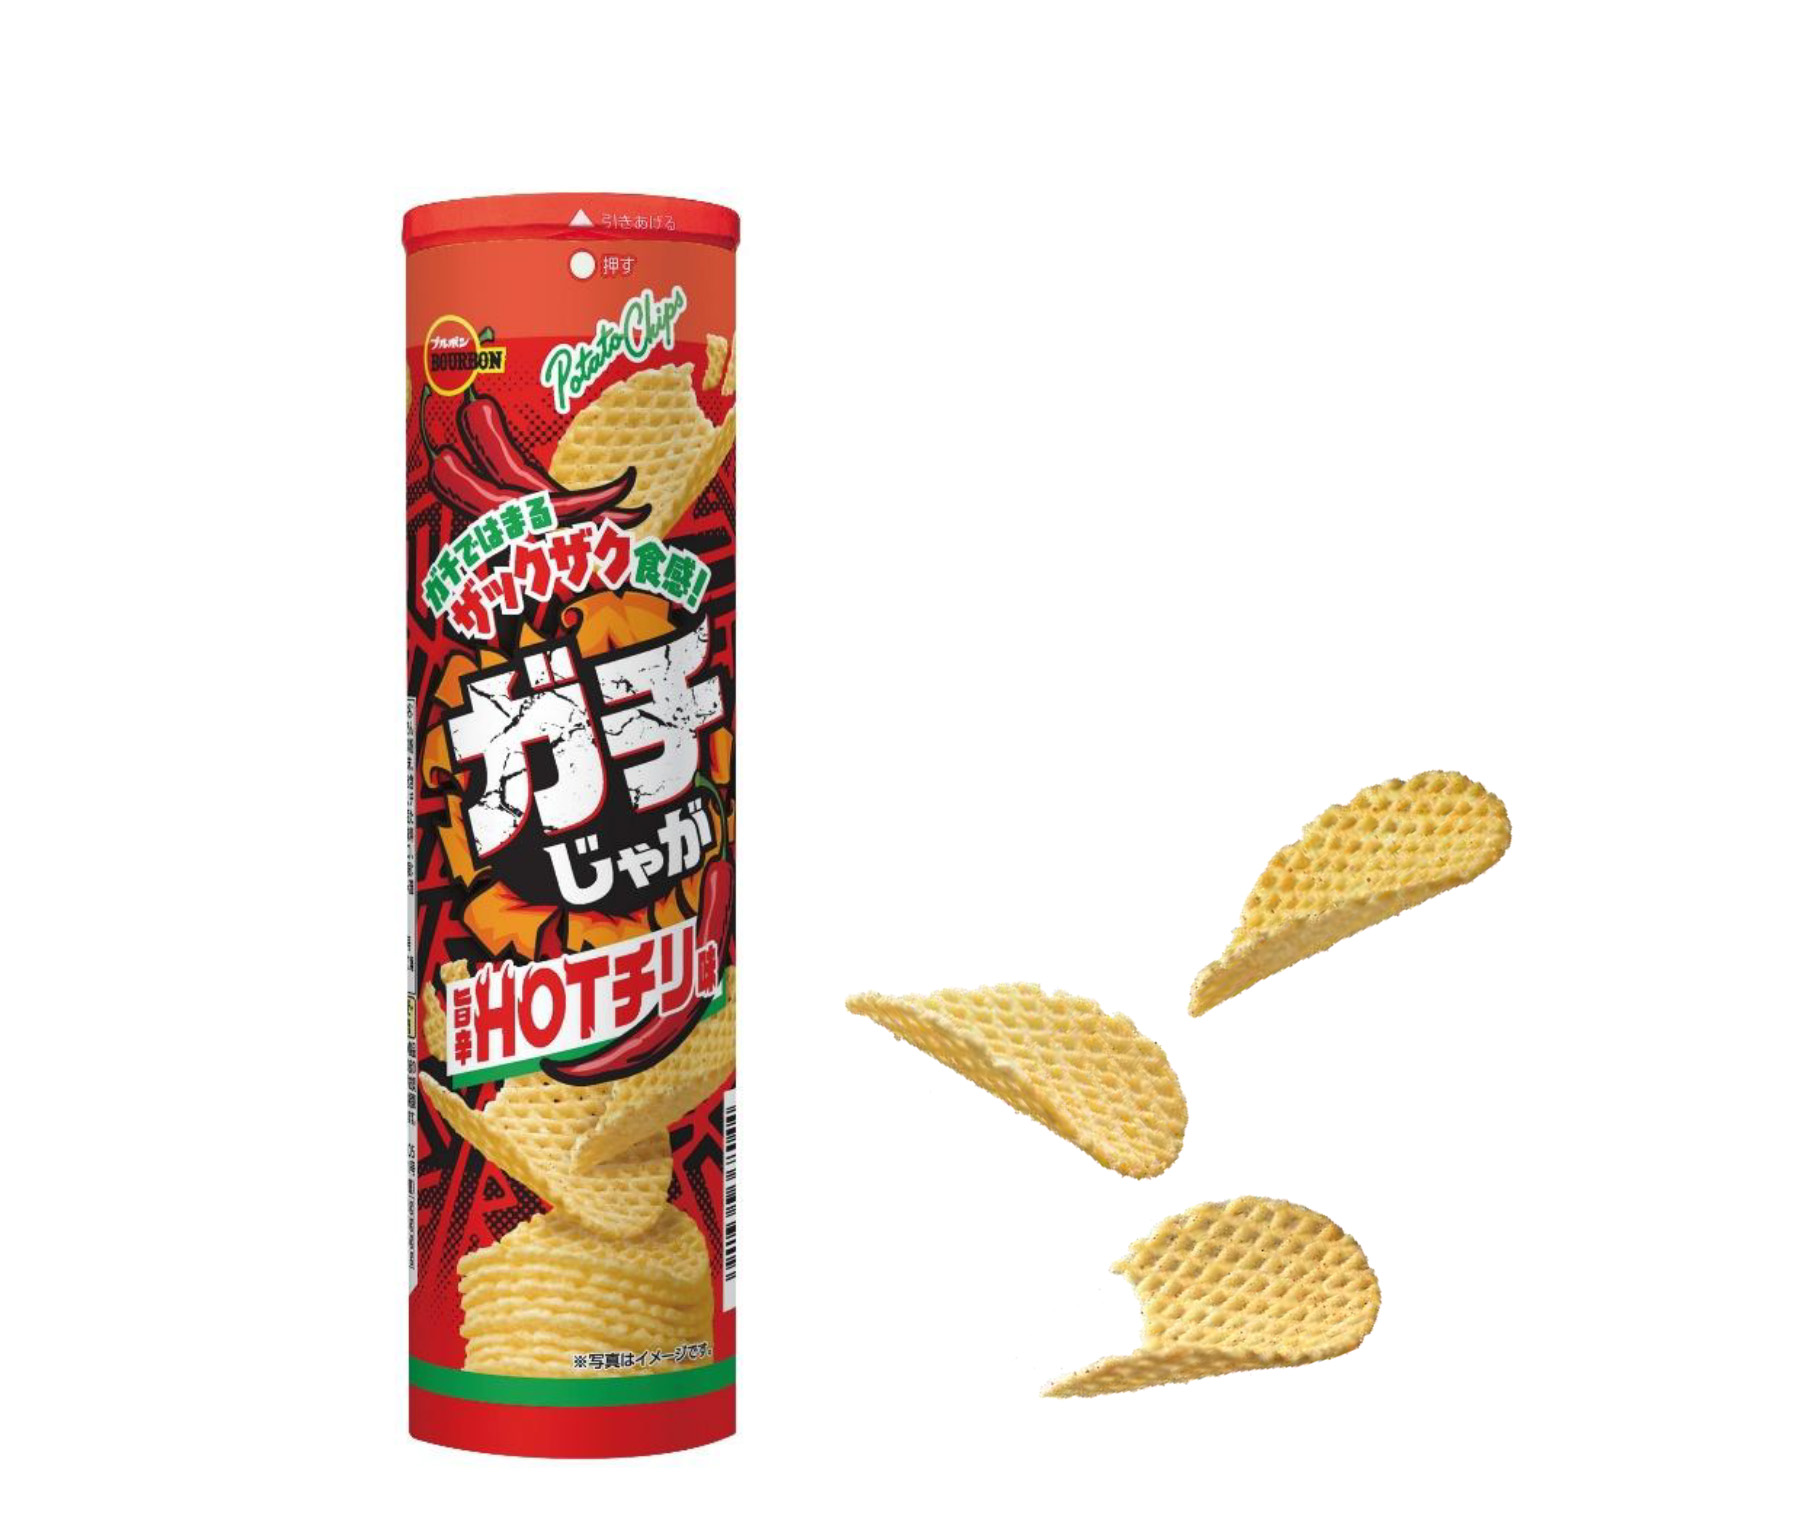
Bourbon Corporation is a Japanese food manufacturer engaged in the production and sale of confectionery, beverages, and food products. The company operates through several subsidiaries, including Leyman, which manufactures chocolate and Western-style confectionery, and Echigo Beer, a regional beer producer. Bourbon Foods USA Corporation and BOURBON FOODS VIETNAM CO., LTD. handle market research, import, and sales of confectionery in the United States and Vietnam, respectively. In China, subsidiaries manage the manufacturing and distribution of snacks and beverages. The group also includes Bourbon Regenerative Medical Science Research Institute, which develops and sells regenerative medical research culture media such as Xyltech. Additionally, the company operates an insurance agency business through Leyman Planning. Summarised from the annual report, fiscal year ended Mar 2026 |
Industry Packaged Foods | Homepage bourbon.co.jp |
| Sector Consumer Defensive | IR page bourbon.co.jp | |
|
Tags
confectionery, chocolate, beverages, regional beer, regenerative medicine, food import, food distribution, Leyman, Echigo Beer, Bourbon Foods USA Corporation, BOURBON FOODS VIETNAM CO. LTD., Halong Meng (Changxing) Food Co. Ltd., Halong Meng (Shanghai) Trading Co. Ltd., Marquin, Beer Style To One, Leyman Planning, Bourbon Regenerative Medical Science Research Institute, Xyltech, Bourbon Kogyo, Sherryze
|
Press page bourbon.co.jp/ir/news |
Metrics
| Valuation | |
|---|---|
| Market cap | ¥ 83.516B |
| Market cap (USD) | $ 521.978M |
| P/E | 11.44 |
| PEG | 0.15 |
| P/BV | 1.22 |
| P/S | 0.68 |
| P/OCF | 7.90 |
| P/FCF | 13.31 |
| Dividend yield | 1.4% |
| Turnover / mcap | — |
| Returns | |
|---|---|
| ROE | 9.2% |
| ROI | 8.5% |
| ROIC | 8.0% |
| Profit margin | 4.9% |
| Growth | |
|---|---|
| Revenue growing | Yes |
| Profits growing | Yes |
| Revenue up 3y | Yes |
| Revenue up 5y | No |
| Earnings growth 3y (net profit CAGR) | 75.4% |
| Quality | |
|---|---|
| Profitable | Yes |
| Margin expanding | No |
| Buying back stock | No |
| Diluting (TTM) | No |
| Debt/Equity | — |
| Podcast bulls (TTM) | Sign up |
| Podcast bears (TTM) | Sign up |
| Podcast sentiment (TTM) | Sign up |
| Podcast sentiment % (TTM) | Sign up |
| News sentiment (TTM) | 68 |
| Quality score | 16.7% |
| Insiders | |
|---|---|
| Buys, 1w | Sign up |
| Buys, 1m | Sign up |
| Buys, 1y | Sign up |
| Sells, 1w | Sign up |
| Sells, 1m | Sign up |
| Sells, 1y | Sign up |
Sign up to see this company's insider trades
| Figure | FY 2026 | FY 2025 | FY 2024 | FY 2023 | FY 2022 | FY 2021 | FY 2020 | FY 2019 | FY 2018 | FY 2017 | FY 2016 | FY 2015 | FY 2014 | FY 2013 |
|---|---|---|---|---|---|---|---|---|---|---|---|---|---|---|
| Revenue | 120.303B | 113.475B | 103.717B | 97.383B | 94.451B | 118.443B | 117.551B | 117.572B | 117.696B | 112.918B | 109.561B | 104.94B | 103.817B | 102.419B |
| Net profit | 5.913B | 5.566B | 3.071B | 1.096B | 3.374B | 3.167B | 1.875B | 3.117B | 3.657B | 3.652B | 2.607B | 1.966B | 405M | 498M |
| Free cash flow | 5.166B | -294M | 4.462B | -3.604B | 3.182B | 2.288B | -1.868B | 960M | 5.094B | -476M | 1.558B | — | — | — |
| Figure | FY 2026 | FY 2025 | FY 2024 | FY 2023 | FY 2022 | FY 2021 | FY 2020 | FY 2019 | FY 2018 | FY 2017 | FY 2016 | FY 2015 | FY 2014 | FY 2013 |
|---|---|---|---|---|---|---|---|---|---|---|---|---|---|---|
| Share price | 3.219K | 2.537K | 2.391K | 2.139K | 2.25K | 2.203K | 1.723K | 1.879K | 3.035K | 2.655K | 1.7K | 1.555K | 1.101K | 1.313K |
| Price performance 12m | 0.27 | 0.06 | 0.12 | -0.05 | 0.02 | 0.28 | -0.08 | -0.38 | 0.14 | 0.56 | 0.09 | 0.41 | -0.16 | — |
Filed figures
Lines the statements and their notes report beside the headline figures, read from the filings' XBRL as filed (no restatement applied), with figures computed from one filing's own lines. Cash-flow lines carry their cash direction: an outflow is negative. Each period links to its filing; a figure's period, report date and tag are in its tooltip.
| Figure | Mar 2017 | Mar 2018 | Mar 2019 | Mar 2020 | Mar 2021 | Mar 2022 | Mar 2023 | Mar 2024 | Mar 2025 | Mar 2026 |
|---|---|---|---|---|---|---|---|---|---|---|
| Balance sheet detail | ||||||||||
| Trade receivables (JPY) | 13.3B | 14.5B | 14.1B | 13.1B | 13B | 13.4B | 13.8B | 14.8B | 14.8B | 15.2B |
| ↳ YoY growth | +3.9% | +9.1% | -3.1% | -7.1% | -0.6% | +3.1% | +2.8% | +7.7% | -0.3% | +2.6% |
| ↳ 5y CAGR | +0.3% | +0.1% | -1.1% | +1.1% | +2.5% | +3.1% | ||||
| Borrowings, current (JPY) | 1.65B | 1.77B | 1.75B | 300M | 200M | 160M | 2.31B | 2.41B | 810M | 1.11B |
| Borrowings, non-current (JPY) | — | 650M | 550M | 250M | 250M | 78M | 2.78B | 2.37B | 2.36B | 1.75B |
| Bonds payable (JPY) | — | — | 100M | 100M | 100M | 100M | 100M | 100M | 300M | 300M |
| Lease liabilities (JPY) | 673M | 655M | 574M | 640M | 915M | 836M | 665M | 565M | 521M | 818M |
| Cash and deposits (JPY) | 12.9B | 17.8B | 17.9B | 13.1B | 14.8B | 16.8B | 16.2B | 19.6B | 17.4B | 20.8B |
| Intangible assets (JPY) | 1.84B | 1.72B | 1.59B | 1.49B | 1.39B | 1.25B | 1.29B | 1.54B | 1.51B | 1.28B |
| Net debt (borrowings + leases - cash) (JPY) | -10.5B | -14.7B | -15B | -12B | -13.4B | -15.7B | -10.4B | -14.3B | -13.7B | -17.2B |
| Cash flow detail | ||||||||||
| Operating cash flow (JPY) | 6.31B | 10.4B | 7.08B | 3.39B | 8.06B | 8.09B | 2.12B | 9.81B | 6.53B | 9.28B |
| Purchases of property, plant and equipment (JPY) | -6.78B | -5.33B | -6.12B | -5.26B | -5.77B | -4.91B | -5.72B | -5.35B | -6.82B | -4.11B |
| Change in receivables (cash effect) (JPY) | -524M | -1.21B | 441M | 989M | 79M | -394M | -368M | -1.05B | 45M | -377M |
| Change in inventories (cash effect) (JPY) | -1M | 141M | -92M | -1.35B | 498M | -653M | -1.46B | -932M | -3.01B | -1.7B |
| Change in payables (cash effect) (JPY) | 135M | 2.19B | -431M | -1.34B | -630M | 1.33B | -577M | 2B | -758M | -121M |
| Dividends paid (cash effect) (JPY) | -432M | -480M | -528M | -528M | -566M | -600M | -612M | -636M | -768M | -930M |
| Share buybacks (cash effect) (JPY) | 0.00 | — | — | — | — | — | — | — | — | — |
| Interest paid (cash effect) (JPY) | -12M | -9M | -5M | -8M | -5M | -4M | -8M | -13M | -27M | -38M |
| Income taxes paid (cash effect) (JPY) | -1.69B | -1.5B | -1.72B | -945M | -1.1B | -1.58B | -968M | -749M | -1.46B | -2.15B |
| Operating cash flow before change in receivables (JPY) | 6.83B | 11.6B | 6.64B | 2.4B | 7.98B | 8.48B | 2.49B | 10.9B | 6.48B | 9.66B |
| Free cash flow (OCF - PPE - intangibles) (JPY) | -476M | 5.09B | 960M | -1.87B | 2.29B | 3.18B | -3.6B | 4.46B | -294M | 5.17B |
| Income detail | ||||||||||
| Research and development expense (JPY) | 1.03B | 1.17B | 1.24B | 1.24B | 1.2B | 1.21B | 1.12B | 1.17B | 1.25B | 1.47B |
| ↳ 5y CAGR | +3.4% | +3.2% | -0.9% | -1.2% | +0.2% | +4.3% | ||||
| Total comprehensive income (JPY) | 4.42B | 3.75B | 2.85B | 1.88B | 3.46B | 3.11B | 1.37B | 3.53B | 5.47B | 6.65B |
| Comprehensive income to owners (JPY) | 4.42B | 3.75B | 2.85B | 1.88B | 3.46B | 3.11B | 1.37B | 3.53B | 5.47B | 6.65B |
| Reported | Jun 29, 2017 | Jun 28, 2018 | Jun 27, 2019 | Jun 26, 2020 | Jun 29, 2021 | Jun 29, 2022 | Jun 29, 2023 | Jun 27, 2024 | Jun 20, 2025 | Jun 19, 2026 |
Sign up to see institutional holdings
Sign UpPodcast Mentions
Sign up to see podcast mentions and sentiment
Sign UpTimely disclosures published on TDnet, newest first, titles as filed in Japanese. The link opens the disclosure on TDnet. Filings with EDINET (periodic reports, extraordinary reports, offerings, holding and buy-back reports), newest first, titles as filed in Japanese. The link opens the filing on EDINET. Press releases from the company's own website, newest first.
2026 年 10 月 30 日 各
位 会社名 代表者名代表取締役社長 吉田匡慶 (コード番号 2208 東証スタンダード) 問合せ先取締役財務管理部長 間島孝弘 (TEL.0257-23-2333)
2027 年3月期第2四半期(中間期)連結業績予想と実績値との差異 及び通期連結業績予想の修正に関するお知らせ 2026 年4月 28 日に公表いたしました 2027 年3月期第2四半期(中間期)連結業績予想値(2026 年4月1日~2026 年9月 30 日)と本日公表の実績値との差異が生じましたのでお知らせいたします。 また、最近の業績動向等を踏まえ、2027 年3月期通期連結業績予想を下記の通り修正することといたしましたので、 お知らせいたします。 記 1.2027 年3月期第2四半期(中間期)連結業績予想数値と実績値との差異(2026 年4月1日~2026 年9月 30 日) (単位:百万円) 高
営業利益
経常利益
親会社株主に帰属 する 中間純利益
1 株当 た り 中間純利益
前回発表予想(A)
56,600
1,300
1,400
900
37 円 23 銭
今回実績値(B)
56,343
1,954
2,280
1,584
65 円 56 銭
増減額(B-A)
△256
654
880
684
増減率(%)
△0.5
50.4
62.9
76.1
(ご参考)前期第2四半期実績 (2026 年3月期第2四半期)
52,929
1,485
1,569
1,128
売
上
46 円 68 銭
2.2027 年3月期通期連結業績予想数値の修正(2026 年4月1日~2027 年3月 31 日) (単位:百万円) 高
営業利益
経常利益
親会社株主に帰属 する 当期純利益
1 株当 た り 当期純利益
前回発表予想(A)
126,600
5,800
6,000
4,100
169 円 62 銭
今回修正予想(B)
126,600
6,400
6,800
4,700
194 円 45 銭
増減額(B-A)
-
600
800
600
増減率(%)
-
10.3
13.3
14.6
120,303
7,496
8,004
5,913
売
(ご参考)前期実績 (2026 年3月期)
上
244 円 61 銭
3.差異が生じた理由及び修正の理由 (1)第2四半期(中間期)連結業績予想数値と実績値の差異 当中間連結会計期間の業績につきましては、国内菓子事業における主力のビスケットカテゴリーが堅調であった ことから、売上高は概ね計画どおりに推移いたしました。利益面では、中東情勢の影響を受け、資材価格は上昇し ているものの、設備更新等による生産性の向上とコストの削減、経費の効率的な使用に継続して努めたことから、 営業利益、経常利益、親会社株主に帰属する中間純利益はいずれも前回予想を大きく上回りました。
(2)通期連結業績予想 通期の業績予想につきましては、国内菓子事業における主力のビスケットカテゴリーが堅調であったことから、 当下半期の売上高は当初予想から変更はありません。利益面では、原材料価格の高騰に加え、為替相場や個人消費 の動向など先行きが不透明な状況が続くと予想されますが、当中間連結会計期間の実績及び下半期の事業環境を踏 まえて見直した結果、営業利益、経常利益、親会社株主に帰属する当期純利益は前回予想を上回る見通しとなりま したので、業績予想を修正いたします。
※本資料に記載されている業績見通し等の将来に関する記述は、当社が現在入手している情報及び合理的であると 判断する一定の前提に基づいており、実際の業績等は様々な要因により大きく異なる可能性があります。












Prompts
Click prompts to add them under the company line, click again to take one out, then copy the result into your AI chat. Shared by Asian Century Stocks and Uncovered Thai Stocks. Thank you.
ETFs Holding Bourbon Corporation
Exchange-traded funds whose newest published daily portfolio holds one of the company's listings, largest weight first.