2026年5月11日 上 場 会 社名森永製菓株式会社上場取引所東 コ ー ド 番号2201URLhttps://www.morinaga.co.jp 代表者(役職名)代表取締役社長COO(氏名)森信也 問合せ先責任者(役職名) コーポレートコミュニケーション部長 (氏名)岡本奈津子(TEL)03-3456-0150…
2026年5月11日
上 場 会 社名森永製菓株式会社上場取引所東
コ ー ド 番号2201URLhttps://www.morinaga.co.jp
代表者(役職名)代表取締役社長COO(氏名)森信也
問合せ先責任者(役職名)
コーポレートコミュニケーション部長
(氏名)岡本奈津子(TEL)03-3456-0150
定時株主総会開催予定日2026年6月26日配当支払開始予定日2026年6月29日
有価証券報告書提出予定日2026年6月25日
決算補足説明資料作成の有無:有
決算説明会開催の有無:有(機関投資家・アナリスト向け)
(百万円未満切捨て)
1.2026年3月期の連結業績(2025年4月1日~2026年3月31日)
(1)連結経営成績
(%表示は対前期増減率)
売上高営業利益経常利益
親会社株主に帰属する
当期純利益
百万円%百万円%百万円%百万円%
2026年3月期236,6723.422,3945.322,6591.617,7650.3
2025年3月期228,9577.321,2664.922,3046.017,71016.9
(注)包括利益2026年3月期23,919百万円(39.1%)2025年3月期17,201百万円(
△15.5
%)
1株当たり
当期純利益
潜在株式調整後
1株当たり
当期純利益
自己資本
当期純利益率
総資産
経常利益率
売上高
営業利益率
円 銭円 銭%%%
2026年3月期211.07-13.010.49.5
2025年3月期200.85-13.510.39.3
(参考)持分法投資損益2026年3月期△216百万円2025年3月期△184百万円
(2)連結財政状態
総資産純資産自己資本比率1株当たり純資産
百万円百万円%円 銭
2026年3月期225,921143,69662.81,690.58
2025年3月期209,986132,39362.31,523.09
(参考)自己資本2026年3月期
141,956
百万円2025年3月期
130,865
百万円
(3)連結キャッシュ・フローの状況
営業活動による
キャッシュ・フロー
投資活動による
キャッシュ・フロー
財務活動による
キャッシュ・フロー
現金及び現金同等物
期末残高
百万円百万円百万円百万円
2026年3月期23,637△14,289△13,23625,726
2025年3月期10,763△9,837△18,00830,845
2.配当の状況
年間配当金
配当金総額
(合計)
配当性向
(連結)
純資産
配当率
(連結)
第1四半期末第2四半期末第3四半期末
期末合計
円 銭円 銭円 銭円 銭円 銭百万円%%
2025年3月期-0.00-60.0060.005,16029.94.0
2026年3月期-32.50-32.5065.005,46430.84.0
2027年3月期(予想)-35.00-35.0070.0035.7
3.2027年3月期の連結業績予想(2026年4月1日~2027年3月31日)
(%表示は、通期は対前期、四半期は対前年同四半期増減率)
売上高営業利益経常利益
親会社株主に帰属
する当期純利益
1株当たり
当期純利益
百万円%百万円%百万円%百万円%円 銭
第2四半期(累計)131,0007.512,100△9.411,900△11.59,200△16.6109.30
通期257,0008.622,8001.822,200△2.016,500△7.1196.03
※注記事項
(1)期中における連結範囲の重要な変更:無
新規―社(社名)、除外―社(社名)
(2)会計方針の変更・会計上の見積りの変更・修正再表示
①会計基準等の改正に伴う会計方針の変更:無
②①以外の会計方針の変更:無
③会計上の見積りの変更:無
④修正再表示:無
(3)発行済株式数(普通株式)
①期末発行済株式数(自己株式を含む)
2026年3月期86,111,638株2025年3月期88,011,638株
②期末自己株式数
2026年3月期2,142,176株2025年3月期2,090,656株
③期中平均株式数
2026年3月期84,171,889株2025年3月期88,177,236株
※期末自己株式数には、役員報酬BIP信託が保有する当社株式(2026年3月期80,784株、2025年3月期
80,784株)が含まれております。また、役員報酬BIP信託が保有する当社株式を、期中平均株式数の計算
において控除する自己株式数に含めております。
(参考)個別業績の概要
2026年3月期の個別業績(2025年4月1日~2026年3月31日)
(1)個別経営成績
(%表示は対前期増減率)
売上高営業利益経常利益当期純利益
百万円%百万円%百万円%百万円%
2026年3月期190,6064.113,86840.416,76825.915,09328.1
2025年3月期183,0195.69,881△6.013,31916.311,77940.1
1株当たり
当期純利益
潜在株式調整後
1株当たり当期純利益
円 銭円 銭
2026年3月期179.32-
2025年3月期133.59-
(2)個別財政状態
総資産純資産自己資本比率1株当たり純資産
百万円百万円%円 銭
2026年3月期185,01597,56452.71,161.90
2025年3月期176,28994,71753.71,102.38
(参考)自己資本2026年3月期97,564百万円2025年3月期94,717百万円
※決算短信は公認会計士又は監査法人の監査の対象外です
※業績予想の適切な利用に関する説明、その他特記事項
本資料に記載されている業績見通し等の将来に関する記述は、当社が現在入手している情報及び合理的であると
判断する一定の前提に基づいており、実際の業績等は様々な要因により大きく異なる可能性があります。
森永製菓株式会社(2201)2026年3月期決算短信
1
○添付資料の目次
1.経営成績等の概況............................................................................................................2
(1)当期の経営成績の概況................................................................................................2
(2)当期の財政状態の概況................................................................................................5
(3)当期のキャッシュ・フローの概況.................................................................................5
(4)今後の見通し............................................................................................................6
(5)資本政策及び株主還元政策..........................................................................................7
2.会計基準の選択に関する基本的な考え方..............................................................................8
3.連結財務諸表及び主な注記................................................................................................9
(1)連結貸借対照表.........................................................................................................9
(2)連結損益計算書及び連結包括利益計算書........................................................................11
(3)連結株主資本等変動計算書..........................................................................................13
(4)連結キャッシュ・フロー計算書....................................................................................15
(5)連結財務諸表に関する注記事項....................................................................................17
(継続企業の前提に関する注記)..........................................................................................17
(株主資本の金額に著しい変動があった場合の注記)...............................................................17
(連結財務諸表作成のための基本となる重要な事項)...............................................................17
(連結損益計算書関係)......................................................................................................18
(連結キャッシュ・フロー計算書関係).................................................................................18
(セグメント情報等).........................................................................................................19
(収益認識関係)...............................................................................................................22
(1株当たり情報)............................................................................................................23
(重要な後発事象)............................................................................................................24
※参考資料2026年3月期決算短信補足資料
森永製菓株式会社(2201)2026年3月期決算短信
2
1.経営成績等の概況
(1)当期の経営成績の概況
当連結会計年度の我が国の経済は、雇用・所得環境の改善やインバウンド需要の堅調な推移を
背景に、内需を中心として緩やかな回復基調で推移しました。一方で、期中を通じて継続した物
価上昇の影響により、消費者マインドには慎重さが残り、個人消費は底堅さを維持しつつも、伸
び悩む推移となりました。また、各国の通商政策や不安定な国際情勢による世界経済の先行き不
透明感が続く中、事業活動を取り巻く環境には引き続き不確実性が残る状況です。
このような中、当社グループは「2030経営計画」の達成に向けて、その道筋をつくる2ndステ
ージである「2024中期経営計画」の2期目として、引き続き飛躍に向けた成長軌道の確立に向け
て成長性と資本収益性の好循環を生み出すべく、各事業の強化を図ってまいりました。
その結果、売上高は、主に好調な菓子食品事業、冷菓事業が牽引し、2,366億7千2百万円と前
年実績に比べ77億1千5百万円(3.4%)の増収となりました。
損益については、原材料価格の高騰や物流費の増加、経営基盤の強化に向けたDXや人的資本
への投資などがありましたが、増収及び価格改定・コストダウンを中心とした打ち返しにより、
営業利益は前年実績に比べ11億2千8百万円(5.3%)増益の223億9千4百万円、経常利益も前
年実績に比べ3億5千5百万円(1.6%)増益の226億5千9百万円となりました。親会社株主に
帰属する当期純利益は前年実績に比べ5千5百万円(0.3%)増益の177億6千5百万円となりま
した。
なお、当連結会計年度より、連結子会社の決算日を3月31日に統一しております。詳細はP.
17「3.連結財務諸表及び主な注記(5)連結財務諸表に関する注記事項(連結財務諸表作成の
ための基本となる重要な事項)3連結子会社の事業年度等に関する事項」をご覧ください。
セグメントの業績は、次のとおりであります。
<食料品製造>
菓子食品事業
ビスケットカテゴリーでは、「森永ビスケット」は9月に実施した価格改定による一時的な影
響もありましたが、着実に需要を回復し、前年実績を上回りました。
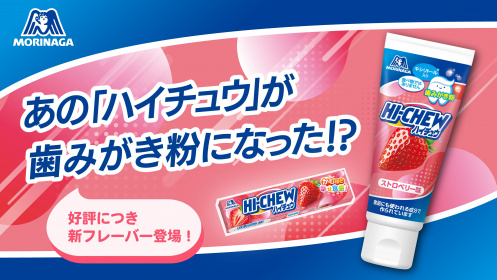
キャンディカテゴリーでは、「ハイチュウ」は、発売50周年を切り口としたプロモーションな
どにより需要喚起に取り組みました。食感訴求を強化した「ハイチュウミニ」が好調を継続した
一方、「ハイチュウプレミアム」の販売が伸び悩み、ブランド全体で前年実績をわずかに下回り
ました。「森永ラムネ」は、受験生に向けたプロモーションと店頭露出の強化により、パウチ形
態の「大粒ラムネ」、ボトル形態いずれも好調が継続したほか、「生ラムネ玉」の販売好調も寄
与し、前年実績を大きく上回りました。
チョコレートカテゴリーでは、「カレ・ド・ショコラ」は、6月に実施した価格改定以降もハ
イカカオの健康需要拡大による「カカオ70」の好調が継続したほか、1月の期間限定品の販売
好調も寄与し、前年実績を上回りました。「ダース」は、高単価商品が苦戦しましたが、基幹品
の「ダース<ミルク>」「白いダース」は9月の価格改定以降も堅調に推移し、前年実績並みと
なりました。「チョコボール」は、“おもちゃのカンヅメ”のプロモーション刷新など、断続的
な話題喚起により基幹品の好調が継続し、前年実績を上回りました。
食品カテゴリーでは、「森永ココア」は、引き続き健康ブランドとして需要喚起に取り組み、
9月の価格改定以降も「純ココア」を中心に好調に推移し、前年実績を大きく上回りました。
「森永甘酒」は、前年実績を下回りました。
なお、原材料等のコストアップへの対応として、昨年2月・3月にチョコレートカテゴリー及
びココアの一部商品、6月に「カレ・ド・ショコラ」、9月にチョコレート及びビスケットカテ
ゴリー、ココアなど食品カテゴリーの一部商品において価格改定・内容量の減量を実施しまし
た。さらに、一部商品では商品規格を見直す等の対策も講じております。これらの取組みの結果、
収益性は着実に改善しております。
森永製菓株式会社(2201)2026年3月期決算短信
3
これらの結果、菓子食品事業全体の売上高は889億5千7百万円と前年実績に比べ45億2千1百
万円(5.4%)増となりました。
損益については、原材料価格の高騰を増収及び価格改定・コストダウン等の取組みで打ち返し、
営業利益は前年実績に比べ42億4千6百万円(108.4%)増益の81億6千3百万円となりました。
冷菓事業
「ジャンボ」グループは、TVCMやポップアップショップを通じた「バニラモナカジャン
ボ」の認知拡大も奏功し、9月の価格改定以降も販売は好調に推移しました。その結果、グルー
プ全体で前年実績を上回りました。「板チョコアイス」は、基幹品の好調な推移に加え、新商品
「板チョコアイスマカダミア」の発売も寄与し、前年実績を上回りました。「ザ・クレープ」
は、期間限定品の発売や消費者キャンペーンの展開など、顧客接点拡大に取り組んだ結果、9月
の価格改定以降も好調が継続し、前年実績を大きく上回りました。「アイスボックス」は、割材
としての活用を訴求するプロモーションなど、秋冬の需要喚起と店頭での取り扱い拡大に取り組
み、引き続き好調に推移しました。
なお、原材料等のコストアップに対する収益改善策として、主力品について、9月に価格改
定・内容量の減量を実施しております。
これらの結果、冷菓事業全体の売上高は535億2千8百万円と前年実績に比べ41億6千8百万円
(8.4%)増となりました。
損益については、原材料価格の高騰や物流費の増加を増収及び価格改定効果で打ち返し、営業
利益は前年実績に比べ7億5百万円(16.5%)増益の49億6千3百万円となりました。
in事業
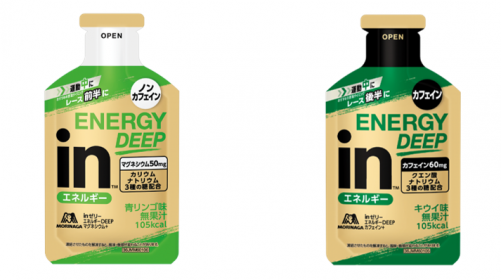
「inゼリー」は、日常生活における飲用シーンの訴求に取り組む中で、「エネルギーブドウ
糖」は堅調に推移しましたが、「エネルギー」を中心とする基幹品の苦戦により、前年実績を下
回りました。「inバー」は、直近ではメインフレーバーの好調に加え、プロテインバーから栄
養バランス食品へと領域を拡大した新商品の発売によりターゲット層の拡大を図っておりますが、
通期としては前年実績を下回りました。
これらの結果、in事業全体の売上高は299億5千5百万円と前年実績に比べ13億8千4百万円
(4.4%)減となりました。
損益については、減収や物流費の増加により、営業利益は前年実績に比べ14億1千2百万円
(19.3%)減益の58億8千8百万円となりました。
通販事業
「おいしいコラーゲンドリンク」は、節約志向の高まりや昨年4月に実施した価格改定による
解約等の影響が残る中で、顧客獲得効率を踏まえた広告投下により、顧客基盤の拡大に取り組み
ましたが、ブランド全体で前年実績を下回りました。「おいしい青汁」は、前年実績を下回りま
した。
これらの結果、通販事業全体の売上高は107億4千8百万円と前年実績に比べ4億3千6百万円
(3.9%)減となりました。
損益については、価格改定効果に加え、顧客獲得効率の状況に応じて広告投資を抑制したこと
により、営業利益は前年実績に比べ2億3千6百万円(49.4%)増益の7億1千4百万円となり
ました。
森永製菓株式会社(2201)2026年3月期決算短信
4
事業子会社等
(株)アントステラは、原材料や人件費等のコストアップに対する収益改善策として10月に価格改
定を実施しました。販売については、大手量販店の銘店コーナーへの出店拡大などに取り組みま
したが、前年実績を下回りました。森永市場開発(株)は、テーマパークにおける販売が好調に推移
したほか、アンテナショップにおける販売も好調を継続し、前年実績を上回りました。
これらの結果、事業子会社等全体の売上高は112億7千6百万円と前年実績に比べ3千5百万円
(0.3%)増となりました。
損益については、営業利益は前年実績に比べ3億7千1百万円(106.9%)増益の7億1千8百
万円となりました。
[国内における主な商品の前年比(単位:%)]
菓子食品事菓子食品事菓子食品事菓子食品事菓子食品事業業業業業冷菓事冷菓事冷菓事冷菓事冷菓事業業業業業
森永ビスケット101ジャンボグループ105
ハイチュウ99板チョコアイス104
森永ラムネ126ザ・クレープ121
カレ・ド・ショコラ113アイスボックス113
ダース100iiiiinnnnn事事事事事業業業業業
チョコボール111inゼリー95
森永甘酒93inバー99
森永ココア119通販事通販事通販事通販事通販事業業業業業
おいしいコラーゲンドリンク95
※表中の数値は国内販売実績にて算出
米国事業
「HI-CHEW」は、食品スーパーチャネルにおける取り扱いSKU数の拡大や新規チャネルの開
拓、季節催事における販売促進に取り組みました。一方で、インフレに伴う消費低迷によりコン
ビニチャネルにおける販売が引き続き伸び悩んだことや、カカオ高騰を背景に大手菓子メーカー
がキャンディカテゴリーへの注力を強めたことで、競争環境が一層激化したことの影響などもあ
り、ブランド全体で前年実績を下回りました。ゼリー飲料「Chargel」は、サンプリング活動やタ
グラインの刷新などを通じて、商品理解の促進や日常的なシーンにおける需要獲得に向けた取組
みを進めております。
なお、原材料や人件費、物流費等のコストアップに対する収益改善策として、11月に一部商品
において価格改定を実施しております。
これらの結果、米国事業全体の売上高は202億1千4百万円と前年実績に比べ7億4千2百万円
(3.5%)減となりました。
損益については、減収や原材料価格の高騰に加え、米国の関税政策による影響、並びに競争環
境激化への対応として店頭での販促を強化したことによる販売促進費の増加により、営業利益は
前年実績に比べ17億5千4百万円(57.3%)減益の13億1千万円となりました。
中国・台湾・輸出等
中国では、「HI-CHEW」が店舗・ネット販売ともに伸長し、好調に推移しました。台湾では、
「inゼリー」の販売が好調を継続したほか、「HI-CHEW」も堅調に推移しました。探索・研究領
域である東アジア・東南アジア・オセアニア地区や欧州においても、「HI-CHEW」のグローバルブ
ランドとしてのさらなる拡大に向けて、取組みを進めております。
これらの結果、中国・台湾・輸出等全体の売上高は104億8千6百万円と前年実績に比べ14億2
千6百万円(15.7%)増となりました。
森永製菓株式会社(2201)2026年3月期決算短信
5
営業利益は前年実績に比べ7千3百万円(14.7%)増益の5億6千9百万円となりました。
以上の結果、<食料品製造>の売上高は2,251億6千7百万円と前年実績に比べ75億8千9百万円
(3.5%)増となりました。セグメント利益は223億2千7百万円と前年実績に比べ24億6千5百万
円(12.4%)の増益となりました。
<食料卸売>
売上高は、87億9千8百万円と前年実績に比べ1億8百万円(1.2%)増となりました。セグメン
ト利益は前年実績に比べ7億5千1百万円(52.1%)減益の6億9千万円となりました。
<不動産及びサービス>
売上高は、18億9千7百万円と前年実績に比べ2千7百万円(1.4%)増となりました。セグメン
ト利益は8億8千万円と前年実績に比べ7千9百万円(9.8%)の増益となりました。
<その他>
売上高8億9百万円、セグメント利益1億4千5百万円であります。
(2)当期の財政状態の概況
当連結会計年度末における総資産の残高は2,259億2千1百万円となり、前連結会計年度末に比
べ159億3千5百万円増加しております。主な要因は、現金及び預金が米国第2工場の建設にかか
る支出並びに配当等の支払や自己株式取得で減少した一方で、建設仮勘定の増加、数理計算上の
差異による退職給付に係る資産の増加などによるものであります。
負債の残高は822億2千5百万円となり、前連結会計年度末に比べ46億3千3百万円増加してお
ります。主な要因は、未払金や未払法人税等、繰延税金負債の増加などによるものであります。
純資産の残高は1,436億9千6百万円となり、前連結会計年度末に比べ113億3百万円増加して
おります。主な要因は、親会社株主に帰属する当期純利益の計上、数理計算上の差異による退職
給付に係る調整累計額の増加などによるものであります。
以上の結果、自己資本比率は前連結会計年度末より0.5ポイント増加し、62.8%となりました。
(3)当期のキャッシュ・フローの概況
当連結会計年度末における現金及び現金同等物(以下「資金」という。)は、前連結会計年度
末に比べ51億1千9百万円減少し、257億2千6百万円となりました。
(営業活動によるキャッシュ・フロー)
当連結会計年度における営業活動による資金の増加は236億3千7百万円となりました。主な
内容は、棚卸資産の増加額22億2千9百万円、法人税等の支払額50億4千9百万円といった資
金減少の一方、税金等調整前当期純利益253億2千7百万円、減価償却費101億6千万円による
ものであります。
(投資活動によるキャッシュ・フロー)
当連結会計年度における投資活動による資金の減少は142億8千9百万円となりました。主な
内容は、有形固定資産の取得による支出169億8千6百万円、投資有価証券の売却による収入36
億5千8百万円によるものであります。
(財務活動によるキャッシュ・フロー)
当連結会計年度における財務活動による資金の減少は132億3千6百万円となりました。主な
内容は、自己株式の取得による支出47億5千4百万円、配当金の支払額78億9千3百万円によ
るものであります。
森永製菓株式会社(2201)2026年3月期決算短信
6
なお、キャッシュ・フロー指標のトレンドは次のとおりであります。
2022年
3月期
2023年
3月期
2024年
3月期
2025年
3月期
2026年
3月期
自己資本比率(%)60.760.758.762.362.8
時価ベースの自己資本比率(%)88.886.2106.4102.5100.4
キャッシュ・フロー対有利子負債比率(年)0.4-0.61.80.8
インタレスト・カバレッジ・レシオ(倍)739.8-288.599.5203.8
(注)自己資本比率:自己資本/総資産
時価ベースの自己資本比率:株式時価総額/総資産
キャッシュ・フロー対有利子負債比率:有利子負債/キャッシュ・フロー
インタレスト・カバレッジ・レシオ:キャッシュ・フロー/利払い
※各指標は、いずれも連結ベースの財務数値により算出しております。
※株式時価総額は、期末株価終値×期末発行済株式数(自己株式控除後)により算出しております。
※キャッシュ・フローは、連結キャッシュ・フロー計算書の営業活動によるキャッシュ・フローを使用してお
ります。有利子負債は、連結貸借対照表に計上されている負債のうち、リース債務を除く利子を支払ってい
る負債を対象としております。また、利払いについては、連結キャッシュ・フロー計算書の利息の支払額を
使用しております。
※2023年3月期のキャッシュ・フロー対有利子負債比率及びインタレスト・カバレッジ・レシオは、営業キャ
ッシュ・フローがマイナスのため記載しておりません。
(4)今後の見通し
不安定な国際情勢による地政学的なリスクに起因したコスト高騰や供給不安が顕在化するなか、
更なる物価上昇への警戒感により消費者の節約志向が一段と高まるなど、当社グループを取り巻く
経営環境は先行き不透明な状態が続くと想定されます。また、中長期的な経営環境につきまして
は、日本国内の構造的な人口減少と世界的な人口増加、デジタル技術の発展によるビジネスモデル
の変革、世界的な健康志向の一層の高まりも予想されます。このような経営環境を踏まえ、当社グ
ループは、持続可能な社会の実現に貢献しつつ、2030経営計画達成に向けて中長期的な成長を果た
すべく、高い収益性、成長性が見込める事業へ経営資源を集中することで事業ポートフォリオの転
換を図り、事業規模の拡大と収益性の向上に取り組んでまいります。また、投資原資を安定的に創
出するべく、一層の経営効率化と財務戦略に基づく安定的な資金調達により、R&DやDXへの投
資を強化することで中長期の成長に資する基盤づくりに引き続き努めてまいります。
足元の中東情勢に伴うナフサ由来の素材を中心とした材料、エネルギーコストや物流費の高騰に
対しては、価格改定品の市場浸透や原価低減などに取り組むとともに、今後の価格改定についても
必要に応じ機動的に検討してまいります。
このような取組みにより、次連結会計年度における当社グループの業績見通しについては、次の
とおりであります。なお、2026年4月1日付で株式を取得し子会社化したMyMoHoldco,Inc.に関
する業績影響については、取得原価配分の手続き完了前の概算値を織り込んでおります
。
売上高2,570億円(前年実績比:8.6%増)
営業利益228億円(前年実績比:1.8%増)
経常利益222億円(前年実績比:2.0%減)
親会社株主に帰属する当期純利益165億円(前年実績比:7.1%減)
(注)業績見通しの前提となる為替レートにつきましては、1米ドル153
円を想定しております。
森永製菓株式会社(2201)2026年3月期決算短信
7
(5)資本政策及び株主還元政策
当社グループは、資本コストや株価を意識した経営を実践し、また盤石な財務基盤を維持する
ことにより、持続的な企業価値向上と安定的な株主還元を実現いたします。
企業価値を向上させるためには、株主資本コストを上回るROEを中長期的に実現する必要があ
り、そのため、ROICマネジメントの実践による事業収益力の向上と財務レバレッジの活用を含
む資本コスト低減に取り組んでまいります。
【ROICマネジメントの実践による成長力と資本収益性の向上】
当社グループは、中長期的な企業価値の向上を図るために、ROICマネジメントを実践し、
最適なポートフォリオ形成に向けた事業戦略を実行いたします。「成長性」と「資本収益性」の2
軸で事業を分析し、各事業の中長期的な戦略・施策を決定いたします。成長を加速する事業、資本
収益性を改善する事業を見定め、投資先・投資規模を含めて、経営資源を最適に配分してまいりま
す。
主に重点領域の事業等においては、事業提携やM&Aなどのインオーガニック成長や当社のマ
テリアリティ対応による新たな事業機会の創出を含めて、戦略的な成長投資を最優先とし、飛躍的
な成長を促してまいります。
ROIC水準が低く、資本収益性の改善が必要な基盤領域等の事業においては、主に収益性や
投下資本効率の改善を通じて「資本収益性」の改善に取り組んでまいります。
具体的には、保有資産を活かした売上高拡大を志向しつつ、維持更新投資の選択と集中により
段階的なアセットライトを推進してまいります。同時に、コスト低減、機動的な価格改定等の収益
性改善施策を展開してまいります。
個別の投資の実行にあたっては、投資決定基準に基づき案件評価を厳格に行い、また投資回収
状況を継続的にフォローしながら、資本コストを意識した投資管理を行っております。
【財務安全性の確保と資金調達方針】
当社グループは、外的経営環境の急変や戦略的大型投資案件(M&A等)の発現に備え、一定
水準の財務安全性と投資余力を確保することを基本方針としております。
財務安全性の基準といたしましては、(株)日本格付研究所における長期発行体格付「A」以上を
維持することを原則としてまいります。また、手元流動性、ネットD/Eレシオ、有利子負債/EB
ITDA倍率といった財務指標をモニタリングして財務安全性を確保してまいります。
その上で、投資資金需要を満たすための資金調達にあたっては、適切な手元資金の水準、資金
調達コストの水準などの調達条件、財務安全性指標やROE・ROICといった財務指標への影響
などを総合的に勘案した上で、決定いたします。
【資本コスト低減への取組み】
当社グループは、企業価値の向上に向けて資本コストの低減に取り組んでまいります。現状の
ネットキャッシュの状況に対し、財務安全性や投資資金需要を見極めた上で、有利子負債の構成を
高め、財務レバレッジを活用することで、現状6~7%程度と推計されるWACC(加重平均資本
コスト)の低減を図ってまいります。
株主資本コストは7~8%程度と推計されますが、その低減にあたっては、環境変化に強い事
業ポートフォリオの構築やサステナビリティ経営の徹底による長期事業リスクの低減が重要と認識
しております。そのため、当社のマテリアリティへの対応を進めるとともに、無形投資(広告投
資・R&D投資・DX投資・人材投資など)を強化し、持続的な事業成長力を高めてまいります。
また、政策保有株式の更なる縮減、非事業不動産等の売却・処分推進などのアセットライトに
よって、投下資本の圧縮と成長投資資金の確保を図るとともに、資産価値変動リスクを低減いたし
ます。そのうち政策保有株式については、2024中期経営計画期間終了までに2024年度末より半減を
目指してまいります。
さらに、財務・非財務情報の開示や株主・投資家との対話を強化し、中長期的事業成長への取
森永製菓株式会社(2201)2026年3月期決算短信
8
組み、事業リスク等への対応状況などをご理解いただき、適正な株価形成によって株価ボラティリ
ティを抑制してまいります。
【株主還元方針】
当社グループは、戦略的かつ重要な事業投資を優先することを原則としつつ、株主の皆様への
利益還元について、経営基盤の盤石化のもとに、継続的かつ安定的な株主還元の実施を基本方針と
しております。
株主還元にあたっては、健全なバランスシートを維持することを前提に、配当性向の水準、フ
リーキャッシュ・フローを考慮しつつ、資本政策の指標である純資産配当率(DOE)の水準を中
長期的に引き上げていくことを目指してまいります。また、総還元性向を意識して、必要に応じ自
己株式の取得を機動的に実施することも検討してまいります。
当期末の配当金につきましては、当連結会計年度の業績及び今後の事業展開などを慎重に検討
してまいりました結果、2025年5月9日に公表いたしました2025年3月期決算短信にて記載のとお
り、1株当たり32.5円とする予定であります。(2026年6月26日開催予定の第178期定時株主総会
に付議予定)
次期にあたる2027年3月期の配当金につきましては、当期の1株当たり65円から5円増配の1
株あたり70円(うち中間配当35円)とする予定であります。詳細につきましては、本日(2026年5
月11日)公表の「剰余金の配当に関するお知らせ」をご参照ください。
2.会計基準の選択に関する基本的な考え方
当社グループは、連結財務諸表の期間比較可能性等を考慮し、当面は日本基準で連結財務諸表を作
成する方針であります。
なお、当社グループは、将来における国際会計基準(IFRS)の適用に備え、日本基準とのギャ
ップ分析、導入における影響度調査、適用時期等について検討を進めております。
森永製菓株式会社(2201)2026年3月期決算短信
9
3.連結財務諸表及び主な注記
(1)連結貸借対照表
(単位:百万円)
前連結会計年度
(2025年3月31日)
当連結会計年度
(2026年3月31日)
資産の部
流動資産
現金及び預金31,06226,419
受取手形及び売掛金27,34028,448
商品及び製品21,39122,000
仕掛品592536
原材料及び貯蔵品15,96917,411
未収還付法人税等-414
その他8,38010,639
貸倒引当金△69△42
流動資産合計104,667105,827
固定資産
有形固定資産
建物及び構築物67,41967,533
減価償却累計額△32,958△34,554
建物及び構築物(純額)34,46132,979
機械装置及び運搬具105,716107,884
減価償却累計額△78,919△84,040
機械装置及び運搬具(純額)26,79723,843
工具、器具及び備品6,6216,783
減価償却累計額△5,029△5,485
工具、器具及び備品(純額)1,5921,298
土地12,09911,451
リース資産2,3392,331
減価償却累計額△1,265△1,386
リース資産(純額)1,074945
建設仮勘定3,95718,790
有形固定資産合計79,98289,309
無形固定資産
ソフトウエア2,8353,128
その他1,239582
無形固定資産合計4,0753,710
投資その他の資産
投資有価証券10,25110,030
退職給付に係る資産7,15013,478
繰延税金資産1,9571,662
その他1,9371,943
貸倒引当金△34△41
投資その他の資産合計21,26127,074
固定資産合計105,319120,094
資産合計209,986225,921
森永製菓株式会社(2201)2026年3月期決算短信
10
(単位:百万円)
前連結会計年度
(2025年3月31日)
当連結会計年度
(2026年3月31日)
負債の部
流動負債
支払手形及び買掛金21,60820,588
短期借入金-3,000
リース債務492468
未払金10,87712,461
未払法人税等1,9744,560
返金負債5,6435,440
賞与引当金3,3083,346
その他7,9847,720
流動負債合計51,88957,585
固定負債
社債9,0009,000
長期借入金10,0007,000
リース債務696579
繰延税金負債-2,125
役員株式給付引当金102134
環境対策引当金3-
退職給付に係る負債2,0821,742
資産除去債務6768
受入敷金保証金3,6683,625
その他81364
固定負債合計25,70324,640
負債合計77,59282,225
純資産の部
株主資本
資本金18,61218,612
資本剰余金17,18617,186
利益剰余金87,07692,377
自己株式△5,252△5,370
株主資本合計117,623122,806
その他の包括利益累計額
その他有価証券評価差額金5,7616,138
繰延ヘッジ損益△12437
為替換算調整勘定4,8646,098
退職給付に係る調整累計額2,7416,876
その他の包括利益累計額合計13,24219,150
非支配株主持分1,5271,739
純資産合計132,393143,696
負債純資産合計209,986225,921
森永製菓株式会社(2201)2026年3月期決算短信
11
(2)連結損益計算書及び連結包括利益計算書
連結損益計算書
(単位:百万円)
前連結会計年度
(自2024年4月1日
至2025年3月31日)
当連結会計年度
(自2025年4月1日
至2026年3月31日)
売上高228,957236,672
売上原価138,911141,713
売上総利益90,04694,959
販売費及び一般管理費68,77972,565
営業利益21,26622,394
営業外収益
受取利息116156
受取配当金409274
補助金収入732105
その他171226
営業外収益合計1,429763
営業外費用
支払利息113134
持分法による投資損失184216
その他93146
営業外費用合計392497
経常利益22,30422,659
特別利益
固定資産売却益247344
投資有価証券売却益3,3062,923
特別利益合計3,5533,268
特別損失
固定資産除売却損371410
減損損失1,00337
契約解約金-151
事業撤退損1980
その他-0
特別損失合計1,573600
税金等調整前当期純利益24,28425,327
法人税、住民税及び事業税6,0357,235
法人税等調整額403158
法人税等合計6,4387,393
当期純利益17,84617,933
非支配株主に帰属する当期純利益136167
親会社株主に帰属する当期純利益17,71017,765
森永製菓株式会社(2201)2026年3月期決算短信
12
連結包括利益計算書
(単位:百万円)
前連結会計年度
(自2024年4月1日
至2025年3月31日)
当連結会計年度
(自2025年4月1日
至2026年3月31日)
当期純利益17,84617,933
その他の包括利益
その他有価証券評価差額金△1,849376
繰延ヘッジ損益△128166
為替換算調整勘定1,9141,298
退職給付に係る調整額△5824,144
その他の包括利益合計△6445,986
包括利益17,20123,919
(内訳)
親会社株主に係る包括利益16,98823,674
非支配株主に係る包括利益212245
森永製菓株式会社(2201)2026年3月期決算短信
13
(3)連結株主資本等変動計算書
前連結会計年度(自2024年4月1日至2025年3月31日)
(単位:百万円)
株主資本
資本金資本剰余金利益剰余金自己株式株主資本合計
当期首残高18,61217,18686,305△4,865117,239
当期変動額
剰余金の配当△4,987△4,987
親会社株主に帰属する
当期純利益
17,71017,710
自己株式の取得△12,460△12,460
自己株式の処分-△233355121
自己株式の消却△11,71711,717-
株主資本以外の項目の
当期変動額(純額)
当期変動額合計-771△386384
当期末残高18,61217,18687,076△5,252117,623
その他の包括利益累計額
非支配株主
持分
純資産合計
その他有価証券
評価差額金
繰延ヘッジ損益
為替換算
調整勘定
退職給付に係る
調整累計額
その他の
包括利益
累計額合計
当期首残高7,610△23,0273,32713,9631,450132,653
当期変動額
剰余金の配当△4,987
親会社株主に帰属する
当期純利益
17,710
自己株式の取得△12,460
自己株式の処分121
自己株式の消却-
株主資本以外の項目の
当期変動額(純額)
△1,849△1211,836△586△72177△643
当期変動額合計△1,849△1211,836△586△72177△259
当期末残高5,761△1244,8642,74113,2421,527132,393
森永製菓株式会社(2201)2026年3月期決算短信
14
当連結会計年度(自2025年4月1日至2026年3月31日)
(単位:百万円)
株主資本
資本金資本剰余金利益剰余金自己株式株主資本合計
当期首残高18,61217,18687,076△5,252117,623
連結子会社の決算期変
更に伴う増減
196196
連結子会社の決算期変更
に伴う増減を反映した当
期首残高
18,61217,18687,273△5,252117,820
当期変動額
剰余金の配当△7,893△7,893
親会社株主に帰属する
当期純利益
17,76517,765
自己株式の取得△4,886△4,886
自己株式の処分000
自己株式の消却△0△4,7684,768-
株主資本以外の項目の
当期変動額(純額)
当期変動額合計05,103△1174,986
当期末残高18,61217,18692,377△5,370122,806
その他の包括利益累計額
非支配株主
持分
純資産合計
その他有価証券
評価差額金
繰延ヘッジ損益
為替換算
調整勘定
退職給付に係る
調整累計額
その他の
包括利益
累計額合計
当期首残高5,761△1244,8642,74113,2421,527132,393
連結子会社の決算期変
更に伴う増減
34231
連結子会社の決算期変更
に伴う増減を反映した当
期首残高
5,761△1244,8642,74113,2421,562132,624
当期変動額
剰余金の配当△7,893
親会社株主に帰属する
当期純利益
17,765
自己株式の取得△4,886
自己株式の処分0
自己株式の消却-
株主資本以外の項目の
当期変動額(純額)
3761611,2344,1355,9081766,085
当期変動額合計3761611,2344,1355,90817611,071
当期末残高6,138376,0986,87619,1501,739143,696
森永製菓株式会社(2201)2026年3月期決算短信
15
(4)連結キャッシュ・フロー計算書
(単位:百万円)
前連結会計年度
(自2024年4月1日
至2025年3月31日)
当連結会計年度
(自2025年4月1日
至2026年3月31日)
営業活動によるキャッシュ・フロー
税金等調整前当期純利益24,28425,327
減価償却費9,91810,160
減損損失1,00337
役員株式給付引当金の増減額(△は減少)2732
退職給付に係る負債の増減額(△は減少)△1,054△130
退職給付に係る資産の増減額(△は増加)△724△489
賞与引当金の増減額(△は減少)209150
貸倒引当金の増減額(△は減少)20△17
環境対策引当金の増減額(△は減少)△146△3
受取利息及び受取配当金△525△431
補助金収入△732△105
支払利息113134
持分法による投資損益(△は益)184216
投資有価証券売却損益(△は益)△3,306△2,923
固定資産売却損益(△は益)△173△198
固定資産除却損297265
事業撤退損1980
売上債権の増減額(△は増加)3,706△653
棚卸資産の増減額(△は増加)△8,534△2,229
仕入債務の増減額(△は減少)△1,636△963
その他△2,652△118
小計20,47828,059
利息及び配当金の受取額531426
利息の支払額△108△115
法人税等の支払額又は還付額(△は支払)△10,123△5,049
補助金の受取額168332
事業撤退による支払額△182△15
営業活動によるキャッシュ・フロー10,76323,637
投資活動によるキャッシュ・フロー
定期預金の純増減額(△は増加)105△425
有価証券の償還による収入2,500-
有形固定資産の取得による支出△13,579△16,986
有形固定資産の売却による収入4801,050
無形固定資産の取得による支出△2,318△714
投資有価証券の取得による支出△2△1
投資有価証券の売却による収入4,2983,658
関係会社株式の取得による支出△598-
貸付けによる支出△125△120
貸付金の回収による収入-5
その他△597△754
投資活動によるキャッシュ・フロー△9,837△14,289
森永製菓株式会社(2201)2026年3月期決算短信
16
(単位:百万円)
前連結会計年度
(自2024年4月1日
至2025年3月31日)
当連結会計年度
(自2025年4月1日
至2026年3月31日)
財務活動によるキャッシュ・フロー
短期借入れによる収入-3,000
長期借入れによる収入-500
長期借入金の返済による支出-△3,500
自己株式の取得による支出△12,460△4,754
配当金の支払額△4,987△7,893
非支配株主への配当金の支払額△134△68
その他△425△519
財務活動によるキャッシュ・フロー△18,008△13,236
現金及び現金同等物に係る換算差額8261,100
現金及び現金同等物の増減額(△は減少)△16,256△2,787
現金及び現金同等物の期首残高47,10130,845
連結子会社の決算期変更に伴う現金及び現金同等物
の期首残高増減額(△は減少)
-△2,331
現金及び現金同等物の期末残高30,84525,726
森永製菓株式会社(2201)2026年3月期決算短信
17
(5)連結財務諸表に関する注記事項
(継続企業の前提に関する注記)
該当事項はありません。
(株主資本の金額に著しい変動があった場合の注記)
(自己株式の取得)
当社は2025年5月9日開催の取締役会決議に基づき、当連結会計年度において、自己株式1,900,000株の取得を
行い、この結果、自己株式が4,749百万円増加しております。
(自己株式の消却)
当社は2025年5月9日開催の取締役会決議に基づき、2025年6月13日付で、自己株式1,900,000株の消却を行い
ました。この結果、当連結会計年度において、利益剰余金が4,768百万円、自己株式が4,768百万円減少しており
ます。
これらの結果、当連結会計年度において、利益剰余金が92,377百万円、自己株式が5,370百万円となりました。
(連結財務諸表作成のための基本となる重要な事項)
1連結の範囲に関する事項
連結子会社の数15社(主要会社名高崎森永(株))
非連結子会社の数2社(主要会社名バクテクス(株))
(連結の範囲から除いた理由)
非連結子会社は小規模であり、合計の総資産、売上高、当期純損益(持分に見合う額)及び利益剰余金(持分に
見合う額)等は、いずれも連結財務諸表に重要な影響を及ぼしていないためであります。
2持分法の適用に関する事項
持分法適用の非連結子会社2社(主要会社名バクテクス(株))
3連結子会社の事業年度等に関する事項
(連結子会社の事業年度等に関する事項の変更)
従来、連結子会社のうち決算日が2月28日であった(株)アントステラ、12月31日であった台湾森永製菓股份有限公
司、米国森永製菓(株)、森永アメリカフーズ(株)、森永アジアパシフィック(株)は、各社決算日現在の財務諸表を使用し、
連結決算日との間に生じた重要な取引については必要な調整を行っておりましたが、連結財務諸表のより適正な開
示を図るため、当連結会計年度より決算日を3月31日に変更しております。
また、従来、連結子会社のうち決算日が12月31日である上海森永食品有限公司、森永食品(浙江)有限公司は、
各社決算日現在の財務諸表を使用し、連結決算日との間に生じた重要な取引については必要な調整を行っておりま
したが、連結財務諸表のより適正な開示を図るため、当連結会計年度より連結決算日である3月31日に仮決算を行
い連結する方法に変更しております。
これらの変更に伴い、当連結会計年度は、2025年4月1日から2026年3月31日までの12ヶ月を連結しておりま
す。
なお、当該連結子会社のうち、(株)アントステラについては、2025年3月1日から2025年3月31日までの損益、そ
の他連結子会社については、2025年1月1日から2025年3月31日までの損益を利益剰余金の増減として調整してお
り、現金及び現金同等物の増減については、連結キャッシュ・フロー計算書の「連結子会社の決算期変更に伴う現
金及び現金同等物の期首残高増減額」として表示しております。
森永製菓株式会社(2201)2026年3月期決算短信
18
(連結損益計算書関係)
減損損失
当社グループは、以下の資産について減損損失を計上しております。
前連結会計年度(自2024年4月1日至2025年3月31日)
(単位:百万円)
場所用途
種類及び減損損失
建物及び
構築物
機械装置
及び運搬具
土地その他合計
東京都国分寺市
事業用資産
(売却予定資産)
17-7870806
広島県広島市
事業用資産及び
賃貸用資産
(売却予定資産)
105-50110
香川県高松市
事業用資産
(売却予定資産)
24-46071
鹿児島県鹿児島市店舗0--45
佐賀県佐賀市店舗2--24
神奈川県相模原市店舗0--34
茨城県水戸市店舗---00
(資産グルーピングの方法)
当社グループは、事業用資産については、事業の種類別セグメントを基礎に独立したキャッシュ・フローを生
み出す最小の単位を識別し、資産のグルーピングを行っております。ゴルフ場、賃貸用資産、店舗、遊休資産に
ついては物件ごとにグルーピングをしており、特定の事業との関連が明確でない資産については共用資産として
おります。
(減損損失の認識に至った経緯)
売却予定資産については、移転方針の決定により売却予定となったため、回収可能価額まで帳簿価額を減額し
ております。
店舗については、投資に見合う回収が不可能と判断されることから、回収可能価額まで帳簿価額を減額してお
ります。
(回収可能価額の算定方法)
売却予定資産については、売却見込額に基づく正味売却価額により測定しております。
店舗については、使用価値により測定しております。
当連結会計年度(自2025年4月1日至2026年3月31日)
重要性が乏しいため、記載を省略しております。
(連結キャッシュ・フロー計算書関係)
現金及び現金同等物の期末残高と連結貸借対照表に掲記されている科目の金額との関係
前連結会計年度
(自2024年4月1日
至2025年3月31日)
当連結会計年度
(自2025年4月1日
至2026年3月31日)
現金及び預金31,062百万円26,419百万円
預入期間が3ヶ月を超える定期預金△216〃△693〃
現金及び現金同等物30,845〃25,726〃
森永製菓株式会社(2201)2026年3月期決算短信
19
(セグメント情報等)
【セグメント情報】
1報告セグメントの概要
(1)報告セグメントの決定方法
当社グループの報告セグメントは、当社グループの構成単位のうち分離された財務情報が入手可能であり、
取締役会等が、経営資源の配分の決定及び業績を評価するために、定期的に検討を行う対象となっているもの
であります。
当社グループは、食料品製造を中心に事業活動を展開しております。なお、「食料品製造」、「食料卸売」、
「不動産及びサービス」を報告セグメントとしております。
(2)各報告セグメントに属する製品及びサービスの種類
「食料品製造」セグメントは、菓子、食品、冷菓、ゼリー飲料等の製造を行っております。
「食料卸売」セグメントは、業務用食品の卸売を行っております。
「不動産及びサービス」セグメントは、不動産賃貸業、ゴルフ場経営を行っております。
2報告セグメントごとの売上高、利益又は損失、資産、その他の項目の金額の算定方法
報告されている事業セグメントの会計処理の方法は、「連結財務諸表作成のための基本となる重要な事項」
における記載と概ね同一であります。
セグメント間の内部売上高及び振替高は、市場価格等に基づいております。
3報告セグメントごとの売上高、利益又は損失、資産、その他の項目の金額に関する情報
前連結会計年度(自2024年4月1日至2025年3月31日)
(単位:百万円)
報告セグメント
その他
(注)1
合計
調整額
(注)2
連結財務諸
表計上額
(注)3
食料品
製造
食料卸売
不動産及び
サービス
計
売上高
外部顧客への売上高217,5788,6901,870228,140817228,957-228,957
セグメント間の内部売
上高又は振替高
1428923068241,131△1,131-
計217,5938,9801,873228,4471,641230,088△1,131228,957
セグメント利益19,8621,44180122,10516522,271△1,00521,266
セグメント資産163,7054,6194,960173,2851,900175,18634,800209,986
その他の項目
減価償却費9,66751529,825939,918-9,918
有形固定資産及び
無形固定資産の増加額
10,52664410,57811110,689-10,689
(注)1「その他」の区分は、報告セグメントに含まれない事業セグメントであり、研究用試薬の製造販売他であり
ます。
2調整額は以下のとおりであります。
(1)セグメント利益の調整額△1,005百万円には、各報告セグメントに配分していない全社費用△1,026百万
円などが含まれております。全社費用は、主に報告セグメントに帰属しない一般管理費及び新規事業開
発費等であります。
(2)セグメント資産の調整額34,800百万円は、全社資産35,618百万円及びセグメント間の債権の相殺消去等
△818百万円が含まれております。全社資産は当社グループの現金及び預金、長期投資資金(金融機関株
式)であります。
3セグメント利益は、連結財務諸表の営業利益と調整を行っております。
森永製菓株式会社(2201)2026年3月期決算短信
20
当連結会計年度(自2025年4月1日至2026年3月31日)
(単位:百万円)
報告セグメント
その他
(注)1
合計
調整額
(注)2
連結財務諸
表計上額
(注)3
食料品
製造
食料卸売
不動産及び
サービス
計
売上高
外部顧客への売上高225,1678,7981,897235,863809236,672-236,672
セグメント間の内部売
上高又は振替高
1440724248711,296△1,296-
計225,1829,2051,899236,2871,681237,969△1,296236,672
セグメント利益22,32769088023,89814524,043△1,64922,394
セグメント資産188,9935,0324,571198,5971,985200,58225,338225,921
その他の項目
減価償却費9,924315010,0788210,160-10,160
有形固定資産及び
無形固定資産の増加額
5,7760495,8261095,936-5,936
(注)1「その他」の区分は、報告セグメントに含まれない事業セグメントであり、研究用試薬の製造販売他であり
ます。
2調整額は以下のとおりであります。
(1)セグメント利益の調整額△1,649百万円には、各報告セグメントに配分していない全社費用△1,655百万
円などが含まれております。全社費用は、主に報告セグメントに帰属しない一般管理費及び新規事業開
発費等であります。
(2)セグメント資産の調整額25,338百万円は、全社資産26,502百万円及びセグメント間の債権の相殺消去等
1,163百万円が含まれております。全社資産は当社グループの現金及び預金、長期投資資金(金融機関株
式)であります。
3セグメント利益は、連結財務諸表の営業利益と調整を行っております。
【関連情報】
前連結会計年度(自2024年4月1日至2025年3月31日)
1製品及びサービスごとの情報
セグメント情報に同様の情報を開示しているため、記載を省略しております。
2地域ごとの情報
(1)売上高
(単位:百万円)
日本米国その他合計
198,56719,67210,718228,957
(注)売上高は顧客の所在地を基礎とし、国または地域に分類しております。
(2)有形固定資産
本邦に所在している有形固定資産の金額が連結貸借対照表の有形固定資産の金額の90%を超えるため、記載
を省略しております。
3主要な顧客ごとの情報
外部顧客への売上高のうち、連結損益計算書の売上高の10%以上を占める相手先がないため、記載はありませ
ん。
森永製菓株式会社(2201)2026年3月期決算短信
21
当連結会計年度(自2025年4月1日至2026年3月31日)
1製品及びサービスごとの情報
セグメント情報に同様の情報を開示しているため、記載を省略しております。
2地域ごとの情報
(1)売上高
(単位:百万円)
日本米国その他合計
205,64219,08911,940236,672
(注)売上高は顧客の所在地を基礎とし、国または地域に分類しております。
(2)有形固定資産
(単位:百万円)
日本米国その他合計
67,30518,6943,30989,309
3主要な顧客ごとの情報
(単位:百万円)
顧客の名称又は氏名売上高関連するセグメント名
三菱食品株式会社24,900食料品製造
【報告セグメントごとの固定資産の減損損失に関する情報】
前連結会計年度(自2024年4月1日至2025年3月31日)
(単位:百万円)
食料品製造食料卸売
不動産
及びサービス
その他調整額合計
減損損失972-30--1,003
当連結会計年度(自2025年4月1日至2026年3月31日)
(単位:百万円)
食料品製造食料卸売
不動産
及びサービス
その他調整額合計
減損損失37----37
【報告セグメントごとののれんの償却額及び未償却残高に関する情報】
前連結会計年度(自2024年4月1日至2025年3月31日)
該当事項はありません。
当連結会計年度(自2025年4月1日至2026年3月31日)
該当事項はありません。
森永製菓株式会社(2201)2026年3月期決算短信
22
(収益認識関係)
顧客との契約から生じる収益を分解した情報
当社グループは、顧客との契約から生じる収益を顧客との契約に基づき、各セグメントを主要な売上管理区分
に分解しております。
(単位:百万円)
報告セグメント主な製品・地域区分
前連結会計年度
(自2024年4月1日
至2025年3月31日)
当連結会計年度
(自2025年4月1日
至2026年3月31日)
食料品製造
菓子食品事業84,43688,957
冷菓事業49,36053,528
in事業31,33929,955
通販事業11,18410,748
事業子会社等11,24111,276
国内計187,562194,466
米国事業20,95620,214
中国・台湾・輸出等9,06010,486
海外計30,01630,700
小計217,578225,167
食料卸売業務用食品の卸売8,6908,798
不動産及びサービスゴルフ場経営791758
その他(注)817809
顧客との契約から生じる収益合計227,878235,533
不動産及びサービス不動産賃貸1,0791,139
その他の収益合計1,0791,139
外部顧客への売上高合計228,957236,672
(注)「その他」の区分は、報告セグメントに含まれない事業セグメントであり、研究用試薬の製造販売他でありま
す。
森永製菓株式会社(2201)2026年3月期決算短信
23
(1株当たり情報)
前連結会計年度
(自2024年4月1日
至2025年3月31日)
当連結会計年度
(自2025年4月1日
至2026年3月31日)
1株当たり純資産額1,523.09円1,690.58円
1株当たり当期純利益200.85円211.07円
(注)1.潜在株式調整後1株当たり当期純利益については、潜在株式が存在しないため記載しておりません。
2.役員報酬BIP信託が保有する当社株式は、1株当たり純資産額の算定上、期末発行済株式総数から控
除する自己株式に含めております。また、1株当たり当期純利益の算定上、期中平均株式数の計算にお
いて控除する自己株式に含めております。なお、前連結会計年度において信託が保有する期末自己株式
数は80千株、期中平均自己株式数は75千株、当連結会計年度において信託が保有する期末自己株式数は
80千株、期中平均自己株式数は80千株であります。
3.1株当たり純資産額の算定上の基礎は、以下のとおりであります。
前連結会計年度
(2025年3月31日)
当連結会計年度
(2026年3月31日)
純資産の部の合計額(百万円)132,393143,696
純資産の部の合計額から控除する金額(百万円)1,5271,739
(うち非支配株主持分(百万円))(1,527)(1,739)
普通株式に係る期末の純資産額(百万円)130,865141,956
1株当たり純資産額の算定に用いられた期末の普通株式の数
(千株)
85,92083,969
4.1株当たり当期純利益の算定上の基礎は、以下のとおりであります。
前連結会計年度
(自2024年4月1日
至2025年3月31日)
当連結会計年度
(自2025年4月1日
至2026年3月31日)
親会社株主に帰属する当期純利益(百万円)17,71017,765
普通株主に帰属しない金額(百万円)--
普通株式に係る親会社株主に帰属する
当期純利益(百万円)
17,71017,765
普通株式の期中平均株式数(千株)88,17784,171
森永製菓株式会社(2201)2026年3月期決算短信
24
(重要な後発事象)
(取得による企業結合)
当社は、2026年3月6日開催の取締役会において、米国最大手のモチアイス製造企業であるTheMochiIceCream
Company,LLCの全持分を間接的に保有するMyMoHoldco,Inc.の全株式を取得し、子会社化することについて決議
し、同日付で株式譲渡契約を締結しました。また、2026年4月1日付で株式を取得したことにより子会社化しまし
た。
1企業結合の概要
(1)被取得企業の名称及びその事業の内容
被取得企業の名称MyMoHoldco,Inc.
事業の内容グループ会社の管理・運営
(2)企業結合を行った主な理由
当社グループは、2021年より長期経営計画「2030経営計画」を掲げ、持続的な企業価値向上に向けた取組み
を進めております。2030年度に向けては、パーパスの実現を起点に、世界のお客様に笑顔を届けるためのグロ
ーバル企業への成長を目指し、当社グループが長年培ってきた強みを活かした展開を推進しております。
本件は、2030経営計画の達成及びその先の持続的成長を見据えた、米国におけるバリューチェーンの獲得を
目的とするものです。米国のアイスクリーム市場は中長期的に安定した成長基調にあり、個食ノベルティやク
リーンラベル志向、プレミアム化の進展が確認されるなど、今後も持続的な成長が見込まれております。
当社グループは、本件で獲得する米国冷菓事業のバリューチェーンを活かした戦略展開を通じて事業ポート
フォリオの転換を推進し、2030経営計画の達成を確実なものにするとともに、さらにその先を見据えた成長戦
略の具体化を段階的に進めてまいります。
(3)企業結合日
2026年4月1日
(4)企業結合の法的形式
株式取得
(5)結合後企業の名称
名称に変更はありません。
(6)取得した議決権比率
100%
(7)取得企業を決定するに至った主な根拠
現金を対価とした株式取得のため
2被取得企業の取得原価及び対価の種類ごとの内訳
取得の対価現金130百万米ドル〔20,849百万円〕
取得原価130百万米ドル〔20,849百万円〕
※本株式取得の完了日における正味運転資本や純有利子負債等を考慮した一般的な調整は、現時点では確定し
ておりません。
※〔〕内の円換算額は、株式取得日2026年4月1日の支払為替レートに基づき算定しております。
3主要な取得関連費用の内容及び金額
アドバイザリー費用等:5百万米ドル〔894百万円〕
※〔〕内の円換算額は、支払為替レートに基づき算定しております。
4発生したのれんの金額及び発生原因、取得日現在における取得資産及び引受負債の公正価値
現時点では確定しておりません。
森永製菓株式会社(2201)2026年3月期決算短信
25
(多額な資金の借入)
当社は「(取得による企業結合)」に記載したMyMoHoldco,Inc.の株式取得のため、2026年4月1日付で金融機
関から資金の借入を実施しております。
借入先:株式会社三菱UFJ銀行
借入金額:23,937百万円
借入金利:基準金利+スプレッド
借入実行日:2026年4月1日
借入期間:2026年4月1日~2027年3月31日
返済方法:手元現預金及びリファイナンス予定資金
担保、保証の有無:無
森永製菓株式会社 (2201) 2026年3月期 決算短信
【当連結会計年度】
① 業績
(単位:百万円)
金 額
売 上 高
比率(%)
金 額
売 上 高
比率(%)
金 額
売 上 高
比率(%)
増減率(%)
売上高228,957236,6727,715 3.4
売上原価138,911 60.7141,71359.92,802△ 0.8 2.0
売上総利益90,046 39.394,95940.14,913 0.8 5.5
販売費及び一般管理費68,779 30.072,56530.73,786 0.7 5.5
販売促進費6,464 2.86,7902.9326 0.1 5.0
広告宣伝費11,246 4.910,8194.6▲ 427△ 0.3△ 3.8
運賃保管料18,312 8.019,2428.1930 0.1 5.1
給料手当10,529 4.611,3004.8771 0.2 7.3
賞与引当金繰入額1,776 0.81,9120.8136 0.0 7.7
その他20,451 8.922,4999.52,048 0.6 10.0
営業利益21,266 9.322,3949.51,128 0.2 5.3
営業外収益1,429 0.67630.3▲ 666△ 0.3△ 46.6
営業外費用392 0.24970.2105 0.0 27.0
経常利益22,304 9.722,6599.6355△ 0.1 1.6
特別利益3,553 1.63,2681.4▲ 285△ 0.2△ 8.0
特別損失1,573 0.76000.3▲ 973△ 0.4△ 61.9
税金等調整前当期純利益24,284 10.625,32710.71,043 0.1 4.3
法人税等6,438 2.87,3933.1955 0.3 14.8
当期純利益
17,846 7.817,9337.687△ 0.2 0.5
非支配株主に帰属する当期純利益
136 0.11670.131 0.0 23.1
親会社株主に帰属する当期純利益17,710 7.717,7657.555△ 0.2 0.3
② 営業利益増減分析
- 売上原価計上分のみ
2026年3月期 決算短信補足資料
2025年3月期2026年3月期前期比較
26
森永製菓株式会社 (2201) 2026年3月期 決算短信
③ 国内・海外売上高
(単位:百万円)
2025年3月期 2026年3月期
増減額増減率(%)
国 内 売 上 高198,567205,6427,075 3.6
海 外 売 上 高30,39031,030640 2.1
連 結 売 上 高
228,957236,6727,715 3.4
(注) 売上高は外部顧客への売上高を表示しております。
海外売上高比率(対連結売上高)
13.3%13.1%
④ 事業別 売上高・営業利益
(単位:億円)
(注)1 売上高は外部顧客への売上高を表示しております。
2 菓子食品事業は、inブランドを冠した菓子食品の商品群が含まれております。
3 通販事業及び事業子会社等は海外向けの売上高が含まれております。
4 米国事業は中国・台湾の米国向け輸出に係る利益が含まれております。
5 調整額等は主に事業に帰属しない一般管理費及び新規事業開発費等であります。
⑤ 設備投資、減価償却費、研究開発費
(単位:百万円)
2025年3月期 2026年3月期 増減額
設備投資額10,6895,936▲ 4,753
減価償却費9,91810,160242
研究開発費3,0453,213168
⑥ 2030経営計画における重点領域 売上高
(単位:億円)
重点領域
2025年3月期 2026年3月期増減額増減率(%)
in事業 322309▲ 13△ 4.0
冷菓事業493535428.4
通販事業111107▲ 4△ 3.9
米国事業209202▲ 7△ 3.5
合計1,1371,154171.5
重点領域売上高比率
(対連結売上高)49.7%48.8%
(注)1 売上高は外部顧客への売上高を表示しております。
2 in事業はinブランドを冠した菓子食品の商品群が含まれております。
3 通販事業は海外向けの売上高が含まれております。
2025年3月期 2026年3月期 増減額 増減率(%) 2025年3月期 2026年3月期 増減額 増減率(%)
菓子食品事業
84488945 5.4398142 108.4
冷菓事業
49353542 8.442497 16.5
in事業313299▲ 14△ 4.47358▲ 15△ 19.3
通販事業111107▲ 4△ 3.9473 49.4
事業子会社等1121120 0.3374 106.9
国内計1,8751,94469 3.716320441 25.4
米国事業209202▲ 7△ 3.53013▲ 17△ 57.3
中国・台湾・輸出等9010414 15.7451 14.7
海外計3003077 2.33518▲ 17△ 47.2
小計2,1752,25176 3.519822325 12.4
86871 1.2146▲ 8△ 52.1
18180 1.4880 9.8
88▲ 0
△
0.911▲ 0
△
12.3
▲ 10▲ 16▲ 6―
2,2892,36677 3.421222311 5.3
主な製品・地域区分
売上高営業利益
食料卸売
不動産及びサービス
その他
調整額等
合計
報告セグメント
食料品製造
27
森永製菓株式会社 (2201) 2026年3月期 決算短信
⑦ 営業利益及びEBITDA推移
(注) EBITDAは簡易版を使用→営業利益+減価償却費
28
森永製菓株式会社 (2201) 2026年3月期 決算短信
【 通 期 予 想 】
①業績
(単位:百万円)
2026年3月期
2027年3月期
予想
増減額増減率(%)
売 上 高236,672257,00020,3288.6
営業利益22,39422,8004061.8
経常利益22,65922,200▲
459△2.0
親会社株主に帰属する当期純利益17,765
16,500▲
1,265△7.1
②営業利益増減分析
- 1 売上原価計上分のみ
- 2 主な減益要因:DX投資、人材投資等
- 3 実施検討中の効果金額含む
③国内・海外売上高
(単位:百万円)
2026年3月期
2027年3月期
予想
増減額増減率(%)
国 内 売 上 高205,642212,3006,658 3.2
海 外 売 上 高31,03044,70013,670 44.1
連 結 売 上 高
236,672257,00020,3288.6
(注)1 売上高は外部顧客への売上高を表示しております。
2 2027年3月期予想の海外売上高には、MyMo Holdco, Inc. の売上高を含めております。
海外売上高比率(対連結売上高)
13.1%17.4%
2025年3月期
第3・4四半期
2026年3月期
第3・4四半期
予想
増減額 増減率(%)
2025年3月期
第3・4四半期
2026年3月期
第3・4四半期
予想
増減額 増減率(%)
菓子食品事業
45463418 924.34234▲ 8
△
19.1
冷菓事業41202161 385.0792 36.6
in事業-13138151△
1,
103.0▲
14
2337△
8
通販事業-45559△
1,
363.6275 198.7
事業子会社等06666 18,591.1363 72.0
国内計69925856 1,240.7418039 94.7
米国事業-7102109
△
1,
485.7▲
17
724
△
144.
5
中国・台湾・輸出等
145440 281.50▲ 00
―
海外計
6157151 2,196.0▲
16
723
△
141.
7
小計
751,0821,007 1,326.8248763 256.0
14342 4,003.4▲
74
11
△
163.
0
01010 3,709.4044 492.5
044△
6,
293.700▲ 0△
396.
0
▲
6▲ 8▲ 2―
7
71,1411,064 1,379.3118978 693.9
営業利益
合計
食料品製造
報告セグメント
食料卸売
不動産及びサービス
その他
調整額等
主な製品・地域区分
売上高
29
森永製菓株式会社 (2201) 2026年3月期 決算短信
④ 事業別 売上高・営業利益
(単位:億円)
(注)1 売上高は外部顧客への売上高を表示しております。
2 菓子食品事業は、inブランドを冠した菓子食品の商品群が含まれております。
3 通販事業及び事業子会社等は海外向けの売上高が含まれております。
4 米国事業は中国・台湾の米国向け輸出に係る利益が含まれております。
5 調整額等は主に事業に帰属しない一般管理費及び新規事業開発費等であります。
6 2027年3月期予想における米国事業の売上高及び営業利益には、MyMo Holdco, Inc. の売上高及び営業利益を含めております。
⑤設備投資、減価償却費、研究開発費
(単位:百万円)
2026年3月期
2027年3月期
予想
増減額
設備投資額5,93627,12021,184
減価償却費10,16012,1862,026
研究開発費3,2133,681468
(注)1 2027年3月期予想の設備投資額には、米国第2工場に関する設備投資額を含めております。
2 2027年3月期予想の減価償却費には、米国第2工場に関する減価償却費及びMyMo Holdco, Inc. の減価償却費を含めております。
⑥ 営業利益及びEBITDA推移
(注) EBITDAは簡易版を使用→営業利益+減価償却費+のれん償却費
2026年3月期
2027年3月期
予想
増減額 増減率(%) 2026年3月期
2027年3月期
予想
増減額 増減率(%)
菓子食品事業88990011 1.281821 1.0
冷菓事業
53556227 5.049545 10.7
in事業29932425 8.258635 8.7
通販事業1071092 1.4770 2.0
事業子会社等1121197 6.17114 56.4
国内計
1,9442,01470 3.620421915 7.5
米国事業202328126 62.3134▲
9△ 6
9.5
中国・台湾・輸出等10411511 10.151▲
4△ 6
5.3
海外計307443136 44.4185▲
13
△
6
8.2
小計
2,2512,458207 9.22232252 1.2
8784▲
3△ 4.
564▲
2△ 3
3.5
18202 5.4880 1.4
88▲
0△ 1.
211▲
0△ 1
4.4
▲ 16▲
12
4―
2,3662,570204 8.62232285 1.8
合計
食料卸売
不動産及びサービス
その他
調整額等
報告セグメント 主な製品・地域区分
売上高営業利益
食料品製造
30