自己株券買付状況報告書(法24条の6第1項に基づくもの)
Bull 0
Bear 0
Routine
Fiscal year ends March
Quarters are offset from the calendar — Q1 is Apr–Jun
|
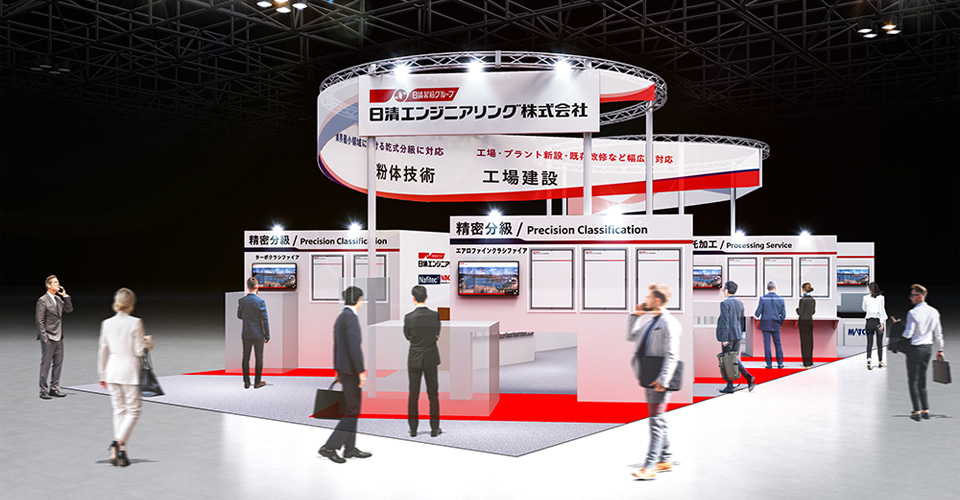
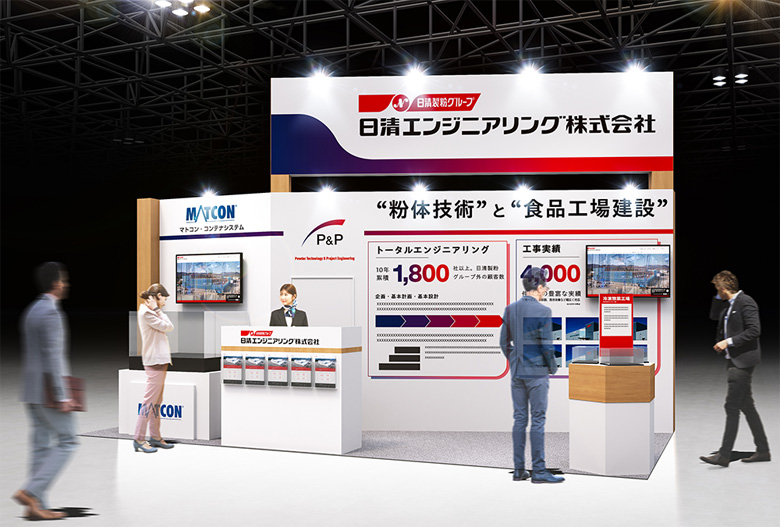
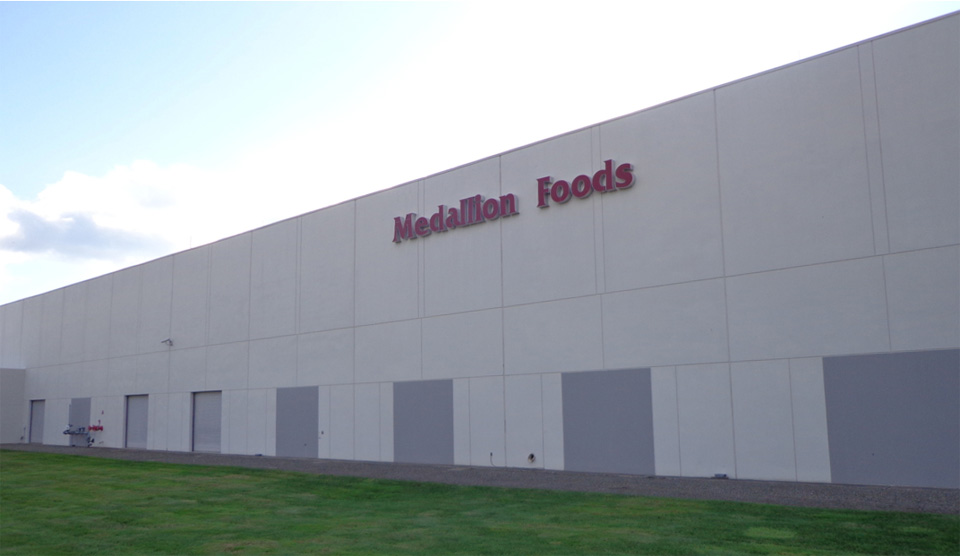
Nisshin Seifun Group Inc. is a holding company that manages a diversified food and industrial group. Its core business is the milling and sale of wheat flour and bran, conducted through subsidiaries such as Nisshin Seifun Co., Ltd. and Kumamoto Seifun Co., Ltd. in Japan, and Miller Milling Company, LLC, Rogers Foods Ltd., Nisshin-STC Flour Milling Co., Ltd., Champion Flour Milling Ltd., and Allied Pinnacle Pty Ltd. in North America, Asia, and Oceania. The group also operates a food business segment that manufactures and sells premixes, pasta, pasta sauces, and frozen foods via Nisshin Seifun Welna, Nisshin Seifun Premix, Ma Ma Macaroni, Medallion Foods, Inc., and regional subsidiaries in Southeast Asia, China, and Turkey. Additionally, the group produces food ingredients and biotechnological products through Oriental Yeast Industry Co., Ltd., and manufactures health foods and pharmaceutical APIs through Nisshin Pharma Co., Ltd. The ready-to-eat food segment includes prepared meals and side dishes produced by Tohkatsu Foods Co., Ltd., Joyas Foods Co., Ltd., and Inishio Foods Co., Ltd. Other operations include engineering and equipment manufacturing by Nisshin Engineering Co., Ltd., mesh and filter production by NBC Mesh Tech Co., Ltd., and grain storage and logistics services. The group serves markets in Japan, North America, Asia, and Oceania, with a history tracing back to its founding in 1900. Summarised from the annual report, fiscal year ended Mar 2026 |
Industry Packaged Foods | Homepage nisshin.com |
| Sector Consumer Defensive | IR page nisshin.com/ir | |
|
Tags
wheat flour, premixes, pasta, frozen foods, yeast, pharmaceutical apis, ready-to-eat meals, food engineering, grain storage, Nisshin Seifun Co. Ltd., Kumamoto Seifun Co. Ltd., Fresh Food Service Co. Ltd., Yamajou Trading Co. Ltd., Miller Milling Company LLC, Rogers Foods Ltd., Nisshin-STC Flour Milling Co. Ltd., Champion Flour Milling Ltd., Allied Pinnacle Pty Ltd., Nisshin Seifun Welna, Nisshin Seifun Premix, Ma Ma Macaroni Co. Ltd., Thai Nisshin Technomic Co. Ltd., Vietnam Nisshin Technomic Co. Ltd., Xinri Nisshin Seifun Foods (Qingdao) Co. Ltd., PT. Indonesia Nisshin Technomic, Medallion Foods Inc., Nisshin Seifun Turkey Makarna Ve Gida Sanayi Ve Ticaret A.S., Thai Nisshin Seifun Co. Ltd., Vietnam Nisshin Seifun Co. Ltd., Oriental Yeast Industry Co. Ltd., Nisshin Pharma Co. Ltd., Tohkatsu Foods Co. Ltd., Joyas Foods Co. Ltd., Inishio Foods Co. Ltd., Nisshin Seifun Delica Frontier Co. Ltd., Nisshin Engineering Co. Ltd., NBC Mesh Tech Co. Ltd., Nisshin Marubeni Feed Co. Ltd., Japan Logitem Co. Ltd., Nisshin Silo Co. Ltd., Hanshin Silo Co. Ltd., Chiba Joint Silo Co. Ltd., Shinwa Development Co. Ltd.
|
Press page nisshin.com/release |
Metrics
| Valuation | |
|---|---|
| Market cap | ¥ 552.164B |
| Market cap (USD) | $ 3.451B |
| P/E | 13.80 |
| PEG | — |
| P/BV | 1.02 |
| P/S | 0.63 |
| P/OCF | 8.20 |
| P/FCF | 22.25 |
| Dividend yield | 3.0% |
| Turnover / mcap | — |
| Returns | |
|---|---|
| ROE | 6.3% |
| ROI | 5.8% |
| ROIC | 5.5% |
| Profit margin | 3.8% |
| Growth | |
|---|---|
| Revenue growing | Yes |
| Profits growing | No |
| Revenue up 3y | No |
| Revenue up 5y | No |
| Earnings growth 3y (net profit CAGR) | — |
| Quality | |
|---|---|
| Profitable | Yes |
| Margin expanding | No |
| Buying back stock | Yes |
| Diluting (TTM) | No |
| Debt/Equity | — |
| Podcast bulls (TTM) | Sign up |
| Podcast bears (TTM) | Sign up |
| Podcast sentiment (TTM) | Sign up |
| Podcast sentiment % (TTM) | Sign up |
| News sentiment (TTM) | 0 |
| Quality score | -5.6% |
| Insiders | |
|---|---|
| Buys, 1w | Sign up |
| Buys, 1m | Sign up |
| Buys, 1y | Sign up |
| Sells, 1w | Sign up |
| Sells, 1m | Sign up |
| Sells, 1y | Sign up |
Sign up to see this company's insider trades
| Figure | FY 2026 | FY 2025 | FY 2024 | FY 2023 | FY 2022 | FY 2021 | FY 2020 | FY 2019 | FY 2018 | FY 2017 | FY 2016 | FY 2015 | FY 2014 | FY 2013 |
|---|---|---|---|---|---|---|---|---|---|---|---|---|---|---|
| Revenue | 865.004B | 851.486B | 858.248B | 798.681B | 679.736B | 679.495B | 712.18B | 565.343B | 540.094B | 532.04B | 556.701B | 526.144B | 495.93B | 455.566B |
| Net profit | 32.589B | 34.684B | 31.743B | -10.381B | 17.509B | 19.011B | 22.407B | 22.268B | 21.339B | 19.466B | 17.561B | 16.036B | 15.098B | 13.688B |
| Free cash flow | 28.02B | 13.741B | 44.003B | 4.765B | 23.15B | 32.147B | 16.501B | 21.64B | 23.165B | 21.812B | 20.305B | — | — | — |
| Figure | FY 2026 | FY 2025 | FY 2024 | FY 2023 | FY 2022 | FY 2021 | FY 2020 | FY 2019 | FY 2018 | FY 2017 | FY 2016 | FY 2015 | FY 2014 | FY 2013 |
|---|---|---|---|---|---|---|---|---|---|---|---|---|---|---|
| Share price | 2.096K | 1.731K | 2.1K | 1.551K | 1.706K | 1.85K | 1.802K | 2.54K | 2.109K | 1.661K | 1.789K | 1.414K | 1.031K | 1.057K |
| Price performance 12m | 0.21 | -0.18 | 0.35 | -0.09 | -0.08 | 0.03 | -0.29 | 0.2 | 0.27 | -0.07 | 0.27 | 0.37 | -0.02 | — |
Filed figures
Lines the statements and their notes report beside the headline figures, read from the filings' XBRL as filed (no restatement applied), with figures computed from one filing's own lines. Cash-flow lines carry their cash direction: an outflow is negative. Each period links to its filing; a figure's period, report date and tag are in its tooltip.
| Figure | Mar 2017 | Mar 2018 | Mar 2019 | Mar 2020 | Mar 2021 | Mar 2022 | Mar 2023 | Mar 2024 | Mar 2025 | Mar 2026 |
|---|---|---|---|---|---|---|---|---|---|---|
| Balance sheet detail | ||||||||||
| Trade receivables (JPY) | 69.6B | 79.7B | 76.2B | 92.2B | 85.5B | 197B | 213B | 226B | 214B | 220B |
| ↳ YoY growth | -4.5% | +14.5% | -4.3% | +21.0% | -7.3% | +130.3% | +8.3% | +5.8% | -5.0% | +2.8% |
| ↳ 5y CAGR | +3.2% | +23.1% | +21.8% | +24.2% | +18.4% | +20.9% | ||||
| Borrowings, current (JPY) | 9.75B | 7.89B | 9.54B | 18.1B | 5.55B | 6.79B | 14.4B | 15.1B | 13.1B | 14.5B |
| Borrowings, non-current (JPY) | 4.97B | 7.19B | 6.77B | 35.2B | 34.7B | 33.8B | 33.4B | 32B | 31.2B | 31.2B |
| Bonds payable (JPY) | — | — | — | 20B | 20B | 20B | 20B | 20B | 20B | 20B |
| Lease liabilities (JPY) | — | — | 760M | 31B | 36.7B | 38.9B | 37.3B | 39.9B | 40.1B | 45.8B |
| Cash and deposits (JPY) | 85.5B | 91.6B | 102B | 49.7B | 61.3B | 69.6B | 83B | 109B | 94B | 97.8B |
| Intangible assets (JPY) | 15.1B | 12.4B | 10.5B | 68.7B | 73.4B | 68.8B | 23.7B | 21.6B | 21B | 22.1B |
| Net debt (borrowings + leases - cash) (JPY) | -70.7B | -76.5B | -85.7B | 34.6B | 15.7B | 9.91B | 2.07B | -22.4B | -9.44B | -6.24B |
| Cash flow detail | ||||||||||
| Operating cash flow (JPY) | 35.4B | 42.9B | 39.9B | 38.4B | 49.5B | 41.8B | 23.4B | 73.2B | 55.2B | 69.2B |
| Purchases of property, plant and equipment (JPY) | -13.5B | -19.7B | -18.2B | -21.9B | -17.4B | -18.7B | -18.7B | -29.2B | -41.5B | -41.2B |
| Change in receivables (cash effect) (JPY) | 1.64B | -10.2B | 2.7B | 3.88B | 9.8B | — | -2.81B | -3.18B | 3.75B | 227M |
| Change in inventories (cash effect) (JPY) | 6.26B | -8.01B | -1.7B | 6.34B | 2.09B | -12.2B | -27.9B | 9.05B | 826M | -1.59B |
| Change in payables (cash effect) (JPY) | -9.27B | 18.2B | -2.67B | -17B | -6.67B | 14.9B | 8.29B | 364M | -11.1B | 5.78B |
| Dividends paid (cash effect) (JPY) | -7.55B | -8.09B | -9.21B | -9.81B | -10.1B | -11.6B | -11.6B | -12.5B | -14.6B | -17.4B |
| Share buybacks (cash effect) (JPY) | -2M | -10.2B | -190M | -190M | -133M | -190M | -190M | -120M | -14.1B | -17.9B |
| Interest paid (cash effect) (JPY) | -161M | -217M | -257M | -3.15B | -2.78B | -2.92B | -3.53B | -3.8B | -3.75B | -3.82B |
| Income taxes paid (cash effect) (JPY) | -11.4B | -10.7B | -7.49B | -10.4B | -11.3B | -12.4B | -13.9B | -19.7B | -9.52B | -16B |
| Operating cash flow before change in receivables (JPY) | 33.7B | 53.1B | 37.2B | 34.5B | 39.7B | — | 26.2B | 76.4B | 51.5B | 69B |
| Free cash flow (OCF - PPE - intangibles) (JPY) | 21.8B | 23.2B | 21.6B | 16.5B | 32.1B | 23.2B | 4.77B | 44B | 13.7B | 28B |
| Income detail | ||||||||||
| Research and development expense (JPY) | 5.65B | 5.91B | 6.17B | 6.54B | 6.59B | 7.02B | 7.32B | 7.87B | 7.98B | 8.25B |
| ↳ 5y CAGR | +3.4% | +4.4% | +4.4% | +5.0% | +4.1% | +4.6% | ||||
| Total comprehensive income (JPY) | 28.5B | 25.1B | 17B | 1.35B | 49.3B | 28.9B | -12.4B | 90.7B | 15B | 71.4B |
| Comprehensive income to owners (JPY) | 27.5B | 23.4B | 16B | 649M | 48B | 27.6B | -13.8B | 88.9B | 13.2B | 68.9B |
| Reported | Jun 28, 2017 | Jun 27, 2018 | Feb 5, 2020 | Aug 28, 2020 | Jun 25, 2021 | Jun 28, 2022 | Jun 26, 2024 | Jun 26, 2024 | Jun 23, 2025 | Jun 22, 2026 |
Sign up to see institutional holdings
Sign UpPodcast Mentions
Sign up to see podcast mentions and sentiment
Sign UpTimely disclosures published on TDnet, newest first, titles as filed in Japanese. The link opens the disclosure on TDnet. Filings with EDINET (periodic reports, extraordinary reports, offerings, holding and buy-back reports), newest first, titles as filed in Japanese. The link opens the filing on EDINET. Press releases from the company's own website, newest first.
イベント 2026年11月06日 PDF 日清製粉ウェルナ『青の洞窟 SHIBUYA』に特別協賛 クリスマスツリー型の大型サイネージ『青の洞窟 THE BLUE TREE』が登場!
Bull 1
Bear 0
Product/operations
NEWS RELEASE
2026年11月6日
日清製粉ウェルナ『青の洞窟 SHIBUYA』に特別協賛 クリスマスツリー型の大型サイネージ 『青の洞窟 THE BLUE TREE』が登場! 日清製粉グループの株式会社日清製粉ウェルナ(取締役社長:岩橋恭彦)は、本年12月11日 (金)~27日(日)の期間、東京都渋谷区の渋谷公園通りから代々木公園ケヤキ並木までが青色 の光で彩られるイルミネーションイベント『青の洞窟 SHIBUYA』に特別協賛します。
■ 『青の洞窟 THE BLUE TREE』について 渋谷での開催における累計来場者数が1,650万人※を超える冬の大型イルミネーションイベント 『青の洞窟 SHIBUYA』 。今回は、クリスマスツリー型の大型サイネージ『青の洞窟 THE BLUE TREE』が代々木公園ケヤキ並木会場に登場します。サイネージにはクリスマスをイメージしたムー ビーが映し出され、青一色のイルミネーションとともに冬の渋谷を彩ります。 ※ 2016年~2019年、2022年~2025年に渋谷で開催された計8回の累計来場者数
※画像はイメージです。
■ 日清製粉ウェルナ「青の洞窟」ブランドのコンセプトと本イベントの特別協賛について 1995年に誕生した当社の「青の洞窟」ブランドは、2025年に 30周年を迎えました。2026年春にはリブランディングを実施し、 「青の洞窟」ブランドが長年大切にしてきた世界観は受け継ぎつつ、 「イ タリアンを、もっと奔放に。 」を新ブランドコンセプトとして、ロゴやパッ ケージデザイン等を刷新しました。 「青の洞窟」ブランドの世界観を、青いイルミネーションによる幻想 的でロマンチックな空間に重ね、2014年に初開催の『Nakameguro 青の洞窟』(東京・中目 黒)以来、本イベントへの特別協賛を継続しています。
◆ ブランドWebサイト「青の洞窟|日清製粉ウェルナ」から製品ラインアップをご覧いただけます。 ◆ 「青の洞窟」製品は「日清製粉ウェルナ Amazonストアページ」 ・ 「日清製粉ウェルナ 楽天市場公式ショップ」等 からご購入いただけます。
1
■ 『青の洞窟 SHIBUYA』開催概要 ・期間
:2026年12月11日(金)~27日(日)
・開催時間:17:00~22:00 ※雨天等、諸般の事情により、点灯時間や実施内容は変更となる可能性がございます。
・場所
:渋谷公園通りから代々木公園ケヤキ並木まで
・アクセス:JR原宿駅、東京メトロ明治神宮前駅より徒歩10分 渋谷駅、代々木公園駅、代々木八幡駅からもアクセス可能 ・電飾球数:約500,000球 ・主催
:『青の洞窟 SHIBUYA』実行委員会 (渋谷公園通商店街振興組合、公益財団法人東京都公園協会、代々木公園サービスセンター他)
・後援
:渋谷区
・特別協賛:株式会社日清製粉ウェルナ ・Webサイト:https://shibuya-aonodokutsu.jp/
※順次、情報公開予定



Prompts
Click prompts to add them under the company line, click again to take one out, then copy the result into your AI chat. Shared by Asian Century Stocks and Uncovered Thai Stocks. Thank you.
Nisshin Seifun Group Inc. (ticker 2002), listed in Japan.
Copied
ETFs Holding Nisshin Seifun Group Inc.
Exchange-traded funds whose newest published daily portfolio holds one of the company's listings, largest weight first.
| ETF | Weight in ETF | Shares | Market value | As of |
|---|---|---|---|---|
| AVDS | 0.13% | 31,300 | $ 484.344K | Nov 16, 2026 |
| DISV | 0.10% | 354,400 | $ 5.318M | Nov 12, 2026 |
| DXIV | 0.04% | 6,400 | $ 96.04K | Nov 12, 2026 |
| DFIV | 0.03% | 510,700 | $ 7.664M | Nov 12, 2026 |
| DFIC | 0.03% | 338,370 | $ 5.078M | Nov 12, 2026 |
| DFIS | 0.03% | 116,500 | $ 1.748M | Nov 12, 2026 |
| AVDE | 0.02% | 296,500 | $ 4.588M | Nov 16, 2026 |
| DFSI | 0.02% | 14,300 | $ 214.589K | Nov 12, 2026 |
| DFAX | 0.02% | 140,830 | $ 2.113M | Nov 12, 2026 |
| DFAI | 0.02% | 193,144 | $ 2.898M | Nov 12, 2026 |
| AVIV | 0.01% | 7,500 | $ 116.057K | Nov 16, 2026 |