|
Takasago Thermal Engineering Co., Ltd. is a Japanese company engaged in equipment construction and the manufacturing and sales of equipment. Its core business involves the design and construction of air conditioning systems, with services extending to equipment maintenance and comprehensive management. The group operates through subsidiaries including TMES, which handles maintenance, and Nippon Soubi Kogyo, which designs and constructs air conditioning and water supply/drainage systems. Internationally, the company operates through subsidiaries in China, Singapore, Hong Kong, Vietnam, Thailand, Malaysia, Mexico, and the Philippines, providing design and construction services for air conditioning systems. Integrated Cleanroom Technologies Pvt. Ltd. manufactures and installs equipment and interior materials for cleanrooms. Japan Pimack designs, manufactures, and sells air conditioning equipment, while Hyucos operates as an insurance agency. The group provides technical assistance to its overseas subsidiaries. Summarised from the annual report, fiscal year ended Mar 2026 |
Industry Engineering & Construction | Homepage tte-net.com |
| Sector Industrials | IR page tte-net.com/ir | |
|
Tags
air conditioning systems, equipment construction, cleanroom technology, equipment maintenance, hvac design, water supply systems, industrial installation, TMES, Nippon Soubi Kogyo, Takasago Kenchiku Koutei (China) Co. Ltd., Takasago Singapore Pte. Ltd., Takasago Netsugaku Kogyo (Hong Kong) Co. Ltd., Takasago Vietnam Co. Ltd., Thai Takasago Co. Ltd., T.T.E. Engineering (Malaysia) Sdn. Bhd., Takasago Engineering Mexico S.A. de C.V., THS Innovations Co. Ltd., THS Development Co. Ltd., Prompt Techno Service Co. Ltd., Integrated Cleanroom Technologies Pvt. Ltd., Japan Pimack Co. Ltd., Hyucos Co. Ltd., TTE Malaysia Holdings Sdn. Bhd.
|
Press page — |
Metrics
| Valuation | |
|---|---|
| Market cap | ¥ 649.995B |
| Market cap (USD) | $ 4.063B |
| P/E | 21.01 |
| PEG | 0.46 |
| P/BV | 3.04 |
| P/S | 1.58 |
| P/OCF | 12.00 |
| P/FCF | 13.41 |
| Dividend yield | 2.5% |
| Turnover / mcap | — |
| Returns | |
|---|---|
| ROE | 18.8% |
| ROI | 15.5% |
| ROIC | 14.2% |
| Profit margin | 8.8% |
| Growth | |
|---|---|
| Revenue growing | Yes |
| Profits growing | Yes |
| Revenue up 3y | Yes |
| Revenue up 5y | Yes |
| Earnings growth 3y (net profit CAGR) | 45.3% |
| Quality | |
|---|---|
| Profitable | Yes |
| Margin expanding | Yes |
| Buying back stock | No |
| Diluting (TTM) | — |
| Debt/Equity | — |
| Podcast bulls (TTM) | Sign up |
| Podcast bears (TTM) | Sign up |
| Podcast sentiment (TTM) | Sign up |
| Podcast sentiment % (TTM) | Sign up |
| News sentiment (TTM) | 0 |
| Quality score | 47.1% |
| Insiders | |
|---|---|
| Buys, 1w | Sign up |
| Buys, 1m | Sign up |
| Buys, 1y | Sign up |
| Sells, 1w | Sign up |
| Sells, 1m | Sign up |
| Sells, 1y | Sign up |
Sign up to see this company's insider trades
| Figure | FY 2026 | FY 2025 | FY 2024 | FY 2023 | FY 2022 | FY 2021 | FY 2020 | FY 2019 | FY 2018 | FY 2017 | FY 2016 | FY 2015 | FY 2014 | FY 2013 |
|---|---|---|---|---|---|---|---|---|---|---|---|---|---|---|
| Revenue | 423.923B | 381.661B | 363.366B | 338.831B | 302.746B | 275.181B | 320.893B | 319.834B | 289.933B | 260.204B | 251.291B | 243.582B | 237.389B | 248.43B |
| Net profit | 37.47B | 27.631B | 19.612B | 12.227B | 11.535B | 10.116B | 13.231B | 12.609B | 11.804B | 8.665B | 6.65B | 5.196B | 4.011B | 2.186B |
| Free cash flow | 24.659B | 1.548B | -16.447B | 20.778B | -1.825B | 17.931B | -17.885B | 10.851B | 2.867B | 22.81B | -3.727B | — | — | — |
| Figure | FY 2026 | FY 2025 | FY 2024 | FY 2023 | FY 2022 | FY 2021 | FY 2020 | FY 2019 | FY 2018 | FY 2017 | FY 2016 | FY 2015 | FY 2014 | FY 2013 |
|---|---|---|---|---|---|---|---|---|---|---|---|---|---|---|
| Share price | 4.291K | 5.542K | 4.876K | 2.106K | 1.73K | 1.723K | 1.657K | 1.78K | 1.955K | 1.565K | 1.414K | 1.502K | 1.058K | 750.47 |
| Price performance 12m | -0.23 | 0.14 | 1.32 | 0.22 | 0 | 0.04 | -0.07 | -0.09 | 0.25 | 0.11 | -0.06 | 0.42 | 0.41 | — |
Filed figures
Lines the statements and their notes report beside the headline figures, read from the filings' XBRL as filed (no restatement applied), with figures computed from one filing's own lines. Cash-flow lines carry their cash direction: an outflow is negative. Each period links to its filing; a figure's period, report date and tag are in its tooltip.
| Figure | Mar 2017 | Mar 2018 | Mar 2019 | Mar 2020 | Mar 2021 | Mar 2022 | Mar 2023 | Mar 2024 | Mar 2025 | Mar 2026 |
|---|---|---|---|---|---|---|---|---|---|---|
| Balance sheet detail | ||||||||||
| Trade receivables (JPY) | 9.56B | 12.2B | 10.2B | 8.46B | 9.13B | 10.7B | 9.81B | 8.05B | 8.24B | 6.76B |
| ↳ YoY growth | +151.6% | +27.5% | -16.7% | -16.7% | +8.0% | +16.9% | -8.0% | -18.0% | +2.3% | -18.0% |
| ↳ 5y CAGR | +19.2% | +2.2% | -4.2% | -4.5% | -0.5% | -5.8% | ||||
| Borrowings, current (JPY) | 5.53B | 6.12B | 6.61B | 6.19B | 4.93B | 8.06B | 4.82B | 19.1B | 22.7B | 32.4B |
| Borrowings, non-current (JPY) | — | 10B | 10B | 15B | 25B | 25B | 25B | 20B | 15B | 10B |
| Bonds payable (JPY) | — | 10B | 10B | 15B | 25B | 25B | 25B | 25B | 20B | 15B |
| Cash and deposits (JPY) | 47.1B | 55.1B | 57.9B | 39.3B | 64.1B | 57B | 72.3B | 53.3B | 47.6B | 48.2B |
| Intangible assets (JPY) | 714M | 4.42B | 3.29B | 3.78B | 6.7B | 8.1B | 8.1B | 9.17B | 9.63B | 11.5B |
| Net debt (borrowings + leases - cash) (JPY) | -41.5B | -38.9B | -41.3B | -18.1B | -34.2B | -23.9B | -42.5B | -14.2B | -9.91B | -5.82B |
| Cash flow detail | ||||||||||
| Operating cash flow (JPY) | 23.5B | 6.17B | 14.9B | -6.37B | 22.6B | 1.19B | 25.8B | -13.1B | 5.89B | 29.7B |
| Purchases of property, plant and equipment (JPY) | -718M | -3.3B | -4.04B | -11.5B | -4.64B | -3.01B | -5.05B | -3.35B | -4.34B | -5.07B |
| Change in receivables (cash effect) (JPY) | 5.92B | -9.43B | -12.5B | -4.3B | 24.2B | -33.2B | 10.3B | -32.3B | 238M | -14.7B |
| Change in payables (cash effect) (JPY) | -1.28B | 5.49B | 13.6B | -15.9B | -10.2B | 12.7B | -16M | -10.3B | -28.6B | 1.16B |
| Dividends paid (cash effect) (JPY) | -2.18B | -2.73B | -4.43B | -3.83B | -4.07B | -3.99B | -4.1B | -4.77B | -10.5B | -12.6B |
| Share buybacks (cash effect) (JPY) | 0.00 | -1M | -4.05B | -4B | -463M | -6.36B | 0.00 | -2M | -1.94B | -8.21B |
| Interest paid (cash effect) (JPY) | -54M | -141M | -187M | -272M | -259M | -237M | -278M | -282M | -286M | -420M |
| Income taxes paid (cash effect) (JPY) | -3.93B | -7.11B | -4.73B | -8.4B | -4.8B | -4.19B | -6.54B | -5.27B | -10.2B | -14.4B |
| Operating cash flow before change in receivables (JPY) | 17.6B | 15.6B | 27.4B | -2.07B | -1.58B | 34.4B | 15.5B | 19.2B | 5.65B | 44.4B |
| Free cash flow (OCF - PPE - intangibles) (JPY) | 22.8B | 2.87B | 10.9B | -17.9B | 17.9B | -1.83B | 20.8B | -16.4B | 1.55B | 24.7B |
| Income detail | ||||||||||
| Research and development expense (JPY) | 902M | 1.06B | 945M | 1.36B | 888M | 1.13B | 2.62B | 2.75B | 2.97B | 3.93B |
| ↳ 5y CAGR | -0.6% | +4.7% | +19.8% | +23.8% | +17.0% | +34.7% | ||||
| Total comprehensive income (JPY) | 9.34B | 14.4B | 10.1B | 7.7B | 14.4B | 11B | 14.1B | 29.2B | 27.6B | 49.1B |
| Comprehensive income to owners (JPY) | 9.46B | 14B | 9.95B | 7.78B | 14.4B | 10.7B | 13.5B | 28.6B | 26.8B | 48.1B |
| Provision for credit losses (JPY) | 384M | 152M | 451M | 182M | 339M | 552M | 60M | 3M | 145M | 934M |
| Credit cost ratio (credit losses / average receivables) (%) | 5.7% | 1.4% | 4.0% | 2.0% | 3.9% | 5.6% | 0.6% | 0.0% | 1.8% | 12.5% |
| Reported | Jun 27, 2017 | Jun 26, 2019 | Jun 26, 2019 | Jul 27, 2020 | Jun 22, 2021 | Jun 21, 2022 | Jun 23, 2023 | Jun 19, 2024 | Jun 17, 2025 | Jun 18, 2026 |
Sign up to see institutional holdings
Sign UpPodcast Mentions
Sign up to see podcast mentions and sentiment
Sign UpFilings with EDINET (periodic reports, extraordinary reports, offerings, holding and buy-back reports), newest first, titles as filed in Japanese. The link opens the filing on EDINET. Press releases from the company's own website, newest first.
2026/10/29プレスリリース
高砂熱学工業株式会社(社長:小島和人/以下、当社)は、当社の研究開発拠点である高砂熱学イノベーションセンター(茨城県つくばみらい市/以下、当センター)において、一般財団法人日本建築センターによる「CASBEE-ウェルネスオフィス」の評価認証で、最高評価であるSランクを取得したことをお知らせします。当センターは2020年10月、設計段階(竣工後1年未満)で同認証制度のSランクを取得しており、今回の運用段階においても、継続してSランク評価を取得しました。 「CASBEE-ウェルネスオフィス」は、建物利用者の健康性・快適性の維持・増進を支援する建物の仕様、性能、取り組みを評価する仕組みとして、2019年に開始された認証制度です。建物内で執務するワーカーの健康性・快適性に直接的に影響を与える要素に加え、知的生産性の向上や安全・安心性に関する性能などについても評価されます。当センターは、オフィス棟で『ZEB』※を達成しており、この取り組みが高く評価され、運用段階におけるSランク取得を実現しました。
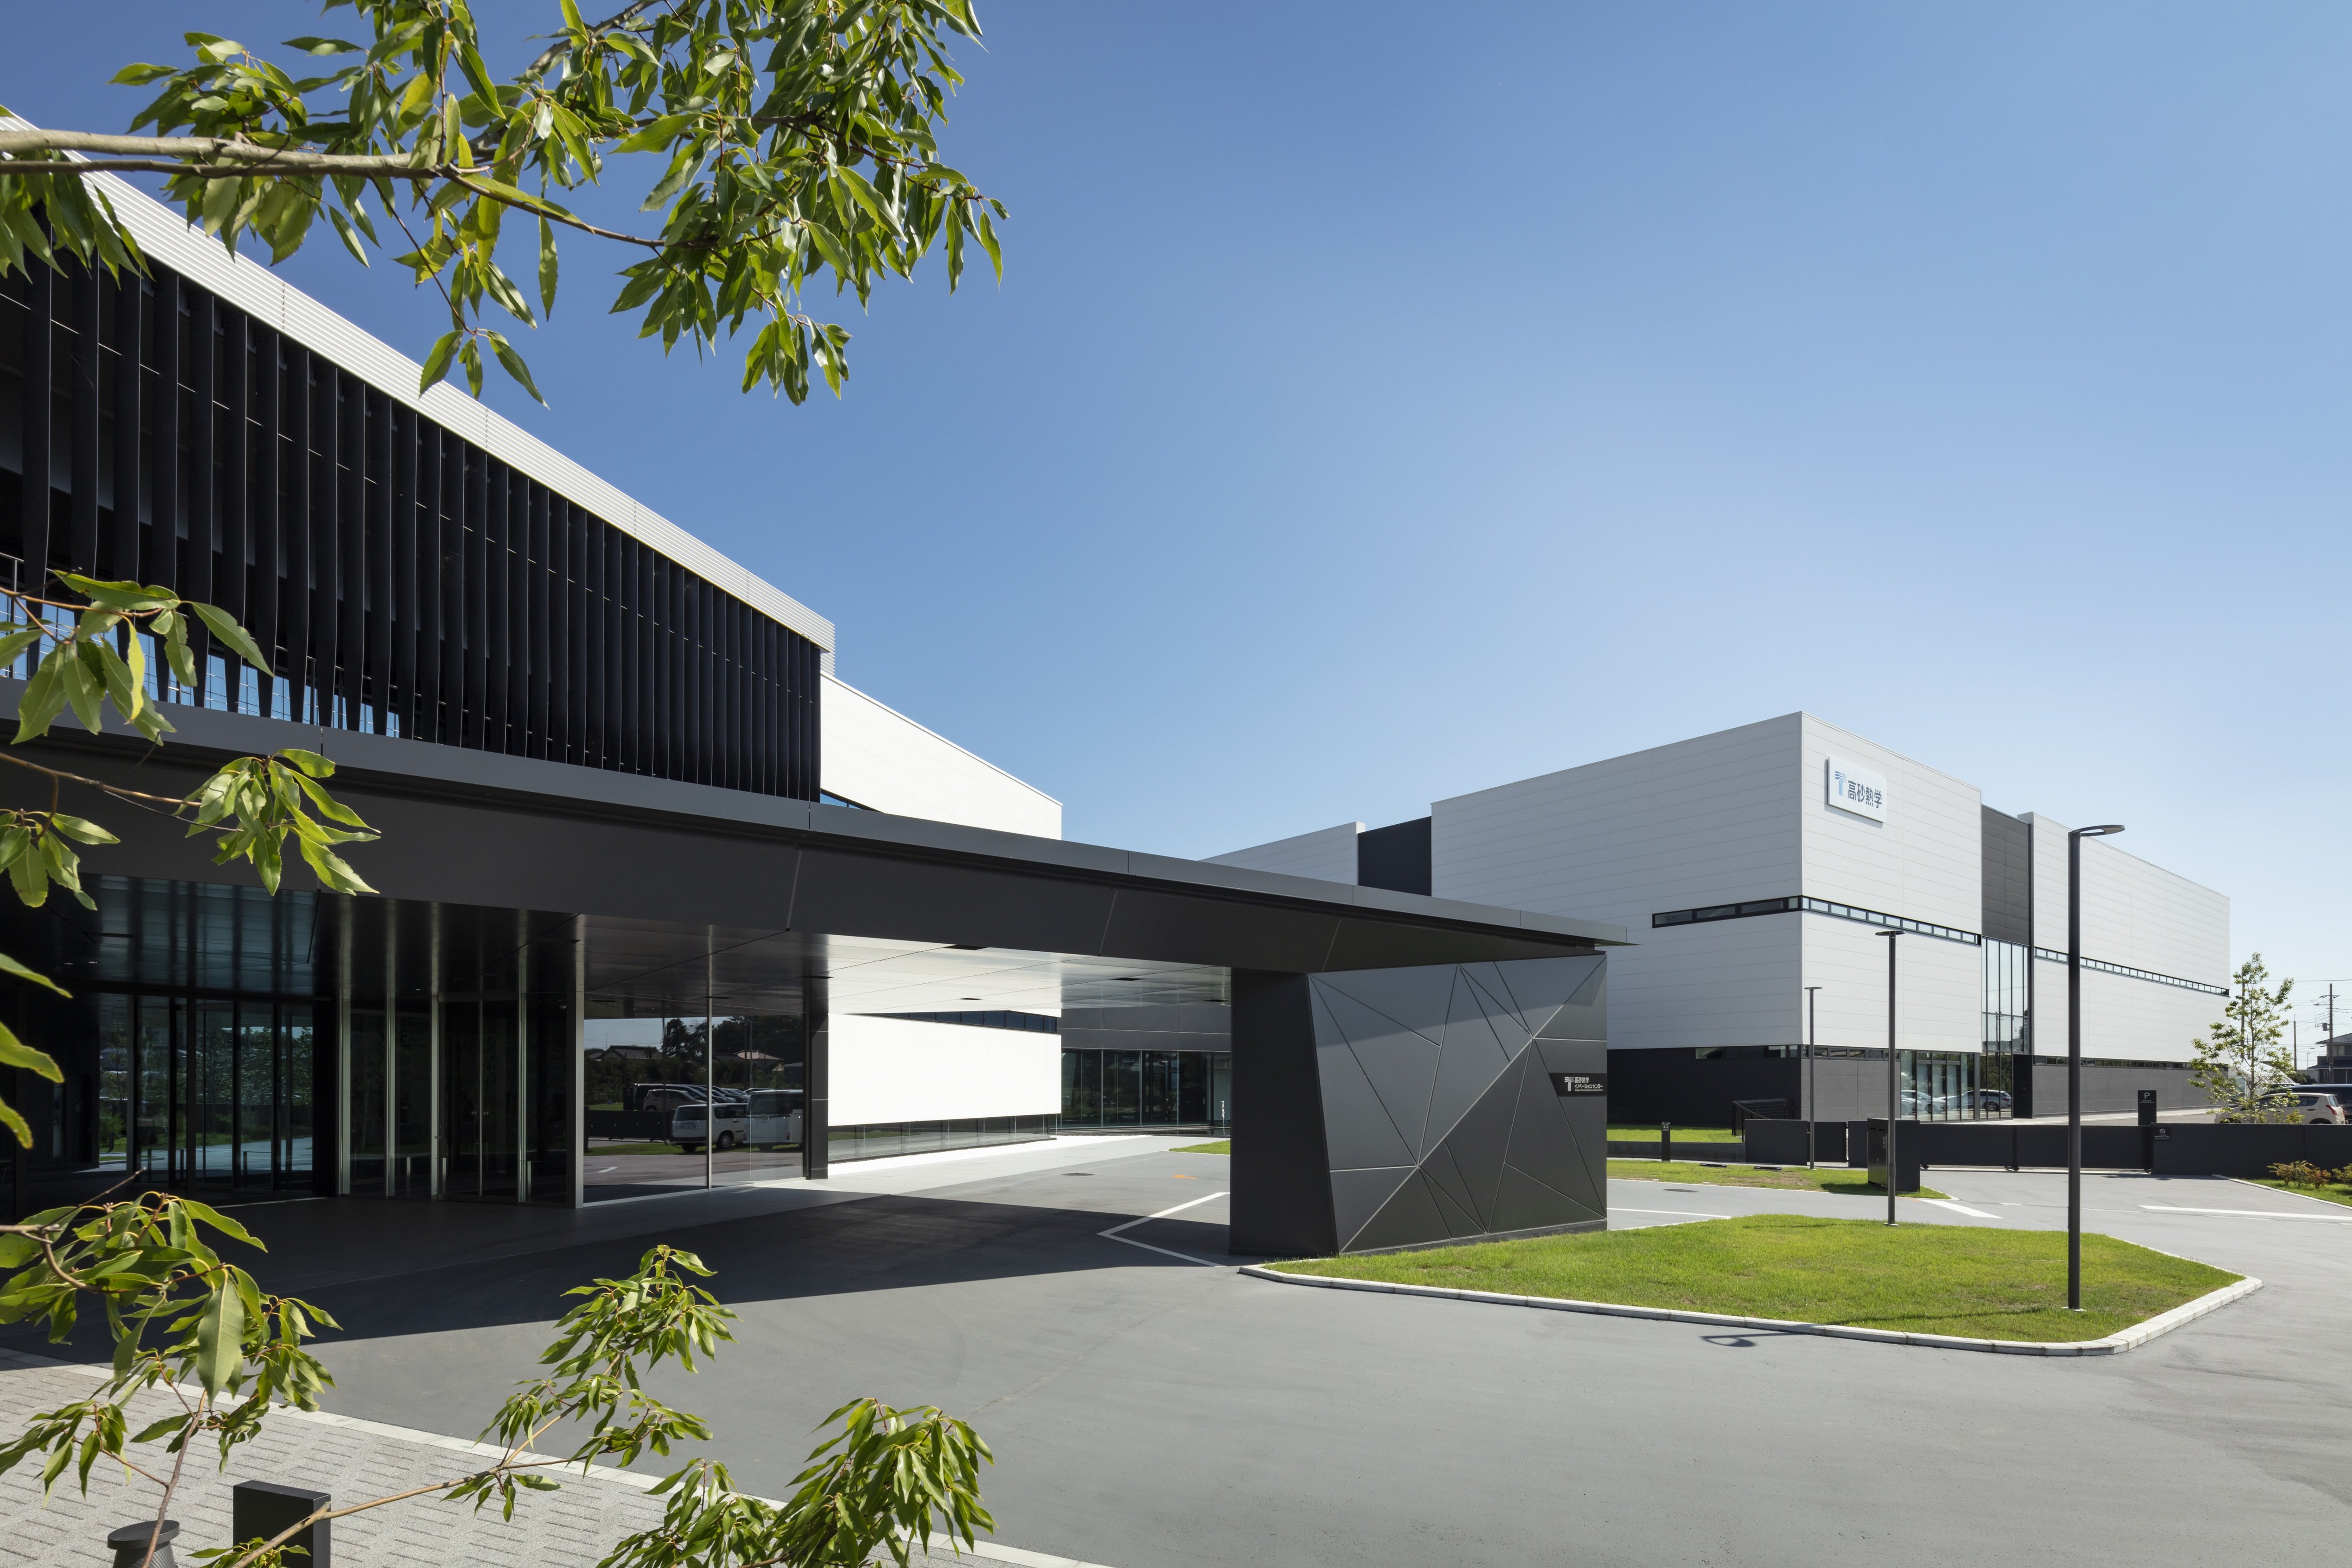 高砂熱学イノベーションセンター 外観

CASBEE-ウェルネスオフィス 認証ロゴ
当社は環境クリエイター®として、当センターを技術開発や実証の拠点とし、社会実装につながる技術開発を推進するとともに、カーボンニュートラルの実現と持続可能な社会の構築に貢献してまいります。
※『ZEB』:ZEB(Net Zero Energy Building)のうち、省エネ(50%以上)+創エネで100%以上の一次エネルギー消費量の削減を実現している建物。
<参考>2020年10月27日リリース






Prompts
Click prompts to add them under the company line, click again to take one out, then copy the result into your AI chat. Shared by Asian Century Stocks and Uncovered Thai Stocks. Thank you.
ETFs Holding Takasago Thermal Engineering Co., Ltd.
Exchange-traded funds whose newest published daily portfolio holds one of the company's listings, largest weight first.
| ETF | Weight in ETF | Shares | Market value | As of |
|---|---|---|---|---|
| AVDS | 0.07% | 10,100 | $ 268.102K | Nov 16, 2026 |
| DFIS | 0.04% | 83,800 | $ 2.092M | Nov 12, 2026 |
| DFSI | 0.02% | 8,900 | $ 222.138K | Nov 12, 2026 |
| DFIC | 0.02% | 100,300 | $ 2.503M | Nov 12, 2026 |
| DXIV | 0.01% | 1,200 | $ 29.951K | Nov 12, 2026 |
| DFAI | 0.01% | 85,200 | $ 2.127M | Nov 12, 2026 |
| DFAX | 0.01% | 53,800 | $ 1.343M | Nov 12, 2026 |
| AVDE | 0.00% | 32,000 | $ 849.433K | Nov 16, 2026 |