|
Toenec Corporation is a Japanese equipment construction company and a related entity of Chubu Electric Power. The company executes distribution line, underground line, indoor wiring, air conditioning pipe, and communication works, with a significant portion of orders sourced from the Chubu Electric Power Group. Its business segments include equipment construction, energy services, and other operations. In the energy sector, the company operates FIT solar power generation, PPA services, school air conditioning systems, and high-voltage bulk power supply services for condominiums. The group serves markets in Japan, China, Thailand, the Philippines, Indonesia, Vietnam, and Taiwan through subsidiaries and equity-method affiliates. Key subsidiaries include Toenec Service, Asahi Synchrotec, and overseas entities such as TOENEC PHILIPPINES INCORPORATED and PT. ASAHI SYNCHROTECH INDONESIA. The company also engages in product sales, real estate leasing, and PFI projects, including the operation of the Toyokawa Hokubu Memorial Hall. Summarised from the annual report, fiscal year ended Mar 2026 |
Industry Engineering & Construction | Homepage toenec.co.jp |
| Sector Industrials | IR page toenec.co.jp/ir | |
|
Tags
electrical installation, solar power generation, air conditioning systems, distribution line construction, indoor wiring, energy services, ppa services, pfi projects, equipment maintenance, Toenec Service, Asahi Synchrotec, TOENEC (THAILAND) CO. LTD., Tri-En TOENEC Co. Ltd., TOENEC PHILIPPINES INCORPORATED, PT. ASAHI SYNCHROTECH INDONESIA, HAWEE MECHANICAL AND ELECTRICAL JOINT STOCK COMPANY, FUHBIC TOENEC Corporation, Tateshina Sansan Farm, PFI Toyokawa Hokubu Memorial Hall, Chubu Plant Service
|
Press page toenec.co.jp/ir/news |
Metrics
| Valuation | |
|---|---|
| Market cap | ¥ 208.087B |
| Market cap (USD) | $ 1.301B |
| P/E | 11.03 |
| PEG | — |
| P/BV | 1.30 |
| P/S | 0.76 |
| P/OCF | 10.63 |
| P/FCF | 16.81 |
| Dividend yield | 3.5% |
| Turnover / mcap | — |
| Returns | |
|---|---|
| ROE | 12.3% |
| ROI | 9.5% |
| ROIC | 8.0% |
| Profit margin | 6.5% |
| Growth | |
|---|---|
| Revenue growing | Yes |
| Profits growing | Yes |
| Revenue up 3y | Yes |
| Revenue up 5y | Yes |
| Earnings growth 3y (net profit CAGR) | — |
| Quality | |
|---|---|
| Profitable | Yes |
| Margin expanding | Yes |
| Buying back stock | No |
| Diluting (TTM) | No |
| Debt/Equity | — |
| Podcast bulls (TTM) | Sign up |
| Podcast bears (TTM) | Sign up |
| Podcast sentiment (TTM) | Sign up |
| Podcast sentiment % (TTM) | Sign up |
| News sentiment (TTM) | 0 |
| Quality score | 50.0% |
| Insiders | |
|---|---|
| Buys, 1w | Sign up |
| Buys, 1m | Sign up |
| Buys, 1y | Sign up |
| Sells, 1w | Sign up |
| Sells, 1m | Sign up |
| Sells, 1y | Sign up |
Sign up to see this company's insider trades
| Figure | FY 2026 | FY 2025 | FY 2024 | FY 2023 | FY 2022 | FY 2021 | FY 2020 | FY 2019 | FY 2018 | FY 2017 | FY 2016 | FY 2015 | FY 2014 | FY 2013 |
|---|---|---|---|---|---|---|---|---|---|---|---|---|---|---|
| Revenue | 272.468B | 270.966B | 252.863B | 232.053B | 219.617B | 215.677B | 224.843B | 218.984B | 207.198B | 197.842B | 198.242B | 195.574B | 197.91B | 176.142B |
| Net profit | 17.81B | 10.765B | 9.345B | -5.548B | 8.283B | 8.832B | 9.314B | 6.672B | 5.783B | 5.17B | 4.442B | 3.49B | 3.455B | 2.346B |
| Free cash flow | 19.022B | 12.861B | 15.808B | 10.262B | 969M | 19.286B | 12.468B | -14.765B | -20.504B | -5.813B | -3.714B | — | — | — |
| Figure | FY 2026 | FY 2025 | FY 2024 | FY 2023 | FY 2022 | FY 2021 | FY 2020 | FY 2019 | FY 2018 | FY 2017 | FY 2016 | FY 2015 | FY 2014 | FY 2013 |
|---|---|---|---|---|---|---|---|---|---|---|---|---|---|---|
| Share price | 1.995K | 968.44 | 5.753K | 3.277K | 3.277K | 3.912K | 3.181K | 3.036K | 3.103K | 556.05 | 3.465K | 2.893K | 568.18 | 445.5 |
| Price performance 12m | 1.06 | -0.83 | 0.76 | 0 | -0.16 | 0.23 | 0.05 | -0.02 | 4.58 | -0.84 | 0.2 | 4.09 | 0.28 | — |
Filed figures
Lines the statements and their notes report beside the headline figures, read from the filings' XBRL as filed (no restatement applied), with figures computed from one filing's own lines. Cash-flow lines carry their cash direction: an outflow is negative. Each period links to its filing; a figure's period, report date and tag are in its tooltip.
| Figure | Mar 2017 | Mar 2018 | Mar 2019 | Mar 2020 | Mar 2021 | Mar 2022 | Mar 2023 | Mar 2024 | Mar 2025 | Mar 2026 |
|---|---|---|---|---|---|---|---|---|---|---|
| Balance sheet detail | ||||||||||
| Trade receivables (JPY) | — | — | — | — | — | 768M | 958M | 676M | 281M | 116M |
| ↳ YoY growth | +24.7% | -29.4% | -58.4% | -58.7% | ||||||
| Other receivables (JPY) | — | — | — | — | — | 2.95B | 2.87B | 2.65B | 2.64B | 2.74B |
| Borrowings, current (JPY) | 10.5B | 30.3B | 12.6B | 11.6B | 11.4B | 4.18B | 9.08B | 12.1B | 16.3B | 16.1B |
| Borrowings, non-current (JPY) | — | — | 33.6B | 35.7B | 36.5B | 31.9B | 30.8B | 29.7B | 28.6B | 27.5B |
| Bonds payable (JPY) | — | — | 14B | 14B | 14B | 8.4B | 8.4B | 8.4B | 8.4B | 8.4B |
| Lease liabilities (JPY) | 21B | 26.3B | 29.1B | 49.5B | 61.2B | 62.9B | 57.2B | 51.2B | 46.2B | 40.1B |
| Cash and deposits (JPY) | 28.7B | 26.7B | 28.5B | 37.4B | 46.9B | 29B | 30.1B | 38.3B | 43B | 47.8B |
| Intangible assets (JPY) | 4.54B | 4.3B | 3.9B | 3.79B | 4.08B | 4.05B | 4.06B | 3.4B | 2.6B | 1.85B |
| Net debt (borrowings + leases - cash) (JPY) | 2.7B | 29.9B | 46.7B | 59.3B | 62.2B | 70B | 67B | 54.7B | 48.1B | 35.9B |
| Cash flow detail | ||||||||||
| Operating cash flow (JPY) | 8.92B | 11.1B | 9.62B | 16.6B | 24.1B | 5.94B | 12.6B | 19.1B | 19B | 26.1B |
| Purchases of property, plant and equipment (JPY) | -14.7B | -31.6B | -24.4B | -4.13B | -4.83B | -4.97B | -2.38B | -3.31B | -6.15B | -7.07B |
| Change in receivables (cash effect) (JPY) | 2.79B | -3.78B | -8.9B | 761M | 4.53B | -9.79B | -10.3B | -3.8B | -2.74B | 1.2B |
| Change in inventories (cash effect) (JPY) | 83M | 94M | -227M | -83M | -194M | -223M | -335M | 237M | -261M | -706M |
| Change in payables (cash effect) (JPY) | -3.04B | 2.71B | 2.46B | 668M | -8.69B | 4.76B | 5.13B | -1.45B | 3.76B | -3.63B |
| Dividends paid (cash effect) (JPY) | -1.31B | -1.68B | -1.77B | -2.7B | -2.52B | -2.43B | -2.52B | -2.05B | -4.47B | -5.37B |
| Share buybacks (cash effect) (JPY) | -40M | -27M | -6M | -3M | -3M | -2M | -2M | -2M | -670M | 0.00 |
| Interest paid (cash effect) (JPY) | -565M | -783M | -1.02B | -1.55B | -1.92B | -2.11B | -2.13B | -1.95B | -1.88B | -1.75B |
| Income taxes paid (cash effect) (JPY) | -2.52B | -2.26B | -3.09B | -3.97B | -4.07B | -4.88B | -3.55B | -2.63B | -6.87B | -5.8B |
| Operating cash flow before change in receivables (JPY) | 6.13B | 14.9B | 18.5B | 15.8B | 19.6B | 15.7B | 23B | 22.9B | 21.8B | 24.9B |
| Free cash flow (OCF - PPE - intangibles) (JPY) | -5.81B | -20.5B | -14.8B | 12.5B | 19.3B | 969M | 10.3B | 15.8B | 12.9B | 19B |
| Income detail | ||||||||||
| Research and development expense (JPY) | 378M | 366M | 361M | 402M | 407M | 455M | 507M | 527M | 540M | 639M |
| ↳ 5y CAGR | +4.6% | +3.8% | +6.7% | +7.9% | +6.1% | +9.4% | ||||
| Total comprehensive income (JPY) | 6.71B | 6.96B | 10.5B | 10.2B | 12.6B | 9.13B | -6.9B | 16B | 10.5B | 21.8B |
| Comprehensive income to owners (JPY) | 6.71B | 6.96B | 10.5B | 10.2B | 12.6B | 9.12B | -6.91B | 16B | 10.7B | 21.8B |
| Provision for credit losses (JPY) | 8M | — | — | — | — | 1.57B | 1.53B | 0.00 | 1M | 926M |
| Credit cost ratio (credit losses / average receivables) (%) | — | — | — | — | — | — | 40.4% | 0.0% | 0.0% | 32.1% |
| Segments | ||||||||||
| Energy Business · Segment revenue (JPY) | 3.1B | 4.33B | 5.3B | 7.61B | 10.3B | 11.6B | 12.5B | 12.9B | 12.3B | 12.7B |
| ↳ YoY growth | +22.4% | +39.6% | +22.4% | +43.7% | +35.1% | +12.6% | +8.1% | +3.0% | -4.8% | +3.4% |
| Energy Business · Segment operating income (JPY) | 651M | 1.14B | 1.43B | 2.21B | 3.15B | 3.35B | 3.34B | 3.88B | 2.81B | 3.51B |
| Reported | Jun 30, 2017 | Jun 28, 2018 | Jun 27, 2019 | Jun 26, 2020 | Jun 28, 2021 | Jun 29, 2022 | Jun 29, 2023 | Jun 27, 2024 | Jun 25, 2025 | Jun 24, 2026 |
Sign up to see institutional holdings
Sign UpPodcast Mentions
Sign up to see podcast mentions and sentiment
Sign UpTimely disclosures published on TDnet, newest first, titles as filed in Japanese. The link opens the disclosure on TDnet. Filings with EDINET (periodic reports, extraordinary reports, offerings, holding and buy-back reports), newest first, titles as filed in Japanese. The link opens the filing on EDINET. Press releases from the company's own website, newest first.
高圧一括受電サービス利用料金の単価改定について
2026/11/05 お知らせ
平素は当社の高圧一括受電サービス(以下「本サービス」といいます。)をご利用いただき、厚く御礼申しあげます。
当社は、各地域電力会社が電気料金単価の見直しを実施したことに伴い、2026年11月1日に本サービス利用料金単価を改定しました。見直し後の新単価など、詳細につきましては各地域電力会社のホームページをご確認ください。
-
**中部地区:**中部電力ミライズ株式会社 2026年11月 電気料金単価の見直しについて|中部電力ミライズ
-
**関東地区:**東京電力エナジーパートナー株式会社 東京電力エナジーパートナー│電気のご契約・お手続き
-
**関西地区:**関西電力株式会社 託送供給等約款の変更に伴う電気料金等の見直し(PDF:701KB)
-
**北海道地区:**北海道電力株式会社 電気料金の見直しについて(PDF:564KB)
「メッセナゴヤ2026」出展のお知らせ
2026/10/30 お知らせ
当社は、日本最大級の異業種交流展示会「メッセナゴヤ2026」に出展します。
当社のパーパス(使命)である「いかなる時も、人や社会に"活力と豊かさ"を生み出す快適環境を創り、守る。」をテーマとして、下記の技術・サービスを紹介させていただきます。来場の際は、是非トーエネックブースにお立ち寄りください。
なお、同展示会とWEBで併載されるオンライン展示会(URL:https://www.messenagoya.jp/)にも出展いたします。
【来場登録】 https://www.messenagoya.jp/visitor/entry
【開催概要】 | 開催日 | 2026年11月11日(水)~13日(金) |
| 時 間 | 10:00~17:00 * MCによる会社説明:10:50~/14:20~ * 間接活線工法の実演、体験:11:00~/14:30~ ※当日の状況により、実施時間が変更となる場合があります。 |
| 会 場 | ポートメッセなごや(名古屋市国際展示場) |
| 小間No | B-48(第1展示館) |
【開催概要】 | ①事業紹介、施工実績 | セグメント別事業紹介、これまで施工してきた実績を紹介(主にランドマーク的な建築物、施設) |
| ②カーボンニュートラルへの 取り組み | 省エネに関するサービス、ペロブスカイト太陽電池の紹介 |
| ③地域との調和・共生 | 地域に根差した企業として、災害復旧対応、地域社会への貢献を紹介 |
| ④製品・サービス紹介 | 当社独自技術および拡大を目指しているサービスを紹介(ToEMS、油入変圧器診断装置低圧用DGR、EL測定技術) |
| ⑤安全への取り組み (実演、体験) | * 安全に向けた取り組みとして、ロータリー式被覆貫通型クランプ(新型)およびケーブル分岐金具(旧型)の実演、展示、間接活線工具(ヤットコ)操作とカバー取付体験 * 簡易型踏み抜きVR体感体験、低圧感電体感体験 |
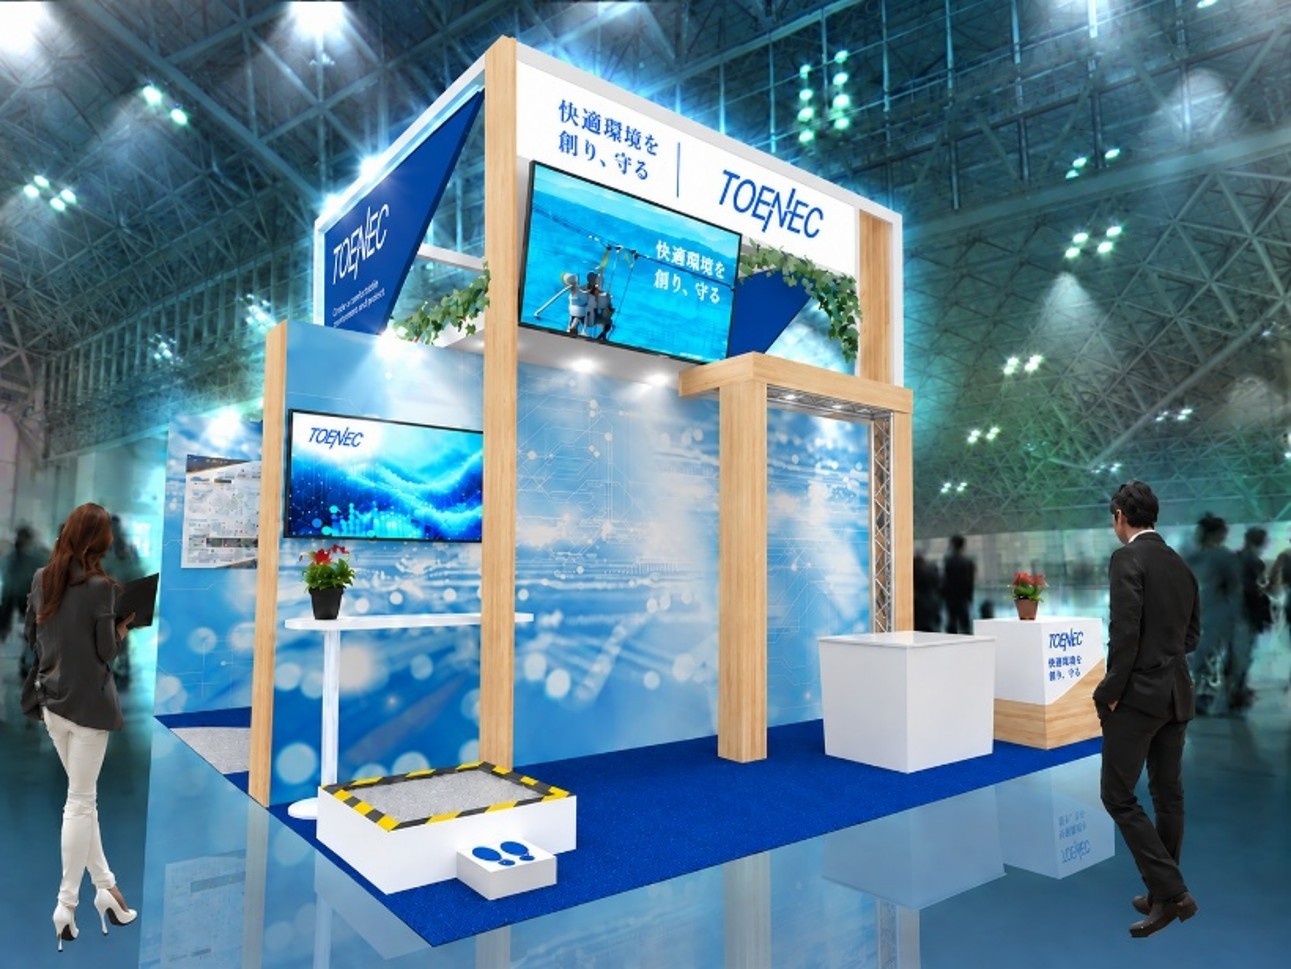 ブース予定図



 YouTube当社公式チャンネル








Prompts
Click prompts to add them under the company line, click again to take one out, then copy the result into your AI chat. Shared by Asian Century Stocks and Uncovered Thai Stocks. Thank you.
ETFs Holding Toenec Corporation
Exchange-traded funds whose newest published daily portfolio holds one of the company's listings, largest weight first.
| ETF | Weight in ETF | Shares | Market value | As of |
|---|---|---|---|---|
| AVDV | 0.04% | 631,600 | $ 7.035M | Nov 16, 2026 |
| DFIS | 0.01% | 60,400 | $ 694.279K | Nov 12, 2026 |
| DISV | 0.01% | 47,000 | $ 540.25K | Nov 12, 2026 |
| AVDS | 0.01% | 4,500 | $ 50.123K | Nov 16, 2026 |
| DXIV | 0.01% | 1,600 | $ 18.391K | Nov 12, 2026 |
| DFSI | 0.01% | 6,300 | $ 72.417K | Nov 12, 2026 |
| DFIC | 0.00% | 59,600 | $ 685.083K | Nov 12, 2026 |
| DFAX | 0.00% | 35,800 | $ 411.51K | Nov 12, 2026 |
| DFAI | 0.00% | 27,300 | $ 313.805K | Nov 12, 2026 |
| AVDE | 0.00% | 49,000 | $ 545.781K | Nov 16, 2026 |