|
Daiwa House Industry is a diversified real estate and construction group operating across seven business segments: single-family housing, rental housing, condominiums, commercial facilities, business facilities, environmental energy, and other services. The company develops, constructs, manages, and operates residential and commercial properties, including logistics, manufacturing, and medical care facilities. Its environmental energy segment focuses on the development and operation of renewable energy power plants and electricity retail. Key subsidiaries include Daiwa Living, Fujita, Daiwa Rontec, and Daiwa Energy. The group serves markets in Japan, the United States, Australia, and Southeast Asia through entities such as Stanley Martin Holdings, Rawson Group, and Daiwa House Malaysia. Additional operations include financial services, media, and asset management via subsidiaries like Daiwa House Financial and Media Tech. Summarised from the annual report, fiscal year ended Mar 2026 |
Industry Residential Construction | Homepage daiwahouse.co.jp |
| Sector Consumer Cyclical | IR page daiwahouse.co.jp | |
|
Tags
single-family housing, rental housing, condominium development, commercial facilities, logistics facilities, medical care facilities, renewable energy, property management, real estate investment, construction, Stanley Martin Holdings LLC, Rawson Group Pty Ltd, Trumark Companies LLC, CRC Holdings LLC, CastleRock Communities LLC, Daiwa House Reform, Daiwa House Real Estate, Design Arc, Daiwa Rontec, Daiwa Living, North Clark LLC, DH MQW Pty Ltd, Daiwa House USA Member LLC, DH Phoenix LLC, AP 355 N. Central Holdings LLC, Daiwa House Rental Reform, Daiwa House Modular Europe B.V., Daiwa House (Changzhou) Real Estate Development Co. Ltd., Daiwa Life Next, Hebao (Nantong) Real Estate Development Co. Ltd., Jiuxin (Changzhou) Real Estate Development Co. Ltd., Jiuxin (Suzhou) Real Estate Development Co. Ltd., Elephant Park Plot H11b LLP, Broadway Community Venture LLC, Broadway Community Owner LLC, Daiwa Lease, Daiwa House Realty Management, Royal Home Center, Sports Club NAS, Daiwa House Parking, Fujita, Daiwa Logistics, Daiwa House Malaysia Logistic Sdn. Bhd., Sumitomo Electric, Wakamatsu Packaging Transport Warehouse, Koyama Transport, Daiwa House Property Management, Daiwa Energy, Enserve, PT. Daiwa House Indonesia, Daiwa House Malaysia Sdn. Bhd., Daiwa House Group Investment Limited Partnership, Media Tech, Shinwa Agency, Daiwa House Financial, Daiwa House Insurance, Daiwa Royal Golf, Daiwa House Asset Management, Daiwa House Real Estate Investment Advisory, DH Asia Investment Pte. Ltd., Daiwa House Australia Pty Ltd, Daiwa House USA Holdings Inc., Daiwa House Texas Inc.
|
Press page daiwahouse.co.jp/about/release |
Metrics
| Valuation | |
|---|---|
| Market cap | ¥ 1.434T |
| Market cap (USD) | $ 8.963B |
| P/E | 4.67 |
| PEG | 1.07 |
| P/BV | 0.47 |
| P/S | 0.24 |
| P/OCF | 7.20 |
| P/FCF | -5.64 |
| Dividend yield | 8.1% |
| Turnover / mcap | — |
| Returns | |
|---|---|
| ROE | 12.2% |
| ROI | 7.0% |
| ROIC | 8.2% |
| Profit margin | 6.3% |
| Growth | |
|---|---|
| Revenue growing | Yes |
| Profits growing | Yes |
| Revenue up 3y | Yes |
| Revenue up 5y | Yes |
| Earnings growth 3y (net profit CAGR) | 4.4% |
| Quality | |
|---|---|
| Profitable | Yes |
| Margin expanding | Yes |
| Buying back stock | No |
| Diluting (TTM) | No |
| Debt/Equity | — |
| Podcast bulls (TTM) | Sign up |
| Podcast bears (TTM) | Sign up |
| Podcast sentiment (TTM) | Sign up |
| Podcast sentiment % (TTM) | Sign up |
| News sentiment (TTM) | 7 |
| Quality score | 55.6% |
| Insiders | |
|---|---|
| Buys, 1w | Sign up |
| Buys, 1m | Sign up |
| Buys, 1y | Sign up |
| Sells, 1w | Sign up |
| Sells, 1m | Sign up |
| Sells, 1y | Sign up |
Sign up to see this company's insider trades
| Figure | FY 2026 | FY 2025 | FY 2024 | FY 2023 | FY 2022 | FY 2021 | FY 2020 | FY 2019 | FY 2018 | FY 2017 | FY 2016 | FY 2015 | FY 2014 | FY 2013 |
|---|---|---|---|---|---|---|---|---|---|---|---|---|---|---|
| Revenue | 5.577T | 5.435T | 5.203T | 4.908T | 4.44T | 4.127T | 4.38T | 4.144T | 3.796T | 3.513T | 3.193T | 2.811T | 2.7T | 2.008T |
| Net profit | 350.568B | 325.058B | 298.752B | 308.399B | 225.272B | 195.076B | 233.603B | 237.439B | 236.357B | 201.7B | 103.577B | 117.133B | 102.095B | 66.274B |
| Free cash flow | -304.555B | 38.775B | -53.754B | -256.218B | -74.545B | 95.616B | -141.817B | 99.659B | 105.424B | -35.493B | 100.318B | — | — | — |
| Figure | FY 2026 | FY 2025 | FY 2024 | FY 2023 | FY 2022 | FY 2021 | FY 2020 | FY 2019 | FY 2018 | FY 2017 | FY 2016 | FY 2015 | FY 2014 | FY 2013 |
|---|---|---|---|---|---|---|---|---|---|---|---|---|---|---|
| Share price | 4.917K | 4.938K | 4.526K | 3.114K | 3.201K | 3.241K | 2.678K | 3.519K | 4.1K | 3.196K | 3.166K | 2.371K | 1.751K | 1.82K |
| Price performance 12m | -0 | 0.09 | 0.45 | -0.03 | -0.01 | 0.21 | -0.24 | -0.14 | 0.28 | 0.01 | 0.33 | 0.35 | -0.04 | — |
Filed figures
Lines the statements and their notes report beside the headline figures, read from the filings' XBRL as filed (no restatement applied), with figures computed from one filing's own lines. Cash-flow lines carry their cash direction: an outflow is negative. Each period links to its filing; a figure's period, report date and tag are in its tooltip.
| Figure | Mar 2017 | Mar 2018 | Mar 2019 | Mar 2020 | Mar 2021 | Mar 2022 | Mar 2023 | Mar 2024 | Mar 2025 | Mar 2026 |
|---|---|---|---|---|---|---|---|---|---|---|
| Balance sheet detail | ||||||||||
| Trade receivables (JPY) | — | — | — | — | — | 3.2B | 3.76B | 15.2B | 3.6B | 1.87B |
| ↳ YoY growth | +17.4% | +303.5% | -76.3% | -48.1% | ||||||
| Borrowings, current (JPY) | 148B | 176B | 233B | 290B | 211B | 256B | 342B | 340B | 531B | 1.16T |
| Borrowings, non-current (JPY) | 492B | 605B | 543B | 751B | 1.06T | 1.17T | 1.5T | 1.75T | 1.78T | 1.92T |
| Bonds payable (JPY) | 200B | 307B | 287B | 342B | 423B | 433B | 609B | 859B | 819B | 779B |
| Lease liabilities (JPY) | 26.8B | 37B | 55.8B | 85.9B | 101B | 112B | 105B | 116B | 124B | 134B |
| Cash and deposits (JPY) | 217B | 331B | 280B | 281B | 426B | 338B | 358B | 450B | 333B | 434B |
| Intangible assets (JPY) | 87B | 104B | 125B | 118B | 136B | 171B | 194B | 204B | 205B | 383B |
| Net debt (borrowings + leases - cash) (JPY) | 451B | 487B | 552B | 845B | 947B | 1.2T | 1.59T | 1.75T | 2.1T | 2.78T |
| Cash flow detail | ||||||||||
| Operating cash flow (JPY) | 288B | 382B | 356B | 150B | 430B | 336B | 230B | 302B | 421B | 189B |
| Purchases of property, plant and equipment (JPY) | -323B | -277B | -256B | -291B | -335B | -411B | -487B | -356B | -382B | -494B |
| Change in receivables (cash effect) (JPY) | -33.8B | -43.2B | -28.1B | -42.2B | 33.8B | 14B | -43.4B | -40.6B | 23.5B | 5.36B |
| Change in inventories (cash effect) (JPY) | 8.94B | -53.3B | -71.6B | -37.2B | -419M | -228B | -230B | -101B | -92.3B | -501B |
| Change in payables (cash effect) (JPY) | 13.9B | 94.3B | 49.8B | -188B | -72.3B | 59.5B | 19.4B | -22.2B | -14.9B | 4.66B |
| Dividends paid (cash effect) (JPY) | -56.5B | -64.6B | -74.6B | -79B | -72.6B | -79.2B | -86.1B | -87.5B | -95.6B | -95.9B |
| Share buybacks (cash effect) (JPY) | -12.2B | -26M | -7.98B | -244M | -26.1B | -12M | -10M | -87.2B | -100B | -14M |
| Interest paid (cash effect) (JPY) | -3.08B | -3.12B | -5.51B | -7.61B | -8.39B | -11.9B | -16.6B | -29.4B | -40.2B | -43.2B |
| Income taxes paid (cash effect) (JPY) | -107B | -101B | -114B | -131B | -111B | -112B | -114B | -112B | -130B | -163B |
| Operating cash flow before change in receivables (JPY) | 321B | 426B | 384B | 192B | 397B | 322B | 274B | 343B | 397B | 184B |
| Free cash flow (OCF - PPE - intangibles) (JPY) | -35.5B | 105B | 99.7B | -142B | 95.6B | -74.5B | -256B | -53.8B | 38.8B | -305B |
| Income detail | ||||||||||
| Research and development expense (JPY) | 8.38B | 8.79B | 9.68B | 10.1B | 10.2B | 9.5B | 10.4B | 10.9B | 10.8B | 11.9B |
| ↳ 5y CAGR | +5.0% | +2.5% | +3.5% | +2.4% | +1.3% | +3.2% | ||||
| Total comprehensive income (JPY) | 199B | 230B | 204B | 217B | 214B | 269B | 353B | 335B | 385B | 388B |
| Comprehensive income to owners (JPY) | 198B | 226B | 200B | 213B | 209B | 262B | 339B | 329B | 374B | 381B |
| Provision for credit losses (JPY) | 5.89B | 1.95B | 1.03B | 1.54B | 5.69B | 5.62B | 3.03B | 2.36B | 1.69B | 2.21B |
| Credit cost ratio (credit losses / average receivables) (%) | — | — | — | — | — | — | 87.0% | 24.9% | 18.0% | 80.9% |
| Segments | ||||||||||
| Environment And Energy · Segment revenue (JPY) | — | — | — | — | — | 161B | 189B | 139B | 131B | 133B |
| ↳ YoY growth | +17.1% | -26.1% | -5.9% | +1.5% | ||||||
| Environment And Energy · Segment operating income (JPY) | — | — | — | — | — | 5.27B | 6.29B | 9.13B | 12.4B | 13.8B |
| Reported | Jun 29, 2017 | Jun 28, 2018 | Jun 25, 2019 | Jun 26, 2020 | Jun 29, 2021 | Jun 29, 2023 | Jun 29, 2023 | Jun 27, 2024 | Jun 20, 2025 | Jun 17, 2026 |
Sign up to see institutional holdings
Sign UpPodcast Mentions
Sign up to see podcast mentions and sentiment
Sign UpTimely disclosures published on TDnet, newest first, titles as filed in Japanese. The link opens the disclosure on TDnet. Filings with EDINET (periodic reports, extraordinary reports, offerings, holding and buy-back reports), newest first, titles as filed in Japanese. The link opens the filing on EDINET. Press releases from the company's own website, newest first.

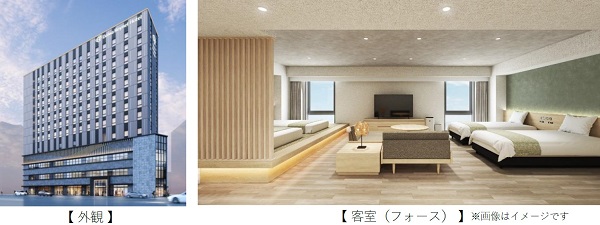
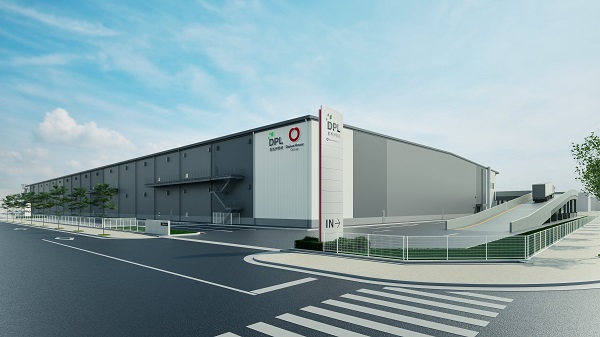
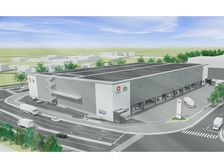
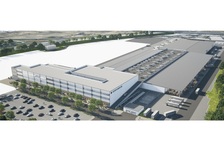
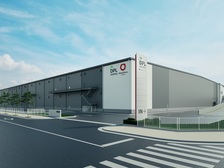
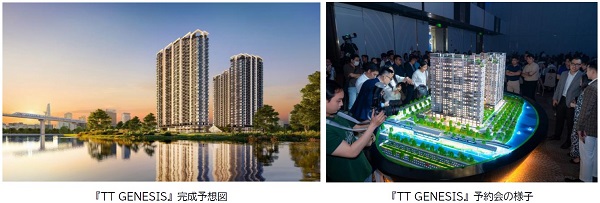
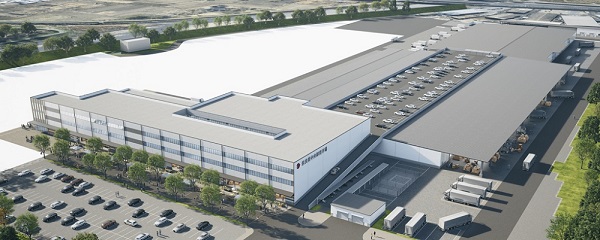 【完成イメージ】 |
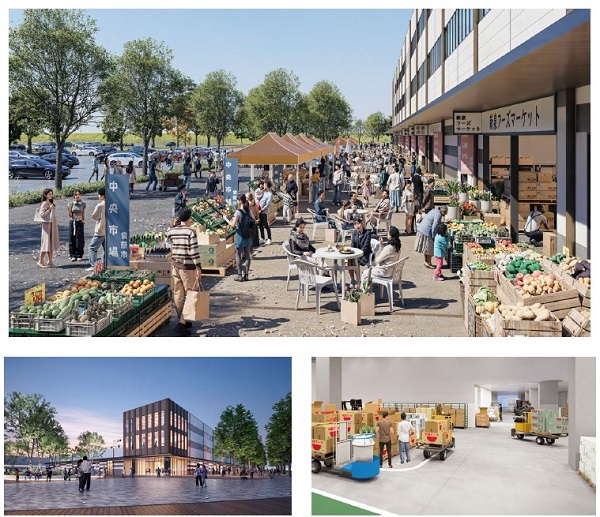 【完成イメージ】 |
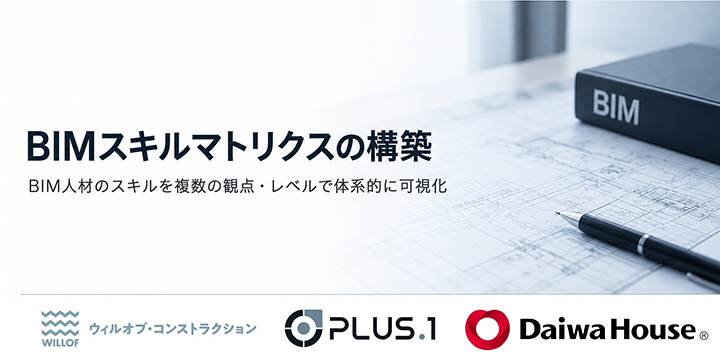 |
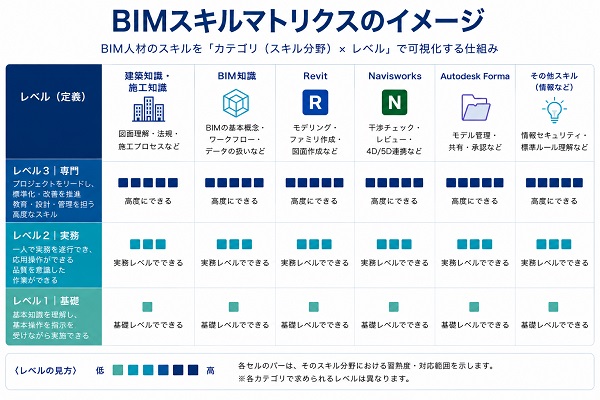 |


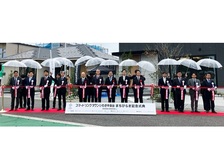
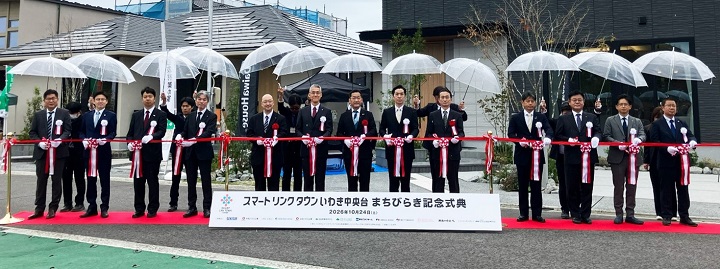 ▲スマートリンクタウンいわき中央台 まちびらきオープニングセレモニーの様子(※1) |
 ▲スマートリンクタウンいわき中央台 まちびらきイベントの様子 |





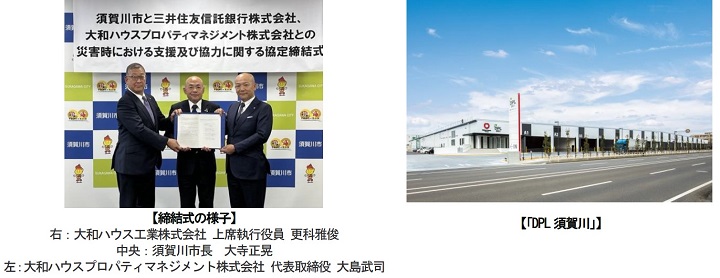 |
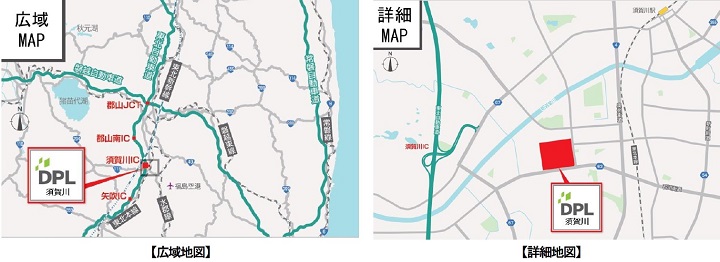 |
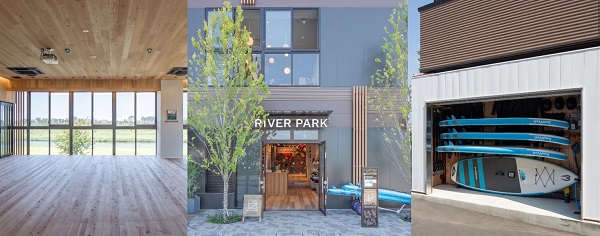

 |
 |
 |
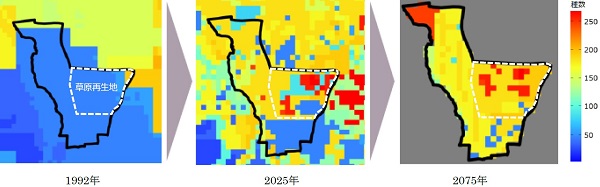 |
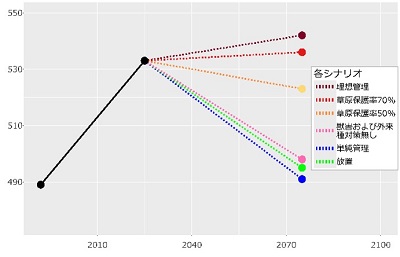 維持管理の各シナリオにおける生物多様性評価 |
 |
 |
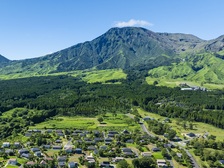
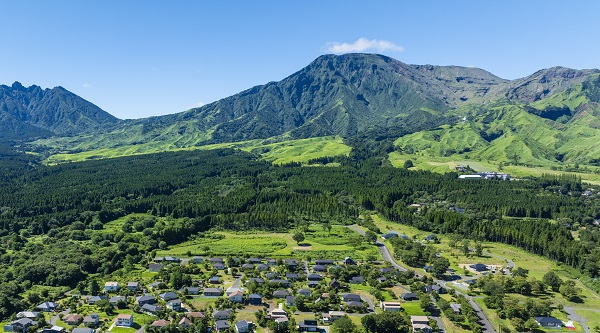 「ASONOHARA(あそのはら)」と周辺エリアの景観 |
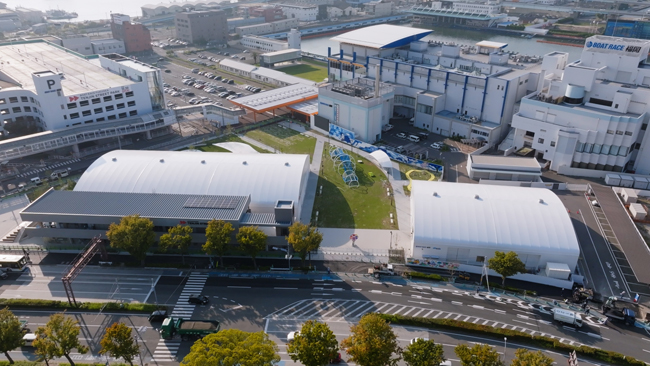
 |
 |





 |
 |
Prompts
Click prompts to add them under the company line, click again to take one out, then copy the result into your AI chat. Shared by Asian Century Stocks and Uncovered Thai Stocks. Thank you.
Company History
Name and ticker changes, and re-registrations under a new regulatory id. When a ticker stopped being used is not recorded, so former tickers are undated.
| Date | Change | Detail |
|---|---|---|
| Jan 7, 2026 | Acquired | Acquired Sumitomo Densetsu Co., Ltd. (EDINET code E00114). Its filings from before the deal are on its own company page, not shown here. |
ETFs Holding Daiwa House Industry Co., Ltd.
Exchange-traded funds whose newest published daily portfolio holds one of the company's listings, largest weight first.
| ETF | Weight in ETF | Shares | Market value | As of |
|---|---|---|---|---|
| ORR | 0.62% | 153,000 | $ 2.28M | Nov 18, 2026 |
| JHID | 0.60% | 2,395 | $ 65.09K | Jun 30, 2026 |
| DFIV | 0.29% | 4,300,416 | $ 64.345M | Nov 12, 2026 |
| DXIV | 0.19% | 31,100 | $ 465.333K | Nov 12, 2026 |
| DIHP | 0.18% | 773,800 | $ 11.578M | Nov 12, 2026 |
| DFSI | 0.17% | 134,200 | $ 2.008M | Nov 12, 2026 |
| DFIC | 0.13% | 1,372,700 | $ 20.539M | Nov 12, 2026 |
| NTSI | 0.11% | 19,700 | $ 535.394K | Jun 30, 2026 |
| DFAI | 0.10% | 1,231,100 | $ 18.42M | Nov 12, 2026 |
| AVSD | 0.08% | 18,600 | $ 279.841K | Nov 16, 2026 |
| DFAX | 0.07% | 544,900 | $ 8.153M | Nov 12, 2026 |
| AVDE | 0.03% | 439,600 | $ 6.614M | Nov 16, 2026 |