2026年3月期 決算短信〔日本基準〕(連結) 2026年5月13日 株式会社植木組 上場取引所 上場会社名 コード番号 1867 URL https://www.uekigumi.co.jp 代表者 (役職名) 代表取締役社長 (氏名)日下部久夫 問合せ先責任者 (役職名)…
2026年3月期
決算短信〔日本基準〕(連結)
2026年5月13日
株式会社植木組
上場取引所
上場会社名
コード番号
1867
URL https://www.uekigumi.co.jp
代表者
(役職名) 代表取締役社長
(氏名)日下部久夫
問合せ先責任者 (役職名) 取締役専務執行役員管理統括部長 (氏名)植木豊
TEL 0257-23-0660
定時株主総会開催予定日
2026年6月25日
配当支払開始予定日 2026年6月10日
有価証券報告書提出予定日 2026年6月24日
決算補足説明資料作成の有無:有
決算説明会開催の有無
東
:無
(百万円未満切捨て)
1.2026年3月期の連結業績(2025年4月1日~2026年3月31日)
(1)連結経営成績
(%表示は対前期増減率)
売上高
営業利益
親会社株主に帰属する
当期純利益
経常利益
百万円
%
百万円
%
百万円
%
百万円
%
2026年3月期
63,290
24.8
3,721
30.4
3,814
29.3
2,407
24.4
2025年3月期
50,703
△9.3
2,853
10.0
2,950
11.1
1,934
3.1
(注)包括利益
2026年3月期
3,316百万円 (55.9%)
1株当たり
当期純利益
2025年3月期
潜在株式調整後
1株当たり当期純利益
2,127百万円 (△15.9%)
自己資本
当期純利益率
総資産
経常利益率
売上高
営業利益率
円銭
円銭
%
%
%
2026年3月期
366.38
-
7.9
7.1
5.9
2025年3月期
297.06
-
6.9
5.8
5.6
(参考)持分法投資損益
2026年3月期
-百万円
2025年3月期
-百万円
(2)連結財政状態
総資産
純資産
自己資本比率
1株当たり純資産
百万円
百万円
%
円銭
2026年3月期
56,338
31,813
56.3
4,826.55
2025年3月期
50,897
29,062
57.0
4,419.87
(参考)自己資本
2026年3月期
31,735百万円
2025年3月期
28,999百万円
(3)連結キャッシュ・フローの状況
営業活動による
キャッシュ・フロー
投資活動による
キャッシュ・フロー
財務活動による
キャッシュ・フロー
現金及び現金同等物
期末残高
百万円
百万円
百万円
百万円
2026年3月期
△3,790
△1,383
2,482
3,523
2025年3月期
2,649
△1,083
793
6,215
2.配当の状況
年間配当金
第1四半期末第2四半期末第3四半期末
期末
合計
配当金総額
(合計)
配当性向
(連結)
純資産配当率
(連結)
円銭
円銭
円銭
円銭
円銭
百万円
%
%
2025年3月期
-
0.00
-
90.00
90.00
590
30.3
2.1
2026年3月期
-
0.00
-
120.00
120.00
789
32.8
2.6
2027年3月期(予想)
-
0.00
-
110.00
110.00
33.6
3.2027年3月期の連結業績予想(2026年4月1日~2027年3月31日)
(%表示は、対前期増減率)
売上高
通期
営業利益
親会社株主に帰属
する当期純利益
経常利益
1株当たり
当期純利益
百万円
%
百万円
%
百万円
%
百万円
%
円銭
65,000
2.7
3,200
△14.0
3,250
△14.8
2,150
△10.7
327.22
2025年3月期
2025年3月期
2025年3月期
6,873,528株
312,457株
6,512,603株
※ 注記事項
(1)期中における連結範囲の重要な変更:無
新規 -社
(社名)-、除外 -社
(社名)-
(2)会計方針の変更・会計上の見積りの変更・修正再表示
① 会計基準等の改正に伴う会計方針の変更:無
② ①以外の会計方針の変更
:無
③ 会計上の見積りの変更
:無
④ 修正再表示
:無
(3)発行済株式数(普通株式)
① 期末発行済株式数(自己株式を含む)
② 期末自己株式数
③ 期中平均株式数
2026年3月期
2026年3月期
2026年3月期
6,873,528株
298,359株
6,570,575株
(参考)個別業績の概要
1.2026年3月期の個別業績(2025年4月1日~2026年3月31日)
(1)個別経営成績
(%表示は対前期増減率)
売上高
営業利益
経常利益
当期純利益
百万円
%
百万円
%
百万円
%
百万円
%
2026年3月期
56,661
32.6
2,964
43.3
3,211
41.8
2,206
31.8
2025年3月期
42,731
△12.1
2,069
11.9
2,265
8.6
1,673
9.2
1株当たり
当期純利益
潜在株式調整後
1株当たり当期純利益
円銭
円銭
2026年3月期
335.74
-
2025年3月期
256.98
-
(2)個別財政状態
総資産
純資産
自己資本比率
1株当たり純資産
百万円
百万円
%
円銭
2026年3月期
51,246
27,228
53.1
4,141.09
2025年3月期
46,366
24,698
53.3
3,764.34
(参考)自己資本
2026年3月期
27,228百万円
2025年3月期
24,698百万円
2.2027年3月期の個別業績予想(2026年4月1日~2027年3月31日)
(%表示は、対前期増減率)
売上高
通期
経常利益
1株当たり
当期純利益
当期純利益
百万円
%
百万円
%
百万円
%
円銭
54,700
△3.5
2,790
△13.1
1,900
△13.9
289.17
※
決算短信は公認会計士又は監査法人の監査の対象外です
※
業績予想の適切な利用に関する説明、その他特記事項
(将来に関する記述等についてのご注意)
本資料に記載されている業績見通し等の将来に関する記述は、当社が現在入手している情報及び合理的であると判断する一定の前提に基
づいており、その達成を当社として約束する趣旨のものではありません。また、実際の業績等は様々な要因により大きく異なる可能性があ
ります。業績予想の前提となる条件及び業績予想のご利用に当たっての注意事項等については、添付資料P.4「1.経営成績の概況(4)今後の
見通し」をご覧ください。
(株)植木組 (1867) 2026年3月期
決算短信
○添付資料の目次
1.経営成績等の概況 ………………………………………………………………………………………………………
2
(1)当期の経営成績の概況 ……………………………………………………………………………………………
(2)当期の財政状態の概況 ……………………………………………………………………………………………
2
3
(3)当期のキャッシュ・フローの概況 ………………………………………………………………………………
3
(4)今後の見通し ………………………………………………………………………………………………………
4
(5)利益配分に関する基本方針及び当期・次期の配当 ……………………………………………………………
4
2.会計基準の選択に関する基本的な考え方 ……………………………………………………………………………
4
3.連結財務諸表及び主な注記 ……………………………………………………………………………………………
(1)連結貸借対照表 ……………………………………………………………………………………………………
5
5
(2)連結損益計算書及び連結包括利益計算書 ………………………………………………………………………
7
連結損益計算書 ……………………………………………………………………………………………………
連結包括利益計算書 ………………………………………………………………………………………………
(3)連結株主資本等変動計算書 ………………………………………………………………………………………
7
9
10
(4)連結キャッシュ・フロー計算書 …………………………………………………………………………………
12
(5)連結財務諸表に関する注記事項 …………………………………………………………………………………
(継続企業の前提に関する注記) …………………………………………………………………………………
(連結財務諸表作成のための基本となる重要な事項) …………………………………………………………
(連結貸借対照表に関する注記) …………………………………………………………………………………
14
14
14
16
(連結損益計算書に関する注記) …………………………………………………………………………………
17
(連結株主資本等変動計算書関係) ………………………………………………………………………………
(連結キャッシュ・フロー計算書関係) …………………………………………………………………………
(セグメント情報等の注記) ………………………………………………………………………………………
(関連当事者情報) …………………………………………………………………………………………………
19
20
21
24
(1株当たり情報) …………………………………………………………………………………………………
24
(重要な後発事象) …………………………………………………………………………………………………
24
4.個別財務諸表及び主な注記 ……………………………………………………………………………………………
25
(1)貸借対照表 …………………………………………………………………………………………………………
25
(2)損益計算書 …………………………………………………………………………………………………………
28
(3)株主資本等変動計算書 ……………………………………………………………………………………………
5.その他 ……………………………………………………………………………………………………………………
31
33
(株)植木組 (1867) 2026年3月期
決算短信
1.経営成績等の概況
(1)当期の経営成績の概況
当連結会計年度におけるわが国経済は、雇用・所得環境の改善が進み、個人消費やインバウンド需要を背景に、緩
やかに回復しましたが、国内の物価上昇の継続や国際情勢の不安定化に伴う景気の下押しリスクの高まりが懸念され
るなど、依然として先行き不透明な状況が続きました。
建設業界におきましては、公共投資、民間設備投資ともに底堅い推移が見られたものの、建設資材やエネルギー価
格は高い水準にあり、また、労務需給の逼迫等が建設コストの上昇圧力となるなど引き続き厳しい経営環境が続きま
した。
このような経営環境の中、当社グループは、ESG/SDGSに配慮した企業活動を通じて、建設業従事者の処遇改善と
生産性向上を推進するとともに、安全と品質の確保並びに工期遵守を優先しながら鋭意事業活動を展開してまいりま
した。
この結果、手持ちの大型工事が順調に進捗したことなどにより完成工事高が増加したことから、売上高は632億90
百万円(前期比24.8%増)となりました。利益面につきましては、主力の建設事業において、適正な人員配置やICT
技術等の活用により生産性を高めると共に、建設コストの変化に応じた適正価格での契約に努めたことから、営業利
益は37億21百万円(同30.4%増)、経常利益は38億14百万円(同29.3%増)、親会社株主に帰属する当期純利益は24
億7百万円(同24.4%増)となりました。
セグメントの業績は次のとおりです。
(建設事業)
建設事業におきましては、建築部門を中心に前期繰越の大型工事が順調に進捗したことにより、売上高は570億49
百万円(前期比28.4%増)となり、セグメント利益は32億57百万円(同44.4%増)となりました。
(不動産事業)
不動産事業におきましては、販売用不動産の売上が減少したことにより、売上高は24億26百万円(同12.5%減)と
なり、セグメント利益は2億27百万円(同26.5%減)となりました。
(建材製造販売事業)
建材製造販売事業におきましては、販売数量の減少により、売上高は6億81百万円(同1.8%減)となりましたが、
適切な価格転嫁を実施したことにより、セグメント利益は1億20百万円(同3.4%増)となりました。
(その他)
その他の事業におきましては、設計監理業務等の売上が増加したことにより、売上高は31億32百万円(同12.3%
増)となりましたが、その他の事業全般において物価高騰によるコストの増加により、セグメント利益は2億44百万
円(同16.6%減)となりました。
当連結会計年度の主な受注工事及び完成工事は次のとおりです。
〔受注工事〕
工
事
名
発注者又は事業主体
ソントン茨城中央工場建築系建築工事
三菱ケミカルエンジニアリング株式会社
(仮称)袖ケ浦上泉食品倉庫新築工事
株式会社ベストランス
西東京市北町4丁目付近管路新設工事
東京電力パワーグリッド株式会社
海老取川防潮堤耐震補強工事(その211)
東京都財務局
R6荒川第二調節池地盤改良工事
関東地方整備局
荒川調節池工事事務所
〔完成工事〕
工
(仮称)船引事業所
事
名
発注者又は事業主体
第三工場新築計画
株式会社重松製作所
(仮称)南篠崎町2丁目計画新築工事
大和証券リアルティ株式会社
千曲川静間地区築堤護岸他その2工事
北陸地方整備局
新河岸川防潮堤耐震補強工事(その5)
東京都財務局
R6羽咋道路
北陸地方整備局
四柳舗装工事
千曲川河川事務所
金沢河川国道事務所
(株)植木組 (1867) 2026年3月期
決算短信
(2)当期の財政状態の概況
(資産の部)
当連結会計年度末の総資産は563億38百万円となり、前連結会計年度末に比べ54億41百万円増加いたしました。
その主な要因といたしましては、受取手形・完成工事未収入金等が66億48百万円増加したことによるものです。
(負債の部)
負債の部におきましては、負債合計は245億24百万円となり、前連結会計年度末に比べ26億89百万円増加いたし
ました。その主な要因といたしましては、短期借入金が35億91百万円増加したことによるものです。
(純資産の部)
純資産の部におきましては、純資産合計は318億13百万円となり、前連結会計年度末に比べ27億51百万円増加い
たしました。その主な要因といたしましては、親会社株主に帰属する当期純利益24億7百万円によるものです。
(3)当期のキャッシュ・フローの概況
(単位:百万円)
前連結会計年度
当連結会計年度
営業活動によるキャッシュ・フロー
2,649
△3,790
投資活動によるキャッシュ・フロー
△1,083
△1,383
財務活動によるキャッシュ・フロー
793
2,482
現金及び現金同等物の増加額
2,360
△2,692
現金及び現金同等物期末残高
6,215
3,523
当連結会計年度における現金及び現金同等物(以下、「資金」という。)は、前連結会計年度末に比べ26億92百
万円減少し、当連結会計年度末には35億23百万円となりました。
各キャッシュ・フローの状況とそれらの要因は次のとおりです。
(営業活動によるキャッシュ・フロー)
営業活動の結果使用した資金は37億90百万円(前期は得られた資金26億49百万円)となりました。これは主に税
金等調整前当期純利益による収入があった一方、工事の進捗により売上債権が増加したことによるものです。
(投資活動によるキャッシュ・フロー)
投資活動の結果使用した資金は13億83百万円(前期は使用した資金10億83百万円)となりました。これは主に有
形固定資産の取得による支出によるものです。
(財務活動によるキャッシュ・フロー)
財務活動の結果得られた資金は24億82百万円(前期は得られた資金7億93百万円)となりました。これは主に借
入金による資金の調達によるものです。
2022年3月期
2023年3月期
2024年3月期
2025年3月期
2026年3月期
自己資本比率(%)
55.3
53.4
54.4
57.0
56.3
時価ベースの自己資本比率(%)
22.3
18.5
21.5
22.9
32.7
キャッシュ・フロー対有利子
負債比率(年)
1.3
4.7
-
1.4
-
インタレスト・カバレッジ・
レシオ(倍)
75.9
25.3
-
72.3
-
(注)自己資本比率:自己資本/総資産
時価ベースの自己資本比率:株式時価総額/総資産
キャッシュ・フロー対有利子負債比率:有利子負債/営業キャッシュ・フロ-
インタレスト・カバレッジ・レシオ:営業キャッシュ・フロ-/利払い
1.各指標は、いずれも連結ベースの財務数値により計算しております。
2.株式時価総額は、期末株価終値×期末発行済株式総数により算出しております。
3.営業キャッシュ・フロ-は連結キャッシュ・フロ-計算書の営業活動によるキャッシュ・フロ-を使用して
おります。有利子負債は、連結貸借対照表に計上されている負債のうち利子を支払っている全ての負債を対
象としております。また、利払いについては、連結キャッシュ・フロ-計算書の利息の支払額を使用してお
ります。
4.2024年3月期および2026年3月期のキャッシュ・フロー対有利子負債比率及びインタレスト・カバレッジ・レ
シオについては、営業キャッシュ・フローがマイナスのため記載しておりません。
(株)植木組 (1867) 2026年3月期
決算短信
(4)今後の見通し
今後のわが国経済は、雇用・所得環境の改善や、堅調な企業収益等を背景とした緩やかな景気の上昇が期待され
ますが、中東情勢の動向による資材の不足や納期の遅延、建設コストへの影響につきまして、引き続き注意をする
必要があります。
建設業界におきましては、公共投資は堅調に推移すると予想されますが、民間設備投資では中東情勢の物価への
影響による製造業の設備投資抑制が懸念されます。一方、建設技術者や技能労働者の減少と高齢化は進んでおり、
人手不足に対応した生産性の向上は継続的課題であります。
このような事業環境のもと、当社グループは、「中期経営計画(2025~2027年度)」の目標達成に向けて「営業
力」「技術力」「人財力」を重点テーマに掲げ、省人化に繋がる研究開発やDXを推進すると共に、人材育成の強化
や働きやすい職場環境づくりで従業員の活躍を後押しすることで人的資本経営を実践し、持続的成長と企業価値の
向上を目指す所存であります。
2027年3月期は、海外情勢等の不透明感が続き、資材価格や人手不足による労務コストの高騰等による利益率の低
下が懸念されます。社内ネットワークを駆使した早期の資材調達や技能労働者の確保を引き続き図るものの、連結
売上高650億円、営業利益32億円、経常利益32億50百万円、親会社株主に帰属する当期純利益21億50百万円を見込ん
でおります。
なお、業績予想につきましては、発表日時点での入手可能な情報に基づき算出しておりますが、今後予想が大き
く変動する見込みが生じた場合には、速やかに開示いたします。
セグメント別売上高計画
項
(単位:百万円)
2026年3月期
目
実績
2027年3月期
計画
増
減
建設事業
57,049
56,000
△1,049
不動産事業
2,426
5,000
2,574
681
700
19
3,132
3,300
168
63,290
65,000
1,710
建材製造販売事業
その他
合
計
(5)利益配分に関する基本方針及び当期・次期の配当
利益配分につきましては、株主の皆様に対する配当政策を重要な経営課題の1つと位置づけ、企業基盤の強化と
将来的な事業展開、連結業績等を勘案しながら、従来に増して配当性向を意識し、利益配分を行うことを基本方針
としております。
当期の利益配分につきましては、1株につき120円とさせていただきます。
次期の配当金につきましては、基本方針及び業績予想を勘案し、現在のところ、1株につき110円の期末配当を予
定しております。
2.会計基準の選択に関する基本的な考え方
当社グループの利害関係者の多くは、国内の株主、債権者、取引先等であり、海外からの資金調達の必要性が乏
しいため、会計基準につきましては日本基準を適用しております。
(株)植木組 (1867) 2026年3月期
3.連結財務諸表及び主な注記
(1)連結貸借対照表
(単位:千円)
前連結会計年度
(2025年3月31日)
資産の部
流動資産
現金預金
受取手形・完成工事未収入金等
販売用不動産
商品
未成工事支出金
不動産事業支出金
材料貯蔵品
未収入金
その他
貸倒引当金
流動資産合計
固定資産
有形固定資産
建物・構築物
機械、運搬具及び工具器具備品
土地
リース資産
建設仮勘定
減価償却累計額
有形固定資産合計
無形固定資産
投資その他の資産
投資有価証券
繰延税金資産
その他
貸倒引当金
投資その他の資産合計
固定資産合計
資産合計
当連結会計年度
(2026年3月31日)
6,585,135
20,888,934
696,215
3,996
1,259,824
2,321,106
57,594
543,269
345,430
△814
32,700,693
3,864,021
27,537,431
194,504
3,896
531,103
3,735,700
59,750
321,620
509,577
△6,382
36,751,226
14,035,586
5,859,152
7,217,839
275,668
46,429
△13,164,181
14,270,493
376,646
14,580,637
5,747,047
7,209,513
235,533
98,549
△13,515,013
14,356,267
473,718
2,512,488
284,910
754,270
△1,765
3,549,904
18,197,044
50,897,737
3,796,746
173,239
827,456
△39,806
4,757,636
19,587,622
56,338,848
決算短信
(株)植木組 (1867) 2026年3月期
(単位:千円)
前連結会計年度
(2025年3月31日)
負債の部
流動負債
支払手形・工事未払金等
短期借入金
リース債務
未払法人税等
未成工事受入金
賞与引当金
役員賞与引当金
完成工事補償引当金
工事損失引当金
未払金
その他
流動負債合計
固定負債
社債
長期借入金
リース債務
長期未払金
繰延税金負債
再評価に係る繰延税金負債
退職給付に係る負債
役員退職慰労引当金
債務保証損失引当金
資産除去債務
その他
固定負債合計
負債合計
純資産の部
株主資本
資本金
資本剰余金
利益剰余金
自己株式
株主資本合計
その他の包括利益累計額
その他有価証券評価差額金
土地再評価差額金
退職給付に係る調整累計額
その他の包括利益累計額合計
非支配株主持分
純資産合計
負債純資産合計
当連結会計年度
(2026年3月31日)
7,191,603
1,874,488
36,697
584,792
5,403,022
937,914
35,280
17,304
64,466
661,818
275,664
17,083,053
9,312,677
5,466,138
33,529
918,455
2,390,309
1,323,818
44,036
30,426
36,267
345,295
213,340
20,114,295
18,500
1,829,798
90,815
181,117
31,193
531,693
1,022,798
4,166
229,620
229,005
583,750
4,752,459
21,835,512
11,500
1,363,660
106,118
177,148
192,664
531,693
1,033,880
4,881
224,698
233,491
530,895
4,410,632
24,524,927
5,315,671
5,416,693
17,672,314
△282,100
28,122,578
5,315,671
5,433,560
19,489,133
△268,343
29,970,022
1,003,872
△305,595
178,213
876,489
63,156
29,062,224
50,897,737
1,900,330
△305,595
170,609
1,765,343
78,554
31,813,920
56,338,848
決算短信
(株)植木組 (1867) 2026年3月期
(2)連結損益計算書及び連結包括利益計算書
(連結損益計算書)
(単位:千円)
前連結会計年度
(自 2024年4月1日
至 2025年3月31日)
売上高
完成工事高
不動産事業売上高
その他の事業売上高
売上高合計
売上原価
完成工事原価
不動産事業売上原価
その他の事業売上原価
売上原価合計
売上総利益
完成工事総利益
不動産事業総利益
その他の事業総利益
売上総利益合計
販売費及び一般管理費
営業利益
営業外収益
受取利息
受取配当金
補助金収入
雑収入
営業外収益合計
営業外費用
支払利息
支払手数料
雑支出
営業外費用合計
経常利益
当連結会計年度
(自 2025年4月1日
至 2026年3月31日)
44,448,068
2,772,321
3,483,185
50,703,575
57,049,374
2,426,374
3,814,251
63,290,000
39,808,501
2,254,407
2,381,386
44,444,296
51,060,832
1,991,030
2,712,199
55,764,062
4,639,567
517,913
1,101,798
6,259,279
3,405,389
2,853,889
5,988,542
435,344
1,102,052
7,525,938
3,804,834
3,721,103
516
73,992
29,558
49,996
154,064
4,970
100,492
6,567
54,267
166,297
36,660
7,895
13,111
57,666
2,950,287
53,934
2,675
15,833
72,443
3,814,957
決算短信
(株)植木組 (1867) 2026年3月期
(単位:千円)
前連結会計年度
(自 2024年4月1日
至 2025年3月31日)
特別利益
固定資産売却益
投資有価証券売却益
保険差益
特別利益合計
特別損失
固定資産除却損
投資有価証券評価損
減損損失
その他
特別損失合計
税金等調整前当期純利益
法人税、住民税及び事業税
法人税等調整額
法人税等合計
当期純利益
非支配株主に帰属する当期純利益
親会社株主に帰属する当期純利益
当連結会計年度
(自 2025年4月1日
至 2026年3月31日)
3,300
11,252
50,896
65,449
26,675
-
-
26,675
15,448
749
180,728
4,933
201,859
2,813,877
926,357
△55,450
870,907
1,942,970
8,350
1,934,620
84,634
-
128,886
-
213,521
3,628,112
1,311,009
△110,171
1,200,838
2,427,273
19,958
2,407,315
決算短信
(株)植木組 (1867) 2026年3月期
(連結包括利益計算書)
(単位:千円)
前連結会計年度
(自 2024年4月1日
至 2025年3月31日)
当期純利益
その他の包括利益
その他有価証券評価差額金
土地再評価差額金
退職給付に係る調整額
その他の包括利益合計
包括利益
(内訳)
親会社株主に係る包括利益
非支配株主に係る包括利益
当連結会計年度
(自 2025年4月1日
至 2026年3月31日)
1,942,970
2,427,273
213,055
△15,094
△13,673
184,288
2,127,258
896,457
-
△7,603
888,854
3,316,127
2,118,908
8,350
3,296,169
19,958
決算短信
(株)植木組 (1867) 2026年3月期
(3)連結株主資本等変動計算書
前連結会計年度(自 2024年4月1日
至
2025年3月31日)
(単位:千円)
株主資本
資本金
当期首残高
資本剰余金
5,315,671
5,377,463
利益剰余金
16,230,401
自己株式
△339,609
株主資本合計
26,583,926
当期変動額
剰余金の配当
△454,867
△454,867
親会社株主に帰属する当期
純利益
1,934,620
1,934,620
自己株式の取得
自己株式の処分
39,229
土地再評価差額金の取崩
△324
△324
57,833
97,062
△37,839
△37,839
株主資本以外の項目の当期
変動額(純額)
当期変動額合計
当期末残高
-
39,229
1,441,913
57,508
1,538,651
5,315,671
5,416,693
17,672,314
△282,100
28,122,578
その他の包括利益累計額
その他有価証券土地再評価差額
評価差額金
金
当期首残高
790,816
退職給付に係る
調整累計額
その他の包括利
益累計額合計
191,886
654,362
△328,341
非支配株主持分
57,566
純資産合計
27,295,855
当期変動額
剰余金の配当
△454,867
親会社株主に帰属する当期
純利益
1,934,620
自己株式の取得
△324
自己株式の処分
97,062
土地再評価差額金の取崩
株主資本以外の項目の当期
変動額(純額)
当期変動額合計
当期末残高
△37,839
213,055
22,745
△13,673
222,127
5,590
227,717
213,055
22,745
△13,673
222,127
5,590
1,766,369
1,003,872
△305,595
178,213
876,489
63,156
29,062,224
決算短信
(株)植木組 (1867) 2026年3月期
当連結会計年度(自
2025年4月1日
至
2026年3月31日)
(単位:千円)
株主資本
資本金
当期首残高
資本剰余金
5,315,671
5,416,693
利益剰余金
17,672,314
自己株式
△282,100
株主資本合計
28,122,578
当期変動額
剰余金の配当
△590,496
△590,496
親会社株主に帰属する当期
純利益
2,407,315
2,407,315
自己株式の取得
自己株式の処分
16,867
△61
△61
13,818
30,685
土地再評価差額金の取崩
株主資本以外の項目の当期
変動額(純額)
当期変動額合計
当期末残高
-
16,867
1,816,819
13,757
1,847,443
5,315,671
5,433,560
19,489,133
△268,343
29,970,022
その他の包括利益累計額
その他有価証券土地再評価差額
評価差額金
金
当期首残高
1,003,872
退職給付に係る
調整累計額
その他の包括利
益累計額合計
178,213
876,489
△305,595
非支配株主持分
63,156
純資産合計
29,062,224
当期変動額
剰余金の配当
△590,496
親会社株主に帰属する当期
純利益
2,407,315
自己株式の取得
△61
自己株式の処分
30,685
土地再評価差額金の取崩
株主資本以外の項目の当期
変動額(純額)
当期変動額合計
当期末残高
896,457
△7,603
888,854
15,398
904,252
896,457
-
△7,603
888,854
15,398
2,751,695
1,900,330
△305,595
170,609
1,765,343
78,554
31,813,920
決算短信
(株)植木組 (1867) 2026年3月期
(4)連結キャッシュ・フロー計算書
(単位:千円)
前連結会計年度
(自 2024年4月1日
至 2025年3月31日)
営業活動によるキャッシュ・フロー
税金等調整前当期純利益
減価償却費
減損損失
貸倒引当金の増減額(△は減少)
退職給付に係る負債の増減額(△は減少)
賞与引当金の増減額(△は減少)
役員賞与引当金の増減額(△は減少)
完成工事補償引当金の増減額(△は減少)
工事損失引当金の増減額(△は減少)
役員退職慰労引当金の増減額(△は減少)
債務保証損失引当金の増減額(△は減少)
受取利息及び受取配当金
支払利息
保険差益
補助金収入
投資有価証券売却損益(△は益)
投資有価証券評価損益(△は益)
固定資産売却損益(△は益)
固定資産除却損
売上債権の増減額(△は増加)
未成工事支出金の増減額(△は増加)
棚卸資産の増減額(△は増加)
仕入債務の増減額(△は減少)
未成工事受入金の増減額(△は減少)
未払金の増減額(△は減少)
その他の流動資産の増減額(△は増加)
その他
小計
利息及び配当金の受取額
利息の支払額
保険金の受取額
補助金の受取額
法人税等の支払額
営業活動によるキャッシュ・フロー
2,813,877
660,829
180,728
△107
△86,704
△42,929
9,002
△10,558
△2,702
710
△6,694
△74,509
36,660
△50,896
△29,558
△11,252
749
△3,300
15,448
2,960,535
△1,170,666
△530,736
△4,965,586
2,894,610
△670,383
1,409,200
41,577
3,367,343
74,509
△36,660
56,000
29,558
△841,206
2,649,543
当連結会計年度
(自 2025年4月1日
至 2026年3月31日)
3,628,112
760,951
128,886
43,609
3,479
385,903
8,756
13,122
△28,199
715
△4,921
△105,462
53,934
-
△6,567
-
-
△26,675
84,634
△6,648,497
△685,873
501,710
2,121,073
△3,012,712
△1,308
53,446
△128,548
△2,860,433
105,462
△53,934
-
6,567
△988,072
△3,790,410
決算短信
(株)植木組 (1867) 2026年3月期
(単位:千円)
前連結会計年度
(自 2024年4月1日
至 2025年3月31日)
投資活動によるキャッシュ・フロー
定期預金の預入による支出
定期預金の払戻による収入
有形固定資産の取得による支出
有形固定資産の売却による収入
無形固定資産の取得による支出
投資有価証券の取得による支出
投資有価証券の売却による収入
その他
投資活動によるキャッシュ・フロー
財務活動によるキャッシュ・フロー
短期借入金の純増減額(△は減少)
長期借入れによる収入
長期借入金の返済による支出
社債の償還による支出
自己株式の取得による支出
配当金の支払額
その他
財務活動によるキャッシュ・フロー
現金及び現金同等物の増減額(△は減少)
現金及び現金同等物の期首残高
現金及び現金同等物の期末残高
当連結会計年度
(自 2025年4月1日
至 2026年3月31日)
△69,640
-
△948,402
63,291
△160,424
△3,930
32,402
3,686
△1,083,017
△1,253
30,000
△1,163,001
27,350
△249,432
△1,007
-
△26,622
△1,383,966
△400,000
2,400,000
△669,346
△27,000
△324
△454,867
△54,981
793,480
2,360,006
3,855,430
6,215,437
3,600,000
100,000
△574,488
△7,000
△61
△590,496
△45,944
2,482,009
△2,692,367
6,215,437
3,523,070
決算短信
(株)植木組 (1867) 2026年3月期
決算短信
(5)連結財務諸表に関する注記事項
(継続企業の前提に関する注記)
該当事項はありません。
(連結財務諸表作成のための基本となる重要な事項)
1.連結の範囲に関する事項
(1)連結子会社
連結子会社数
…11社
主要な連結子会社 …連結子会社名は、北陸施設工業(株)、植木不動産(株)、(株)ユニテック、(株)アスカ、
(株)植木機工、(株)はまなす保険企画、(株)さくら介護サービス、高浜観光開発(株)、(株)村田電気商会、
(株)ワールドスイコー、(株)佐藤建設
(2)非連結子会社
(有)柏崎グリーン 他1社
非連結子会社は小規模会社であり、総資産、売上高、当期純損益(持分に見合う額)及び利益剰余金(持分に
見合う額)等は、いずれも連結財務諸表に重要な影響を及ぼしていないため、連結範囲から除外しておりま
す。
2.持分法の適用に関する事項
(1)持分法適用会社
持分法適用会社はありません。
(2)持分法非適用会社
非連結子会社
…(有)柏崎グリーン
他1社
関連会社
…(株)柏崎マリン開発他2社
(3)持分法を適用しない会社について、その適用しない理由
持分法非適用会社は、それぞれ当期純損益(持分に見合う額)及び利益剰余金(持分に見合う額)等に及ぼす
影響が軽微であり、かつ全体としても重要性がないため、持分法の適用から除外しております。
3.連結子会社の事業年度等に関する事項
連結子会社の事業年度は連結財務諸表提出会社と一致しております。
4.会計方針に関する事項
(1)重要な資産の評価基準及び評価方法
①有価証券の評価基準及び評価方法
満期保有目的債券 …償却原価法(定額法)
その他有価証券
市場価格のない株式等以外のもの
時価法(評価差額は全部純資産直入法により処理し、売却原価は移動平均法により算定)
市場価格のない株式等
移動平均法による原価法
②棚卸資産の評価基準及び評価方法
販売用不動産
…個別法による原価法(貸借対照表価額は収益性の低下に基づく簿価切下げの方法により算定)
商品
…最終仕入原価法による原価法(貸借対照表価額は収益性の低下に基づく簿価切下げの方法により算定)
未成工事支出金
…個別法による原価法
不動産事業支出金
…個別法による原価法(貸借対照表価額は収益性の低下に基づく簿価切下げの方法により算定)
材料貯蔵品
…総平均法による原価法(貸借対照表価額は収益性の低下に基づく簿価切下げの方法により算定)
(株)植木組 (1867) 2026年3月期
決算短信
(2)重要な減価償却資産の減価償却の方法
有形固定資産(リース資産を除く)
植木不動産㈱、㈱さくら介護サービス及び高浜観光開発㈱については定額法を、当社及びその他の連結子会
社については定率法を採用しております。
なお、1998年4月1日以降に取得した建物(建物附属設備を除く)並びに2016年4月1日以降に取得した建
物附属設備及び構築物については定額法によっております。
主な耐用年数は以下のとおりであります。
建物及び構築物
機械装置及び車両運搬具
…8年~50年
…5年~17年
無形固定資産(リース資産を除く)
…定額法
なお、自社利用のソフトウェアについては、社内における利用可能期間(5年)に基づく定額法によって
おります。
リース資産
所有権移転ファイナンス・リース取引に係るリース資産
…自己所有の固定資産に適用する減価償却方法と同一の方法を採用しております。
所有権移転外ファイナンス・リース取引に係るリース資産
…リース期間を耐用年数とし、残存価額を零とする定額法を採用しております。
(3)重要な引当金の計上基準
①貸倒引当金
期末現在に有する債権の貸倒れによる損失に備えるため、一般債権については、貸倒実績率により、貸倒懸念
債権等特定の債権については個別に回収可能性を検討し、回収不能見込額を計上しております。
②賞与引当金
従業員に対して支給する賞与の支出に充てるため、支給見込額に基づき計上しております。
③役員賞与引当金
役員に対して支給する賞与の支出に充てるため、支給見込額に基づき計上しております。
④完成工事補償引当金
完成工事高として計上した工事に係るかし担保費用の支出に充てるため、完成工事高に実績割合を乗じた見積
補償額を計上しております。
⑤工事損失引当金
受注工事の損失発生に備えるため、期末手持ち工事のうち、損失の発生が見込まれ、かつ、金額を合理的に見
積もることのできる工事について損失見込額を計上しております。
⑥役員退職慰労引当金
役員の退職により支給する役員退職慰労金に充てるため、内規に基づく支給限度額を計上しております。
⑦債務保証損失引当金
債務保証に係る損失に備えるため、被保証先の財政状態を勘案し、損失負担見込額を計上しております。
(4)退職給付に係る会計処理の方法
①退職給付見込額の期間帰属方法
退職給付債務の算定にあたり、退職給付見込額を当連結会計年度末までの期間に帰属させる方法については、
給付算定式基準によっております。
②数理計算上の差異及び過去勤務費用の費用処理方法
過去勤務費用については、その発生時における従業員の平均残存勤務期間以内の一定の年数(10年)による定額
法により費用処理しております。
数理計算上の差異は、各連結会計年度の発生時における従業員の平均残存勤務期間以内の一定の年数(10年)
による定額法により按分した額を、それぞれ発生の翌連結会計年度から費用処理することとしております。
③小規模企業等における簡便法の採用
連結子会社は、退職給付に係る負債及び退職給付費用の計算に、退職給付に係る期末自己都合要支給額を退職
給付債務とする方法を用いた簡便法を適用しております。
(株)植木組 (1867) 2026年3月期
決算短信
(5)重要な収益及び費用の計上基準
当社及び連結子会社の顧客との契約から生じる収益に関する主要な事業における主な履行義務の内容及び当
該履行義務を充足する通常の時点(収益を認識する通常の時点)は以下のとおりであります。
完成工事高及び完成工事原価の計上基準
一定の期間にわたり充足される履行義務は、履行義務の充足に係る進捗度を見積り、当該進捗度に基づき
一定の期間にわたり収益を認識しております。進捗度の測定は、各報告期間の期末日までに発生した工事原
価が、予想される工事原価の合計に占める割合に基づいて行っております。また、履行義務の充足に係る進
捗度を合理的に見積ることができないが発生する費用を回収することが見込まれる場合は、原価回収基準に
て収益を認識しております。
(6)重要なヘッジ会計の方法
①ヘッジ会計の方法
金利スワップ取引は、特例処理の要件を満たしているため特例処理によっております。
②ヘッジ手段とヘッジ対象
ヘッジ手段 …金利スワップ
ヘッジ対象 …銀行借入金
③ヘッジ方針
金利関連におけるデリバティブ取引は、借入金の金利変動リスクをヘッジするために金利スワップ取引を行っ
ております。これ以外の投機目的の取引は一切行わないこととしております。
④ヘッジ有効性評価の方法
特例処理による金利スワップについては、有効性の評価を省略しております。
(7)連結キャッシュ・フロー計算書における資金の範囲
手許現金、随時引き出し可能な預金及び取得日から満期日までの期間が3ヶ月以内の定期預金であります。
(連結貸借対照表に関する注記)
※1 非連結子会社及び関連会社に対するものは、次のとおりであります。
前連結会計年度
(2025年3月31日)
投資有価証券(株式)
※2
13,350千円
当連結会計年度
(2026年3月31日)
13,350千円
「土地の再評価に関する法律(平成10年3月31日公布法律第34号)」に基づき事業用土地の再評価を行い、当
該評価差額に係る税金相当額を「再評価に係る繰延税金負債」として負債の部に計上し、これを控除した金額を
「土地再評価差額金」として純資産の部に計上しております。
・再評価の方法…「土地の再評価に関する法律施行令(平成10年3月31日公布政令第119号)」第2条第3
号によるところの固定資産税評価額を基準とする方法及び同条第4号によるところの地価
税法価額(相続税評価額)を基準とする方法に基づき再評価しております。
・再評価を行った年月日…2000年3月31日
前連結会計年度
(2025年3月31日)
再評価を行った土地の期末における時価と
再評価後の帳簿価額との差額
上記差額のうち賃貸等不動産に係るもの
当連結会計年度
(2026年3月31日)
△1,519,351千円
△1,421,861千円
△406,471
△414,178
※3 損失の発生が見込まれる工事契約に係る未成工事支出金と工事損失引当金は、相殺せずに両建てで表示してお
ります。損失の発生が見込まれる工事契約に係る未成工事支出金のうち、工事損失引当金に対応する額は次のと
おりであります。
前連結会計年度
(2025年3月31日)
未成工事支出金
※4
544千円
減価償却累計額には、減損損失累計額が含まれております。
当連結会計年度
(2026年3月31日)
1,025千円
(株)植木組 (1867) 2026年3月期
決算短信
(連結損益計算書に関する注記)
※1
完成工事原価に含まれる研究開発費は、次のとおりであります。
前連結会計年度
(自 2024年4月1日
至 2025年3月31日)
当連結会計年度
(自 2025年4月1日
至 2026年3月31日)
18,211千円
※2
32,911千円
完成工事原価に含まれる工事損失引当金繰入額は、次のとおりであります。
前連結会計年度
(自 2024年4月1日
至 2025年3月31日)
当連結会計年度
(自 2025年4月1日
至 2026年3月31日)
64,466千円
※3
36,267千円
販売費及び一般管理費のうち主要な費目及び金額は、次のとおりであります。
前連結会計年度
(自 2024年4月1日
至 2025年3月31日)
当連結会計年度
(自 2025年4月1日
至 2026年3月31日)
1,303,073千円
189,230
1,373,154千円
292,318
役員賞与引当金繰入額
35,280
44,036
役員退職慰労引当金繰入額
貸倒引当金繰入額
退職給付費用
雑費
2,240
△1,513
24,506
456,477
2,245
45,146
22,312
508,816
従業員給料手当
賞与引当金繰入額
※4
固定資産売却益の内訳は、次のとおりであります。
前連結会計年度
(自 2024年4月1日
至 2025年3月31日)
機械装置
運搬具
計
※5
当連結会計年度
(自 2025年4月1日
至 2026年3月31日)
920千円
2,380
26,644千円
30
3,300
26,675
固定資産除却損の内訳は、次のとおりであります。
前連結会計年度
(自 2024年4月1日
至 2025年3月31日)
当連結会計年度
(自 2025年4月1日
至 2026年3月31日)
建物・構築物
11,570千円
23,222千円
機械装置
3,813
10,606
-
50,450
無形固定資産
その他
計
64
355
15,448
84,634
(株)植木組 (1867) 2026年3月期
※6
決算短信
減損損失
当社グループは、キャッシュ・フローを生み出す最小単位として支店を独立した単位として、不動産事業につ
いてはプロジェクト単位にグルーピングを行い、遊休資産については個別資産ごとにグルーピングを行っており
ます。
当社グループは以下の資産グループについて減損損失を計上しました。
前連結会計年度(自2024年4月1日
場所
至2025年3月31日)
用途
種類
減損損失
新潟県柏崎市
事業用資産
土地・建物等
147,240千円
石川県白山市
事業用資産
土地
23,436千円
新潟県柏崎市
遊休資産
土地
5,154千円
新潟県燕市
事業用資産
機械装置等
4,896千円
合計
180,728千円
当連結会計年度において時価が著しく下落した事業用の土地・建物等及び遊休土地について、帳簿価額を回収
可能価額まで減額し、当該減少額を減損損失として特別損失に計上いたしました。なお、回収可能価額は正味売
却価額により測定しており、正味売却価額は不動産鑑定評価額または近隣取引事例等を基準として算定しており
ます。
当連結会計年度(自2025年4月1日
至2026年3月31日)
場所
用途
種類
減損損失
新潟県柏崎市
事業用資産
土地・建物等
114,604千円
新潟県柏崎市
遊休資産
土地
13,486千円
石川県羽咋郡
遊休資産
土地
795千円
合計
128,886千円
当連結会計年度において時価が著しく下落した事業用の土地・建物等及び遊休土地について、帳簿価額を回収
可能価額まで減額し、当該減少額を減損損失として特別損失に計上いたしました。なお、回収可能価額は正味売
却価額により測定しており、正味売却価額は不動産鑑定評価額または近隣取引事例等を基準として算定しており
ます。
(株)植木組 (1867) 2026年3月期
決算短信
(連結株主資本等変動計算書関係)
前連結会計年度(自
2024年4月1日
至
2025年3月31日)
1.発行済株式の種類及び総数並びに自己株式の種類及び株式数に関する事項
当連結会計年度期首株
式数(株)
当連結会計年度増加株
式数(株)
当連結会計年度減少株
式数(株)
当連結会計年度末株式
数(株)
6,873,528
-
-
6,873,528
375,770
405
63,718
312,457
発行済株式
普通株式
自己株式
普通株式(注)
(注)普通株式の自己株式の株式数の増加のうち、364株は単元未満株式の買取によるものであり、41株は連結子会社に
よる取得によるものです。減少のうち63,333株は譲渡制限付株式報酬としての自己株式の処分によるものであり、
385株は連結子会社による処分によるものです。
2.新株予約権及び自己新株予約権に関する事項
該当事項はありません。
3.配当に関する事項
(1)配当金支払額
株式の種類
(決議)
2024年4月26日
取締役会
配当金の総額
(千円)
1株当たり配当額
(円)
454,867
70
普通株式
基準日
効力発生日
2024年3月31日
2024年6月11日
(2)基準日が当連結会計年度に属する配当のうち、配当の効力発生日が翌連結会計年度となるもの
株式の種類
(決議)
2025年4月30日
取締役会
普通株式
配当金の総額
(千円)
配当の原資
590,496
利益剰余金
1株当たり配当
額(円)
90
基準日
効力発生日
2025年3月31日
2025年6月11日
当連結会計年度(自 2025年4月1日至 2026年3月31日)
1.発行済株式の種類及び総数並びに自己株式の種類及び株式数に関する事項
当連結会計年度期首株
式数(株)
当連結会計年度増加株
式数(株)
当連結会計年度減少株
式数(株)
当連結会計年度末株式
数(株)
6,873,528
-
-
6,873,528
312,457
1,222
15,320
298,359
発行済株式
普通株式
自己株式
普通株式(注)
(注)普通株式の自己株式の株式数の増加1,222株は単元未満株式の買取によるものであり、減少15,320株は譲渡制限付
株式報酬としての自己株式の処分によるものです。
2.新株予約権及び自己新株予約権に関する事項
該当事項はありません。
3.配当に関する事項
(1)配当金支払額
株式の種類
(決議)
2025年4月30日
取締役会
普通株式
配当金の総額
(千円)
1株当たり配当額
(円)
590,496
90
基準日
効力発生日
2025年3月31日
2025年6月11日
(2)基準日が当連結会計年度に属する配当のうち、配当の効力発生日が翌連結会計年度となるもの
(決議)
2026年4月30日
取締役会
株式の種類
普通株式
配当金の総額
(千円)
配当の原資
789,020
利益剰余金
1株当たり配当
額(円)
120
基準日
効力発生日
2026年3月31日
2026年6月10日
(株)植木組 (1867) 2026年3月期
(連結キャッシュ・フロー計算書関係)
※
現金及び現金同等物の期末残高と連結貸借対照表に掲記されている科目の金額との関係
前連結会計年度
(自 2024年4月1日
至 2025年3月31日)
当連結会計年度
(自 2025年4月1日
至 2026年3月31日)
現金預金勘定
6,585,135 千円
3,864,021 千円
預入期間が3か月を超える定期預金
△369,697
△340,951
現金及び現金同等物
6,215,437
3,523,070
決算短信
(株)植木組 (1867) 2026年3月期
決算短信
(セグメント情報等の注記)
【セグメント情報】
1.報告セグメントの概要
当社の報告セグメントは、当社の構成単位のうち分離された財務情報が入手可能であり、取締役会が、経営資源
の配分の決定及び業績を評価するために、定期的に検討を行う対象となっているものであります。
当社は、土木・建築その他建設請負工事を主な内容とした「建設事業」と、不動産の売買・賃貸等を主な内容と
した「不動産事業」、及び、建設資材の製造販売を主な内容とした「建材製造販売事業」を営んでおります。
したがって、当社は、製品・サービス別管理を基礎としたセグメントから構成されており、「建設事業」、「不
動産事業」及び「建材製造販売事業」の3つを報告セグメントとしております。
2.報告セグメントごとの売上高、利益又は損失、資産、負債その他の項目の金額の算定方法
報告されている事業セグメントの会計処理の方法は、「連結財務諸表作成のための基本となる重要な事項」にお
ける記載と概ね同一であります。
報告セグメントの利益は、営業利益ベースの数値であります。
セグメント間の内部収益及び振替高は市場実勢価格に基づいております。
3.報告セグメントごとの売上高、利益又は損失、資産、負債その他の項目の金額に関する情報
前連結会計年度(自 2024年4月1日至 2025年3月31日)
(単位:千円)
報告セグメント
建設事業
不動産
事業
建材製造
販売事業
計
その他
(注)1
合計
調整額
(注)2
連結
財務諸表
計上額
(注)3
売上高
外部顧客への売
44,448,068 2,772,321
上高
セグメント間の
内部売上高又は
57,833
104,512
振替高
計
694,123 47,914,513
30,058
192,404
44,505,902 2,876,834
724,182 48,106,918
セグメント利益
2,256,523
116,246
セグメント資産
29,384,831 9,417,900 1,062,153 39,864,885
309,248
2,682,018
2,789,062 50,703,575
304,172
496,577
3,093,234 51,200,153
292,637
2,974,656
1,966,621 41,831,506
- 50,703,575
△496,577
-
△496,577 50,703,575
△120,766
2,853,889
9,066,230 50,897,737
その他の項目
減価償却費
312,886
187,085
48,544
548,515
112,313
660,829
-
660,829
有形固定資産及
び無形固定資産
の増加額
967,173
95,696
345,552
1,408,422
42,060
1,450,483
-
1,450,483
(注)1.「その他」の区分は、報告セグメントに含まれない事業セグメントであり、ソフトウェアの開発及び販
売、有料老人ホームの運営、ゴルフ場の運営、産業廃棄物処理施設の賃貸事業等を含んでおります。
2.調整額は以下のとおりであります。
(1)セグメント利益の調整額△120,766千円は、セグメント間取引消去であります。
(2)セグメント資産の調整額9,066,230千円は、主に親会社での余資運用資金(現金預金と投資有価証券)で
あります。
3.セグメント利益は、連結財務諸表の営業利益と調整を行っております。
4.減価償却費には長期前払費用が含まれております。
(株)植木組 (1867) 2026年3月期
当連結会計年度(自
2025年4月1日
至
決算短信
2026年3月31日)
(単位:千円)
報告セグメント
建設事業
不動産
事業
建材製造
販売事業
計
その他
(注)1
合計
調整額
(注)2
連結
財務諸表
計上額
(注)3
売上高
外部顧客への売
57,049,374
上高
セグメント間の
内部売上高又は
522,533
振替高
2,426,374
124,007
計
57,571,907
2,550,381
セグメント利益
3,257,562
227,311
セグメント資産
35,308,292 10,195,346
681,401 60,157,150
16,850
663,390
698,251 60,820,541
120,165
3,605,038
920,610 46,424,250
3,132,850 63,290,000
286,065
949,455
3,418,915 64,239,456
244,152
3,849,191
2,304,111 48,728,361
- 63,290,000
△949,455
-
△949,455 63,290,000
△128,087
3,721,103
7,610,487 56,338,848
その他の項目
減価償却費
400,270
190,609
68,490
659,371
101,580
760,951
-
760,951
有形固定資産及
び無形固定資産
の増加額
471,577
169,661
-
641,239
465,885
1,107,125
-
1,107,125
(注)1.「その他」の区分は、報告セグメントに含まれない事業セグメントであり、ソフトウェアの開発及び販
売、有料老人ホームの運営、ゴルフ場の運営、産業廃棄物処理施設の賃貸事業等を含んでおります。
2.調整額は以下のとおりであります。
(1)セグメント利益の調整額△128,087千円は、セグメント間取引消去であります。
(2)セグメント資産の調整額7,610,487千円は、主に親会社での余資運用資金(現金預金と投資有価証券)で
あります。
3.セグメント利益は、連結財務諸表の営業利益と調整を行っております。
4.減価償却費には長期前払費用が含まれております。
(株)植木組 (1867) 2026年3月期
【関連情報】
前連結会計年度(自
2024年4月1日
至
決算短信
2025年3月31日)
1.製品及びサービスごとの情報
セグメント情報に同様の情報を開示しているため、記載を省略しております。
2.地域ごとの情報
(1)売上高
本邦以外の外部顧客への売上高がないため、記載しておりません。
(2)有形固定資産
本邦以外に所在している有形固定資産がないため、記載しておりません。
3.主要な顧客ごとの情報
外部顧客への売上高のうち、連結損益計算書の売上高の10%以上を占める相手先がないため、記載して
おりません。
当連結会計年度(自
2025年4月1日
至
2026年3月31日)
1.製品及びサービスごとの情報
セグメント情報に同様の情報を開示しているため、記載を省略しております。
2.地域ごとの情報
(1)売上高
本邦以外の外部顧客への売上高がないため、記載しておりません。
(2)有形固定資産
本邦以外に所在している有形固定資産がないため、記載しておりません。
3.主要な顧客ごとの情報
外部顧客への売上高のうち、連結損益計算書の売上高の10%以上を占める相手先がないため、記載して
おりません。
【報告セグメントごとの固定資産の減損損失に関する情報】
前連結会計年度(自
2024年4月1日
至
2025年3月31日)
(単位:千円)
減損損失
建設事業
不動産事業
建材製造
販売事業
5,154
23,436
4,896
当連結会計年度(自
2025年4月1日
至
その他
147,240
全社・消去
-
合計
180,728
2026年3月31日)
(単位:千円)
減損損失
建設事業
不動産事業
建材製造
販売事業
3,680
1,753
-
その他
123,452
【報告セグメントごとののれんの償却額及び未償却残高に関する情報】
該当事項はありません。
【報告セグメントごとの負ののれん発生益に関する情報】
該当事項はありません。
全社・消去
-
合計
128,886
(株)植木組 (1867) 2026年3月期
(関連当事者情報)
関連当事者との取引
前連結会計年度(自 2024年4月1日
該当事項はありません。
至
2025年3月31日)
当連結会計年度(自 2025年4月1日
該当事項はありません。
至
2026年3月31日)
(1株当たり情報)
前連結会計年度
(自 2024年4月1日
至 2025年3月31日)
当連結会計年度
(自 2025年4月1日
至 2026年3月31日)
1株当たり純資産額
4,419.87円
4,826.55円
1株当たり当期純利益
297.06円
366.38円
(注)1.潜在株式調整後1株当たり当期純利益については、潜在株式が存在しないため記載しておりません。
2.1株当たり当期純利益の算定上の基礎は、以下のとおりであります。
前連結会計年度
(自 2024年4月1日
至 2025年3月31日)
親会社株主に帰属する当期純利益(千円)
普通株主に帰属しない金額(千円)
普通株式に係る親会社株主に帰属する当期純
利益(千円)
期中平均株式数(千株)
(重要な後発事象)
該当事項はありません。
当連結会計年度
(自 2025年4月1日
至 2026年3月31日)
1,934,620
2,407,315
-
-
1,934,620
2,407,315
6,512
6,570
決算短信
(株)植木組 (1867) 2026年3月期
4.個別財務諸表及び主な注記
(1)貸借対照表
(単位:千円)
前事業年度
(2025年3月31日)
資産の部
流動資産
現金預金
受取手形
電子記録債権
完成工事未収入金
不動産事業未収入金
販売用不動産
未成工事支出金
材料貯蔵品
短期貸付金(純額)
未収入金
立替金
その他
貸倒引当金
流動資産合計
固定資産
有形固定資産
建物
減価償却累計額
建物(純額)
構築物
減価償却累計額
構築物(純額)
機械及び装置
減価償却累計額
機械及び装置(純額)
船舶
減価償却累計額
船舶(純額)
工具器具・備品
減価償却累計額
工具器具・備品(純額)
土地
リース資産
減価償却累計額
リース資産(純額)
建設仮勘定
有形固定資産合計
当事業年度
(2026年3月31日)
5,752,456
29,367
329,057
19,715,318
21,239
3,254
1,199,758
38,955
45,000
427,713
159,344
124,429
△686
27,845,209
2,769,337
2,688
146,738
27,034,255
19,812
-
486,349
39,974
65,000
116,698
330,880
151,980
△6,273
31,157,441
6,639,043
△3,679,576
2,959,466
482,353
△352,105
130,248
2,201,686
△1,773,038
428,647
1,695,118
△1,207,307
487,810
398,373
△191,809
206,563
4,816,780
84,916
△44,160
40,756
-
9,070,274
6,792,811
△3,814,804
2,978,007
460,563
△338,814
121,749
2,067,521
△1,766,344
301,177
1,688,318
△1,289,786
398,531
404,061
△189,598
214,463
4,814,961
92,390
△48,540
43,849
30,739
8,903,479
決算短信
(株)植木組 (1867) 2026年3月期
(単位:千円)
前事業年度
(2025年3月31日)
無形固定資産
投資その他の資産
投資有価証券
関係会社株式
関係会社長期貸付金
長期前払費用
前払年金費用
繰延税金資産
その他
貸倒引当金
投資その他の資産合計
固定資産合計
資産合計
負債の部
流動負債
支払手形
電子記録債務
工事未払金
不動産事業未払金
短期借入金
リース債務
未払金
未払法人税等
未成工事受入金
預り金
賞与引当金
役員賞与引当金
完成工事補償引当金
工事損失引当金
その他
流動負債合計
固定負債
長期借入金
リース債務
再評価に係る繰延税金負債
退職給付引当金
債務保証損失引当金
資産除去債務
繰延税金負債
その他
固定負債合計
負債合計
当事業年度
(2026年3月31日)
255,818
377,219
2,457,314
679,850
5,760,330
46,425
206,753
127,506
151,200
△234,070
9,195,309
18,521,402
46,366,612
3,721,916
679,850
6,328,780
45,012
237,121
-
194,304
△398,522
10,808,463
20,089,162
51,246,603
272,825
1,791,533
4,866,947
6,217
1,866,808
16,466
498,600
391,233
5,195,455
2,168,296
664,270
8,315
17,304
64,217
13,392
17,841,882
89,711
2,137,923
6,967,279
13,709
5,458,458
17,845
213,384
778,920
2,221,793
1,466,299
1,038,867
22,726
30,426
35,242
71,743
20,564,331
1,757,958
43,674
531,693
912,141
229,620
165,551
-
186,005
3,826,644
21,668,527
1,299,500
40,543
531,693
875,842
224,698
166,577
158,793
156,236
3,453,885
24,018,217
決算短信
(株)植木組 (1867) 2026年3月期
(単位:千円)
前事業年度
(2025年3月31日)
純資産の部
株主資本
資本金
資本剰余金
資本準備金
その他資本剰余金
資本剰余金合計
利益剰余金
利益準備金
その他利益剰余金
圧縮記帳積立金
別途積立金
繰越利益剰余金
利益剰余金合計
自己株式
株主資本合計
評価・換算差額等
その他有価証券評価差額金
土地再評価差額金
評価・換算差額等合計
純資産合計
負債純資産合計
当事業年度
(2026年3月31日)
5,315,671
5,315,671
5,359,413
57,300
5,416,713
5,359,413
74,167
5,433,580
670,000
670,000
90,066
1,300,000
11,500,899
13,560,965
△282,114
24,011,235
89,723
1,300,000
13,116,796
15,176,520
△268,357
25,657,414
992,445
△305,595
686,849
24,698,084
46,366,612
1,876,567
△305,595
1,570,971
27,228,386
51,246,603
決算短信
(株)植木組 (1867) 2026年3月期
(2)損益計算書
(単位:千円)
(自
至
売上高
完成工事高
不動産事業売上高
その他の事業売上高
売上高合計
売上原価
完成工事原価
不動産事業売上原価
その他の事業売上原価
売上原価合計
売上総利益
完成工事総利益
不動産事業総利益
その他の事業総利益
売上総利益合計
販売費及び一般管理費
役員報酬
従業員給料手当
賞与引当金繰入額
役員賞与引当金繰入額
株式報酬費用
退職給付費用
法定福利費
福利厚生費
修繕維持費
事務用品費
通信交通費
動力用水光熱費
調査研究費
広告宣伝費
貸倒引当金繰入額
交際費
寄付金
地代家賃
減価償却費
租税公課
事業税
保険料
賃借料
雑費
販売費及び一般管理費合計
営業利益
前事業年度
2024年4月1日
2025年3月31日)
(自
至
当事業年度
2025年4月1日
2026年3月31日)
41,282,595
321,212
1,127,442
42,731,251
55,055,640
229,807
1,376,188
56,661,637
37,433,718
196,279
900,320
38,530,318
49,962,448
141,719
1,132,065
51,236,233
3,848,877
124,933
227,121
4,200,932
5,093,191
88,088
244,122
5,425,403
96,168
775,336
139,599
8,315
28,414
12,834
141,604
12,195
12,224
25,382
108,637
29,154
17,932
27,585
△1,602
44,184
5,899
65,975
63,727
34,327
119,067
8,806
22,274
333,548
2,131,593
2,069,338
114,246
796,607
245,616
22,726
52,657
13,856
142,023
22,065
8,609
25,998
107,958
34,303
32,063
25,735
45,151
42,800
5,327
60,878
90,883
28,667
131,311
9,317
29,346
372,381
2,460,534
2,964,869
決算短信
(株)植木組 (1867) 2026年3月期
(単位:千円)
(自
至
営業外収益
受取利息
受取配当金
補助金収入
雑収入
営業外収益合計
営業外費用
支払利息
支払手数料
貸倒引当金繰入額
雑支出
営業外費用合計
経常利益
特別利益
固定資産売却益
投資有価証券売却益
保険差益
特別利益合計
特別損失
固定資産除却損
投資有価証券評価損
減損損失
その他
特別損失合計
税引前当期純利益
法人税、住民税及び事業税
法人税等調整額
法人税等合計
当期純利益
前事業年度
2024年4月1日
2025年3月31日)
(自
至
当事業年度
2025年4月1日
2026年3月31日)
43,002
307,262
25,951
26,449
402,664
46,046
367,737
-
32,898
446,682
37,812
7,895
157,840
3,293
206,841
2,265,161
55,084
2,625
126,415
15,792
199,917
3,211,634
920
11,252
50,896
63,069
26,644
-
-
26,644
14,199
749
33,487
4,933
53,369
2,274,860
607,743
△6,563
601,180
1,673,680
84,875
-
5,434
-
90,309
3,147,969
1,035,827
△93,908
941,918
2,206,050
決算短信
(株)植木組 (1867) 2026年3月期
決算短信
完成工事原価報告書
(自
至
区分
注記
番号
前事業年度
2024年4月1日
2025年3月31日)
金額(千円)
材料費
(自
至
構成比
(%)
当事業年度
2025年4月1日
2026年3月31日)
構成比
(%)
金額(千円)
7,308,268
19.5
9,450,450
18.9
984,271
2.6
1,228,338
2.5
(689,564)
(1.8)
(889,136)
(1.8)
外注費
22,951,706
61.3
31,397,805
62.8
経費
(うち人件費)
6,189,472
16.6
7,885,854
15.8
(3,001,139)
(8.0)
(3,509,143)
(7.0)
計
37,433,718
100.0
49,962,448
100
労務費
(うち労務外注費)
原価計算の方法
当社の原価計算の方法は、個別原価計算の方法により工事ごとに原価を材料費、労務費、外注費及び経費の
要素別に分類集計しております。集計された工事原価は実績によっておりますが、工事間接費(共通工事経費
及び補助部門費)は工事直接費を基準として、工事原価へ配賦しております。
不動産事業売上原価報告書
(自
至
区分
注記
番号
前事業年度
2024年4月1日
2025年3月31日)
金額(千円)
(自
至
構成比
(%)
当事業年度
2025年4月1日
2026年3月31日)
構成比
(%)
金額(千円)
販売事業
61,231
31.2
217
0.2
賃貸事業
135,048
68.8
141,502
99.8
196,279
100.0
141,719
100
計
原価計算の方法
当社の原価計算の方法は、プロジェクトごとに販売事業と賃貸事業に区別し、個別原価計算の方法により原
価を不動産購入費、工事費及びその他の要素別に分類集計しております。
その他の事業売上原価報告書
(自
至
区分
注記
番号
前事業年度
2024年4月1日
2025年3月31日)
金額(千円)
(自
至
構成比
(%)
当事業年度
2025年4月1日
2026年3月31日)
金額(千円)
構成比
(%)
材料費
352,652
39.2
334,397
29.5
労務費
57,596
6.4
65,714
5.8
外注費
110,979
12.3
168,491
14.9
経費
379,092
42.1
563,463
49.8
900,320
100.0
1,132,065
100
計
原価計算の方法
当社の原価計算の方法は、建材製造販売等の売上原価については総合原価計算の方法により、それ以外の売
(注)
上原価については個別原価計算の方法によっております。
その他の事業売上原価の主なものは、建材製造販売等の売上原価であります。
(株)植木組 (1867) 2026年3月期
(3)株主資本等変動計算書
前事業年度(自 2024年4月1日
至
決算短信
2025年3月31日)
(単位:千円)
株主資本
資本剰余金
その他利益剰余金
資本金
資本準備金
当期首残高
5,315,671
利益剰余金
5,359,413
その他資本資本剰余
剰余金
金合計
18,050
利益準備金
5,377,463
670,000
圧縮記帳
積立金
91,595
繰越利益
別途積立金
剰余金
利益剰余
金合計
1,300,000 10,318,397 12,379,992
当期変動額
圧縮記帳積立金の取崩
△1,529
1,529
-
剰余金の配当
△454,867
△454,867
土地再評価差額金の取崩
△37,839
△37,839
当期純利益
1,673,680
1,673,680
1,182,502
1,180,973
自己株式の取得
自己株式の処分
39,249
39,249
株主資本以外の項目の当
期変動額(純額)
当期変動額合計
当期末残高
-
-
39,249
39,249
-
△1,529
5,315,671
5,359,413
57,300
5,416,713
670,000
90,066
評価・換
算差額等
合計
純資産合計
株主資本
株主資本
合計
土地再評
価差額金
△339,039 22,734,087
790,816
△328,341
自己株式
当期首残高
評価・換算差額等
その他有
価証券評
価差額金
462,475 23,196,563
当期変動額
圧縮記帳積立金の取崩
-
-
剰余金の配当
△454,867
△454,867
土地再評価差額金の取崩
△37,839
△37,839
当期純利益
1,673,680
1,673,680
自己株式の取得
△264
△264
△264
自己株式の処分
57,189
96,438
96,438
株主資本以外の項目の当
期変動額(純額)
当期変動額合計
当期末残高
201,628
22,745
224,373
224,373
1,277,148
201,628
22,745
224,373
1,501,521
△282,114 24,011,235
992,445
△305,595
56,925
686,849 24,698,084
-
1,300,000 11,500,899 13,560,965
(株)植木組 (1867) 2026年3月期
当事業年度(自
2025年4月1日
至
決算短信
2026年3月31日)
(単位:千円)
株主資本
資本剰余金
その他利益剰余金
資本金
資本準備金
当期首残高
5,315,671
利益剰余金
5,359,413
その他資本資本剰余
剰余金
金合計
57,300
利益準備金
5,416,713
670,000
圧縮記帳
積立金
90,066
別途積立金
繰越利益
剰余金
利益剰余
金合計
1,300,000 11,500,899 13,560,965
当期変動額
圧縮記帳積立金の取崩
△342
342
剰余金の配当
△590,496
△590,496
2,206,050
2,206,050
1,615,897
1,615,554
土地再評価差額金の取崩
当期純利益
自己株式の取得
自己株式の処分
16,867
16,867
株主資本以外の項目の当
期変動額(純額)
当期変動額合計
当期末残高
-
-
16,867
16,867
-
△342
5,315,671
5,359,413
74,167
5,433,580
670,000
89,723
評価・換
算差額等
合計
純資産合計
株主資本
株主資本
合計
その他有
価証券評
価差額金
土地再評
価差額金
△282,114 24,011,235
992,445
△305,595
自己株式
当期首残高
評価・換算差額等
686,849 24,698,084
当期変動額
圧縮記帳積立金の取崩
-
剰余金の配当
△590,496
△590,496
2,206,050
2,206,050
土地再評価差額金の取崩
当期純利益
自己株式の取得
△61
△61
△61
自己株式の処分
13,818
30,685
30,685
株主資本以外の項目の当
期変動額(純額)
当期変動額合計
当期末残高
884,122
13,757
1,646,178
884,122
-
△268,357 25,657,414
1,876,567
△305,595
884,122
884,122
884,122
2,530,301
1,570,971 27,228,386
-
1,300,000 13,116,796 15,176,520
(株)植木組 (1867) 2026年3月期
決算短信
5.その他
提出会社単独の建設事業の状況
(単位:百万円)
前
期
(2024.4.1~2025.3.31)
受
注
高
売
上
高
繰
越
高
当
期
(2025.4.1~2026.3.31)
増
減
官公庁
民間
計(A)
構成比
(%)
官公庁
民間
計(B)
構成比
(%)
金額
(B-A)
率
(%)
17,456
10,570
28,027
41.4
16,096
14,930
31,026
54.8
2,999
10.7
建築
8,120
31,555
39,675
58.6
240
25,317
25,558
45.2 △14,117
△35.6
計
25,577
42,125
67,703
100.0
16,337
40,247
56,584
100.0 △11,118
△16.4
構成比(%)
37.8
62.2
100.0
28.9
71.1
100.0
土木
14,040
12,065
26,106
63.2
19,223
11,483
30,706
55.8
4,600
17.6
建築
1,085
14,090
15,176
36.8
1,501
22,848
24,349
44.2
9,172
60.4
計
15,126
26,156
41,282
100.0
20,724
34,331
55,055
100.0
13,773
33.4
37.6
62.4
100.0
43.0
18,723
8,898
27,621
42.5
320
1.2
土木
構成比(%)
36.6
63.4
100.0
土木
21,849
5,451
27,301
建築
7,876
28,318
36,195
57.0
6,616
30,787
37,403
57.5
1,208
3.3
計
29,726
33,769
63,496
100.0
25,339
39,686
65,025
100.0
1,529
2.4
構成比(%)
46.8
53.2
100.0
39.0
61.0
100.0


 ナイアガラと三尺玉

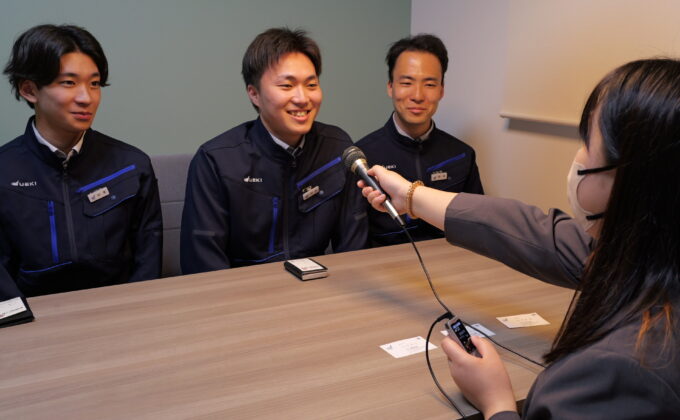
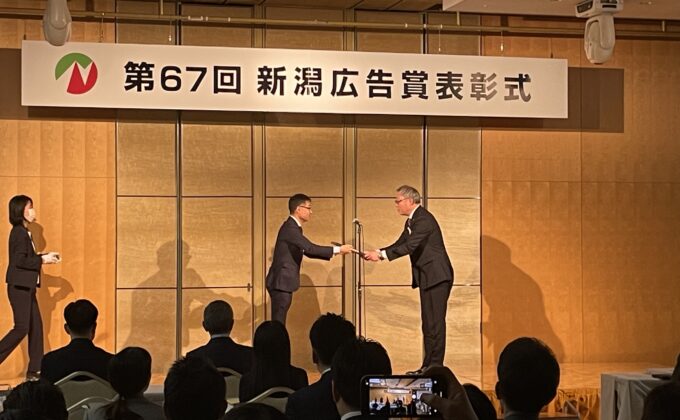 表彰式の様子


 =======================================================================木のぬくもりを感じる室内============
 =======================================================================開放的で自然を感じる執務エリア===============