半期報告書-第104期(2026/04/01-2027/03/31)
Bull 3
Bear 0
Results
1860
Fiscal year ends March
Quarters are offset from the calendar — Q1 is Apr–Jun
|
Toda Corporation is a construction and engineering group operating across building, civil engineering, real estate investment, and environmental energy sectors. The company executes building and civil works domestically and internationally, with overseas operations managed through subsidiaries in the United States, Indonesia, Thailand, Vietnam, and New Zealand. Key business lines include autonomous real estate development and leasing, building equipment installation, and human resources dispatch. In the energy sector, the group develops onshore and floating offshore wind power projects in Brazil and Japan, along with solar power generation and electricity wholesale supply. The company also operates hotel and commercial facility management services and engages in PFI projects. Notable subsidiaries include Sato Kogyo, Showa Construction, and Thai Toda Corporation, which support the core construction and regional expansion activities. Summarised from the annual report, fiscal year ended Mar 2026 |
Industry Engineering & Construction | Homepage toda.co.jp |
| Sector Industrials | IR page toda.co.jp | |
|
Tags
building construction, civil engineering, real estate development, offshore wind power, solar power generation, building equipment, hotel management, pfi projects, bim modeling, human resources dispatch, Tobic Co. Ltd., Japan Wind Farm Construction, Toda Construction Real Estate Investment Advisory, Sato Kogyo, Showa Construction, Apec Engineering, TGC General Service, Toda Road, Toda Building Partners, Toda Finance, Tohwa Kanko Development, TODA Nohbo, Thai Toda Corporation Ltd., Toda Vietnam Co. Ltd., PT Tatamulia Nusantara Indah, Toda America Inc., PT Toda Group Indonesia, Toda Asia Pacific Pte. Ltd., Coherent Hotel Ltd., TODA Investimentos do Brasil Ltda., Goto Floating Wind Power, Goto Floating Wind Farm, Offshore Wind Farm Construction, Floating Wind Aggregation, Toda Solar Energy Fukaya, Toda Solar Sharing, SCC Human Community Service
|
Press page toda.co.jp/ir/news |
Metrics
| Valuation | |
|---|---|
| Market cap | ¥ 455.702B |
| Market cap (USD) | $ 2.848B |
| P/E | 8.83 |
| PEG | 0.18 |
| P/BV | 0.98 |
| P/S | 0.66 |
| P/OCF | 19.48 |
| P/FCF | -41.30 |
| Dividend yield | 4.0% |
| Turnover / mcap | — |
| Returns | |
|---|---|
| ROE | 9.8% |
| ROI | 6.5% |
| ROIC | 5.0% |
| Profit margin | 5.7% |
| Growth | |
|---|---|
| Revenue growing | Yes |
| Profits growing | Yes |
| Revenue up 3y | No |
| Revenue up 5y | No |
| Earnings growth 3y (net profit CAGR) | 49.8% |
| Quality | |
|---|---|
| Profitable | Yes |
| Margin expanding | Yes |
| Buying back stock | Yes |
| Diluting (TTM) | No |
| Debt/Equity | — |
| Podcast bulls (TTM) | Sign up |
| Podcast bears (TTM) | Sign up |
| Podcast sentiment (TTM) | Sign up |
| Podcast sentiment % (TTM) | Sign up |
| News sentiment (TTM) | 61 |
| Quality score | 16.7% |
| Insiders | |
|---|---|
| Buys, 1w | Sign up |
| Buys, 1m | Sign up |
| Buys, 1y | Sign up |
| Sells, 1w | Sign up |
| Sells, 1m | Sign up |
| Sells, 1y | Sign up |
Sign up to see this company's insider trades
| Figure | FY 2026 | FY 2025 | FY 2024 | FY 2023 | FY 2022 | FY 2021 | FY 2020 | FY 2019 | FY 2018 | FY 2017 | FY 2016 | FY 2015 | FY 2014 | FY 2013 |
|---|---|---|---|---|---|---|---|---|---|---|---|---|---|---|
| Revenue | 645.737B | 586.661B | 522.434B | 547.155B | 501.509B | 507.134B | 518.683B | 510.436B | 429.026B | 422.722B | 492.621B | 420.324B | 448.987B | 497.048B |
| Net profit | 36.981B | 25.185B | 16.101B | 10.995B | 18.56B | 19.735B | 25.845B | 25.595B | 25.455B | 42.091B | 20.039B | 14.026B | 10.228B | -65.285B |
| Free cash flow | 34.165B | -37.215B | 5.762B | -68.063B | 5.46B | -48.716B | 58.248B | -51.855B | 10.653B | 48.288B | -12.682B | — | — | — |
| Figure | FY 2026 | FY 2025 | FY 2024 | FY 2023 | FY 2022 | FY 2021 | FY 2020 | FY 2019 | FY 2018 | FY 2017 | FY 2016 | FY 2015 | FY 2014 | FY 2013 |
|---|---|---|---|---|---|---|---|---|---|---|---|---|---|---|
| Share price | 1.448K | 882.01 | 1.022K | 690.98 | 741.09 | 811.04 | 628.97 | 680.11 | 770.72 | 670.41 | 543.96 | 507 | 338.92 | — |
| Price performance 12m | 0.64 | -0.14 | 0.48 | -0.07 | -0.09 | 0.29 | -0.08 | -0.12 | 0.15 | 0.23 | 0.07 | 0.5 | — | — |
Filed figures
Lines the statements and their notes report beside the headline figures, read from the filings' XBRL as filed (no restatement applied), with figures computed from one filing's own lines. Cash-flow lines carry their cash direction: an outflow is negative. Each period links to its filing; a figure's period, report date and tag are in its tooltip.
| Figure | Mar 2017 | Mar 2018 | Mar 2019 | Mar 2020 | Mar 2021 | Mar 2022 | Mar 2023 | Mar 2024 | Mar 2025 | Mar 2026 |
|---|---|---|---|---|---|---|---|---|---|---|
| Balance sheet detail | ||||||||||
| Borrowings, current (JPY) | 29.9B | 25.5B | 79.5B | 49.5B | 68.3B | 95.2B | 86.6B | 74.1B | 80.7B | 62.9B |
| Borrowings, non-current (JPY) | 40.4B | 50B | 52.6B | 62.3B | 82.7B | 84.2B | 125B | 152B | 175B | 167B |
| Bonds payable (JPY) | 10B | 20B | 25B | 35.1B | 50.1B | 60.4B | 55.2B | 63.2B | 73.2B | 63.1B |
| Cash and deposits (JPY) | 66.4B | 80.6B | 97.5B | 106B | 95B | 121B | 96.8B | 114B | 83B | 66.7B |
| Intangible assets (JPY) | 6.88B | 8.94B | 7.96B | 8.5B | 9.48B | 12B | 12.1B | 12.9B | 13.7B | 11.9B |
| Net debt (borrowings + leases - cash) (JPY) | 3.89B | -5.12B | 34.6B | 5.35B | 56B | 58.9B | 115B | 113B | 173B | 163B |
| Cash flow detail | ||||||||||
| Operating cash flow (JPY) | 58.9B | 19.3B | -28.4B | 77.3B | -21.1B | 27.3B | -30.8B | 62.1B | 26.4B | 62.5B |
| Purchases of property, plant and equipment (JPY) | -10.6B | -6.79B | -22.6B | -19B | -25.7B | -21.8B | -35.9B | -55.1B | -62.4B | -27.2B |
| Purchases of intangible assets (JPY) | -1.12B | -1.89B | -883M | -1.31B | -1.84B | -2.51B | -1.34B | -1.31B | -1.18B | -1.07B |
| Change in receivables (cash effect) (JPY) | 78.1B | -2.27B | -90.4B | 62.3B | -46.2B | 1.63B | -57.4B | 61.9B | -46.4B | 2.51B |
| Change in payables (cash effect) (JPY) | -49.3B | -11.8B | 25.8B | -10.5B | 8.98B | -16.3B | 7.13B | -15.1B | -6.12B | 12B |
| Dividends paid (cash effect) (JPY) | -3.07B | -4.61B | -6.14B | -6.14B | -7.99B | -9.22B | -9.14B | -8.6B | -8.68B | -10.8B |
| Share buybacks (cash effect) (JPY) | -16M | -2.53B | -5M | -1M | 0.00 | -1M | 0.00 | -5.01B | -5B | -7B |
| Interest paid (cash effect) (JPY) | -862M | -810M | -775M | -1.01B | -953M | -853M | -916M | -1.3B | -2.08B | -2.51B |
| Income taxes paid (cash effect) (JPY) | -3.93B | -4.88B | -5.62B | -15.8B | -9.01B | -11.5B | -10.4B | -8.76B | -9.61B | -15.9B |
| Operating cash flow before change in receivables (JPY) | -19.2B | 21.6B | 62B | 14.9B | 25.1B | 25.6B | 26.6B | 213M | 72.8B | 60B |
| Free cash flow (OCF - PPE - intangibles) (JPY) | 47.2B | 10.7B | -51.9B | 56.9B | -48.7B | 2.95B | -68.1B | 5.76B | -37.2B | 34.2B |
| Income detail | ||||||||||
| Research and development expense (JPY) | 1.14B | 1.42B | 1.68B | 2.18B | 2.72B | 2.8B | 3.22B | 3.89B | 3.03B | 5.13B |
| ↳ 5y CAGR | +21.0% | +19.8% | +17.8% | +18.3% | +6.8% | +13.5% | ||||
| Total comprehensive income (JPY) | 52.1B | 29.7B | 26.1B | 10.5B | 47B | 14.6B | 8.99B | 45.9B | 7.19B | 65.8B |
| Comprehensive income to owners (JPY) | 51.9B | 29.5B | 25.9B | 10.3B | 47.1B | 14.7B | 8.65B | 44.8B | 6.58B | 65.3B |
| Provision for credit losses (JPY) | -520M | 45M | 497M | -255M | 264M | -175M | 336M | -356M | 497M | 31M |
| Segments | ||||||||||
| Domestic Associate Companies · Segment revenue (JPY) | 35.1B | 33.9B | 45.1B | 52.3B | 55.8B | 45.2B | 52.4B | 53.8B | 58.2B | 67.9B |
| ↳ YoY growth | -3.5% | +33.1% | +15.9% | +6.8% | -19.0% | +15.9% | +2.6% | +8.3% | +16.6% | |
| Domestic Associate Companies · Segment operating income (JPY) | 1.44B | 883M | 1.58B | 2.01B | 2.28B | 1.91B | 1.97B | 1.93B | 3.16B | 2.78B |
| Domestic Building Construction · Segment revenue (JPY) | 294B | 281B | 360B | 349B | — | — | — | — | — | — |
| ↳ YoY growth | -4.2% | +28.0% | -3.2% | |||||||
| Domestic Building Construction · Segment operating income (JPY) | 19.3B | 17.9B | 25.5B | 20.8B | — | — | — | — | — | — |
| Domestic Civil Engineering · Segment revenue (JPY) | 98.7B | 109B | 100B | 114B | — | — | — | — | — | — |
| ↳ YoY growth | +10.8% | -8.3% | +13.5% | |||||||
| Domestic Civil Engineering · Segment operating income (JPY) | 4.26B | 11.8B | 11.2B | 10.6B | — | — | — | — | — | — |
| Domestic Real Estate Investment And Development Business · Segment revenue (JPY) | — | — | — | — | — | 21.5B | 19.5B | 23.3B | 47.7B | 33.4B |
| ↳ YoY growth | -9.3% | +19.4% | +104.9% | -29.9% | ||||||
| Domestic Real Estate Investment And Development Business · Segment operating income (JPY) | — | — | — | — | — | 4.06B | 3.26B | 3.94B | 4.76B | 2.06B |
| Environment Energy · Segment revenue (JPY) | — | — | — | — | — | 687M | 1.54B | 1.37B | 933M | 3.37B |
| ↳ YoY growth | +124.3% | -10.8% | -32.1% | +261.5% | ||||||
| Environment Energy · Segment operating income (JPY) | — | — | — | — | — | -897M | 124M | -445M | -1.05B | -1.28B |
| New Business Domains · Segment revenue (JPY) | — | 192M | 212M | 346M | 2.01B | 2.98B | — | — | — | — |
| ↳ YoY growth | +10.4% | +63.2% | +479.8% | +48.7% | ||||||
| New Business Domains · Segment operating income (JPY) | — | -337M | -883M | -1.16B | -1.03B | -263M | — | — | — | — |
| Overseas Associate Companies · Segment revenue (JPY) | — | — | — | — | — | — | 38B | 48.9B | 57.4B | 67.7B |
| ↳ YoY growth | +28.7% | +17.6% | +17.9% | |||||||
| Overseas Associate Companies · Segment operating income (JPY) | — | — | — | — | — | — | 1.92B | 1.48B | 1.17B | 5.62B |
| Overseas Business · Segment revenue (JPY) | — | 13.9B | 17.8B | 18.3B | — | — | — | — | — | — |
| ↳ YoY growth | +28.2% | +3.1% | ||||||||
| Overseas Business · Segment operating income (JPY) | — | -1.18B | -4.03B | -21M | — | — | — | — | — | — |
| Overseas Investment Development · Segment revenue (JPY) | — | — | — | — | — | 2.28B | 26.4B | — | — | — |
| ↳ YoY growth | +1,056.5% | |||||||||
| Overseas Investment Development · Segment operating income (JPY) | — | — | — | — | — | 705M | 1.74B | — | — | — |
| Real Estate Investment And Development Business · Segment revenue (JPY) | 6.18B | 6.63B | 10.8B | 14.4B | 13B | 21.5B | — | — | — | — |
| ↳ YoY growth | +7.2% | +62.3% | +34.1% | -9.7% | +64.9% | |||||
| Real Estate Investment And Development Business · Segment operating income (JPY) | 1.52B | 1.58B | 1.87B | 3.96B | 4.21B | 4.13B | — | — | — | — |
| Reported | Jun 29, 2018 | Jun 28, 2019 | Jun 28, 2019 | Jul 10, 2020 | Jun 30, 2021 | Jun 30, 2023 | Jun 27, 2024 | Jun 27, 2024 | Jun 25, 2025 | Jun 22, 2026 |
Sign up to see institutional holdings
Sign UpPodcast Mentions
Sign up to see podcast mentions and sentiment
Sign UpFilings with EDINET (periodic reports, extraordinary reports, offerings, holding and buy-back reports), newest first, titles as filed in Japanese. The link opens the filing on EDINET. Press releases from the company's own website, newest first.
浅層改良と深層改良の併用型地盤改良工法を開発・適用
Bull 1
Bear 0
Product/operations
軟弱地盤が厚い場合でも合理的な土間スラブを実現しコスト低減に貢献
2026.11.06
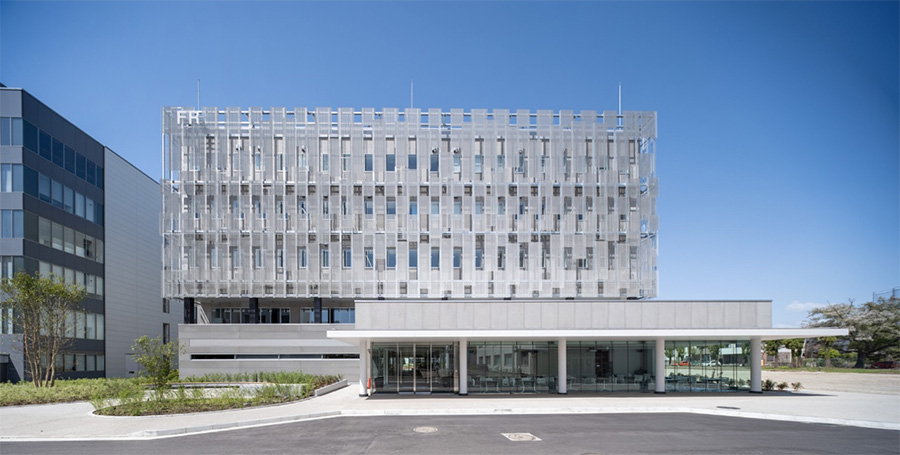
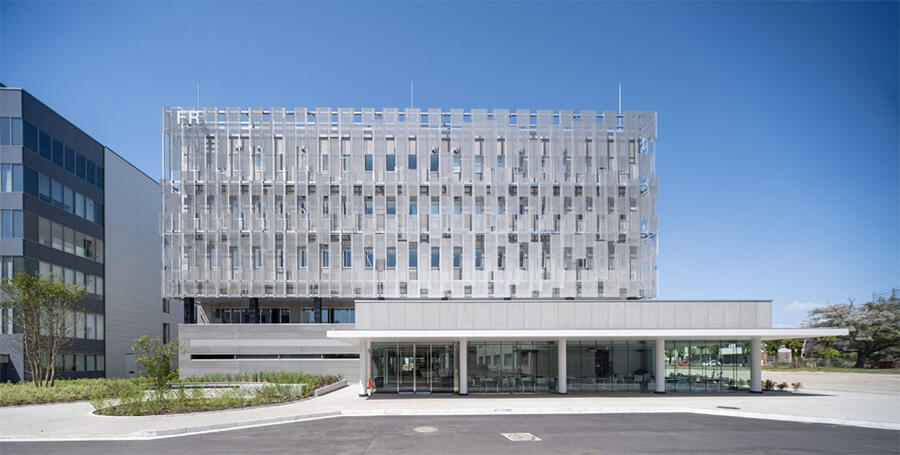
戸田建設(株)(本社:東京都中央区、社長:大谷 清介)は、軟弱地盤における土間スラブの沈下対策として、地盤の表層部分を全面的に改良する浅層混合処理工法(以下、浅層改良)と、地中に円柱状の改良体を造成する深層混合処理工法(以下、深層改良)を併用した地盤改良工法(以下、本技術)を、筑波技術研究所で建設中の新たな実験施設「(仮称)構造材料棟」に適用しました。
当該敷地は地表付近から軟弱層が厚く分布しています。建物本体は杭基礎で支持されているため沈下するおそれはありませんが、地盤で支持される1階の土間スラブ※1には、沈下やひび割れが生じる懸念がありました。
そこで、本技術を採用することにより、構造スラブ※2や深層改良のみで地盤改良する場合に比べて、コストを抑えながら、土間スラブの沈下量の低減とひび割れの抑制を可能にしました。
-
※1
地盤の上に直接設け、地盤で支えるコンクリートの床
-
※2
土間スラブのように地盤で支持するのではなく、柱や梁で支えるコンクリートの床
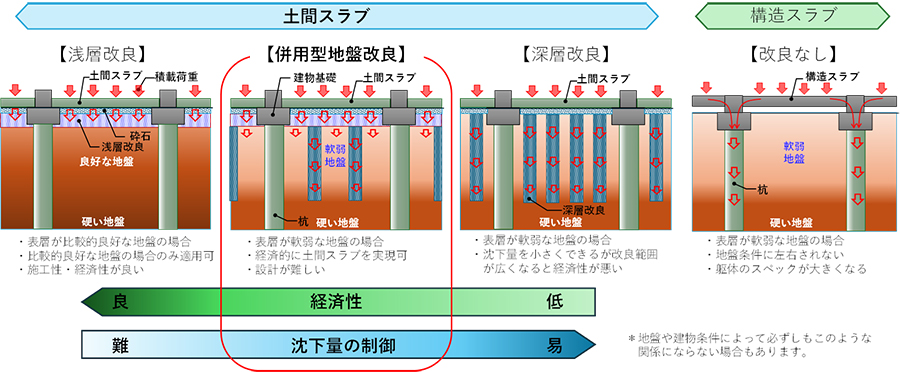
図-1 土間下改良地盤の比較イメージ
開発の背景
土間スラブは、地盤の上に設けるコンクリート床です。床にかかる荷重を主に土間下の地盤で支持するため、地盤条件によっては、梁などで支持する構造スラブに比べて床構造を合理化でき、施工性・経済性に優れた床構造として活用されています。
一方、土間スラブの採用は地盤条件に大きく左右されます。表層地盤は埋土や盛土で構成されることが多く、軟弱な場合も少なくありません。軟弱層が浅い場合は浅層改良で対応できますが、軟弱層が厚い場合や少し深いところに存在する場合には、浅層改良だけでは沈下を抑えることが難しくなります。このような場合には、土間下全面の深層改良や構造スラブを用いることになりますが、コストの増加が課題となります。
今回、本技術を用いることで、土間スラブの合理的な採用を実現し、深層改良のみで地盤改良する場合と比べて地盤改良にかかるコストを約40%削減しました。
本技術の概要
本技術は、杭基礎で支持された建物の土間スラブを対象とし、全面的に浅層改良した地盤と、その直下に設けた深層改良によって、土間スラブに作用する荷重を支持する構造です。土間スラブに作用する荷重は均一ではなく、積載荷重の大きいところや小さいところ、フォークリフトの走行範囲などにより変化します。本技術では、土間スラブに作用した荷重を浅層改良部分で分散し、効率よく深層改良へ伝達することで、軟弱地盤※3にかかる荷重を減らし、沈下を抑止します。
-
※3
すべての軟弱地盤に適用できるわけではありません。特に液状化地盤や圧密地盤に対しては慎重な検討が必要です。
本技術の特徴
-
1
模型実験と三次元解析による検証
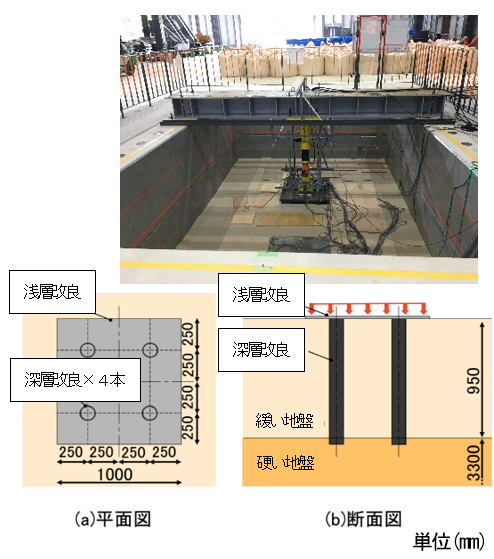
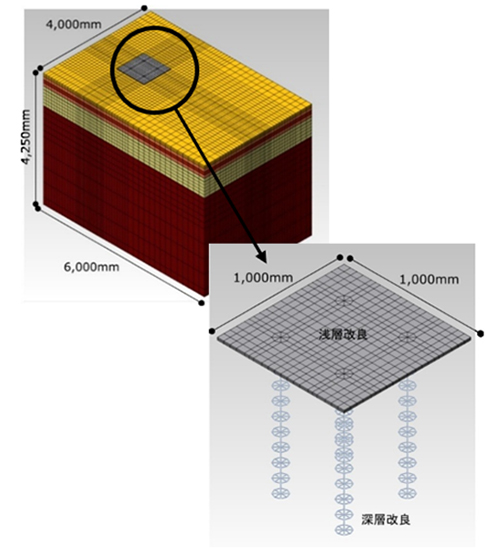
併用型地盤改良の有効性を確認するため、当社が保有する大型実験土槽を用いて模型実験を行いました。さらに、三次元非線形有限要素法を用いたシミュレーション解析の結果を実験結果と比較・検証し、解析手法の有効性も確認しました。
-
図-2 実験土槽による模型実験の様子
-
図-3 シミュレーション解析
-
2
複雑な荷重分担メカニズムに応じた最適設計
土間スラブから伝わる荷重は、浅層改良部分で分散され、その直下にある深層改良体と軟弱地盤に伝達されます。このとき、荷重は軟弱地盤よりも変形しにくい深層改良体に伝わりやすくなります。そのため、深層改良体の本数が多いほど、軟弱地盤が負担する荷重は減り、土間スラブの沈下量も小さくなります。
一方、深層改良体の本数を増やすと、コストも高くなります。沈下の抑制と経済性を両立するには、目標とする沈下量を満たすよう、深層改良体の本数と配置を適切に設計する必要があります。
ただし、荷重が浅層改良部分で分散される範囲は、土間スラブのコンクリート厚、浅層改良の厚さ、軟弱地盤の変形しにくさによって変わります。また、深層改良体と軟弱地盤が荷重を負担する割合も、浅層改良部分、深層改良体、軟弱地盤それぞれの変形しにくさに左右されます。そのため、強度だけでなく、各部の変形しにくさと荷重の伝わり方を総合的に検討することが重要です。
当社では、実験と解析を通じて荷重の分散・伝達の仕組みを把握し、その結果を土間スラブの設計に反映することで、深層改良体の本数を抑えた低コストで合理的な土間スラブを実現できます。
今後の展開
当社は今後、軟弱地盤上に建設される物流倉庫や工場など、土間スラブが計画される施設への本工法の適用拡大を目指してまいります。













 INVESTOR RELATIONS


 SUSTAINABILITY
 RECRUIT採用情報






Prompts
Click prompts to add them under the company line, click again to take one out, then copy the result into your AI chat. Shared by Asian Century Stocks and Uncovered Thai Stocks. Thank you.
Toda Corporation (ticker 1860), listed in Japan.
Copied
ETFs Holding Toda Corporation
Exchange-traded funds whose newest published daily portfolio holds one of the company's listings, largest weight first.
| ETF | Weight in ETF | Shares | Market value | As of |
|---|---|---|---|---|
| AVDV | 0.11% | 2,218,200 | $ 21.626M | Nov 16, 2026 |
| DISV | 0.10% | 578,100 | $ 5.322M | Nov 12, 2026 |
| AVDS | 0.08% | 28,500 | $ 277.861K | Nov 16, 2026 |
| DFIS | 0.05% | 341,200 | $ 3.141M | Nov 12, 2026 |
| DXIV | 0.04% | 9,300 | $ 85.614K | Nov 12, 2026 |
| DFSI | 0.02% | 30,400 | $ 279.855K | Nov 12, 2026 |
| DFIC | 0.02% | 390,300 | $ 3.593M | Nov 12, 2026 |
| DFAX | 0.01% | 140,500 | $ 1.293M | Nov 12, 2026 |
| AVDE | 0.01% | 183,500 | $ 1.789M | Nov 16, 2026 |
| DFAI | 0.01% | 187,400 | $ 1.725M | Nov 12, 2026 |