~ログミーFinance ✕ コエキク~ 個人投資家様向け 会社説明会 東証プライム市場 1852 2026年10月24日 目次 1 2 会社概要 会社概要 p.4 事業概要 p.7~ 沿革 p.5 業績推移(連結) p.11 創業理念 p.6 TOPICS p.25 中期3ヵ年計画における取組み 中期3ヵ年計画のテーマ…
~ログミーFinance ✕ コエキク~
個人投資家様向け
会社説明会
東証プライム市場
1852
2026年10月24日
目次
1
2
会社概要
- 会社概要
p.4
- 事業概要
p.7~
- 沿革
p.5
- 業績推移(連結)
p.11
- 創業理念
p.6
- TOPICS
p.25
中期3ヵ年計画における取組み
- 中期3ヵ年計画のテーマ p.13
- テーマ毎の取り組み
3
p.14~
業績・株主還元
- 2025年度実績 - 業績ハイライト(連結)
2025年度実績 - 受注の内訳(単体)~官庁/民間別
p.27
p.28
- 2026年度第1四半期実績・進捗(連結)
p.29
- 中期3ヵ年計画業績計画(連結)
p.30
- 株主還元 ①配当金額・配当性向推移
p.31
Appendix
②自己株式の取得・消却
p.32
③株価騰落率・PBR推移
p.33
p.34~
© 2026 Asanuma Corporation.
2
1
会社概要
© 2026 Asanuma Corporation.
3
1 会社概要
- 会社概要
*1
商号
株式会社淺沼組
代表者名
代表取締役社長浅沼誠
創業
1892(明治25年) 1月 20日
会社設立
1937(昭和12年) 6月 15日
資本金
96億 1476万円
従業員数
連結:1,806名個別:1,264名
主な
関連会社
• 淺沼建物株式会社
• SINGAPORE PAINTS & CONTRACTOR
PTE.LTD.
• EVERGREEN ENGINEERING & CONSTRUCTION
PTE. LTD
• ASANUMA CONSTRUCTION LTD.,
INTERNATIONAL
【以下はPFI事業*3】
• 宇都宮郷の森斎場株式会社
• 桜井給食ファシリティーズ 株式会社
• 小田原斎場PFI 株式会社
• 長泉ハイトラスト 株式会社
*2
*1 連結ベース
*2 2026年1月20日時点
*3 公共施設等の建設、運営および維持管理等を民間の資金、経営能力及び技術的能力を活用して行う事業手法
© 2026 Asanuma Corporation.
4
1 会社概要
- 沿革
江
戸
1692
(元禄5)
5代将軍徳川綱吉公の大老柳澤吉保が武蔵国川越城を賜り、
“城持ち大名”となった際に、初代淺沼仁左衛門が普請方を
務める
1724
(享保9)
大名柳澤吉里の甲府から大和郡山への転封に際し、初代
淺沼仁左衛門も普請方として随伴
以降、初代淺沼仁左衛門から8代目の淺沼幸吉まで、
大和郡山藩の普請方を務める
明治維新後、淺沼幸吉は大和郡山にとどまり、大工の棟梁
として奈良付近の名刹社寺の造営や修繕、学校の建築など
に従事する
1892
(明治25)
創業
淺沼幸吉が、現在の奈良県大和郡山市に建築請負業の看板
を揚げ、「淺沼組」を創業
1926
(大正15)
大阪へ進出
1937
(昭和12)
会社設立
株式会社淺沼組を設立
社員数62名
1939
(昭和14)
東京・名古屋へ進出
1963
(昭和38)
株式上場(大証二部)
1969
(昭和44)
大証一部への指定替えを経て東証一部へ上場
明
治
大
正
昭
和
■ 大阪万博プレスセンター(1969年)
■ パラオ 西太平洋戦没者の碑(1985年)
1977
完工高が1,000億円を超える
(昭和52)
平
成
■ 奈良県立畝傍中学校(1896年)
1992
(平成4)
創業100周年
2021
(令和3)
建物の価値を高める淺沼組リニューアル事業ブランド
『ReQuality』を立ち上げ
■ 株式会社設立時から創業100周年まで
使用していた社章
ロゴの導入、企業コンセプト刷新
創業130年にあたり、環境と健康を強く意識しつつ、
「空間の質」「生活の質」を再構築する弊社独自技術の提案・採用を推進
令
和
2022
(令和4)
創業130周年
東証プライム市場に移行
2025
(令和7)
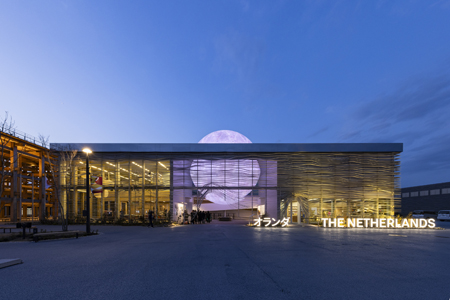
日本国際博覧会(大阪・関西万博)開催
当社はオランダパビリオン建設を担当
2026
(令和8)
TOPIX採用ルールの変更
当社は引き続きTOPIX構成銘柄に採用
■ 京都大学稲盛財団記念館(2008年)
第51回BCS賞受賞
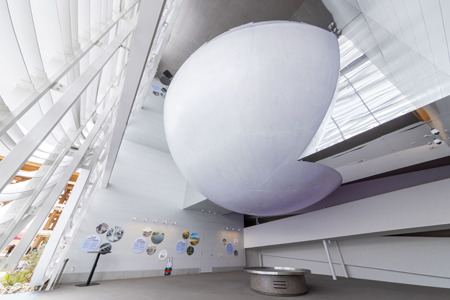
■ 大阪・関西万博 オランダパビリオン(2025年)
© 2026 Asanuma Corporation.
5
1 会社概要
- 創業理念
淺沼組の創業理念は、創業者である淺沼幸吉の「仕事が仕事を生む」という事業に対する信念を実現するために創業以来
変わることなく受け継がれてきたものです。この信念は、立派な仕事をすることで会社の信用が生まれ、その信用こそが次
ぎの仕事をいただく最大の資本になるという信念を意味することばです。
© 2026 Asanuma Corporation.
6
1 会社概要
- 事業概要(国内) *1
2025年日本国際博覧会オランダパビリオン(大阪府)2025
センコー東大阪第2PDセンター(大阪府)2025
▍事業ポートフォリオの内訳
完成工事高(単体)
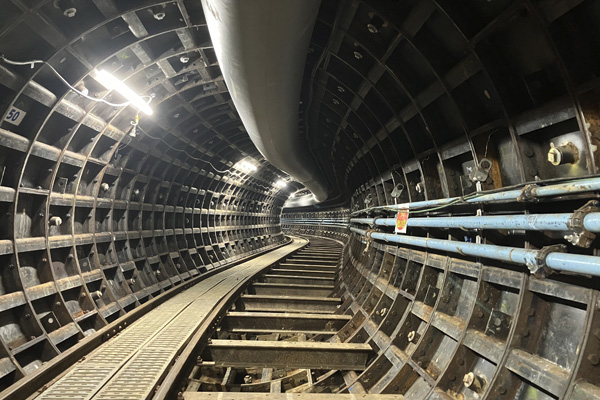
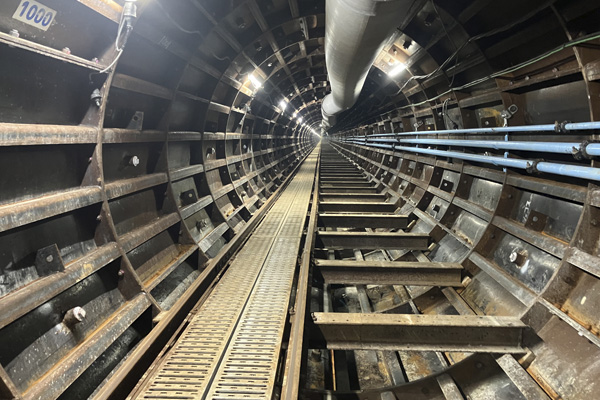
東村山市萩山町三丁目地内から小平市天神町三丁
目地内間導水管用トンネル築造(東京都)2025
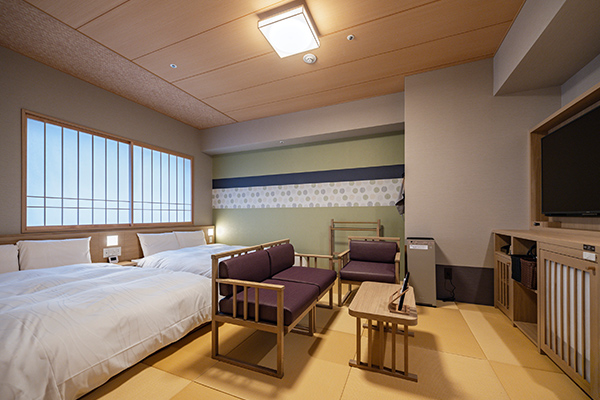
Osaka Metro なんばビル(大阪府)2024
▍事業別完成工事高
(百万円)
2024年度
2025年度
建築事業
134,318
130,144
土木事業
20,957
27,964
その他
445
488
合計
155,720
158,596
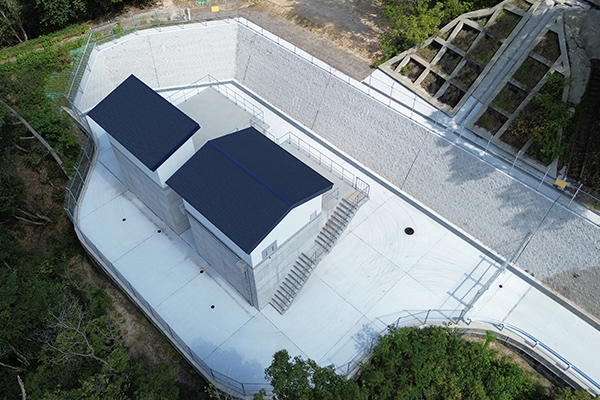
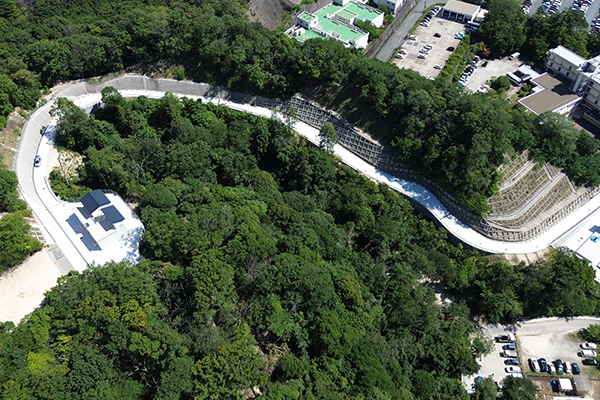
新東名秦野調整池(神奈川県)2024
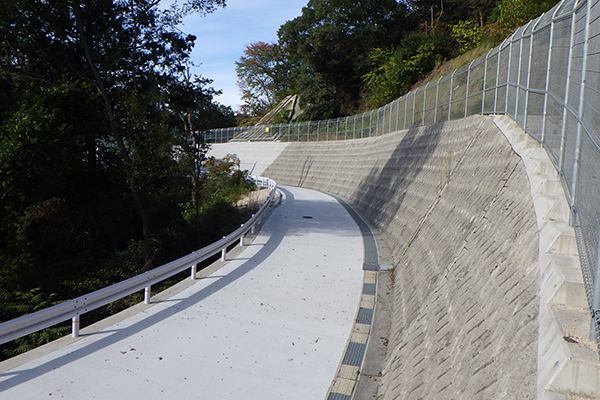
楠葉取水場取水施設耐震改良(大阪府)2023
*1 グアム営業所の完成工事高217百万円も含まれておりますが、それ以外は国内の建築となります
© 2026 Asanuma Corporation.
7
1 会社概要
- 事業概要 ①建築事業(国内) *1
倉庫・物流施設、工場、医療・福祉施設、住宅、教育機関、事務所・庁舎、
店舗、宿泊・娯楽施設などさまざまな新築工事、淺沼組オリジナルブラン
ド「ReQuality」事業、耐震や免振といった防災技術やZEB/ZEHなど
の省エネルギー関連技術を含めた環境配慮技術、建物の寿命を伸ばす
長寿命化技術などの提案・採用を推進しています。
ASANUMA品質の確保と向上で顧客満足を高め、施策により品質強化
に取り組みます。また、リニューアルではReQualityを推進し、環境技
術でエコフレンドリーASANUMA21に貢献します。
2025年日本国際博覧会オランダパビリオン(大阪府)2025
*1 グアム営業所の完成工事高217百万円も含まれておりますが、それ以外は国内の建築となります
© 2026 Asanuma Corporation.
8
1 会社概要
- 事業概要 ②土木事業(国内)
中期3ヵ年計画(2024-2026)の2年目にあたる2025年度は、「創業
140年に向けた土木事業本部のありたい姿検討委員会」を毎月開催し、部
門長が課題解決に向けた活発な議論を重ねました。そこで得られた対策は
速やかに計画へ反映し実行するとともに、その効果も確認しました。特に
新卒採用・キャリア採用・離職防止など土木独自のリクルート施策において
大きく前進しました。
今後も良質なインフラの提供を通じて国民の安全・安心な暮らしを支え、す
べてのステークホルダーから信頼・信用される企業を目指してまいります。
圏央道鬼怒川橋下部(茨城県)2022
© 2026 Asanuma Corporation.
9
1 会社概要
- 事業概要 ③海外事業
淺沼組の海外事業は、1976年のグアム進出を起点に、ミクロネシアから
ASEANへと事業領域を拡大し、50年にわたり成長を続けてきました。現在
はグアムとシンガポールを拠点に、建築を中心として修繕、塗装、設備、ビル
メンテナンスなど幅広い事業を展開しています。2026年6月には
「T3 International」が加わり、シンガポールでグループ3社体制を構築し、
さらなる事業基盤の強化を実現しました。
50周年を迎えた今、培った技術力と信頼を基盤に、グアム事業とシンガポー
ル事業の成長を推進し、海外事業をグループの成長を支える柱として発展さ
せるべく、全員一丸となって挑戦を続けてまいります。
Costa Rhu 外壁再塗装工事
▍SINGAPORE シンガポール
SINGAPORE PAINTS & CONTRACTOR PTE. LTD.
EVERGREEN ENGINEERING & CONSTRUCTION PTE. LTD.
建物塗装・修繕工事請負業
設備工事業、建物メンテナンス業
資本金:100万SGD 出資比率:100%
資本金:450万SGD 出資比率:100%
2023年度
実績
(損益)
2024年度
実績
単位:百万円
2025年度
実績
前期比 %
売上高
3,358
3,758
2,896
営業利益
392
284
経常利益
397
307
当期純利益
333
255
2023年度
実績
(貸借)
総資産
2,558
2024年度
実績
(損益)
2024年度
実績
2025年度
実績
単位:百万円
前期比 %
△22.9
売上高
6,426
6,708
12,968
+93.3
167
△41.3
営業利益
1,638
895
1,467
+63.8
165
△46.3
経常利益
1,753
1,058
1,606
+51.8
132
△48.0
当期純利益
1,449
891
1,340
+50.4
2025年度
実績
2,521
2023年度
実績
前期比 %
2023年度
実績
(貸借)
2024年度
実績
2025年度
実績
前期比 %
2,796
ー
総資産
4,979
6,800
8,963
-
有利子負債
135
0
0
ー
有利子負債
-
-
-
-
純資産
958
1,294
1,352
ー
純資産
3,833
5,047
6,150
-
T3 International Pte. Ltd.」の株式を取得(子会社化)
2026.05.19開示
「ASEAN地域におけるリニューアル事業の強化」施策の一つとして、シンガ
ポールで建物の外壁・内壁等塗装事業を展開しているT3社を子会社化
▍GUAM グアム
Asanuma Corporation グアム営業所
建築土木請負
© 2026 Asanuma Corporation.
10
1 会社概要
- 業績推移(連結)
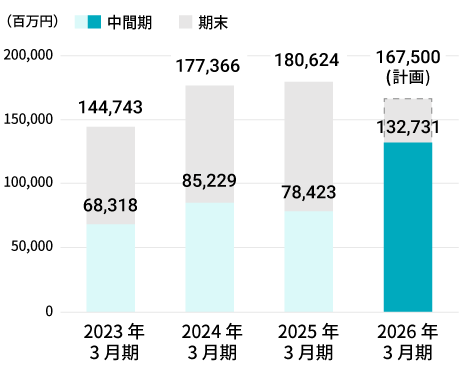
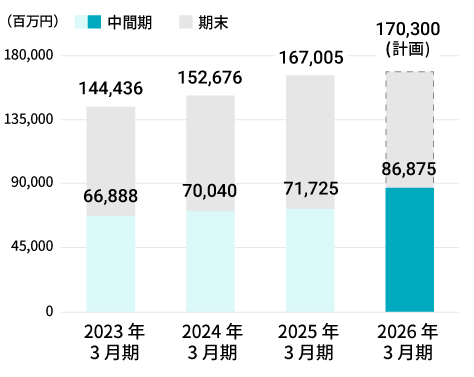
売上高
営業利益(額・率)
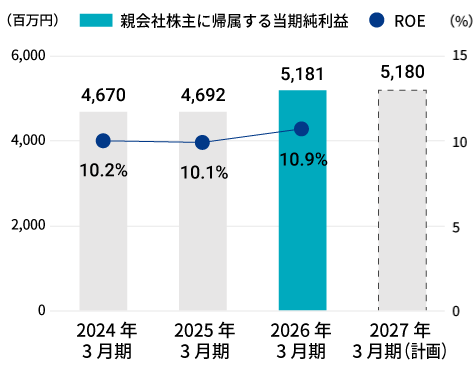
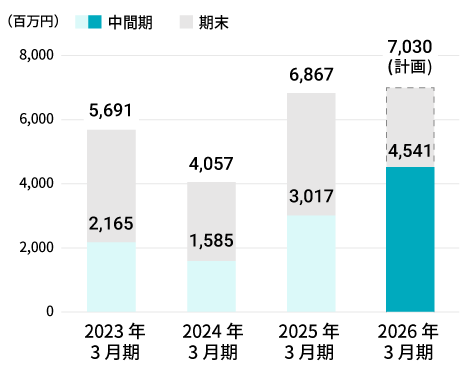
親会社株主に帰属する当期純利益・ROE
純資産・自己資本比率
© 2026 Asanuma Corporation.
11
2
中期3ヵ年計画における取組み
© 2026 Asanuma Corporation.
12
2 中期3ヵ年計画における取組み
- 中期3ヵ年計画のテーマ
⚫ 3ヵ年で注力することとして、6つのテーマを選定
より活力ある
組織となるために
前中期3ヵ年計画にて
旗揚げ・強化した
国内・海外リニューアル事業の
レベルアップ
建築*1・土木事業の
より戦略的・効率的な
展開を図る
2
3
人材の
獲得・確保・育成
国内建設業界を
取り巻く環境
• 高齢化・人材不足
4
• 長期的な
建設投資の減少
快適・効率的な
業務の実現
DX推進
リニューアル事業
の強化
5
ガバナンス・
コンプライアンス・
リスク管理の
強化
1
国内コア事業の
強化
6
環境・社会への
貢献
• サステナビリティ経営の
要請の高まり
全ての
ステークホルダーに
安心していただくために
自然・社会の
一員として
長期ビジョン*2
創業理念
「顧客・協力会社、株主、社員の満足度の向上、
および地球環境・社会への貢献に邁進する企業」
「和の精神」「誠意・熱意・創意」
*1 主に建築(新築)を指す
*2 創業140年時点(2031年度(2032年1月20日))でありたい姿。2024年4月より長期ビジョン・理念・方針などを修正
© 2026 Asanuma Corporation.
13
2 中期3ヵ年計画における取組み
2.テーマ毎の取り組み (1/6)
テーマ
主な取り組み
(3年間で注力すること)
建築事業 : 戦略的受注活動および現場の生産性向上強化に資する取り組みの実施
• 選別受注の高度化・強化
受注時利益率や作業所の4週8閉所の実現、施工体制の確保等の諸条件を加味した案件に限定
また、受注工事種別や官庁/民間比率等の目標ポートフォリオを設定することで、収益性と事業の安定性
を両立した受注活動を展開
収益性・施工性 や 技術力等をバランスよく
1
国内コア事業
の強化
施工効率が高い
技術者の育成、技術力の向上・伝承
S(鉄骨)造工場・倉庫等
RC(鉄筋コンクリート)造住宅、学校、病院等
• 建物ライフサイクルに沿った提案力の強化
竣工後の建物管理・アフターメンテナンス機能の強化を目的とした組織再編を実施し、
「GOOD CYCLE SERVICE部」を新設
建物劣化診断を起点とした提案により、大手メーカー様等との新規取引・受注につながるパイプラインを構築
• 協力会社を含めた現場の生産性向上に資するDX施策の推進 [建築・土木横断]
現場社員および協力会社が利用する複数のシステム(労務安全管理・入門管理・作業日誌・作業間調整等)
を1つのプラットフォーム(「建設サイト・シリーズ」)に集約するプロジェクトを推進しており、2026年度
上期に移行完了。当該基盤へのAI活用も視野に入れ、段階的な現場DXを推進中
協力会社との連携のさらなる強化へ
© 2026 Asanuma Corporation.
14
2 中期3ヵ年計画における取組み
2.テーマ毎の取り組み (1/6)
テーマ
主な取り組み
(3年間で注力すること)
土木事業 : 組織改編・組織風土改革も含めた抜本的改革の実施
• 受注力強化を目的とした組織改編・人員強化
技術設計および工務(積算部署)の全国統括部署を設置し、全国の情報を一元化
総合評価案件情報を集約し提案を作成する部署を新設
• 受注増を見越し、土木部門独自にリクルーター機能を強化
新卒採用に加え、中途採用および離職率低減に向けた施策も強化。結果、採用人数も大幅増
• 作業所支援体制拡充によるDX技術の向上
作業所支援部署の人員を増強し、まずは3D技術の現場への導入を主軸に技術支援を推進
今後は3D技術に留まらず、現場負担軽減と施工の高度化に資する支援を実施予定
1
国内コア事業
の強化
地中の可視化
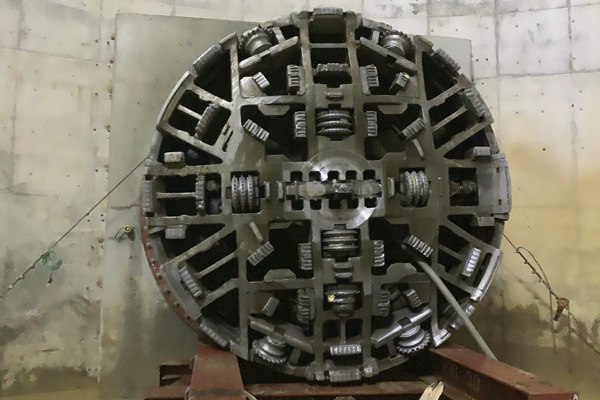
シールドマシン カッターヘッド補修
中期3ヵ年計画の施策
• 作業所業務支援体制の強化
• 品質確保・向上に向けた仕組みの強化
• 注力・得意分野の追求と開拓
• 協力会社との協働強化
© 2026 Asanuma Corporation.
15
2 中期3ヵ年計画における取組み
2.テーマ毎の取り組み (1/6)
テーマ
主な取り組み
(3年間で注力すること)
• 2025年度実績 - 受注の内訳(単体) ~用途別(建築・土木)
その他
工場
上下水道
6%
5%
9%
住宅
15%
宿泊
16%
建築事業
主な受注工事
土木事業
治山治水
13%
造成
土木
17%
15%
国内コア事業
の強化
27%
12%
建築
83%
鉄道
事務所
1
道路
28%
11%
8%
電線路
倉庫
教育研究
その他
18%
17%
倉庫
(仮称)DPLつくば中央Ⅱ 新築工事
宿泊
(仮称)大阪IRプロジェクト ブロックB本体建物工事
電線路
日高市上鹿山地内供給管路工事
治山治水
令和7-11年度山鳥坂ダム本体建設工事(第1期)工事
中期3ヵ年計画の施策
• 作業所業務支援体制の強化
• 品質確保・向上に向けた仕組みの強化
• 注力・得意分野の追求と開拓
• 協力会社との協働強化
© 2026 Asanuma Corporation.
16
2 中期3ヵ年計画における取組み
2.テーマ毎の取り組み (2/6)
テーマ
主な取り組み
(3年間で注力すること)
中長期的な人口減少・物価上昇を背
景に、コスト優位性からも中規模ビル
の改修増を見込む
CO2削減等の環境保全に寄与
省エネ・脱炭素対応技術提案
モノを長く使い続けることの価値へ
建物を利用しながらの工事や建築当初
の図面がない等、高難易度柔軟対応や
付加価値提案等の現場力、追加工事。
工期が短いため、建設資材や労務費の
価格変動による影響を抑えやすい
50000
建築物ストック統計(非住宅建築物)
40000
1990年以前に竣工した建築物のストックが多
く全体の約半数に。
今後これらの改修需要が増える見込み
30000
20000
2
10000
リニューアル事業
の強化
単位 0
:万㎡
建築物ストック統計(2022年9月7日公表)より/国土交通省
1950以前
~1960年
~1970年
~1980年
~1990年
~2000年
◆ 環境配慮型、人の健康促進に寄与、
デザイン性が高い提案が可能
~2010年
~2017年
◆ 大手が手掛けない中規模案件が多く、
柔軟な対応力を持つ当社に優位
付加価値の高い提案
案件サイズ
◆ 既存建物や仕上げ材等を撤去・解体した際の状況判断力・対応力が必要
リニューアル専業会社ではなくゼネコンが故に、構造に関する内容も含めた総合的な視点での対応が可能
◆ 「(建物利用者の)居ながら工事」も多いため、リニューアル独特の技術を要する場面が多い
(例:外周部からの補強する構法、工程の細分化、騒音・粉塵対策等)
◆ 技術研究所を有しており、技術力での対応が可能
対応力・技術力
© 2026 Asanuma Corporation.
17
2 中期3ヵ年計画における取組み
2.テーマ毎の取り組み (2/6)
テーマ
主な取り組み
(3年間で注力すること)
国内リニューアル
(単位:百万円)
2
リニューアル事業
の強化
海外リニューアル(リニューアル子会社2社業績)
2023年度 2024年度
2025年度
2023年度 2024年度
(単位:百万円)
2025年度
実績
実績
実績
受注高
9,344
11,290
8,958 ▲2,332
売上高
9,785
9,679 11,559 +1,879
▲84
完成工事利益
2,607
2,020
2,439
+418
17.3
+2.0P
率
26.6
20.9
21.1
+0.2
2,265
▲46
営業利益*1
1,683
798
1,285
+486
実績
実績
実績
前期比
受注高
34,743
17,285 27,403 +10,118
売上高
19,887
24,193 20,953 ▲3,239
完成工事利益
2,312
3,763
3,618
率
11.6
15.3
営業利益
1,115
2,311
前期比
受注は大口案件もあり堅調推移。2024年度受注が2023
年度比減少した影響により、2025年度の売上が2024年
度比減少したが、複数大型工事の竣工により利益率は上昇
受注はEvergreenの2024年度超大口受注の剥落により
前期比減。Evergreenの業績が牽引し増収増益
国内リニューアル 完工高 ポートフォリオ
「ASEAN地域におけるリニューアル事業の強化」施策の一
つとして、シンガポールで建物の外壁・内壁等塗装事業を
展開しているT3社の株式を取得、子会社化
その他
13%
「T3 International Pte. Ltd.」子会社化
T3 International Pte. Ltd.
工場
宿泊 8%
建物の外壁・内壁等塗装事業
資本金:50万SGD
25%
(損益)
事務所 10%
住宅 13%
2022/12期
実績
2023/12期
実績
2024/12期
実績
1,586
1,767
売上高
1,699
教育研究
営業利益
303
191
126
18%
当期純利益
276
166
108
2022/12期
実績
2023/12期
実績
2024/12期
実績
総資産
713
848
984
純資産
556
714
761
店舗・娯楽
13%
(貸借)
参考:換算レート 1 SGD=123.74円(2026年3月末レート)
*1 のれんを差し引いた金額。KPIの値の構成要素としての海外リニューアル営業利益は、のれんを差し引いた数値を用いているため
© 2026 Asanuma Corporation.
18
2 中期3ヵ年計画における取組み
2.テーマ毎の取り組み (2/6)
テーマ
主な取り組み
(3年間で注力すること)
• 環境配慮技術によるGOOD CYCLE BUILDING
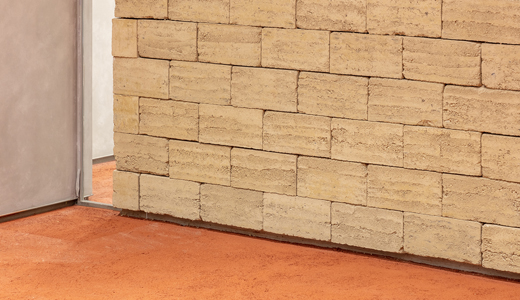
土や木材などの自然素材を積極的に現代の建築に取り入れていくことで、脱炭素、SDGsへの貢献を図
るだけでなく、デザイン性や付加価値を向上できるよう、研究中
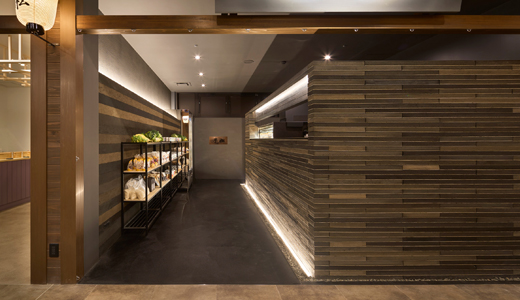
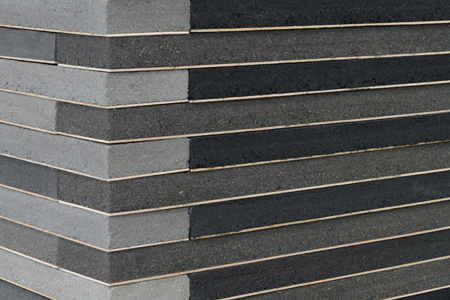
その一環として開発した「還土(かんつち)ブロック」「立体木摺土壁」が特許*1を取得
2
還土ブロック
リニューアル事業
の強化
立体木摺土壁
現場発生土の新たな利活用を図る
名古屋支店1階応接室
千客万来2階「芋松」店舗
*1 還土ブロック(特許:7676190、7676191)、立体木摺土壁(特許:7723873)
© 2026 Asanuma Corporation.
19
2 中期3ヵ年計画における取組み
2.テーマ毎の取り組み (2/6)
テーマ
主な取り組み
(3年間で注力すること)
• 「還土ブロック」が土EXPO2025 OSAKAで「土とみどりのイノベーションアワード」
資源循環部門を受賞
• 「立体木摺土壁」を取り入れた店舗が「2025 年グッドデザイン賞」を受賞
• 「立体木摺土壁」がJID AWARD 2025のNEXTAGE部門において金賞を受賞
2
リニューアル事業
の強化
千客万来2階「芋松」店舗
中期3ヵ年計画の施策
• リニューアル事業ブランド
「ReQuality」の強化
• ASEAN地域のリニューアル事業の強化
• 自然素材による技術研究所ZEB改修
• リニューアル関連技術の実用化・促進
(高度な建物劣化診断技術等)
© 2026 Asanuma Corporation.
20
2 中期3ヵ年計画における取組み
2.テーマ毎の取り組み (3/6)
テーマ
主な取り組み
(3年間で注力すること)
平均勤続年数
21.8
年 (
ゼネコン大手22社平均勤続年数ランキング*1
22社平均勤続年数 17.4年
• 【獲得】
初任給を30万円に引き上げ
人材確保強化に向け、4年連続の賃上げも実施
各種福利厚生の充実化
1位
)
新卒+中途採用
2023
2024
2025
目標
65人
65人
75人
実績*2
31人
56人
87人
2023
2024
2025
実績
実績
実績
2.8%
2.8%
2.9%
奨学金返還支援制度の導入、団体3大疾病保障保険の導入(保険料は当社負担)
• 【確保】
離職予防ツール(HR OnBoard)を導入
天気スタンプ回答型ウェブアンケートツール
離職リスクの可視化と予防を実施
(土木部門は新入社員のみならず若手社員にも実施)
3
人材の
獲得・確保・育成
離職率
(定年退職者を除く)
• 【育成】研修の充実化
新入社員研修の長期化・充実化
通常の新入社員向けの研修に加え、資格取得のための研修プログラムを実施(2026年度からは1ヵ月延長)
キャリア形成を促す研修の新設
主体的成長を志向する風土を醸成することを目的とし導入(2025年度は対象者を限定しトライアル実施)
中期3ヵ年計画の施策
• 採用施策の強化
• 作業所の労働環境の改善、閉所の推進
• 多用な人材の確保(女性、外国籍、高年齢者等)
• 研修内容の見直し、強化
• 休暇取得・残業縮減の推進
• 当社のブランディング・PRの強化
*1 2026年3月31日時点
*2 次年度4月1日入社の新卒採用者数を含んでおります
© 2026 Asanuma Corporation.
21
2 中期3ヵ年計画における取組み
2.テーマ毎の取り組み (4/6)
テーマ
主な取り組み
(3年間で注力すること)
• 全社員を対象としたDX研修を実施
DXリテラシーの向上と意識改革を目的にDX人材育
成サービス「SIGNATE Cloud」の研修「DX リテラ
シー人材育成プログラム」を導入
DX推進人材を育成し、社内変革の基盤を構築
今後も業務効率化・生産性向上・持続可能な
経営基盤の確立に向け、DXをさらに推進する
• 経済産業省が定める「DX認定事業者*1」の認定を取得
DX
4
DX推進
中期3ヵ年計画の施策
• DX推進体制の強化
• 施工・品質・安全管理におけるDX推進
• 管理業務・社内業務におけるDX推進
• 先進IT技術実現に向けた情報収集・試行
(RXコンソーシアム*2での活動)
• BIM・CIM*3の更なる活用
*1 DX認定事業者とは、デジタル技術による社会変革に対して経営者に求められる事項をとりまとめた「デジタルガバナンス・コード」に対応し、DX推進体制が整備されている企業を国が認定する制度。2025年3月1日付けで取得。
*2 施工段階で必要となるロボット技術やIoT関連アプリケーション等の技術の共同開発、既開発技術の共同利用、情報提供・発信をする組織。正会員29社、協力会員262社からなる(2025年5月21日現在)
*3 Building Information Modeling、Construction Information Modeling。3次元建物モデルに属性情報を持たせたもの。企画・設計・施工・維持管理等にて一貫して使用可能
© 2026 Asanuma Corporation.
22
2 中期3ヵ年計画における取組み
2.テーマ毎の取り組み (5/6)
テーマ
主な取り組み
(3年間で注力すること)
• 【ガバナンスの強化】
政策保有株式の銘柄数減少
上場株式の純資産比率
1 銘柄削減
14.0%
• 【コンプライアンスの強化】
全役職員を対象にコンプライアンス・ITセキュリティ研修をeラーニングも用いて実施
• 【リスク管理の強化】
実効性のあるBCP(事業継続計画)運用
BCPに特化したコンサルティング会社と連携し、BCPマニュアルを作成
情報セキュリティ体制の強化
5
ガバナンス・
コンプライアンス・
リスク管理の強化
人権デュー・ディリジェンス実施中
2022年7月に「淺沼組人権方針」を策定
2026年度に、協力会社に対し定期的なアンケート調査を実施
遵守状況の確認と人権リスクの予防・軽減を図ってまいります
外国人労働者の安全教育対策
協力会社と協働で、5か国語に対応した安全教育マニュアルを作成
中期3ヵ年計画の施策
• ガバナンスの更なる強化(海外子会社含む)
• 安全対策の強化(高年齢労働者)、意識の向上
• 株主・投資家とのコミュニケーションの強化
• 情報セキュリティの体制・システムの強化、
意識の向上
• コンプライアンスへの対応、意識の向上
© 2026 Asanuma Corporation.
23
2 中期3ヵ年計画における取組み
2.テーマ毎の取り組み (6/6)
テーマ
主な取り組み
(3年間で注力すること)
• SBT1認定の取得に向け、第三者保証を取得
2025年度のGHG(温室効果ガス)排出量算定結果について第三者保証取得2
淺沼組の温室効果ガス削減目標がSBT認定を取得
• 作業所仮設電気・自社ビル3拠点(技術研究所、名古屋支店、東北支店)に
CO2削減へ
「再生可能エネルギー100%電力」を導入
建設現場でのCO2削減目標と実績 (SBT認定に伴い基準年度を変更)
6
環境・社会への
貢献
(Scope1+2)
25
2025年度実績
▲17.4%(2023年度比)
総量:20,666 t-CO2
2035年度目標
▲63.0%(2023年度比)
20
総量:9,256 t-CO2
15
10
25.0
21.6 20.6 21.1
▲15.8%(2023年度比)
5
0
2026年度目標
9.3
総量:21,077 t-CO2
2023 2024 2025 2026
年度
年度年度
年度
2030
年度
2035
年度
(Scope3)
30
SBT認定基準年度
総量:25,017 t-CO2
CO2排出量総量削減率 スコープ3 カテゴリ11
CO2排出量(千t-CO2)
SBT認定基準 2023年度
総量:999,942 t-CO2
2025年度実績
4.6%
▲
(2023年度比)
954,227 t-CO2
2026年度目標
9.4%
▲
(2023年度比)
906,197 t-CO2
2035年度目標
37.5%
▲
(2023年度比)
624,964 t-CO2
中期3ヵ年計画の施策
• 環境配慮・循環・健康に関する取り組みの推進
• SBT認定の取得
• 環境配慮等の高付加価値な設計・資材等の提案
• ZEB・ZEH推進基盤の整備・強化
• 建築技術における健康科学の検証と展開
*1 SBTとは「Science Based Targets」の略であり、パリ協定が求める⽔準と整合した、5年〜10年先を⽬標年として企業が設定する、温室効果ガス排出削減⽬標のこと(出展: 環境省HP)。外部機関による認証を取得(2025/11/24)
*2 ソコテック・サーティフィケーション・ジャパン株式会社による第三者保証を取得
© 2026 Asanuma Corporation.
24
2 中期3ヵ年計画における取組み
3.TOPICS
当社のブランディング・PRの強化
相葉雅紀さん主演映画
『4アウト-もう一度、プレイボール-』に協賛
2026 年 11 月 6 日(金)に全国公開
原
作
「
4
ア
ウ
ト
-
あ
る
障
害
者
野
球
チ
ー
ム
の
挑
戦
」
書
影
2018 年より「日本身体障害者野球連盟」への協賛を通じ、身体障害者野球を継続的に支援してきました
同競技のさらなる発展を通じて、障がいの有無に関わらず誰もが情熱を持って挑戦し共に輝ける社会の実現を目指し、社会貢献に邁進してまいります
『4アウト-もう一度、プレイボール-』公式サイト https://4out-movie.com/ (外部サイトへ遷移します) © 2026 Asanuma Corporation. 25
3
業績・株主還元
© 2026 Asanuma Corporation.
26
3 業績・株主還元
- 2025年度実績 - 業績ハイライト(連結)
⚫ 受注・売上・利益ともに前期比増加。2月10日開示の修正計画はわずかに未達であるものの、期初計画は達成
結果、配当は期初計画41.5円/株より45.0円/株に増配予定(+3.5円/株)
⚫ ROE・ ROIC共に前期比・計画比増。それぞれ株主資本コスト5.1%および資本コスト(WACC)4.5%*1を上回る水準
2024年度
2025年度
実績
期初計画
修正計画*2
実績
受注高
180,624
151,500
197,500
217,155
売上高
167,005
170,300
174,600
17,991
18,320
10.8%
販管費
営業利益
(単位:百万円)
期初計画比(%)
修正計画比(%)
+20.2
+43.3
+10.0
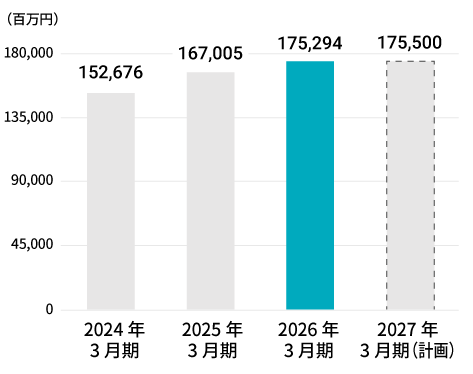
175,294
+5.0
+2.9
+0.4
19,940
19,592
+8.9
+6.9
△1.7
10.8%
11.4%
11.2%
+0.4P
+0.4P
△0.2P
11,124
11,290
12,390
12,380
+11.3
+9.7
△0.1
6,867
7,030
7,550
7,211
+5.0
+2.6
△4.5
4.1%
4.1%
4.3%
4.1%
0.0P
0.0P
△0.2P
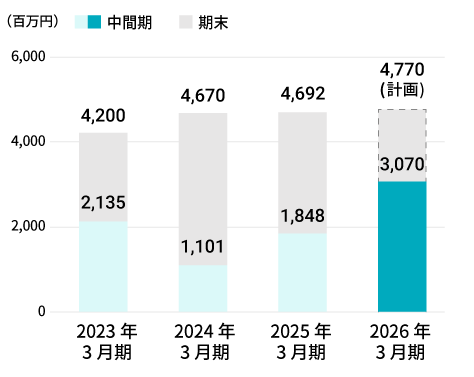
4,692
4,770
5,000
5,181
+10.4
+8.6
+3.6
純資産*3
45,708
47,000
48,200
49,759
+8.9
+5.9
+3.2
繰越工事高
199,833
-
-
245,891
+23.0
-
-
ROE
10.1%
10.3%
10.6%
10.9%
+0.8P
+0.6P
+0.3P
ROIC
7.1%
7.2%
7.6%
7.8%
+0.7P
+0.6P
+0.2P
配当性向
70.4%
70.1%
70.1%
70.0%
△0.4P
△0.1P
△0.1P
年間配当(額)*4
41.0円
41.5円
43.5円
45.0円
+4.0円
+3.5円
+1.5円
連結
売上総利益
同率
同率
親会社株主に帰属
する当期純利益
*1 2026年3月末時点。CAPMにて算出
*2 2026年2月10日開示の修正後の数値を記載
*3 非支配株主持分除く
前期比(%)
*4 2024年度より中間配当制度を導入
© 2026 Asanuma Corporation.
27
3 業績・株主還元
- 2025年度実績 – 受注の内訳(単体) ~官庁/民間別
⚫ 単体(国内*1)の受注高は前年同期比大幅増(+23.0%)
⚫ 建築分野においては、注力分野である官庁の受注が前期比で増加(+40.4%)
⚫ 土木分野においては、大型受注もあり民間の受注が前期比大幅増加(+226.8%)
2024年度
実績
実績
169,334
208,197
+23.0
官庁
41,934
47,378
+13.0
民間
127,400
160,818
+26.2
143,828
172,786
+20.1
官庁
22,381
31,428
+40.4
民間
121,446
141,357
+16.4
25,506
35,410
+38.8
官庁
19,552
15,949
△18.4
民間
5,954
19,460
+226.8
(単位:百万円)
建築・土木計
建築
国内
(当社単体)
2025年度
土木
9%
前期比(%)
15%
8%
13%
12%
3%
72%
68%
外側:2025年度
内側:2024年度
建築官庁
海外子会社
11,289
8,957
△20.7
建築民間
土木官庁
連
結
180,624
217,155
+20.2
土木民間
*1 グアムの数値も含まれるが、99%以上が国内案件。次頁以降同様
© 2026 Asanuma Corporation.
28
3 業績・株主還元
- 2026年度第1四半期実績・進捗(連結)
⚫ 第1四半期は、売上高を除き、受注高・各利益ともに前年同期を上回り、繰越工事高も着実に積み上がる良好な進捗
⚫ 受注高・・・国内建築における事務所(データセンター)や教育研究施設等の大型工事の受注により、前年同期比+10,119百万円(同+18.0%)と好調に推移
⚫ 売上高・・・国内建築において前年同期における大型工事(倉庫)完工の反動があり、前年同期比△5,337百万円(同△12.5%)
⚫ 利益・・・売上高は減少したものの、完成工事利益率が前年同期比+2.5P改善し、売上総利益額は前年同期比+416百万円(同+10.4%)
また、貸倒引当金繰入額等の減少による販管費の減少も相まって、営業利益・経常利益・四半期純利益ともに前年同期比大幅増
2025年度
実績
2026年度
計画
1Q 実績
1Q 実績
受注高
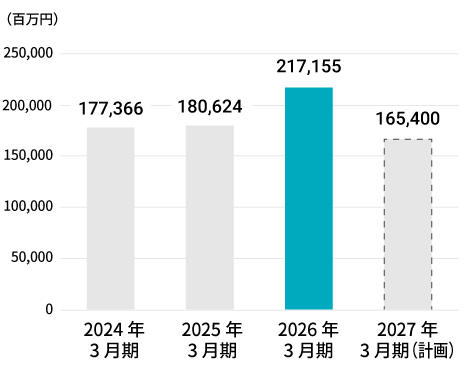
217,155
56,122
37.0
165,400
66,241
売上高
175,294
42,707
25.1
175,500
売上総利益
19,592
4,005
21.9
同率
11.2%
9.4%
販管費
12,380
営業利益
前期比
(%)
40.0
+10,119
+18.0
37,369
21.3
△5,337
△12.5
20,260
4,421
21.8
+416
+10.4
-
11.5%
11.8%
-
+2.4P
-
2,893
25.6
12,480
2,734
21.9
△159
△5.5
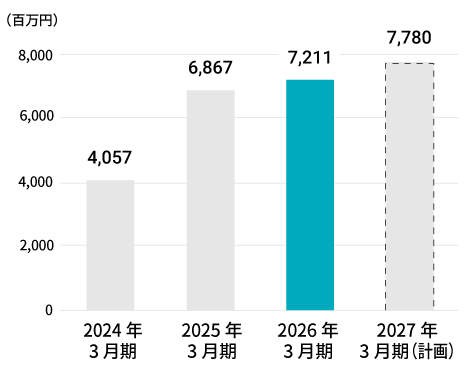
7,211
1,112
15.8
7,780
1,687
21.7
+575
+51.7
4.1%
2.6%
-
4.4%
4.5%
-
+1.9P
-
5,181
712
14.9
5,180
1,138
22.0
+426
+59.8
純資産*1
49,759
44,225
-
51,200
48,504
-
+4,278
+9.7
繰越工事高
245,891
213,617
-
-
275,729
-
+62,112
+29.1
ROE
10.9%
-
-
10.3%
-
-
-
ROIC
7.8%
-
-
8.0%
-
-
-
配当性向
70.0%
-
-
70.1%
-
-
-
配当(額)
45.0円*2
-
-
45.0円*3
-
-
-
(単位:百万円)
連結
同率
親会社株主に帰属
する四半期純利益
進捗(%)
*1 非支配株主持分除く *2 2024年度より中間配当制度を導入。2025年度は配当金額45.0円の内、第2四半期末に16.0円の中間配当を実施
*3 2026年度は配当予想金額45.0円の内、第2四半期末に17.0円の中間配当を実施予定
進捗(%)
© 2026 Asanuma Corporation.
29
3 業績・株主還元
- 中期3ヵ年計画業績計画(連結)
⚫ 2026年度計画は、2025年度対比受注は減少なるも、売上・利益・配当は概ね横ばい。2023年度比では増収・増益・増配の計画
⚫ 引き続き資本効率を意識した経営を行い、PBRは1倍以上を維持
2023年度実績
前中期3ヵ年計画
最終年度
(単位:百万円)
2024年度実績
中期3ヵ年計画
1年目
2025年度実績
中期3ヵ年計画
2年目
2026年度計画
中期3ヵ年計画
3年目
2026年度計画の補足
(2025年度比)
•
一層の「選別受注」を推進。また景気の不
透明感やIR(統合型リゾート)等の大型
案件の剥落も加味し減少
•
豊富な繰越工事の着実な進捗により、前
年度並みを維持
•
引き続き選別受注の徹底、リニューアル
事業等の利益率の高い事業の強化、DX
推進等による業務効率化により、売上総
利益率増加(+0.3P)
ベア等による人件費増加も加味するも、
販管費は前年度比同水準であり、営業利
益率も増加する計画(+0.3P)
2025年比は税効果会計を享受、
2026年度は税率増にて、当期純利益
ベースでは2025年度比同水準
受注高
177,366
180,624
217,155
165,400
売上高
152,676
167,005
175,294
175,500
売上総利益
14,149
17,991
19,592
20,260
同率
9.3%
10.8%
11.2%
11.5%
営業利益
4,057
6,867
7,211
7,780
同率
2.7%
4.1%
4.1%
4.4%
当期純利益
4,670
4,692
5,181
5,180
純資産*1
47,622
45,708
49,759
51,200
•
利益により着実に積み上げ
ROE
10.2%
10.1%
10.9%
10.3%
•
ROIC
4.5%
7.1%
7.8%
8.0%
ROE・ROIC共に株主資本コスト5.1%・
WACC4.5%*2以上を維持、資本効率を
意識した経営を継続
配当性向
70.0%
70.4%
70.0%
70.1%
•
配当性向は前中期計画に引き続き
70%を維持
配当額については、2026年度に向け9
期連続で当初計画比増配予定、結果的に
累進配当となる予定
連結
親会社株主に帰属する
年間配当(額)
*1 非支配株主持ち分除く
*4
40.6円
(203.0円)*3
*2 2026年3月31日基準。CAPMにて算出
•
•
•
41.0円
*3 株式分割前の金額
45.0円
*4 2024年度より中間配当制度を導入
45.0円
© 2026 Asanuma Corporation.
30
3 業績・株主還元
- 株主還元 ①配当金額・配当性向推移
⚫ 配当は、2026年度に向け9期連続で当初計画比増配予定、結果的に累進配当となる予定
⚫ 現中期3ヵ年計画の株主還元計画は、「配当性向70%以上の維持」。更に、株式を購入しやすい環境とすべく、株式の分
割と中間配当制度を導入
配当金額・配当性向推移
45.0
78.1%
73.3%
70.0%
70.4%
90.0%
70.0%
40.0
80.0%
45.0
35.0
30.0
5.0
50.0%
36.3
30.3%
25.7
15.0
21.6
15.3
26.0
27.4
28.2
35.0
41.5
42.5
40.0%
30.0%
20.0%
18.0
13.0
10.0%
10.0
0.0
(単位:円)
70.0%
60.0%
38.2
40.5%
10.0
41.0
40.6
50.0%
25.0
20.0
45.0
*2
0.0%
2018年度
2019年度
2020年度
2021年度
2022年度
2023年度
2024年度
2025年度
2026年度
*3
*1 2018/10/1株式併合(10株→1株) 、 2022/8/1株式分割(2分割) 、2024/8/1株式分割(5分割)を実施しているため、記載金額は割合調整を実施
当初計画
実績/見込
配当性向
*2 中間配当17.0円、期末配当28.0円の計画
*3 2018年度、 2021年度、 2024年度を初年度とした各中期3ヵ年計画にて開示した当初の計画。但し、2025年度の配当金額は中期3ヵ年計画にて開示していないため、2025/5/14付の決算短信にて開示した予想金額を記載
中期3ヵ年計画
方針
効果的な投資への資金を確保しつつ、前中期3ヵ年計画での配当基準である「配当性向70%以上」を維持
配当基準
基準: 配当性向70%以上
配当額(円)
最終年度 45.0円 (2026年5月13日公表)
その他
• 株式を分割(5分割)(効力発生日:2024年8月1日)
• 中間配当制度を導入(2024年度より導入)
© 2026 Asanuma Corporation.
31
3 業績・株主還元
- 株主還元 ②自己株式の取得・消却
⚫ 2026年8月6日付で、自己株式の取得および一部消却を取締役会にて決議
⚫ 資本コストや株価を意識した経営を一層推進し、市場評価の向上を図る
自己株式の取得
取得し得る株式の総数
120 万株(上限)
株式の取得価額の総額
10 億円(上限)
発行済株式総数(自己株式を除く)
に対する割合1.49%
2026年8月7日より2026年8月31日まで
取得期間
自己株式の消却
消却する株式の総数
90 万株
消却前の発行済株式総数(自己株式
を含む)に対する割合1.11%
2026年9月11日
消却日
(ご参考) 2026年8月31日時点の自己株式の保有状況
発行済株式総数(自己株式を除く)
自己株式数
79,437,645株
1,348,651株
© 2026 Asanuma Corporation.
32
3 業績・株主還元
- 株主還元 ②株価騰落率・PBR推移
⚫ 直近の株価騰落率推移(2期前の中期3ヵ年計画開始時からの約8年分)。参考にTOPIXと比較
⚫ 2026年のTOPIX構成銘柄選定ルールの変更後も、当社株式は引き続きTOPIX構成銘柄に採用
株価情報
騰落率推移
250%
2026/10/16 終値ベース
200%
2026/10/16終値
淺沼組 :120%
864円
TOPIX:138%
150%
時価総額
100%
690億円
50%
PBR
0%
1.44倍
-50%
PER
淺沼組(1852)株価
TOPIX
13.46倍
PBR推移
2.5倍
1株配当(会社予想)
2.0倍
45.0円
1.5倍
1.0倍
0.5倍
配当利回り
配当性向30%以上
前々期中期3ヵ年計画
5.21%
配当性向70%以上
前中期3ヵ年計画
現中期3ヵ年計画
- 株価情報に関する数値は、Yahoo!ファイナンス参考
© 2026 Asanuma Corporation.
33
Appendix
© 2026 Asanuma Corporation.
34
Appendix (別紙) 1/15
建設経済モデルによる建設投資の見通し
⚫ 2026年度は、政府分野、民間非住宅分野、リニューアル分野は堅調に推移し、名目値では前年度比増加、実質値では前年度比で微増と予測
⚫ 2027年度は、民間住宅分野の回復が一巡するが、政府・民間非住宅・リニューアル分野は堅調推移。名目値では増加、実質値では微増と予測
建設投資(名目値)推移
1,000,000
800,000
600,000
400,000
200,000
0
(億円)
2018年度
2019年度
2020年度
建築官庁
2021年度
2022年度
2023年度
見込み
2024年度
見込み
建築民間建設投資(実質値)推移
土木官庁
土木民間
2025年度
見通し
2026年度
見通し
2027年度
見通し
2026年度
見通し
2027年度
見通し
内リニューアル
1,000,000
800,000
600,000
400,000
200,000
(億円)
0
2018年度
2019年度
2020年度
建築官庁
2021年度
建築民間
2022年度
土木官庁
2023年度
見込み
2024年度
見込み
土木民間
2025年度
見通し
内リニューアル
建設経済研究所発行「建設経済モデルによる建設投資の見通し」2026年7月27日発行号参考(実質値については2015年度基準のデフレーターを用いて算出されています)
© 2026 Asanuma Corporation.
35
Appendix (別紙) 2/15
2025年度業績(連結)
受注高・売上高・利益はいずれも前年を上回り、増収増益にて着地。計画比では、2026年2月10日開示の修正計画にはわずかに未達となったものの、期初計画は達成
受注高・売上高・利益はいずれも前年を上回り、増収増益にて着地。計画比では、2026年2月10日開示の修正計画にはわずかに未達となったものの、期初計画は達成
受注高: 国内建築においては倉庫の新築に加えてIR案件(統合型リゾート)、及び事務所のリニューアル、また国内土木においては電線路やダム等、建築・土木共に多数の大型案件が積み上がり前期比 +36,530百万円(同 +20.2%)
受注高: 国内建築においては倉庫の新築に加えてIR案件(統合型リゾート)、及び事務所のリニューアル、また国内土木においては電線路やダム等、建築・土木共に多数の大型案件が積み上がり前期比 +36,530百万円(同 +20.2%)
売上高: 国内建築は、リニューアル工事における前年度の大型工事完成の反動による減少を主因に、前期比微減収(同△3.1%)、
売上高: 一方、国内土木および海外子会社Evergreen社の売上高が前期比増加し、全体では前期比+8,288百万円(同+5.0%)の増収
国内建築は、リニューアル工事における前年度の大型工事完成の反動による減少を主因に、前期比微減収(同△3.1%)、
一方、国内土木および海外子会社Evergreen社の売上高が前期比増加し、全体では前期比+8,288百万円(同+5.0%)の増収
利益: 売上高の増加に加え、受注時の「選別受注」による売上総利益率の向上(前期比+0.4P)により、売上総利益は前期比+1,600百万円(同+8.9%)。
利益: 販管費は、管理体制の変更やベア等による国内人件費の増加により、前期比+1,256百万円(同+11.3%)となったが、
売上高の増加に加え、受注時の「選別受注」による売上総利益率の向上(前期比+0.4P)により、売上総利益は前期比+1,600百万円(同+8.9%)。
営業利益は前期比+343百万円(同+5.0%)、経常利益は前期比+503百万円(同+7.7%)、当期利益は前期比+489百万円(同+10.4%)といずれも前期比増益にて着地
販管費は、管理体制の変更やベア等による国内人件費の増加により、前期比+1,256百万円(同+11.3%)となったが、
営業利益は前期比+343百万円(同+5.0%)、経常利益は前期比+503百万円(同+7.7%)、当期利益は前期比+489百万円(同+10.4%)といずれも前期比増益にて着地
配当: 上記の結果、年間配当は1株あたり45.0円を予定。期初計画41.5円より+3.5円の増配、前期比+4.0円の増配
配当: 上記の結果、年間配当は1株あたり45.0円を予定。期初計画41.5円より+3.5円の増配、前期比+4.0円の増配
■損益計算書
■損益計算書
受注高
受注高
売上高
売上高
完成工事高
完成工事高
その他
その他
売上総利益
売上総利益
2024/3期
2024/3期
実績
実績
2025/3期
2025/3期
実績
実績
177,366
180,624
177,366
180,624
152,676
167,005
152,676
167,005
149,415
163,661
149,415
163,661
3,261
3,344
3,261
3,344
14,149
17,991
14,149
17,991
率
9.3%
10.8%
率
9.3%
10.8%
完成工事利益
13,161
17,081
完成工事利益
13,161
17,081
率
8.8%
10.4%
率
8.8%
10.4%
その他利益
988
909
その他利益
988
909
率
30.3%
27.2%
率
30.3%
27.2%
販管費
10,091
11,124
販管費
10,091
11,124
営業利益
4,057
6,867
営業利益
4,057
6,867
率
2.7%
4.1%
率
2.7%
4.1%
経常利益
4,306
6,545
経常利益
4,306
6,545
率
2.8%
3.9%
率
2.8%
3.9%
親会社株主に帰属する
4,670
4,692
親会社株主に帰属する
4,670
4,692
当期純利益
率
3.1%
2.8%
当期純利益
率
3.1%
2.8%
※1
修正計画は、2026年2月10日開示の数値を記載しています。
期初計画
期初計画
151,500
151,500
170,300
170,300
167,200
167,200
3,100
3,100
18,320
18,320
10.8%
10.8%
17,560
17,560
10.5%
10.5%
760
760
24.5%
24.5%
11,290
11,290
7,030
7,030
4.1%
4.1%
6,820
6,820
4.0%
4.0%
4,770
4,770
2.8%
2.8%
修正計画(※1)
修正計画(※1)
197,500
197,500
174,600
174,600
171,000
171,000
3,600
3,600
19,940
19,940
11.4%
11.4%
18,940
18,940
11.1%
11.1%
1,000
1,000
27.8%
27.8%
12,390
12,390
7,550
7,550
4.3%
4.3%
7,370
7,370
4.2%
4.2%
5,000
5,000
2.9%
2.9%
実績
実績
217,155
217,155
175,294
175,294
171,518
171,518
3,776
3,776
19,592
19,592
11.2%
11.2%
18,502
18,502
10.8%
10.8%
1,089
1,089
28.9%
28.9%
12,380
12,380
7,211
7,211
4.1%
4.1%
7,048
7,048
4.0%
4.0%
5,181
5,181
3.0%
3.0%
※1 修正計画は、2026年2月10日開示の数値を記載しています。
※2
配当(実績・予定)
40.6円
41.0円
41.5円
43.5円
45.0円
※2
配当(実績・予定)
40.6円
41.0円
41.5円
43.5円
45.0円
配当性向
70.0%
70.4%
70.1%
70.1%
70.0%
配当性向
70.0%
70.4%
70.1%
70.1%
70.0%
※2
当社は、2024年8月1日を効力発生日として、普通株式1株につき5株の割合を持って分割しました。
2026/3期
2026/3期
前期比
前期比
36,530
36,530
8,288
8,288
7,857
7,857
431
431
1,600
1,600
0.4P
0.4P
1,420
1,420
0.4P
0.4P
179
179
1.7P
1.7P
1,256
1,256
343
343
0.0P
0.0P
503
503
0.1P
0.1P
489
489
0.2P
0.2P
4.0円
4.0円
△0.4P
△0.4P
■貸借対照表
■貸借対照表
期初計画比
期初計画比
65,655
65,655
4,994
4,994
4,318
4,318
676
676
1,272
1,272
0.4P
0.4P
942
942
0.3P
0.3P
329
329
4.4P
4.4P
1,090
1,090
181
181
0.0P
0.0P
228
228
0.0P
0.0P
411
411
0.2P
0.2P
3.5円
3.5円
△0.1P
△0.1P
修正計画比
修正計画比
19,655
19,655
694
694
518
518
176
176
△347
△347
△0.2P
△0.2P
△437
△437
△0.3P
△0.3P
89
89
1.1P
1.1P
△9
△9
△338
△338
△0.2P
△0.2P
△321
△321
△0.2P
△0.2P
181
181
0.1P
0.1P
1.5円
1.5円
△0.1P
△0.1P
2024年3月期の1株当たりの配当実績については、当該株式分割の影響を考慮した金額を記載しています。
※2 当社は、2024年8月1日を効力発生日として、普通株式1株につき5株の割合を持って分割しました。
投下資本利益率(ROIC)
自己資本利益率(ROE)
自己資本利益率(ROE)
資本コスト(WACC)
資本コスト(WACC)
株主資本コスト
株主資本コスト
4.5%
4.5%
10.2%
10.2%
4.1%
4.1%
4.9%
4.9%
7.1%
7.1%
10.1%
10.1%
4.1%
4.1%
5.5%
5.5%
7.2%
7.2%
10.3%
10.3%
4.1%
4.1%
5.5%
5.5%
7.6%
7.6%
10.6%
10.6%
4.1%
4.1%
5.5%
5.5%
7.8%
7.8%
10.9%
10.9%
4.5%
4.5%
5.1%
5.1%
自己資本比率
自己資本比率
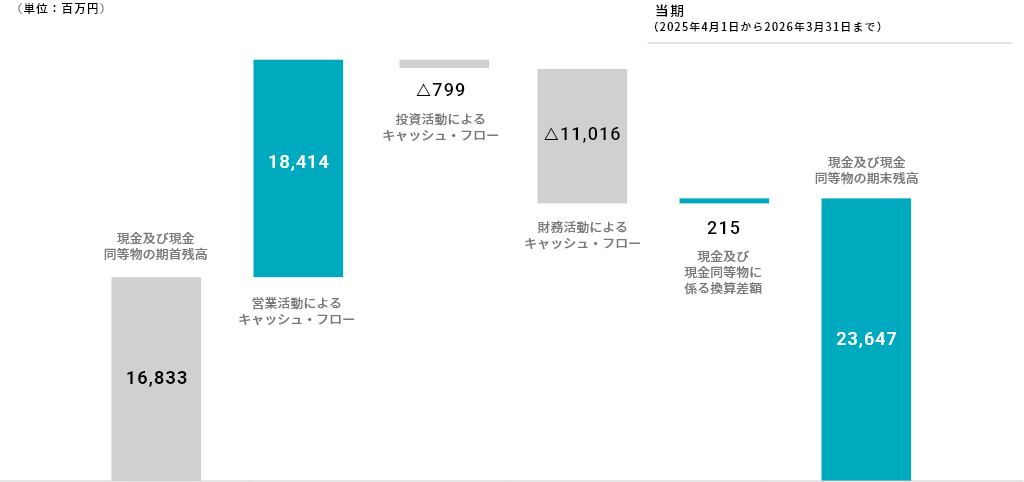
■キャッシュ・フロー計算書
■キャッシュ・フロー計算書
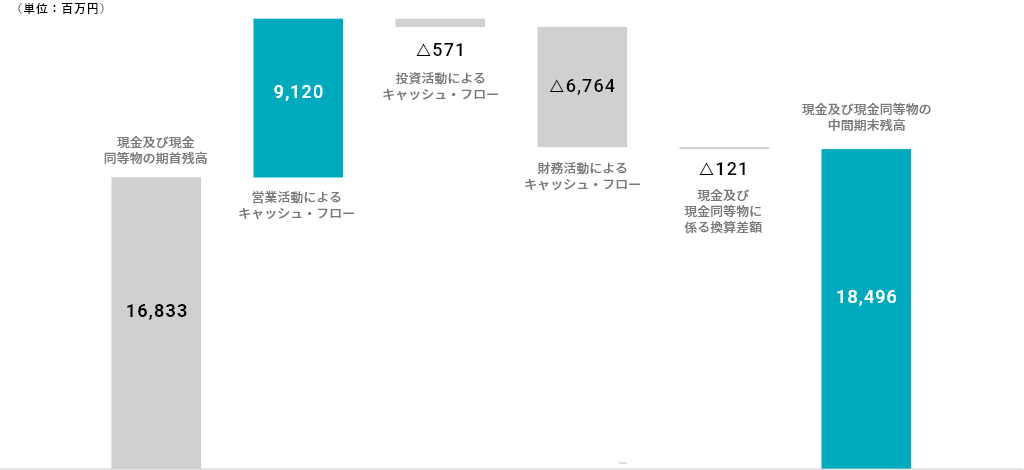
営業活動によるキャッシュ・フロー
営業活動によるキャッシュ・フロー
投資活動によるキャッシュ・フロー
投資活動によるキャッシュ・フロー
財務活動によるキャッシュ・フロー
財務活動によるキャッシュ・フロー
現金および現金同等物に期末残高
2024年3月期の1株当たりの配当実績については、当該株式分割の影響を考慮した金額を記載しています。
投下資本利益率(ROIC)
資産合計
資産合計
流動資産
流動資産
固定資産
固定資産
負債合計
負債合計
内借入金(社債含)
内借入金(社債含)
流動負債
流動負債
内短期借入金(社債含)
内短期借入金(社債含)
固定負債
固定負債
内長期借入金(社債含)
内長期借入金(社債含)
純資産
純資産
株主資本
株主資本
その他の包括利益
その他の包括利益
非支配株主分
非支配株主分
0.7P
0.7P
0.8P
0.8P
0.4P
0.4P
△0.4P
△0.4P
0.6P
0.6P
0.6P
0.6P
0.4P
0.4P
△0.4P
△0.4P
0.2P
0.2P
0.3P
0.3P
0.4P
0.4P
△0.4P
△0.4P
現金および現金同等物に期末残高
2024/3期
2024/3期
実績
実績
101,251
101,251
83,229
83,229
18,022
18,022
52,545
52,545
14,984
14,984
45,181
45,181
12,126
12,126
7,363
7,363
2,858
2,858
48,705
48,705
44,251
44,251
3,371
3,371
1,083
1,083
2025/3期
2025/3期
実績
実績
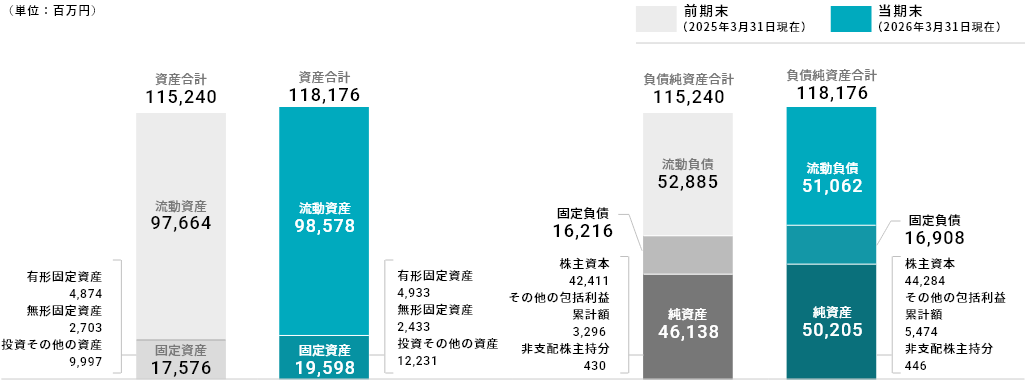
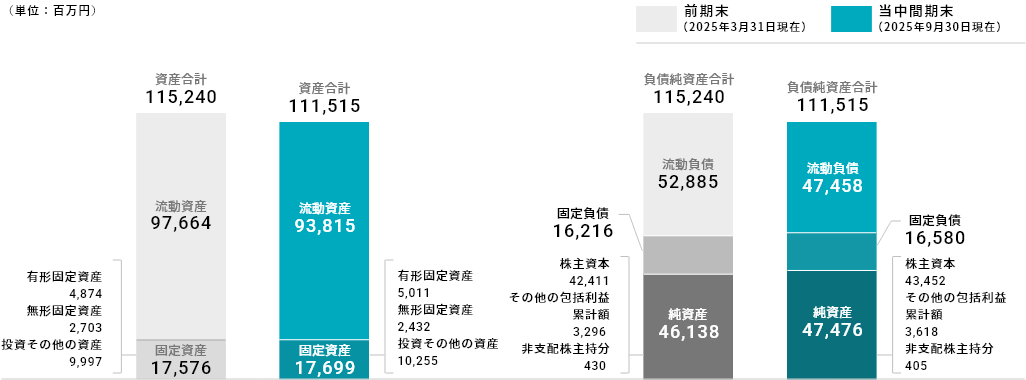
115,240
115,240
97,664
97,664
17,576
17,576
69,102
69,102
21,558
21,558
52,885
52,885
9,946
9,946
16,216
16,216
11,611
11,611
46,138
46,138
42,411
42,411
3,296
3,296
430
430
(単位:百万円)
(単位:百万円)
2026/3期
2026/3期
実績
前期比
実績
前期比
118,176
118,176
98,578
98,578
19,598
19,598
67,970
67,970
14,221
14,221
51,062
51,062
1,358
1,358
16,908
16,908
12,863
12,863
50,205
50,205
44,284
44,284
5,474
5,474
446
446
2,935
2,935
913
913
2,022
2,022
△1,131
△1,131
△7,336
△7,336
△1,823
△1,823
△8,587
△8,587
691
691
1,251
1,251
4,067
4,067
1,873
1,873
2,177
2,177
15
15
47.0%
47.0%
39.7%
39.7%
42.1%
42.1%
2.4P
2.4P
△3,169
△3,169
2,649
2,649
1,410
1,410
13,031
13,031
5,184
5,184
△784
△784
△913
△913
16,833
16,833
18,414
18,414
△799
△799
△11,016
△11,016
23,647
23,647
13,230
13,230
△15
△15
△10,103
△10,103
6,814
6,814
© 2026 Asanuma Corporation.
36
Appendix (別紙) 3/15
2025年度業績(個別)
■損益計算書
■貸借対照表
2024/3期
2025/3期
実績
実績
168,393
169,334
144,000
190,000
208,197
38,862
64,197
18,197
建築
146,168
143,828
120,000
160,000
172,786
28,958
52,786
12,786
土木
22,224
25,506
24,000
30,000
35,410
9,904
11,410
5,410
受注高
売上高
2026/3期
期初計画
修正計画(※)
実績
前期比
期初計画比
2024/3期
2025/3期
実績
実績
実績
92,463
107,963
109,077
1,114
1.0%
流動資産
73,119
86,053
85,144
△909
△1.1%
固定資産
19,343
21,910
23,933
2,023
9.2%
47,537
64,005
62,453
△1,551
△2.4%
13,100
20,000
13,000
△7,000
△35.0%
41,932
49,286
46,286
△2,999
△6.1%
11,800
9,610
1,010
△8,600
△89.5%
5,604
14,719
16,167
1,447
9.8%
1,300
10,390
11,990
1,600
15.4%
44,926
43,958
46,623
2,665
6.1%
修正計画比
142,156
155,720
157,100
157,100
158,596
2,876
1,496
1,496
完成工事高
141,737
155,275
156,700
156,700
158,108
2,832
1,408
1,408
建築
121,979
134,318
132,700
132,700
130,144
△4,174
△2,555
△2,555
土木
19,757
20,957
24,000
24,000
27,964
7,007
3,964
3,964
(単位:百万円)
資産合計
負債合計
内借入金(社債含)
流動負債
内短期借入金(社債含)
前期比
増減率
その他
419
445
400
400
488
43
88
88
売上総利益
11,374
15,647
15,970
15,970
16,656
1,008
686
686
8.0%
10.0%
10.2%
10.2%
10.5%
0.5P
0.3P
0.3P
11,246
15,510
15,840
15,840
16,488
978
648
648
株主資本
42,528
41,928
43,548
1,619
3.9%
評価・換算差額等
2,398
2,029
3,075
1,046
51.6%
48.6%
40.7%
42.7%
2.0P
率
完成工事利益
率
7.9%
10.0%
10.1%
10.1%
10.4%
0.4P
0.3P
0.3P
8,750
12,916
13,650
733
7.2%
9.6%
10.5%
0.9P
2,496
2,593
2,838
244
率
12.6%
12.4%
10.1%
△2.3P
128
137
130
130
167
29
37
37
率
30.5%
31.0%
32.5%
32.5%
34.3%
3.3P
1.8P
1.8P
9,068
9,714
9,700
9,700
10,737
1,023
1,037
1,037
人件費
5,158
5,228
6,112
884
経費
3,910
4,486
4,625
139
営業利益
2,305
5,933
6,270
6,270
5,918
△14
△351
△351
1.6%
3.8%
4.0%
4.0%
3.7%
△0.1P
△0.3P
△0.3P
2,568
5,472
6,540
6,540
6,453
980
△86
△86
建築
率
土木
その他利益
販管費
率
経常利益
率
当期純利益
率
1.8%
3.5%
4.2%
4.2%
4.1%
0.6P
△0.1P
△0.1P
3,639
3,949
4,770
4,770
4,928
978
158
158
2.6%
2.5%
3.0%
3.0%
3.1%
0.6P
0.1P
0.1P
固定負債
2026/3期
内長期借入金(社債含)
純資産
自己資本比率
※ 修正計画は、2026年2月10日開示の数値を記載しています。(受注のみ修正)
© 2026 Asanuma Corporation.
37
Appendix (別紙) 4/15
2025年度関係会社の状況
SINGAPORE
SINGAPORE PAINTS
PAINTS
EVERGREEN
EVERGREEN ENGINEERING
ENGINEERING
:前期および今期の受注の苦戦により、売上高・利益ともに前期比減、計画未達
:直近2期の受注の苦戦により、売上高・利益ともに前期比減、計画未達
:前期受注した大型案件も順調に進捗し、売上高・利益ともに前期比・計画比大幅増
:2025年3月期に受注した大型案件も順調に進捗し、売上高・利益ともに前期比・計画比大幅増
その他関係会社
その他関係会社
:各社ともに計画通り推移
:各社ともに計画通り推移
■連結子会社
■連結子会社
(単位:百万円)
(単位:百万円)
SINGAPORE PAINTS & CONTRACTOR PTE. LTD.
EVERGREEN ENGINEERING & CONSTRUCTION PTE. LTD.
建物塗装・修繕工事請負業
設備工事業、建物メンテナンス業
損害保険代理業
資本金:95百万円
資本金:389百万円
資本金:20百万円
出資比率:80%
(損益)
売
上
実績
出資比率:100%
2026/3期
2025/3期
計画
実績
淺沼建物(株)
前期比
計画比
2027/3期
2025/3期
計画
実績
出資比率:100%
2026/3期
計画
実績
前期比
計画比
2027/3期
2025/3期
計画
実績
2026/3期
計画
実績
2027/3期
前期比
計画比
計画
高
3,758
3,266
2,896
△861
△369
2,616
6,708
9,144
12,968
6,260
3,824
8,337
231
190
233
2
43
210
営業利益
284
224
167
△117
△56
97
895
994
1,467
571
473
1,068
100
30
77
△23
47
51
経常利益
307
202
165
△142
△36
92
1,058
1,126
1,606
548
480
1,166
100
30
77
△23
47
51
当期純利益
255
168
132
△122
△35
76
891
935
1,340
449
405
968
62
20
51
△10
31
35
2026/3期
2025/3期
(貸借)
総
資
実績
産
資
産
実績
前期比
2,796
計画比
2,521
0
0
0
1,294
1,352
57
有利子負債
純
計画
2027/3期
2025/3期
計画
実績
274
2026/3期
計画
実績
前期比
8,963
計画比
6,800
5,047
6,150
1,103
2027/3期
2025/3期
計画
実績
2,163
2026/3期
計画
実績
2027/3期
前期比
383
計画比
計画
△54
437
328
320
△8
■連結子会社(PFI事業)
PFI事業(3社) 合計
(損益)
売
上
実績
<PFI関連事業の概要>
2026/3期
2025/3期
計画
実績
2027/3期
前期比
計画比
名称
計画
592
604
604
12
0
585
営業利益
19
3
3
△15
0
6
経常利益
21
4
5
△15
1
8
当期純利益
16
2
3
△13
1
6
2026/3期
2025/3期
総
計画
実績
2027/3期
前期比
計画比
産
2,265
1,915
△350
1,655
1,306
△348
親会社(当社)
関係内容他
宇都宮郷の森斎場(株)
10
42.5%
当社が資金の貸付を行っている
桜井給食ファシリティーズ(株)
10
50.0%
当社が資金の貸付を行っている
小田原斎場PFI(株)
10
40.0%
当社が資金の貸付を行っている
計画
有利子負債
うち
資
実績
当社
出資比率
高
(貸借)
資本金
貸
付
額
97
85
△12
純
資
産
300
303
3
© 2026 Asanuma Corporation.
38
Appendix (別紙) 5/15
2025年度業績予想(連結・個別)
受注高:
受注高: 2025年3月期・2026年3月期の受注は好調であり繰越工事を潤沢に抱えるため、受注額の追及ではなくより一層の「選別受注」を推進。また、2026/3期に受注したIR(統合型リゾート)等の
2025年3月期・2026年3月期の受注は好調であり繰越工事を潤沢に抱えるため、受注額の追及ではなくより一層の「選別受注」を推進。また、2026/3期に受注したIR(統合型リゾート)等の
大型案件の剥落も加味し、2026年3月期比減少計画
大型案件の剥落も加味し、2026年3月期比減少計画
売上高:
国内における豊富な繰越工事の着実な進捗により、2026年3月期と同水準を維持
売上高: 国内における豊富な繰越工事の着実な進捗により、2026年3月期と同水準を維持
利
利益:
益: 引き続き選別受注を徹底することで利益率の向上を図り、当期純利益ベースでは2026年3月期と同水準を維持
引き続き選別受注を徹底することで利益率の向上を図り、当期純利益ベースでは2026年3月期と同水準を維持
配
当:
配当: 2026年3月期と同額の1株あたり45.0円にて計画
2026年3月期と同額の1株あたり45.0円にて計画
(単位:百万円)
(単位:百万円)
連結
連結
2025/3期
2025/3期
実績
実績
計画
計画
180,624
180,624
217,155
217,155
36,530
36,530
165,400
165,400
△15,224
△15,224
△51,755
△51,755
-167,005
167,005
-175,294
175,294
-8,288
8,288
-175,500
175,500
-8,494
8,494
163,661
163,661
171,518
171,518
7,857
7,857
172,000
172,000
-3,344
3,344
-3,776
3,776
-431
431
率
率
17,991
17,991
10.8%
10.8%
19,592
19,592
11.2%
11.2%
率
率
17,081
17,081
10.4%
10.4%
率
率
受注高
受注高
建築
建築
土木
土木
売上高
売上高
完成工事高
完成工事高
建築
建築
土木
土木
その他
その他
売上総利益
売上総利益
完成工事利益
完成工事利益
その他利益
その他利益
販管費
販管費
営業利益
営業利益
率
率
経常利益
経常利益
率
率
親会社株主に帰属する
親会社株主に帰属する
当期純利益(連結)
当期純利益(連結)
配当(実績・予想)
配当(実績・予想)
配当性向
配当性向
個別
個別
2026/3期
2026/3期
実績
前期比
実績
前期比
率
率
※
※
2026/3期
2026/3期
実績
前期比
実績
前期比
計画
計画
169,334
169,334
143,828
143,828
208,197
208,197
172,786
172,786
38,862
38,862
28,958
28,958
156,000
156,000
130,000
130,000
△13,334
△13,334
△13,828
△13,828
△52,197
△52,197
△42,786
△42,786
-205
205
25,506
25,506
155,720
155,720
35,410
35,410
158,596
158,596
9,904
9,904
2,876
2,876
26,000
26,000
162,900
162,900
493
493
7,179
7,179
△9,410
△9,410
4,303
4,303
8,338
8,338
481
481
155,275
155,275
134,318
134,318
158,108
158,108
130,144
130,144
162,500
162,500
135,000
135,000
7,224
7,224
681
681
4,391
4,391
4,855
4,855
-3,500
3,500
-155
155
-△276
△276
20,957
20,957
445
445
27,964
27,964
488
488
2,832
2,832
△4,174
△4,174
7,007
7,007
27,500
27,500
400
400
6,542
6,542
△45
△45
△464
△464
△88
△88
1,600
1,600
0.4P
0.4P
20,260
20,260
11.5%
11.5%
2,268
2,268
0.7P
0.7P
15,647
15,647
10.0%
10.0%
16,656
16,656
10.5%
10.5%
17,750
17,750
10.9%
10.9%
2,102
2,102
0.9P
0.9P
1,093
1,093
0.4P
0.4P
18,502
18,502
10.8%
10.8%
1,420
1,420
0.4P
0.4P
19,330
19,330
11.2%
11.2%
2,248
2,248
0.8P
0.8P
667
667
0.3P
0.3P
827
827
15,510
15,510
10.0%
10.0%
16,488
16,488
10.4%
10.4%
17,620
17,620
10.8%
10.8%
2,109
2,109
0.8P
0.8P
1,131
1,131
0.4P
0.4P
909
909
27.2%
27.2%
1,089
1,089
28.9%
28.9%
179
179
1.7P
1.7P
930
930
26.6%
26.6%
20
20
△0.6P
△0.6P
137
137
31.0%
31.0%
167
167
34.3%
34.3%
130
130
32.5%
32.5%
△7
△7
1.5P
1.5P
△37
△37
△1.8P
△1.8P
11,124
11,124
6,867
6,867
12,380
12,380
7,211
7,211
1,256
1,256
343
343
12,480
12,480
7,780
7,780
1,355
1,355
912
912
9,714
9,714
5,933
5,933
10,737
10,737
5,918
5,918
10,790
10,790
6,960
6,960
1,075
1,075
1,026
1,026
4.1%
4.1%
6,545
6,545
4.1%
4.1%
7,048
7,048
0.0P
0.0P
503
503
4.4%
4.4%
7,530
7,530
0.3P
0.3P
984
984
3.8%
3.8%
5,472
5,472
3.7%
3.7%
6,453
6,453
4.3%
4.3%
7,420
7,420
0.5P
0.5P
1,947
1,947
52
52
1,041
1,041
0.6P
0.6P
3.9%
3.9%
4,692
4,692
2.8%
2.8%
4.0%
4.0%
5,181
5,181
3.0%
3.0%
0.1P
0.1P
489
489
4.3%
4.3%
5,180
5,180
3.0%
3.0%
0.4P
0.4P
487
487
3.5%
3.5%
3,949
3,949
2.5%
2.5%
4.1%
4.1%
4,928
4,928
3.1%
3.1%
4.6%
4.6%
5,340
5,340
3.3%
3.3%
1.1P
1.1P
1,390
1,390
0.8P
0.8P
41.0円
41.0円
70.4%
70.4%
※
※
45.0円
45.0円
70.0%
70.0%
0.2P
0.2P
4.0円
4.0円
△0.4P
△0.4P
※
※
45.0円
45.0円
70.0%
70.0%
2027/3期
2027/3期
前々期比
前々期比
0.2P
0.2P
4.0円
4.0円
△0.4P
△0.4P
前期比
前期比
0.4P
0.4P
△159
△159
△2.3P
△2.3P
99
99
568
568
0.3P
0.3P
481
481
0.3P
0.3P
△1
△1
△0.0P
△0.0P
2025/3期
2025/3期
実績
実績
43
43
1,008
1,008
0.5P
0.5P
978
978
0.4P
0.4P
29
29
3.3P
3.3P
1,023
1,023
△14
△14
△0.1P
△0.1P
980
980
0.6P
0.6P
978
978
0.6P
0.6P
2027/3期
2027/3期
前々期比
前々期比
前期比
前期比
966
966
0.5P
0.5P
411
411
0.2P
0.2P
0.0円
0.0円
0.0P
0.0P
※ 当社は、2025年3月期より中間配当制度を導入いたしました。2025年3月期は15.0円/株、2026年3月期は16.0円/株、各第2四半期末に中間配当を実施いたしました。
※ 当社は、2025年3月期より中間配当制度を導入いたしました。2025年3月期は15.0円/株、2026年3月期は16.0円/株、各第2四半期末に中間配当を実施いたしました。
2027年3月期は、期初配当予測 45.0円/株の内、第2四半期末に17.0円/株の中間配当を予想しております。
2027年3月期は、期初配当予測 45.0円/株の内、第2四半期末に17.0円/株の中間配当を予想しております。
© 2026 Asanuma Corporation.
39
Appendix (別紙) 6/15
2025年度受注の状況(個別)
(単位:百万円)
2025/3期
実績
2026/3期
構成比
実績
構成比
2025/3期
前期比
実績
■発注者別(建築)
2026/3期
構成比
実績
構成比
前期比
■発注者別(土木)
国
10,951
48.9%
3,919
12.5%
△7,031
国
3,495
17.9%
8,706
54.6%
5,211
独立行政法人等
8,089
36.1%
20,568
65.4%
12,479
独立行政法人等
1,850
9.5%
4,485
28.1%
2,634
中央
19,040
85.1%
24,488
77.9%
5,447
県
143
0.6%
1,996
6.4%
1,853
市区町村等
3,198
14.3%
4,943
15.7%
1,745
3,341
14.9%
6,940
22.1%
3,599
都
道
府
地方
官庁
中央
5,345
27.3%
13,191
82.7%
7,845
県
1,974
10.1%
630
4.0%
△1,343
市区町村等
12,232
62.6%
2,127
13.3%
△10,104
14,206
72.7%
2,758
17.3%
△11,448
都
道
府
地方
22,381
100.0%
31,428
100.0%
9,047
19,552
100.0%
15,949
100.0%
△3,602
食
品
工
業
194
0.2%
492
0.3%
297
食
品
工
業
化
学
工
業
6,643
5.5%
4,361
3.1%
△2,281
化
学
工
業
業
1,190
1.0%
275
0.2%
△914
鉄
業
電気機械工業
330
0.3%
44
0.0%
△285
電気機械工業
輸送用機械工業
8,882
7.3%
9,489
6.7%
606
輸送用機械工業
その他機械工業
10,409
8.6%
4,801
3.4%
△5,607
その他機械工業
その他製造業
鉄
鋼
その他製造業
官庁
鋼
1,002
0.8%
2,917
2.1%
1,915
28,653
23.6%
22,383
15.8%
△6,270
鉱業・建設業
13,086
10.8%
7,337
5.2%
△5,748
鉱業・建設業
551
9.3%
987
5.1%
435
電気・ガス・熱供給・水道業
1
0.0%
10
0.0%
8
電気・ガス・熱供給・水道業
984
16.5%
9,600
49.3%
8,616
情報通信業
製造業
情報通信業
製造業
990
0.8%
2,751
1.9%
1,761
業
10,375
8.5%
2,574
1.8%
△7,801
卸売・小売業
2,121
1.7%
4,418
3.1%
金融・保険業
267
0.2%
145
0.1%
業
54,182
44.6%
59,899
42.4%
5,717
不
サ ー ビ ス 業
10,114
8.3%
40,786
28.9%
30,671
そ
1,653
1.4%
1,049
0.7%
△604
そ
92,793
76.4%
118,974
84.2%
26,181
非製造業
121,446
100.0%
141,357
100.0%
19,911
運
不
非製造業
民間
合計
(単位:百万円)
輸
動
産
の
他
143,828
172,786
0.0%
0.0%
業
2,961
49.7%
4,569
23.5%
1,608
2,297
卸売・小売業
3
0.1%
0.0%
△3
△121
金融・保険業
0.0%
0.0%
業
625
10.5%
2,614
13.4%
1,988
サ ー ビ ス 業
828
13.9%
1,689
8.7%
860
0
0.0%
0.0%
0
5,954
100.0%
19,460
100.0%
13,506
5,954
100.0%
19,460
100.0%
13,506
28,958
運
民間
合計
輸
動
産
の
他
25,506
35,410
9,904
© 2026 Asanuma Corporation.
40
Appendix (別紙) 7/15
2025年度受注の状況(個別)
(単位:百万円)
2025/3期
実績
2026/3期
構成比
実績
構成比
2025/3期
実績
前期比
■用途別(建築)
事
(単位:百万円)
2026/3期
実績
構成比
構成比
前期比
■用途別(土木)
務
宿
所
23,787
16.5%
25,933
15.0%
2,146
治
山
治
下
水
254
1.0%
6,260
17.7%
道
3,004
11.8%
4,535
12.8%
1,531
道
10,193
40.0%
1,946
5.5%
△8,247
4,519
水
6,005
泊
4,535
3.2%
26,158
15.1%
21,623
鉄
店舗・娯楽
6,416
4.5%
3,510
2.0%
△2,905
上
工
場
30,787
21.4%
14,745
8.5%
△16,042
造
成
1,574
6.2%
6,093
17.2%
倉
庫
25,845
18.0%
49,274
28.5%
23,429
道
路
3,957
15.5%
4,323
12.2%
366
住
△1,531
電
線
路
912
3.6%
9,588
27.1%
8,675
そ
の
他
宅
29,014
20.2%
27,483
15.9%
教
育
研
究
6,922
4.8%
18,888
10.9%
11,965
医
療
福
祉
2,268
1.6%
2,377
1.4%
109
他
14,250
9.9%
4,413
2.6%
△9,837
143,828
100.0%
172,786
100.0%
28,958
所
19,933
15.8%
15,014
10.3%
△4,919
23,498
東
そ
の
建築
事
務
宿
5,608
22.0%
2,662
7.5%
△2,946
25,506
100.0%
35,410
100.0%
9,904
道
3,587
2.1%
6,704
3.2%
3,116
北
11,393
6.7%
4,283
2.1%
△7,109
関東・甲信越
53,914
31.8%
68,233
32.8%
14,318
陸
21,513
12.7%
20,266
9.7%
△1,247
土木
■地域別(建築・土木)
北
泊
2,180
1.7%
25,679
17.7%
店舗・娯楽
2,818
2.2%
2,264
1.6%
△553
工
場
28,050
22.2%
8,492
5.8%
△19,558
中
倉
庫
25,785
20.4%
48,902
33.6%
23,117
近
住
宅
28,635
22.6%
26,010
17.9%
△2,625
海
部
・
北
畿
49,981
29.5%
84,924
40.8%
34,942
中
国
・
四
国
11,427
6.7%
10,764
5.2%
△662
州
・
沖
教
育
研
究
4,946
3.9%
15,124
10.4%
10,177
九
縄
17,103
10.1%
13,070
6.3%
△4,032
医
療
福
祉
1,920
1.5%
458
0.3%
△1,462
海
外
412
0.2%
△49
0.0%
△462
合
計
169,334
100.0%
208,197
100.0%
38,862
そ
の
他
12,271
9.7%
3,436
2.4%
△8,834
126,543
100.0%
145,383
100.0%
18,840
所
3,853
22.3%
10,918
39.8%
7,065
泊
2,354
13.6%
479
1.7%
△1,875
店舗・娯楽
3,598
20.8%
1,246
4.5%
△2,351
工
場
2,737
15.8%
6,253
22.8%
3,515
倉
庫
60
0.3%
372
1.4%
312
住
宅
378
2.2%
1,472
5.4%
1,094
5億以上
建築(新築)
事
務
宿
※2025年3月期までは本支店ごとに区分しておりましたが、2026年3月期より施工場所ごとに区分しております。
■規模別(建築・土木)
※新規受注のみ
2025/3期
5
億
円
2026/3期
件数
実績
満
614
13,572
9.0% 626
12,402
6.7%
△1,169
10 億未満
10
7,345
4.9%
6
4,577
2.5%
△2,767
未
構成比
件数
実績
構成比
前期比
教
育
研
究
1,975
11.4%
3,764
13.7%
1,788
10 億以上
30 億未満
25
39,847
26.5%
22
37,278
20.0%
△2,569
医
療
福
祉
347
2.0%
1,919
7.0%
1,571
30 億以上
50 億未満
11
43,100
28.6%
13
51,627
27.7%
8,527
以
8
そ
の
建築(リニューアル)
他
1,979
11.5%
976
3.6%
△1,003
50
17,285
100.0%
27,402
100.0%
10,117
合
億
上
7
46,701
31.0%
80,204
43.1%
33,502
計
667
150,567
100.0% 675 186,091
100.0%
35,523
© 2026 Asanuma Corporation.
41
Appendix (別紙) 8/15
2025年度完成工事の状況(個別)
(単位:百万円)
2025/3期
実績
2026/3期
構成比
実績
構成比
2025/3期
前期比
実績
■発注者別(建築)
2026/3期
構成比
実績
構成比
前期比
■発注者別(土木)
国
375
3.3%
1,354
9.6%
978
国
2,837
23.5%
5,080
30.8%
2,242
独立行政法人等
5,376
46.6%
4,845
34.5%
△531
独立行政法人等
3,405
28.2%
4,144
25.2%
738
中央
5,752
49.8%
6,200
44.1%
447
県
289
2.5%
926
6.6%
636
市区町村等
5,503
47.7%
6,930
49.3%
1,426
5,793
50.2%
7,856
55.9%
2,063
11,545
100.0%
14,056
100.0%
2,510
都
道
府
地方
官庁
中央
6,243
51.6%
9,224
56.0%
2,981
県
32
0.3%
772
4.7%
740
市区町村等
5,815
48.1%
6,475
39.3%
659
5,848
48.4%
7,247
44.0%
1,399
12,091
100.0%
16,472
100.0%
4,381
都
道
府
地方
官庁
食
品
工
業
3,505
2.9%
528
0.5%
△2,976
食
品
工
業
化
学
工
業
3,002
2.4%
5,248
4.5%
2,245
化
学
工
業
業
517
0.4%
1,060
0.9%
543
鉄
業
電気機械工業
1,572
1.3%
348
0.3%
△1,224
電気機械工業
輸送用機械工業
10,524
8.6%
7,334
6.3%
△3,190
輸送用機械工業
その他機械工業
17,036
13.9%
3,698
3.2%
△13,337
その他機械工業
その他製造業
1,034
0.8%
2,355
2.0%
1,320
その他製造業
37,192
30.3%
20,573
17.7%
△16,618
鉱業・建設業
4,344
3.5%
11,396
9.8%
7,051
鉱業・建設業
609
6.9%
884
7.7%
275
電気・ガス・熱供給・水道業
1
0.0%
10
0.0%
8
電気・ガス・熱供給・水道業
1,861
21.0%
2,392
20.8%
530
情報通信業
鉄
鋼
製造業
情報通信業
168
0.1%
855
0.7%
687
11,027
9.0%
10,062
8.7%
△964
卸売・小売業
911
0.7%
1,433
1.2%
金融・保険業
1,758
1.4%
521
0.4%
不
業
57,479
46.8%
59,052
50.9%
1,573
不
サ ー ビ ス 業
5,470
4.5%
7,956
6.9%
そ
4,418
3.6%
4,223
3.6%
85,580
69.7%
95,513
82.3%
9,933
非製造業
122,772
100.0%
116,087
100.0%
△6,684
非製造業
輸
動
産
の
他
134,318
130,144
鋼
製造業
業
運
民間
合計
(単位:百万円)
0.0%
0.0%
業
4,087
46.1%
4,911
42.7%
823
522
卸売・小売業
5
0.1%
0.0%
△5
△1,237
金融・保険業
0.0%
0.0%
業
1,354
15.3%
2,384
20.8%
1,030
2,486
サ ー ビ ス 業
832
9.4%
918
8.0%
86
△194
そ
115
1.3%
0.0%
△115
8,865
100.0%
11,491
100.0%
2,625
8,865
100.0%
11,491
100.0%
2,625
△4,174
運
民間
合計
輸
動
産
の
他
20,957
27,964
7,007
0
© 2026 Asanuma Corporation.
42
Appendix (別紙) 9/15
2025年度完成工事の状況(個別)
(単位:百万円)
2025/3期
実績
2026/3期
構成比
実績
構成比
2025/3期
実績
前期比
■用途別(建築)
事
(単位:百万円)
2026/3期
実績
構成比
構成比
前期比
■用途別(土木)
務
宿
所
13,979
10.4%
10,288
7.9%
△3,691
治
山
治
下
水
水
1,178
5.6%
1,449
5.2%
271
道
3,794
18.1%
5,025
18.0%
1,230
道
4,155
19.8%
6,058
21.7%
1,902
泊
4,917
3.7%
7,650
5.9%
2,732
鉄
店舗・娯楽
5,454
4.1%
4,834
3.7%
△620
上
工
場
34,971
26.0%
29,191
22.4%
△5,780
造
成
2,353
11.2%
4,077
14.6%
1,724
倉
庫
32,697
24.3%
31,293
24.0%
△1,403
道
路
4,124
19.7%
3,848
13.8%
△275
宅
32,496
24.2%
28,104
21.6%
△4,392
電
線
路
1,831
8.7%
2,339
8.4%
508
研
究
5,282
3.9%
11,920
9.2%
6,637
そ
の
他
3,519
16.8%
5,163
18.5%
1,644
福
20,957
100.0%
27,964
100.0%
7,007
6,443
4.1%
5,105
3.2%
△1,338
住
教
育
医
療
祉
577
0.4%
1,674
1.3%
1,097
そ
の
他
3,940
2.9%
5,186
4.0%
1,245
134,318
100.0%
130,144
100.0%
△4,174
事
務
所
8,489
7.7%
8,258
7.6%
△231
北
建築
土木
■地域別(建築・土木)
海
道
泊
3,933
3.6%
5,948
5.4%
2,015
東
北
5,755
3.7%
5,337
3.4%
△417
店舗・娯楽
2,980
2.7%
2,007
1.8%
△973
関東・甲信越
62,770
40.4%
57,649
36.5%
△5,121
工
場
27,441
24.9%
24,014
22.0%
△3,426
中
陸
15,784
10.2%
20,319
12.9%
4,534
倉
庫
32,493
29.5%
31,164
28.5%
△1,328
近
畿
41,162
26.5%
45,722
28.9%
4,559
宿
育
医
療
そ
・
北
宅
30,115
27.3%
25,330
23.2%
△4,784
中
国
・
四
国
9,902
6.4%
11,911
7.5%
2,009
研
究
1,523
1.4%
8,250
7.6%
6,727
九
州
・
沖
縄
12,621
8.1%
11,845
7.5%
△775
福
祉
57
0.1%
974
0.9%
916
海
外
834
0.5%
217
0.1%
△617
他
3,090
2.8%
3,242
3.0%
151
合
計
155,275
100.0%
158,108
100.0%
2,832
△934
住
教
部
の
110,125
100.0%
109,190
100.0%
建築(新築)
所
5,489
22.7%
2,029
9.7%
△3,459
泊
984
4.1%
1,702
8.1%
717
店舗・娯楽
2,473
10.2%
2,826
13.5%
352
工
場
7,529
31.1%
5,176
24.7%
△2,353
倉
庫
204
0.8%
129
0.6%
△74
住
宅
2,381
9.8%
2,773
13.2%
392
5億以上
10 億未満
事
務
宿
※2025年3月期までは本支店ごとに区分しておりましたが、2026年3月期より施工場所ごとに区分しております。
■規模別(建築・土木)
2025/3期
5
億
円
未
満
2026/3期
件数
実績
構成比
件数
実績
構成比
前期比
671
16,701
10.8% 645
12,040
7.6%
△4,660
32
11,624
7.5%
35
12,936
8.2%
1,312
教
育
研
究
3,759
15.5%
3,670
17.5%
△89
10 億以上
30 億未満
78
54,878
35.3%
82
54,073
34.2%
△804
医
療
福
祉
519
2.1%
700
3.3%
180
30 億以上
50 億未満
27
31,454
20.3%
30
28,715
18.2%
△2,739
他
850
3.5%
1,944
9.3%
1,094
50
以
上
13
40,617
26.2%
23
50,342
31.8%
9,724
24,193
100.0%
20,953
100.0%
△3,239
合
計
821
155,275
100.0% 815 158,108
100.0%
2,832
そ
の
建築(リニューアル)
億
© 2026 Asanuma Corporation.
43
Appendix (別紙) 10/15
2025年度繰越工事の状況(個別)
(単位:百万円)
2025/3期
実績
2026/3期
構成比
実績
構成比
2025/3期
前期比
実績
■発注者別(建築)
2026/3期
構成比
実績
構成比
前期比
■発注者別(土木)
国
11,577
38.4%
14,142
29.7%
2,564
国
3,453
12.9%
7,079
27.1%
独立行政法人等
7,347
24.3%
23,070
48.5%
15,723
独立行政法人等
6,474
24.3%
6,815
26.1%
340
18,925
62.7%
37,213
78.3%
18,287
3,966
3,380
11.2%
4,451
9.4%
1,070
中央
都
道
府
県
市区町村等
地方
官庁
7,875
26.1%
5,889
12.4%
△1,986
11,255
37.3%
10,340
21.7%
△915
中央
3,626
9,927
37.2%
13,894
53.1%
県
1,941
7.3%
1,799
6.9%
△141
市区町村等
14,798
55.5%
10,450
40.0%
△4,347
16,740
62.8%
12,250
46.9%
△4,489
都
道
府
地方
30,181
100.0%
47,553
100.0%
17,372
26,668
100.0%
26,145
100.0%
△522
食
品
工
業
50
0.0%
14
0.0%
△36
食
品
工
業
化
学
工
業
5,828
4.7%
4,942
3.3%
△886
化
学
工
業
業
827
0.7%
41
0.0%
△785
鉄
業
電気機械工業
321
0.3%
17
0.0%
△303
電気機械工業
輸送用機械工業
4,306
3.5%
6,461
4.4%
2,155
輸送用機械工業
その他機械工業
10,504
8.5%
4,455
3.0%
△6,049
その他機械工業
その他製造業
鉄
鋼
その他製造業
製造業
374
0.3%
937
0.6%
562
22,213
18.1%
16,871
11.4%
△5,342
官庁
鋼
製造業
鉱業・建設業
9,394
7.6%
5,336
3.6%
△4,058
鉱業・建設業
1,826
17.1%
1,928
10.4%
102
電気・ガス・熱供給・水道業
0.0%
0.0%
電気・ガス・熱供給・水道業
1,482
13.9%
8,690
46.7%
7,208
情報通信業
821
0.7%
2,717
1.8%
1,896
情報通信業
0.0%
0.0%
運
業
8,257
6.7%
769
0.5%
△7,488
業
6,606
62.0%
6,264
33.6%
△342
卸売・小売業
1,466
1.2%
4,451
3.0%
2,985
卸売・小売業
0.0%
0.0%
金融・保険業
396
0.3%
20
0.0%
△375
金融・保険業
0.0%
0.0%
7,999
不
229
不
輸
動
産
運
輸
業
69,488
56.5%
77,487
52.3%
業
746
7.0%
975
5.2%
サ ー ビ ス 業
7,645
6.2%
40,474
27.3%
32,829
サ ー ビ ス 業
△3
0.0%
767
4.1%
770
そ
3,318
2.7%
144
0.1%
△3,174
そ
0.0%
0.0%
100,790
81.9%
131,403
88.6%
30,612
非製造業
10,657
100.0%
18,626
100.0%
7,969
123,004
100.0%
148,274
100.0%
25,270
10,657
100.0%
18,626
100.0%
7,969
非製造業
民間
合計
(単位:百万円)
の
他
153,185
195,828
42,642
民間
合計
動
産
の
他
37,325
44,772
7,446
0
© 2026 Asanuma Corporation.
44
Appendix (別紙) 11/15
2025年度繰越工事の状況(個別)
(単位:百万円)
2025/3期
実績
2026/3期
構成比
実績
構成比
2025/3期
実績
前期比
■用途別(建築)
事
(単位:百万円)
2026/3期
実績
構成比
構成比
前期比
■用途別(土木)
務
宿
所
20,551
13.4%
36,196
18.5%
15,645
治
泊
4,308
2.8%
22,816
11.7%
18,508
鉄
山
治
0.6%
5,017
11.2%
4,810
6,784
18.2%
6,294
14.1%
△489
道
13,451
36.0%
9,339
20.9%
△4,112
成
1,448
3.9%
3,464
7.7%
2,016
6,619
4.3%
5,296
2.7%
△1,323
上
工
場
27,615
18.0%
13,169
6.7%
△14,446
造
倉
庫
23,101
15.1%
41,081
21.0%
17,980
道
路
7,023
18.8%
7,498
16.7%
474
住
宅
46,843
30.6%
46,222
23.6%
△620
電
線
路
1,442
3.9%
8,691
19.4%
7,248
そ
の
他
育
研
究
8,642
5.6%
15,610
8.0%
6,968
医
療
福
祉
1,968
1.3%
2,672
1.4%
703
そ
の
他
6,967
18.7%
4,465
10.0%
△2,501
37,325
100.0%
44,772
100.0%
7,446
道
6,744
3.5%
8,344
3.5%
1,599
北
11,224
5.9%
10,170
4.2%
△1,054
関東・甲信越
61,324
32.2%
71,908
29.9%
10,583
中
陸
24,656
12.9%
24,603
10.2%
△53
畿
54,024
28.4%
93,226
38.7%
39,201
国
13,446
7.1%
12,299
5.1%
△1,147
縄
18,809
9.9%
20,034
8.3%
1,224
土木
13,535
8.8%
12,762
6.5%
△772
153,185
100.0%
195,828
100.0%
42,642
所
17,822
13.1%
24,578
14.2%
6,756
北
泊
2,804
2.1%
22,543
13.0%
19,739
東
店舗・娯楽
1,732
1.3%
1,990
1.1%
257
工
場
26,052
19.1%
11,168
6.4%
△14,884
倉
庫
23,100
16.9%
40,838
23.6%
17,737
近
住
宅
44,529
32.7%
45,209
26.1%
680
中
13,333
7.7%
6,873
九
海
建築
事
務
宿
教
育
研
究
6,459
4.7%
医
療
福
祉
1,871
1.4%
1,355
0.8%
△515
他
11,984
8.8%
12,179
7.0%
194
136,358
100.0%
173,198
100.0%
36,839
所
2,728
16.2%
11,617
51.3%
8,889
そ
の
建築(新築)
事
務
宿
泊
1,503
8.9%
272
1.2%
△1,231
店舗・娯楽
4,886
29.0%
3,306
14.6%
△1,580
工
場
1,562
9.3%
2,000
8.8%
438
倉
庫
0
0.0%
243
1.1%
243
水
207
道
店舗・娯楽
教
下
水
■地域別(建築・土木)
海
部
・
国
・
州
・
北
四
沖
合
外
280
0.1%
13
0.0%
△266
計
190,511
100.0%
240,600
100.0%
50,089
※2025年3月期までは本支店ごとに区分しておりましたが、2026年3月期より施工場所ごとに区分しております。
■規模別(建築・土木)
2025/3期
件数
5
億
円
未
実績
満
106
6,011
2026/3期
構成比
件数
3.2% 101
実績
4,813
構成比
前期比
2.0%
△1,198
宅
2,314
13.8%
1,013
4.5%
△1,301
5億以上
10 億未満
27
11,409
6.0%
16
4,857
2.0%
△6,552
教
育
研
究
2,182
13.0%
2,277
10.1%
94
10 億以上
30 億未満
64
58,592
30.8%
62
55,595
23.1%
△2,997
医
療
福
祉
97
0.6%
1,316
5.8%
1,219
30 億以上
50 億未満
23
53,770
28.2%
26
70,837
29.4%
17,067
他
1,550
9.2%
582
2.6%
△967
50
以
上
13
60,726
31.9%
17 104,496
43.4%
43,769
16,826
100.0%
22,630
100.0%
5,803
合
計
233
190,511
100.0% 222 240,600
100.0%
50,089
住
そ
の
建築(リニューアル)
億
© 2026 Asanuma Corporation.
45
Appendix (別紙) 12/15
中期3ヵ年計画業績・キャッシュアロケーション
⚫ 中期3ヵ年計画の3年間において生み出されるキャッシュ約180~200億円については、投資・株主還元に配分
Cash In
Cash Out
(2024~2026年度)
(2024~2026年度)
詳細
投資
63億円程度
•
今中期3ヵ年計画の投資は70億円を計画していたが、
2026年5月19日開示のM&Aの金額が固まったことに
より3年間の投資額は63億円へと変更見込み
•
主な投資領域はリニューアル事業、DX、技術の強化
投資計画(2024~2026年度)
投資
投資内容
①リニューアル事業の強化
事業上
生み出される
キャッシュ
180-200億円
(当初計画)
株主還元
117億円程度
•
株主還元
2024
2025
2026
(単位:億円)
実績
実績
計画
63
54
30
3
30
27
1
25
国内リニューアルブランド
「ReQuality」の推進
ASEAN地域での
リニューアル事業の強化
12
0
1
11
42
28
0
14
②DX推進・システム基盤強化
8
2
2
4
③技術の増強
(技術研究所改築、技術開発)
1
0
1
中期3ヵ年計画の株主還元方針である配当性向
70%以上を維持し、配当額は当初計画より増配
2024
2025
2026
実績
実績
計画
1株あたり配当(単位:円)
41.0
45.0
45.0
第2四半期末
15.0
16.0
17.0
期末
26.0
29.0
28.0
45
34
37
配当総額
(単位:億円)
© 2026 Asanuma Corporation.
46
Appendix (別紙) 13/15
テーマ毎のKPIの進捗
⚫ 各テーマにおいてKPIを設定。2025年度実績は、2026年度末目標に向け概ね良好な水準。一部目標達成している
テーマもあるが、引続き同水準を維持
財務・非財務 KPI
テーマ
1
2
3
4
5
DX
国内コア事業
の強化
顧客満足度
スコア
リニューアル
事業の強化
連結営業利益における
リニューアル営業利益
80点以上
(直近2期平均)
40%以上
80.6点
2025年度実績に関する補足
• 前年に引き続き、高水準を維持(前年比+0.7点)
※2024・2025年度平均
※3月末時点受領分より算出
49.2%
• 2023年度の国内リニューアルにおいて受注した
大型案件や、期中内の利益率良好な案件が、
2025年度営業利益に寄与
人材の獲得・
確保・育成
エンゲージメント
スコア
70点以上
72.8点
• 前年比+3.2点
• 「今の会社で働くことができて本当に良かったと
思う」「今の仕事をしているときは、楽しいと感じ
る」等の項目においてスコアが上昇
DX推進
労働1時間あたりの
売上総利益
6,000円以上
7,287円
• 売上総利益の上昇
ガバナンス・
コンプライアンス・
リスク管理の強化
重大な法令違反件数
0件
0件
死亡災害
0件
1件
Scope
6
2025年度実績
2026年度末目標
(3年間で注力すること)
環境・社会への
貢献
CO2排出量
総量削減率
15.8%
△
△
17.4%
1+2
(2023年度比)
Scope
△
△
(2023年度比)
(2023年度比)
3
9.4%
(2023年度比)
4.6%
• 監督官庁に労働災害再発防止対策書を提出
• 全役職員を対象に安全教育をあらためて徹底
• 作業手順の見直しや管理体制の強化等を含めた
実効性ある再発防止策に継続的に取り組む
• Scope1+2は目標達成しているが引続き同水
準を維持
• Scope3は順調に推移
© 2026 Asanuma Corporation.
47
Appendix (別紙) 14/15
KPIの算出方法・過去実績
テーマ
(3年間で注力すること)
財務・非財務 KPI
算出方法・過去実績
⚫ 工事成績評定受領先(官庁工事が主)
•
アンケート実施先
評定の点数を顧客満足度スコアとする
⚫ 顧客満足度アンケート実施先(民間工事が主)
顧客満足度
スコア
1
国内コア事業
の強化
•
算出
方法
80点以上
(直近2期平均)
•
過去
実績
連結営業利益における
リニューアル営業利益
2
リニューアル
事業の強化
40%以上
エンゲージメント
スコア
3
人材の獲得・
確保・育成
•
70点以上
算出
方法
過去
実績
算出
方法
過去
実績
各設問における回答を右表の通りのスコアに読み替え、
平均値を算出
工事成績評定受領先のスコアとの乖離を埋めるため、
上記にて算出した平均値に0.85の掛け目をつけて補正
(掛け目は過去実績に基づき算出)
アンケート
回答
スコアへの
換算
満足
100点
やや満足
85点
普通
70点
やや不満
55点
不満
40点
当該年度のアンケート結果を全て受領するまで
時間を要すため、当該年度の評価は、当該年度および前年度の2期平均値を適用
⚫ 2022・2023年度平均: 79.7点
⚫ 2023・2024年度平均: 79.9点
⚫ 2024・2025年度平均: 80.6点
⚫ リニューアル営業利益(国内・国外)÷連結営業利益
(海外リニューアル営業利益についてはのれん金額をマイナス)
⚫ 今後のASEANリニューアル会社M&Aを加味した数字
⚫ 2023年度: 68% (シンガポール子会社の業績が好調だったものによる)
⚫ 2024年度: 45.3%
⚫ 2025年度: 49.2%
⚫ ストレスチェック(全社員対象)において、エンゲージメントに関わる4項目の設問で、
回答の4段階の内、上位2つ(下記①②)の割合を点数化
回答 : ①とても当てはまる ②まあまあ当てはまる ③あまり当てはまらない ④全く当てはまらない
⚫ 2023年度: 68.1点
⚫ 2024年度: 69.6点
⚫ 2025年度: 72.8点
© 2026 Asanuma Corporation.
48
Appendix (別紙) 15/15
テーマ
(3年間で注力すること)
4
財務・非財務 KPI
DX
労働1時間あたりの
売上総利益
DX推進
6,000円以上
算出方法・過去実績
算出
方法
過去
実績
⚫ 売上総利益(連結)÷全社員の労働時間(個別)
⚫ 2023年度: 5,230 円 /労働1時間あたり
⚫ 2024年度: 6,722 円/ 労働1時間あたり
⚫ 2025年度: 7,287 円/ 労働1時間あたり
⚫ 重大な法令違反件数
• 「重大な法令違反」に法的な定義はないことから、当社では原則として下記の通り定義付ける
(但し個別性が高いため案件毎に都度判断)
重大な法令違反件数
0件
算出
方法
5
ガバナンス・
コンプライアンス・
リスク管理の強化
CO2排出量総量削減率
► 刑事上・行政上の処分(公表されるもの)を受けるに至った法令違反
⚫ 死亡災害件数
死亡災害
0件
► 社会や自社に多大な影響を与える法令違反
•
過去
実績
算出
方法
1回の災害で複数名亡くなれば、その人数を件数としてみなす(行政報告等のルールに準拠)
2023年度
2024年度
2025年度
重大な法令違反
0件
0件
0件
死亡災害
1件
0件
1件
⚫ 元より設定していた2030年度・2050年度目標より逆算し、2026年度目標を設定
(%は基準年度対比での削減率)
対象
Scope 1+2
Scope 1+2
△15.8%
6
(2023年度比)
環境・社会への
貢献
Scope 3
過去
実績
△9.4%
(2023年度比)
Scope 1+2
(建設工事のみ対象)
Scope 3
Scope 3
カテゴリ11
(自社設計+他社設計)
*1 完工高1億円当たりの排出量
*2 中期計画(2026年度)は、基準年度から中期目標までの直線上での数値にて目標を設定
単位
総量
基準年度
年度
t-CO2
(SBT認定)
t-CO2
原単位
2023
/億円*1
総量
t-CO2
総量
t-CO2
2023
総量
t-CO2
実績
計画*2
中期目標
参考 :
CO2のカテゴリー
排出量
2024年度 2025年度 2026年度 2035年度
25,017
21,618
▲13.6%
20,666
▲17.4%
21,077
▲15.8%
9,256
▲63.0%
15.7
12.6
▲19.7%
11.8
▲24.6%
13.2
▲15.8%
5.8
▲63.0%
事業活動で発生するCO2
22,205
19,557
▲11.9%
18,720
▲15.7%
18,708
▲15.8%
8,216
▲63.0%
電気ガスの使用による
間接排出のCO2
999,942
(SBT認定)
実績
737,745 954,227 906,197 624,964
▲26.2%
▲4.6%
▲9.4% ▲37.5%
366,658 608,250 581,752 401,208
641,933
▲42.9%
▲5.2%
▲9.4% ▲37.5%
Scope1
Scope2
Scope3 カテゴリ11
お客様にお引渡しした
建築物の使用時に
排出されるCO2
© 2026 Asanuma Corporation.
49
MEMO
© 2026 Asanuma Corporation.
50
MEMO
© 2026 Asanuma Corporation.
51
お問合せ先
株式会社淺沼組
戦略企画本部
コーポレート・コミュニケーション部
MAIL
[email protected]
TEL
06-6585-5500
FAX
06-6585-5556
淺沼組統合報告書2025
コーポレートインスタグラム
https://www.asanuma.co.jp/csr/report.html
https://www.asanuma.co.jp/csr/report.html
本資料に掲載しております計画、予測または見通しなど将来に関する事項は、本資料の発表日現在における当社の戦略、目標、前提または
仮定に基づいており、実際の業績は、様々な要素により記載の計画、予測または見通しなどと異なる結果となる可能性があります。