|
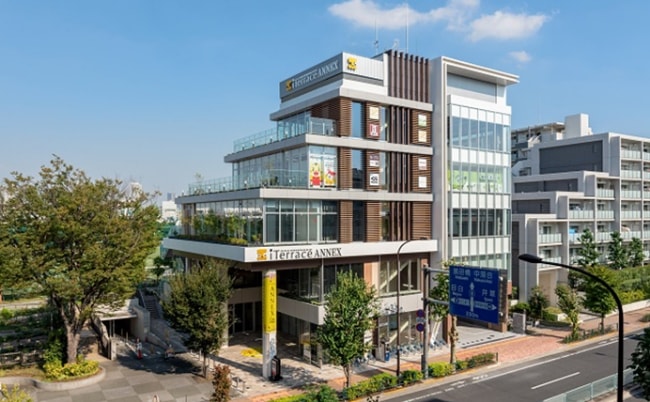
ICHIKEN Co., Ltd. is a construction and real estate company. The group operates through two main business segments: construction and real estate. In the construction segment, the company and its subsidiaries engage in general construction activities, including building, civil engineering, paving, and interior finishing works. The real estate segment involves property trading and leasing. The company's group structure includes a consolidated subsidiary, Kataoka Kogyo Co., Ltd., and a non-consolidated subsidiary, ICHIKEN VIETNAM CONSTRUCTION CO.,LTD. Additionally, it holds an equity-method investment in PFI Narita Smart Wellness Co., Ltd. The company also identifies Maruhan Co., Ltd. as a related party. Summarised from the annual report, fiscal year ended Mar 2026 |
Industry Engineering & Construction | Homepage ichiken.co.jp |
| Sector Industrials | IR page ichiken.co.jp | |
|
Tags
general construction, civil engineering, paving, interior finishing, real estate trading, property leasing, Kataoka Kogyo Co. Ltd., ICHIKEN VIETNAM CONSTRUCTION CO. LTD., PFI Narita Smart Wellness Co. Ltd., Maruhan Co. Ltd.
|
Press page ichiken.co.jp/news |
Metrics
| Valuation | |
|---|---|
| Market cap | ¥ 49.461B |
| Market cap (USD) | $ 309.135M |
| P/E | 5.48 |
| PEG | 0.10 |
| P/BV | 1.12 |
| P/S | 0.43 |
| P/OCF | 9.25 |
| P/FCF | 10.52 |
| Dividend yield | 6.8% |
| Turnover / mcap | — |
| Returns | |
|---|---|
| ROE | 17.3% |
| ROI | 13.9% |
| ROIC | 13.8% |
| Profit margin | 6.0% |
| Growth | |
|---|---|
| Revenue growing | Yes |
| Profits growing | Yes |
| Revenue up 3y | Yes |
| Revenue up 5y | No |
| Earnings growth 3y (net profit CAGR) | 55.4% |
| Quality | |
|---|---|
| Profitable | Yes |
| Margin expanding | Yes |
| Buying back stock | No |
| Diluting (TTM) | — |
| Debt/Equity | — |
| Podcast bulls (TTM) | Sign up |
| Podcast bears (TTM) | Sign up |
| Podcast sentiment (TTM) | Sign up |
| Podcast sentiment % (TTM) | Sign up |
| News sentiment (TTM) | 28 |
| Quality score | 58.8% |
| Insiders | |
|---|---|
| Buys, 1w | Sign up |
| Buys, 1m | Sign up |
| Buys, 1y | Sign up |
| Sells, 1w | Sign up |
| Sells, 1m | Sign up |
| Sells, 1y | Sign up |
Sign up to see this company's insider trades
| Figure | FY 2026 | FY 2025 | FY 2024 | FY 2023 | FY 2022 | FY 2021 | FY 2020 | FY 2019 | FY 2018 | FY 2017 | FY 2016 | FY 2015 | FY 2014 | FY 2013 |
|---|---|---|---|---|---|---|---|---|---|---|---|---|---|---|
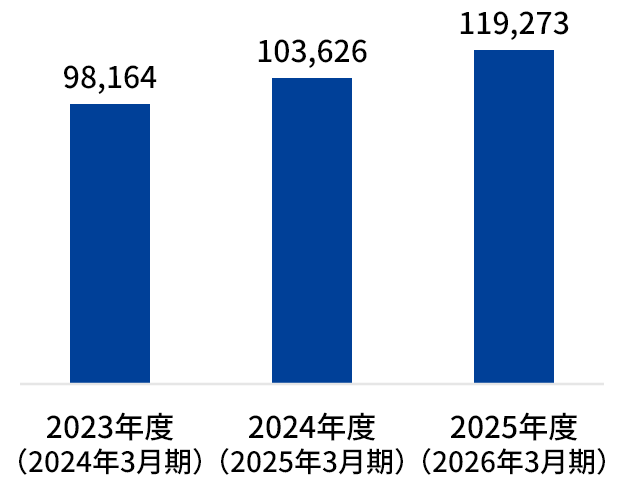
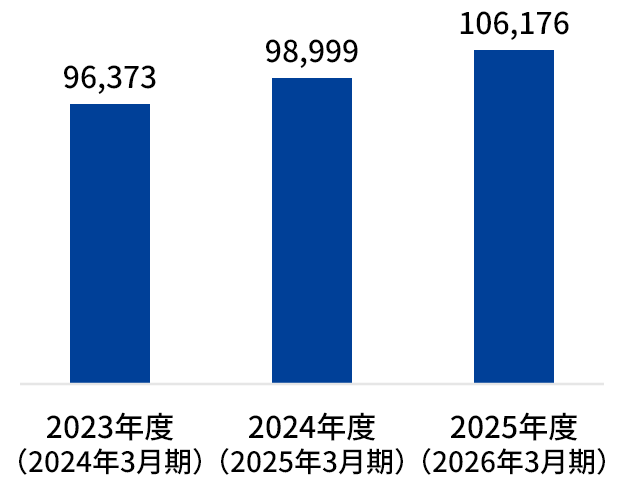
| Revenue | 106.176B | 98.999B | 96.373B | 88.059B | 83.776B | 88.624B | 86.513B | 93.824B | 82.027B | 81.495B | 71.778B | 67.73B | 62.424B | 57.62B |
| Net profit | 6.408B | 4.697B | 2.938B | 1.708B | 2.985B | 3.161B | 2.915B | 3.157B | 3.555B | 3.048B | 2.311B | 1.043B | 739M | 270M |
| Free cash flow | -3.866B | 8.027B | 1.797B | 1.227B | 650M | 236M | -1.803B | -9.316B | 12.117B | 1.466B | 398M | — | — | — |
| Figure | FY 2026 | FY 2025 | FY 2024 | FY 2023 | FY 2022 | FY 2021 | FY 2020 | FY 2019 | FY 2018 | FY 2017 | FY 2016 | FY 2015 | FY 2014 | FY 2013 |
|---|---|---|---|---|---|---|---|---|---|---|---|---|---|---|
| Share price | 2.522K | 2.78K | 2.51K | 1.789K | 1.851K | 2.049K | 1.206K | 1.874K | 2.404K | 437.53 | 1.598K | 1.567K | 845.17 | 173.19 |
| Price performance 12m | -0.09 | 0.11 | 0.4 | -0.03 | -0.1 | 0.7 | -0.36 | -0.22 | 4.5 | -0.73 | 0.02 | 0.85 | 3.88 | — |
Filed figures
Lines the statements and their notes report beside the headline figures, read from the filings' XBRL as filed (no restatement applied), with figures computed from one filing's own lines. Cash-flow lines carry their cash direction: an outflow is negative. Each period links to its filing; a figure's period, report date and tag are in its tooltip.
| Figure | Mar 2017 | Mar 2018 | Mar 2019 | Mar 2020 | Mar 2021 | Mar 2022 | Mar 2023 | Mar 2024 | Mar 2025 | Mar 2026 |
|---|---|---|---|---|---|---|---|---|---|---|
| Balance sheet detail | ||||||||||
| Trade receivables (JPY) | 6.71B | 2.25B | 4.34B | 2.81B | 2.04B | 7.79B | 375M | 4.3B | 3.3B | 3.89B |
| ↳ YoY growth | +41.5% | -66.5% | +93.1% | -35.3% | -27.3% | +282.2% | -95.2% | +1,047.2% | -23.2% | +17.9% |
| ↳ 5y CAGR | -15.5% | +3.0% | -30.1% | -0.2% | +3.3% | +13.8% | ||||
| Other receivables (JPY) | 62M | 71M | 69M | 140M | 82M | 101M | 47M | 57M | — | — |
| Borrowings, current (JPY) | 1.49B | 1.52B | 1.46B | 2.31B | 1.51B | 1.53B | 1.61B | 3.65B | 1.92B | 1.89B |
| Borrowings, non-current (JPY) | 1.89B | 1.85B | 1.92B | 3.87B | 4.53B | 4.36B | 4.15B | 1.97B | 4.66B | 4.15B |
| Lease liabilities (JPY) | 12M | 13M | 10M | 17M | 14M | 6M | 30M | 99M | 153M | 94M |
| Cash and deposits (JPY) | 9.06B | 21.6B | 11.8B | 12.2B | 11.8B | 11.7B | 11.7B | 13B | 20B | 14.7B |
| Intangible assets (JPY) | 178M | 204M | 214M | 156M | 92M | 127M | 109M | 125M | 1.23B | 1.11B |
| Net debt (borrowings + leases - cash) (JPY) | -5.67B | -18.2B | -8.38B | -5.96B | -5.78B | -5.75B | -5.87B | -7.31B | -13.2B | -8.54B |
| Cash flow detail | ||||||||||
| Operating cash flow (JPY) | 1.69B | 12.3B | -8.08B | 3.62B | 543M | 757M | 1.28B | 1.88B | 8.14B | -3.23B |
| Purchases of property, plant and equipment (JPY) | -150M | -119M | -1.21B | -5.38B | -294M | -30M | -40M | -32M | -32M | -532M |
| Purchases of intangible assets (JPY) | -72M | -63M | -31M | -50M | -13M | -77M | -9M | -53M | -85M | -102M |
| Change in receivables (cash effect) (JPY) | -7.21B | 4.94B | -9.94B | 10.1B | 186M | — | — | — | — | — |
| Change in payables (cash effect) (JPY) | 7.75B | 0.00 | 3.27B | -10.4B | -3.92B | 2.93B | -863M | 5.28B | -7.58B | 3.27B |
| Dividends paid (cash effect) (JPY) | -289M | -325M | -577M | -578M | -650M | -651M | -1.01B | -759M | -832M | -1.12B |
| Interest paid (cash effect) (JPY) | -48M | -42M | -46M | -57M | -86M | -77M | -75M | -90M | -106M | -105M |
| Income taxes paid (cash effect) (JPY) | -1.5B | -1.44B | -1.14B | -1.39B | -1.34B | -1.61B | -1.6B | -302M | -1.17B | -2.89B |
| Operating cash flow before change in receivables (JPY) | 8.9B | 7.36B | 1.86B | -6.44B | 357M | — | — | — | — | — |
| Free cash flow (OCF - PPE - intangibles) (JPY) | 1.47B | 12.1B | -9.32B | -1.8B | 236M | 650M | 1.23B | 1.8B | 8.03B | -3.87B |
| Income detail | ||||||||||
| Total comprehensive income (JPY) | — | — | — | — | — | — | — | — | 4.85B | 7.08B |
| Comprehensive income to owners (JPY) | — | — | — | — | — | — | — | — | 4.85B | 7.08B |
| Provision for credit losses (JPY) | 1M | — | — | 1M | 1M | 1M | — | — | — | — |
| Credit cost ratio (credit losses / average receivables) (%) | 0.0% | — | — | 0.0% | 0.0% | 0.0% | — | — | — | — |
| Reported | Jun 28, 2017 | Jun 27, 2018 | Jun 26, 2019 | Jun 26, 2020 | Jun 25, 2021 | Jun 28, 2022 | Jun 28, 2023 | Jun 26, 2024 | Jun 26, 2025 | Jun 18, 2026 |
Sign up to see institutional holdings
Sign UpPodcast Mentions
Sign up to see podcast mentions and sentiment
Sign UpTimely disclosures published on TDnet, newest first, titles as filed in Japanese. The link opens the disclosure on TDnet. Filings with EDINET (periodic reports, extraordinary reports, offerings, holding and buy-back reports), newest first, titles as filed in Japanese. The link opens the filing on EDINET. Press releases from the company's own website, newest first.
2026 年 10 月 30 日
【相模原市立北市民健康文化センター改修整備・運営事業】の 事業者に選定されました 総合建設業の株式会社イチケン(本社:東京都港区港南、代表取締役社長:政清弘晃)は、この度、相模原 市が実施する「相模原市立北市民健康文化センター改修整備・運営事業」(DBO 方式)において、当社を代表企 業とするグループが事業者に選定されましたのでお知らせいたします。
事業名称
相模原市立北市民健康文化センター改修整備・運営事業
事業地
相模原市緑区下九沢2071番1他
事業期間
令和 8 年 12 月~令和 21 年 3 月(予定) (運営開始予定日:令和 12 年 1 月)
事業内容
既存施設である北市民健康文化センター(屋内プール施設)の改 修整備・運営事業。築 20 年以上の施設なので老朽化の問題や、屋 内施設だが利用者数が季節により偏りがある等の問題を抱えていて、 本リニューアル事業にて質の高い公共サービスの実現、地域全体の魅 力向上に資する施設として運営することを目的とする。
【本件に関する問い合わせ先】株式会社イチケン 事業本部開発営業部小栁・大澤 TEL:03-5931-5621 FAX:03-5931-5629

 人と未来に寄り添う「くらし空間」を。
 公式YouTubeチャンネル
 イチケンについて
 技術・ソリューション
 イチ犬くんの会社紹介
 動画でわかる!イチケン






Prompts
Click prompts to add them under the company line, click again to take one out, then copy the result into your AI chat. Shared by Asian Century Stocks and Uncovered Thai Stocks. Thank you.
ETFs Holding ICHIKEN Co., Ltd.
Exchange-traded funds whose newest published daily portfolio holds one of the company's listings, largest weight first.
| ETF | Weight in ETF | Shares | Market value | As of |
|---|---|---|---|---|
| ORR | 0.20% | 35,782 | $ 710K | Nov 18, 2026 |
| DXIV | 0.00% | 500 | $ 9,959.35 | Nov 12, 2026 |
| DISV | 0.00% | 6,900 | $ 137.439K | Nov 12, 2026 |
| DFIS | 0.00% | 7,200 | $ 143.415K | Nov 12, 2026 |
| DFSI | 0.00% | 700 | $ 13.943K | Nov 12, 2026 |
| DFIC | 0.00% | 9,000 | $ 179.268K | Nov 12, 2026 |
| DFAX | 0.00% | 7,000 | $ 139.431K | Nov 12, 2026 |
| DFAI | 0.00% | 1,400 | $ 27.886K | Nov 12, 2026 |
| AVDV | 0.00% | 27,100 | $ 547.968K | Nov 16, 2026 |