|
Okumura Corporation is a Japanese construction company operating in civil engineering, building construction, and investment development. The civil engineering and building construction segments are conducted by the parent company and its affiliate Ozet Y. The investment development segment includes real estate sales and leasing through subsidiary Taihei Real Estate, and renewable energy power generation and sales through subsidiaries Ishikari Bio Energy and Hirata Bio Energy. The group also engages in PFI projects through subsidiaries such as Suita Minamisenri PFI and affiliates like Swim City Kagoshima, and manufactures construction machinery and equipment through subsidiary Okumura Kikai Seisaku. Founded in 1907 and incorporated in 1938, the company has developed technologies including seismic isolation, shield tunneling, and active noise cancellation. It serves public and private clients in Japan, with projects including the通天閣 tower and various government buildings. Summarised from the annual report, fiscal year ended Mar 2026 |
Industry Engineering & Construction | Homepage okumuragumi.co.jp |
| Sector Industrials | IR page okumuragumi.co.jp/ir | |
|
Tags
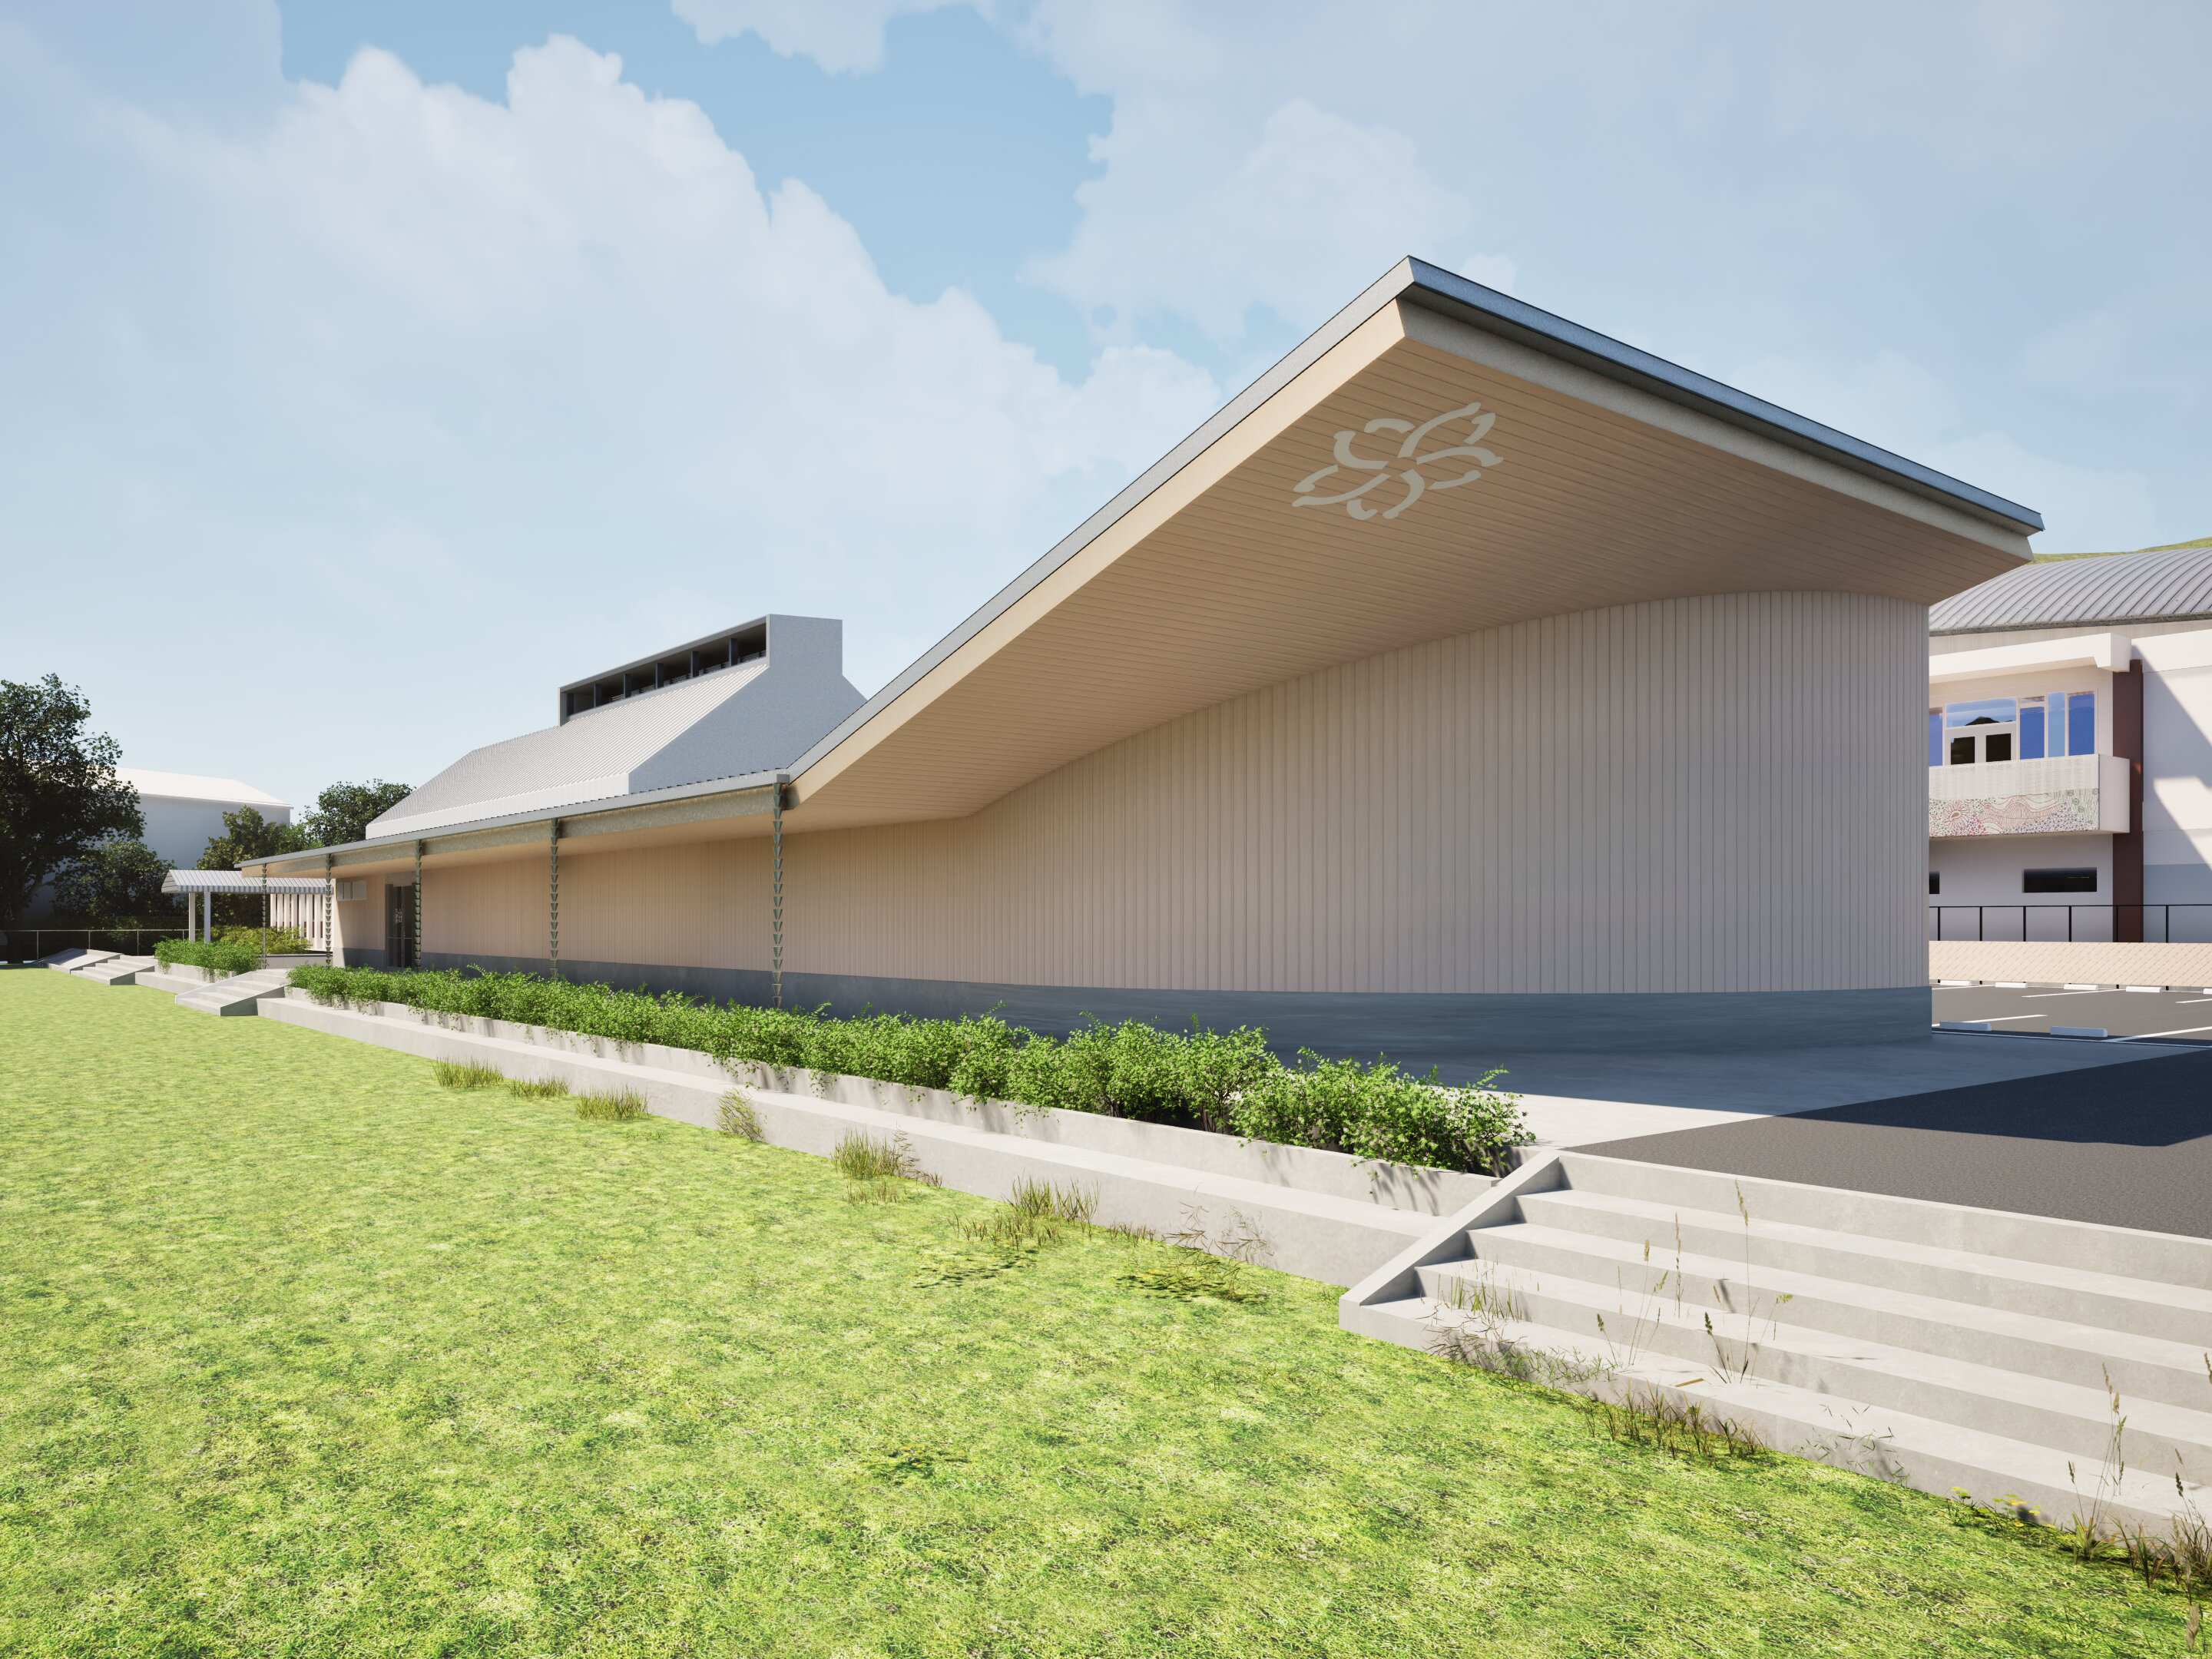
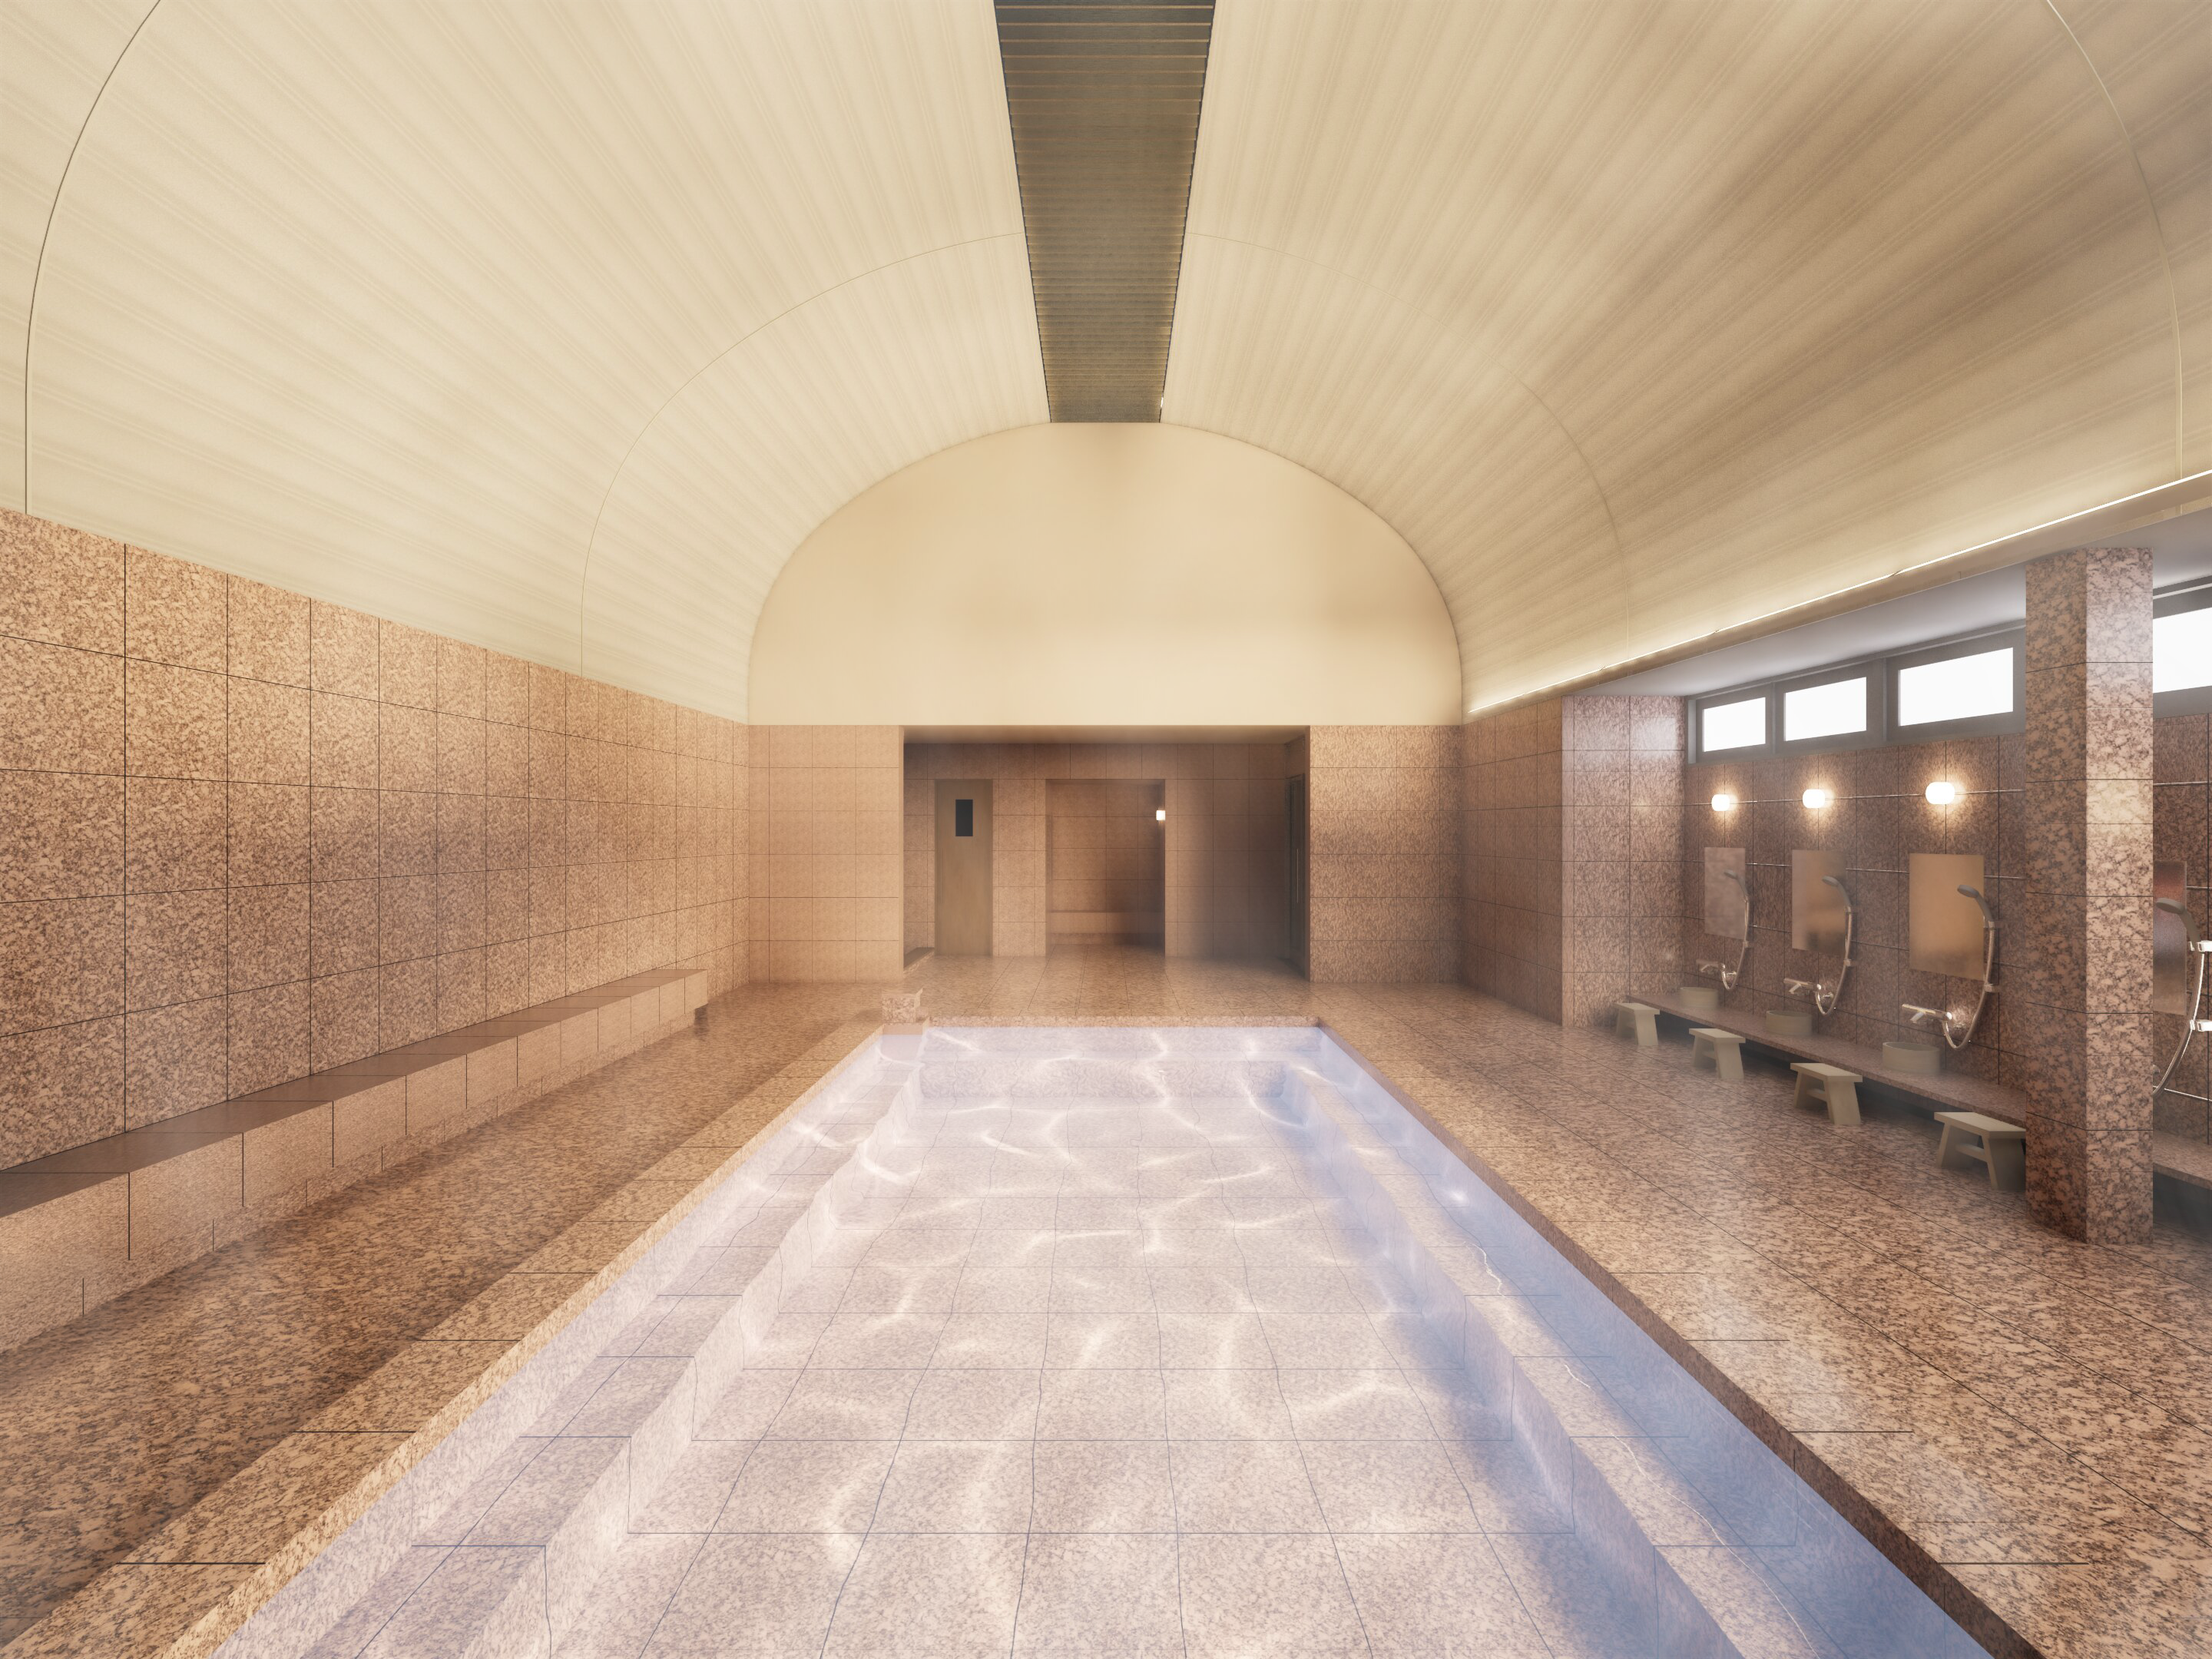
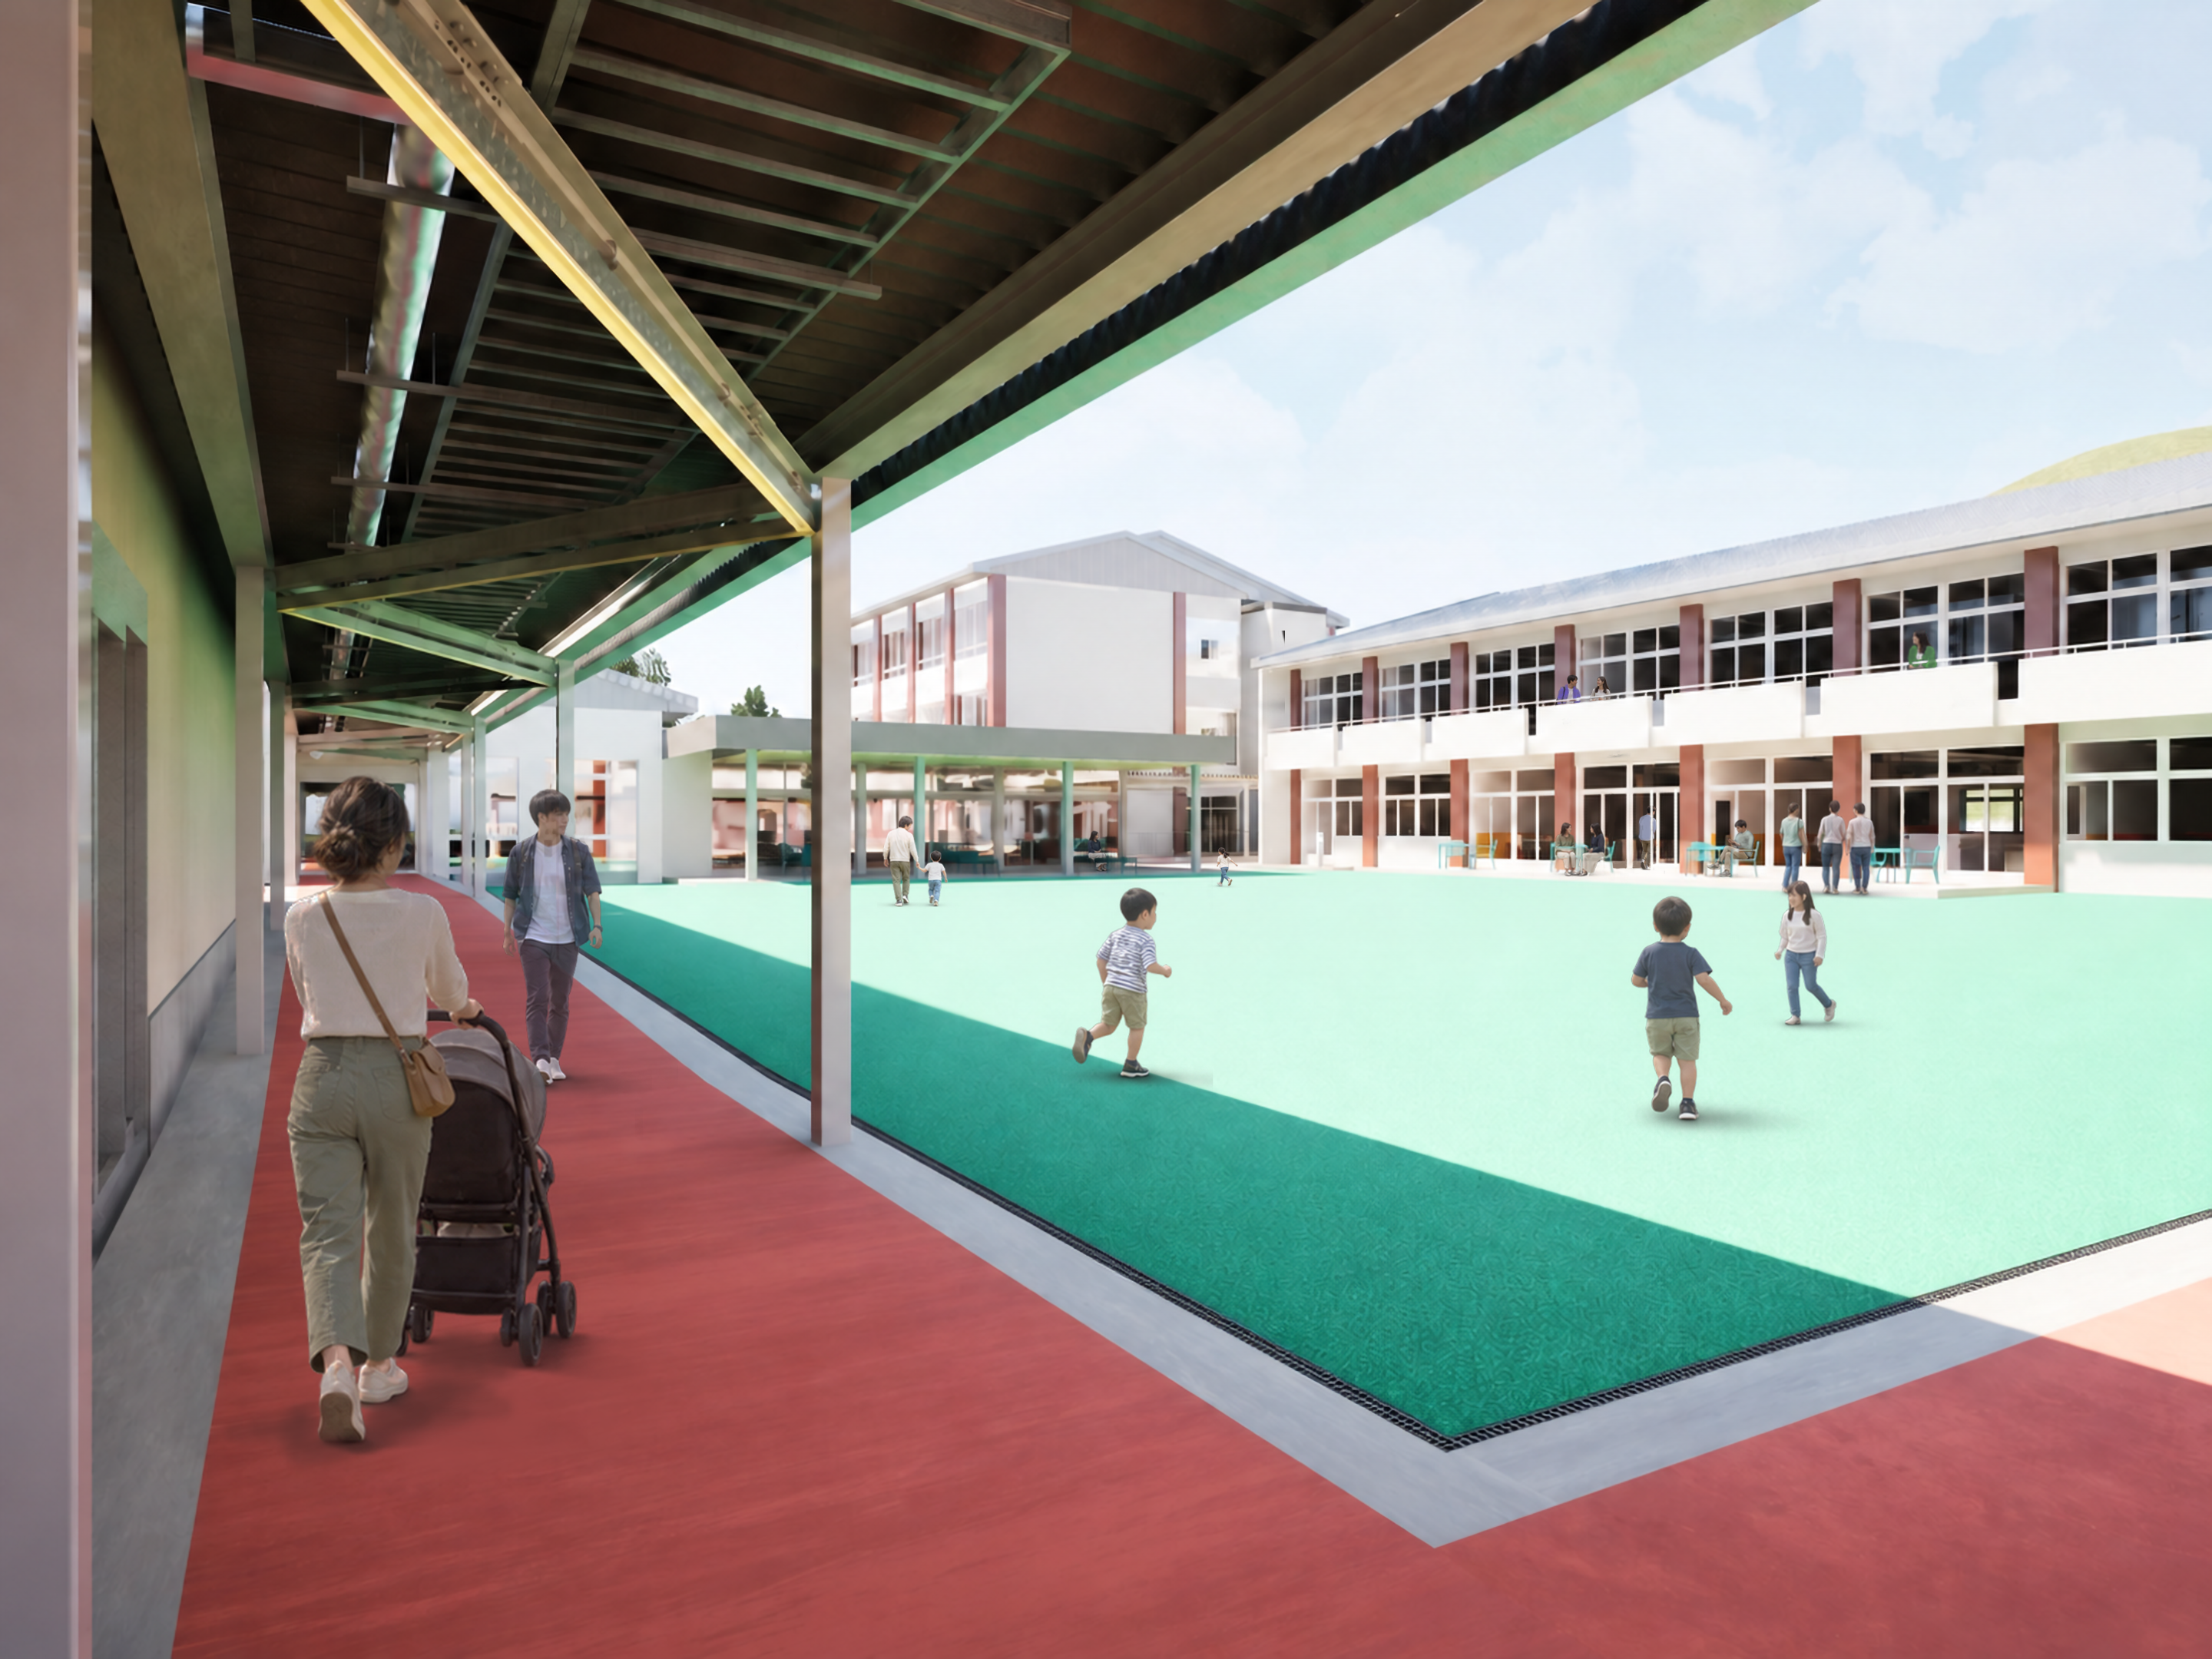
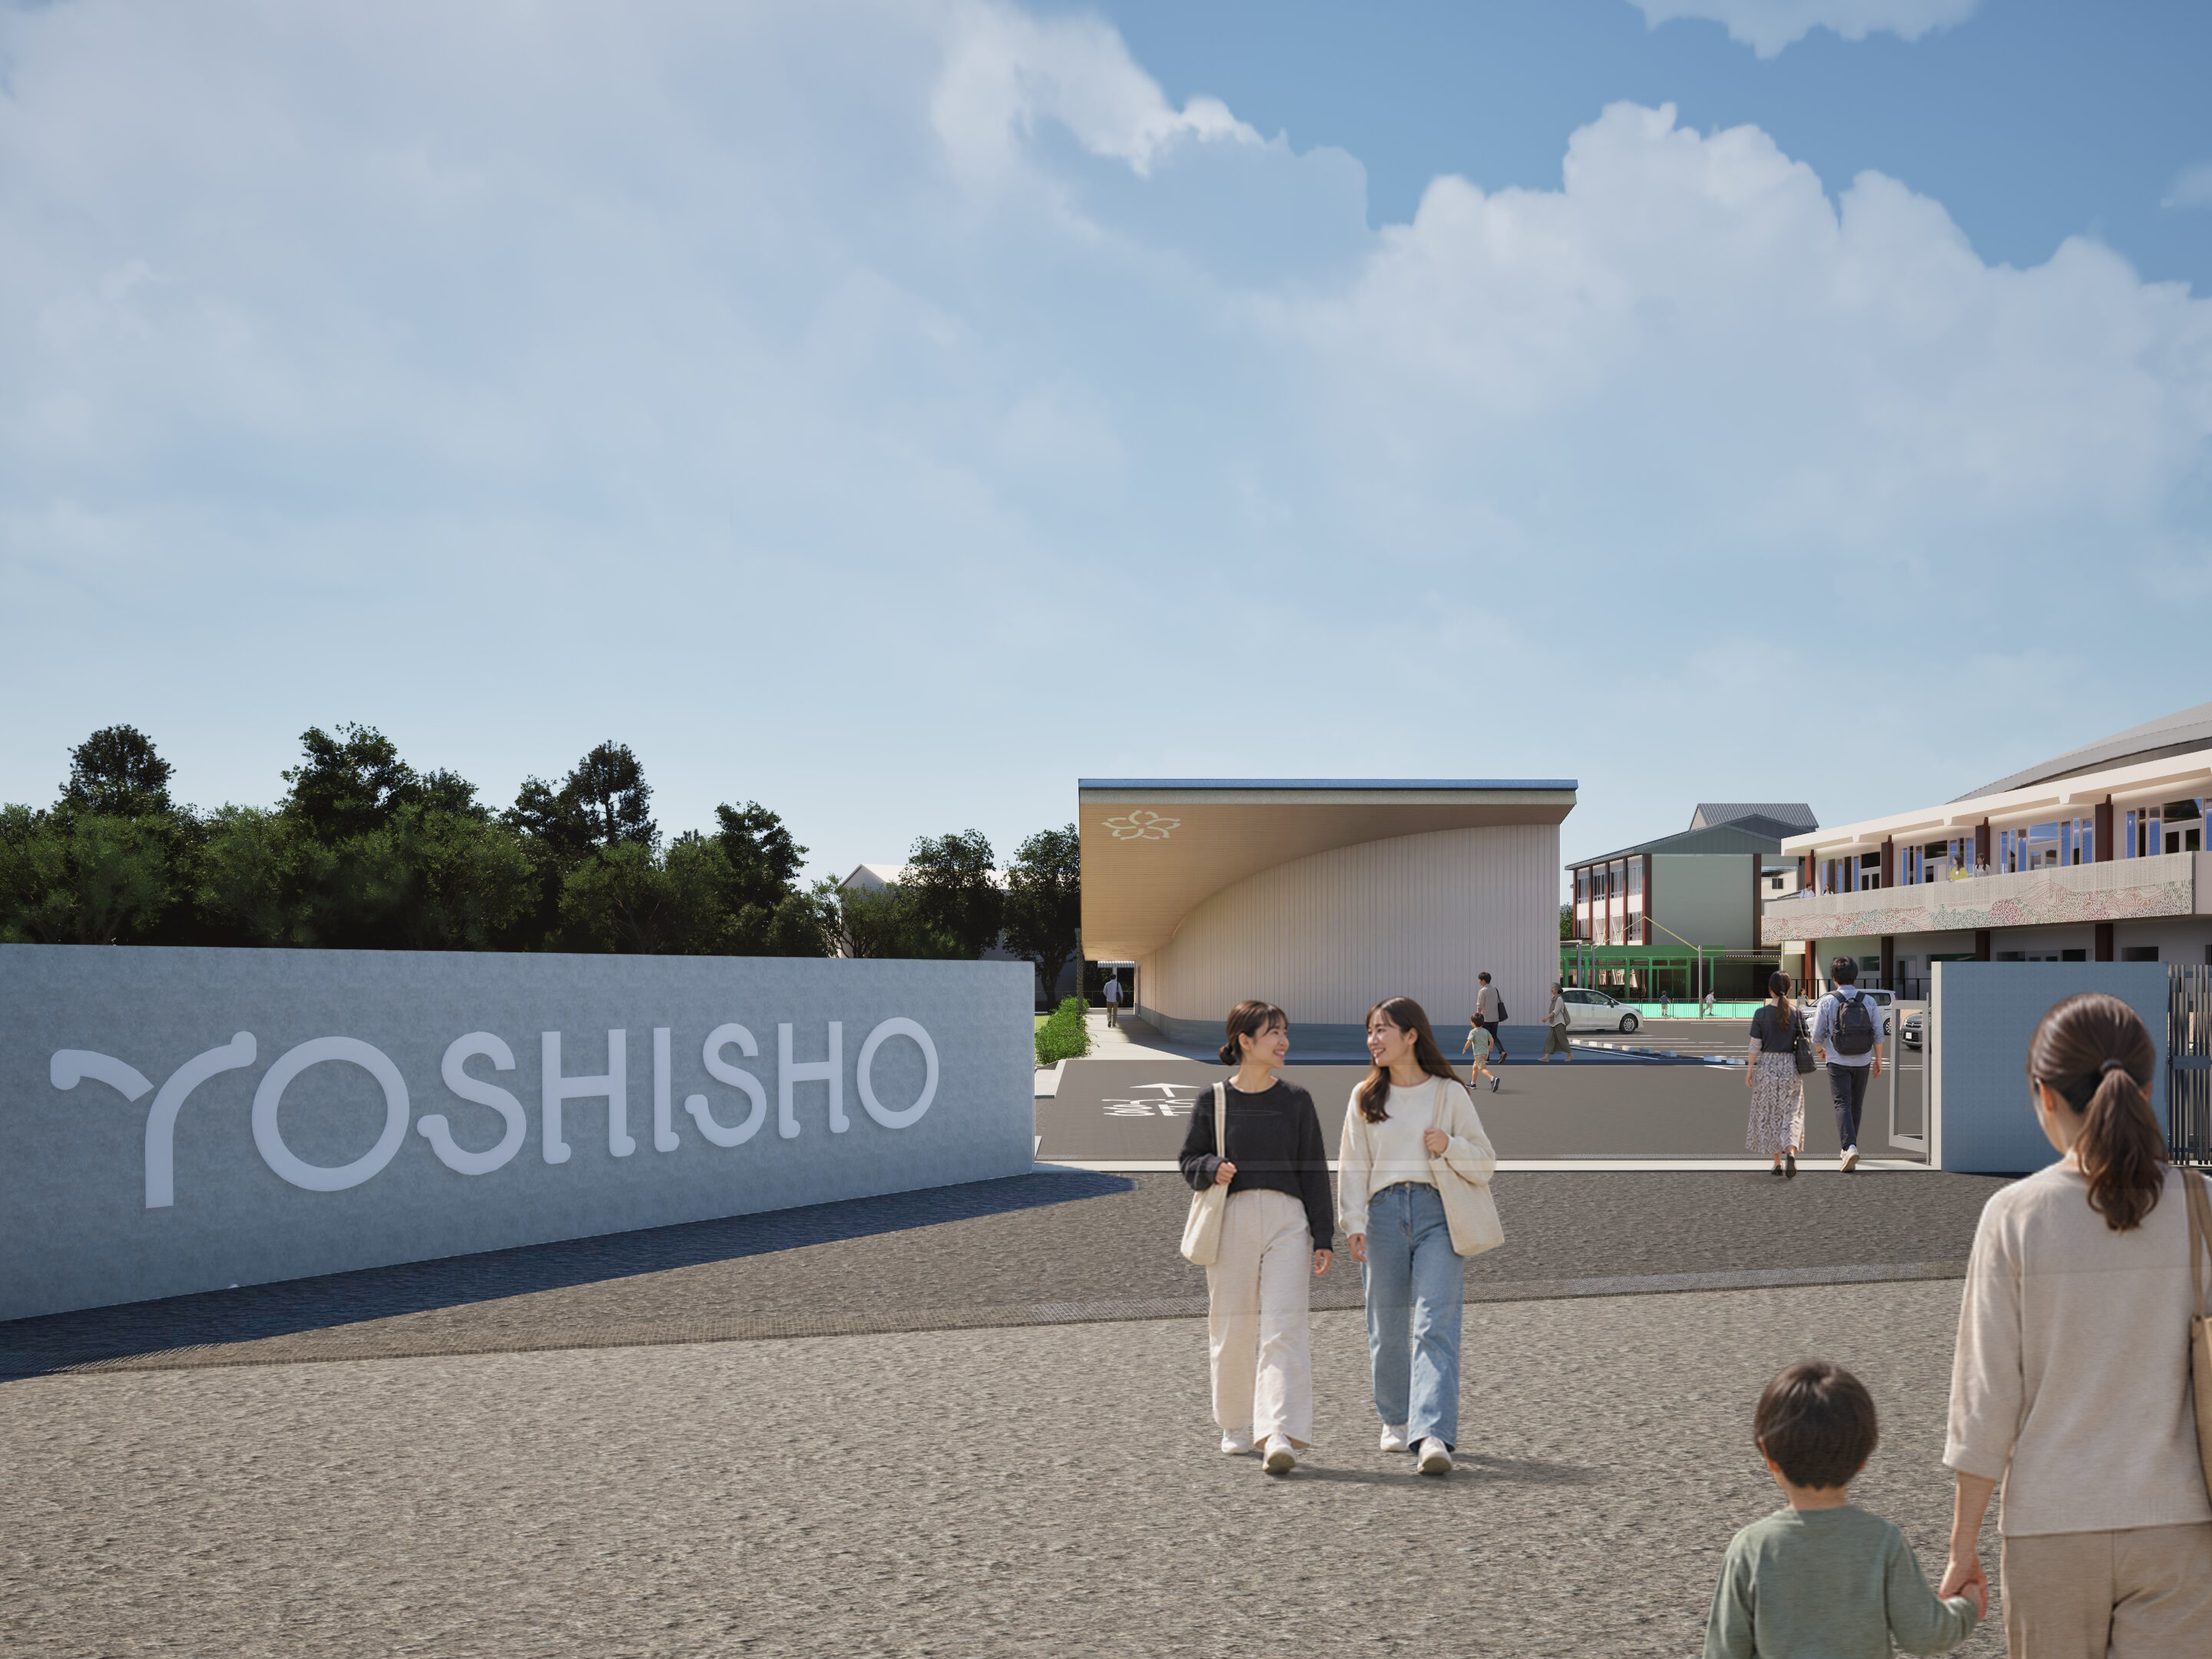
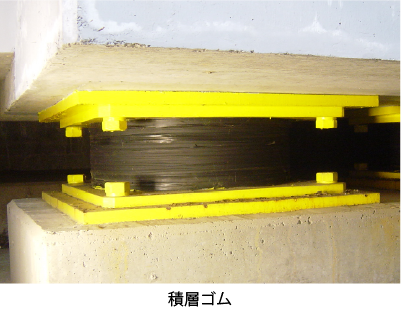
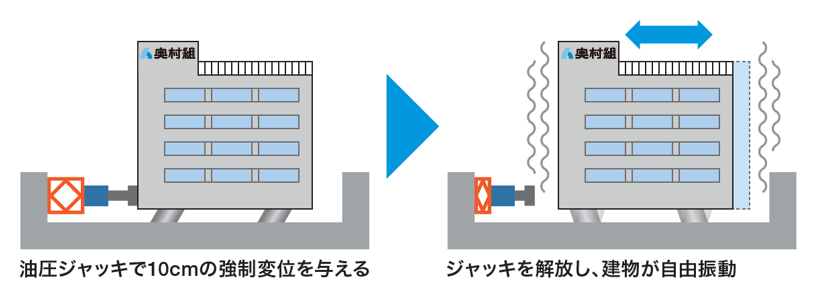
civil engineering, building construction, real estate development, renewable energy, pfi projects, construction machinery, seismic isolation, shield tunneling, wooden architecture, Ozet Y, Taihei Real Estate, Ishikari Bio Energy, Hirata Bio Energy, Okumura Kikai Seisaku, Suita Minamisenri PFI, Swim City Kagoshima, YOSHISHO, Cross Innovation Center, Okumura Memorial Hall
|
Press page okumuragumi.co.jp/ir/news |
Metrics
| Valuation | |
|---|---|
| Market cap | ¥ 211.112B |
| Market cap (USD) | $ 1.323B |
| P/E | 12.45 |
| PEG | 0.70 |
| P/BV | 1.11 |
| P/S | 0.71 |
| P/OCF | -17.32 |
| P/FCF | -7.52 |
| Dividend yield | 5.4% |
| Turnover / mcap | — |
| Returns | |
|---|---|
| ROE | 10.0% |
| ROI | 7.5% |
| ROIC | 5.0% |
| Profit margin | 6.0% |
| Growth | |
|---|---|
| Revenue growing | Yes |
| Profits growing | Yes |
| Revenue up 3y | Yes |
| Revenue up 5y | Yes |
| Earnings growth 3y (net profit CAGR) | 17.7% |
| Quality | |
|---|---|
| Profitable | Yes |
| Margin expanding | Yes |
| Buying back stock | No |
| Diluting (TTM) | No |
| Debt/Equity | — |
| Podcast bulls (TTM) | Sign up |
| Podcast bears (TTM) | Sign up |
| Podcast sentiment (TTM) | Sign up |
| Podcast sentiment % (TTM) | Sign up |
| News sentiment (TTM) | 0 |
| Quality score | 27.8% |
| Insiders | |
|---|---|
| Buys, 1w | Sign up |
| Buys, 1m | Sign up |
| Buys, 1y | Sign up |
| Sells, 1w | Sign up |
| Sells, 1m | Sign up |
| Sells, 1y | Sign up |
Sign up to see this company's insider trades
| Figure | FY 2026 | FY 2025 | FY 2024 | FY 2023 | FY 2022 | FY 2021 | FY 2020 | FY 2019 | FY 2018 | FY 2017 | FY 2016 | FY 2015 | FY 2014 | FY 2013 |
|---|---|---|---|---|---|---|---|---|---|---|---|---|---|---|
| Revenue | 307.202B | 298.222B | 288.146B | 249.442B | 242.458B | 220.712B | 226.371B | 220.884B | 223.927B | 203.09B | 205.291B | 205.268B | 193.024B | 196.554B |
| Net profit | 18.36B | 2.722B | 12.493B | 11.261B | 12.541B | 10.285B | 9.795B | 12.314B | 15.163B | 13.614B | 8.625B | 4.921B | 3.755B | 2.683B |
| Free cash flow | -5.973B | -18.463B | -20.131B | 13.786B | 10.377B | -10.483B | -23.355B | 4.683B | 5B | 42.451B | -1.853B | — | — | — |
| Figure | FY 2026 | FY 2025 | FY 2024 | FY 2023 | FY 2022 | FY 2021 | FY 2020 | FY 2019 | FY 2018 | FY 2017 | FY 2016 | FY 2015 | FY 2014 | FY 2013 |
|---|---|---|---|---|---|---|---|---|---|---|---|---|---|---|
| Share price | 6.312K | 4.251K | 5.088K | 3.128K | 2.977K | 2.938K | 2.24K | 3.505K | 4.196K | 677.39 | 2.978K | 2.812K | 2.302K | 370.26 |
| Price performance 12m | 0.48 | -0.16 | 0.63 | 0.05 | 0.01 | 0.31 | -0.36 | -0.16 | 5.19 | -0.77 | 0.06 | 0.22 | 5.22 | — |
Filed figures
Lines the statements and their notes report beside the headline figures, read from the filings' XBRL as filed (no restatement applied), with figures computed from one filing's own lines. Cash-flow lines carry their cash direction: an outflow is negative. Each period links to its filing; a figure's period, report date and tag are in its tooltip.
| Figure | Mar 2017 | Mar 2018 | Mar 2019 | Mar 2020 | Mar 2021 | Mar 2022 | Mar 2023 | Mar 2024 | Mar 2025 | Mar 2026 |
|---|---|---|---|---|---|---|---|---|---|---|
| Balance sheet detail | ||||||||||
| Trade receivables (JPY) | — | — | — | — | — | 1.72B | 3.01B | 3.66B | 2.67B | 3.47B |
| ↳ YoY growth | +74.5% | +21.8% | -27.0% | +29.7% | ||||||
| Borrowings, current (JPY) | 13.1B | 11.7B | 8.08B | 8.95B | 7.46B | 9.48B | 10.7B | 16.7B | 43.8B | 25.5B |
| Borrowings, non-current (JPY) | 1.16B | 3.14B | 7.12B | 6.02B | 7.11B | 5.11B | 3.11B | 5.11B | 5.01B | 25B |
| Lease liabilities (JPY) | 23M | 10M | 3M | 2M | 1M | 1M | 6M | 21M | 23M | 34M |
| Cash and deposits (JPY) | 43.6B | 45.9B | 34.8B | 26.2B | 21.6B | 33.2B | 40.2B | 30.2B | 28.7B | 17.3B |
| Intangible assets (JPY) | 262M | 280M | 937M | 1.15B | 1.16B | 1.13B | 1.68B | 1.81B | 1.54B | 1.47B |
| Net debt (borrowings + leases - cash) (JPY) | -29.4B | -31.1B | -19.6B | -11.2B | -7.04B | -18.6B | -26.4B | -8.42B | 20.1B | 33.3B |
| Cash flow detail | ||||||||||
| Operating cash flow (JPY) | 45.1B | 8.44B | 9.2B | -11.7B | 23M | 18.3B | 17.9B | -17.1B | -11.8B | 7.62B |
| Purchases of property, plant and equipment (JPY) | -2.66B | -3.44B | -4.52B | -11.6B | -10.5B | -7.91B | -4.11B | -2.99B | -6.64B | -13.6B |
| Change in receivables (cash effect) (JPY) | 15.8B | -15B | 11.2B | -20.7B | -21.7B | 1.13B | 9.84B | -39.9B | -18.2B | -26.9B |
| Change in payables (cash effect) (JPY) | 220M | 154M | -11.4B | 705M | -776M | 4.93B | 3.09B | 1.92B | 2.48B | -441M |
| Dividends paid (cash effect) (JPY) | -4.18B | -6.56B | -7.31B | -7.47B | -5.25B | -6.35B | -6.37B | -8.61B | -10.1B | -7.68B |
| Share buybacks (cash effect) (JPY) | -20M | -35M | -3.38B | -3.69B | -4M | -3.26B | -30M | -13M | -2.71B | -1.61B |
| Interest paid (cash effect) (JPY) | -155M | -135M | -154M | -208M | -283M | -278M | -375M | -445M | -612M | -840M |
| Income taxes paid (cash effect) (JPY) | -870M | -1.79B | -3.98B | -4.15B | -3.28B | -6.99B | -3.39B | -5.4B | -6.61B | -4.34B |
| Operating cash flow before change in receivables (JPY) | 29.3B | 23.4B | -2.05B | 8.96B | 21.7B | 17.2B | 8.06B | 22.7B | 6.42B | 34.5B |
| Free cash flow (OCF - PPE - intangibles) (JPY) | 42.5B | 5B | 4.68B | -23.4B | -10.5B | 10.4B | 13.8B | -20.1B | -18.5B | -5.97B |
| Income detail | ||||||||||
| Research and development expense (JPY) | 865M | 1.08B | 1.34B | 1.44B | 1.67B | 1.63B | 1.77B | 1.8B | 1.77B | 1.87B |
| ↳ 5y CAGR | +16.2% | +13.5% | +10.4% | +6.2% | +4.2% | +2.3% | ||||
| Total comprehensive income (JPY) | 13.9B | 21.4B | 11.4B | -1.71B | 16.7B | 8.58B | 11.3B | 26.9B | -6.37B | 30.7B |
| Comprehensive income to owners (JPY) | 13.9B | 21.4B | 11.4B | -1.67B | 17.9B | 7.54B | 11.3B | 25.2B | 1.34B | 28.8B |
| Provision for credit losses (JPY) | — | — | — | — | — | — | — | 34M | 5M | 177M |
| Credit cost ratio (credit losses / average receivables) (%) | — | — | — | — | — | — | — | 1.0% | 0.2% | 5.8% |
| Segments | ||||||||||
| Real Estate Investment And Development · Segment revenue (JPY) | — | — | 4.71B | 4.83B | 5.14B | 4.87B | 8.15B | 14.2B | 7.91B | 7.26B |
| ↳ YoY growth | +2.5% | +6.4% | -5.1% | +67.3% | +74.8% | -44.5% | -8.3% | |||
| Real Estate Investment And Development · Segment operating income (JPY) | — | — | 2.94B | 2.14B | 2.08B | 2.11B | 1.87B | 2.61B | -2.11B | -730M |
| Reported | Jun 29, 2017 | Jun 28, 2018 | Jun 26, 2020 | Jun 26, 2020 | Jun 29, 2021 | Jun 29, 2022 | Jun 29, 2023 | Jun 27, 2024 | Jun 26, 2025 | Jun 19, 2026 |
Sign up to see institutional holdings
Sign UpPodcast Mentions
Sign up to see podcast mentions and sentiment
Sign UpTimely disclosures published on TDnet, newest first, titles as filed in Japanese. The link opens the disclosure on TDnet. Filings with EDINET (periodic reports, extraordinary reports, offerings, holding and buy-back reports), newest first, titles as filed in Japanese. The link opens the filing on EDINET. Press releases from the company's own website, newest first.












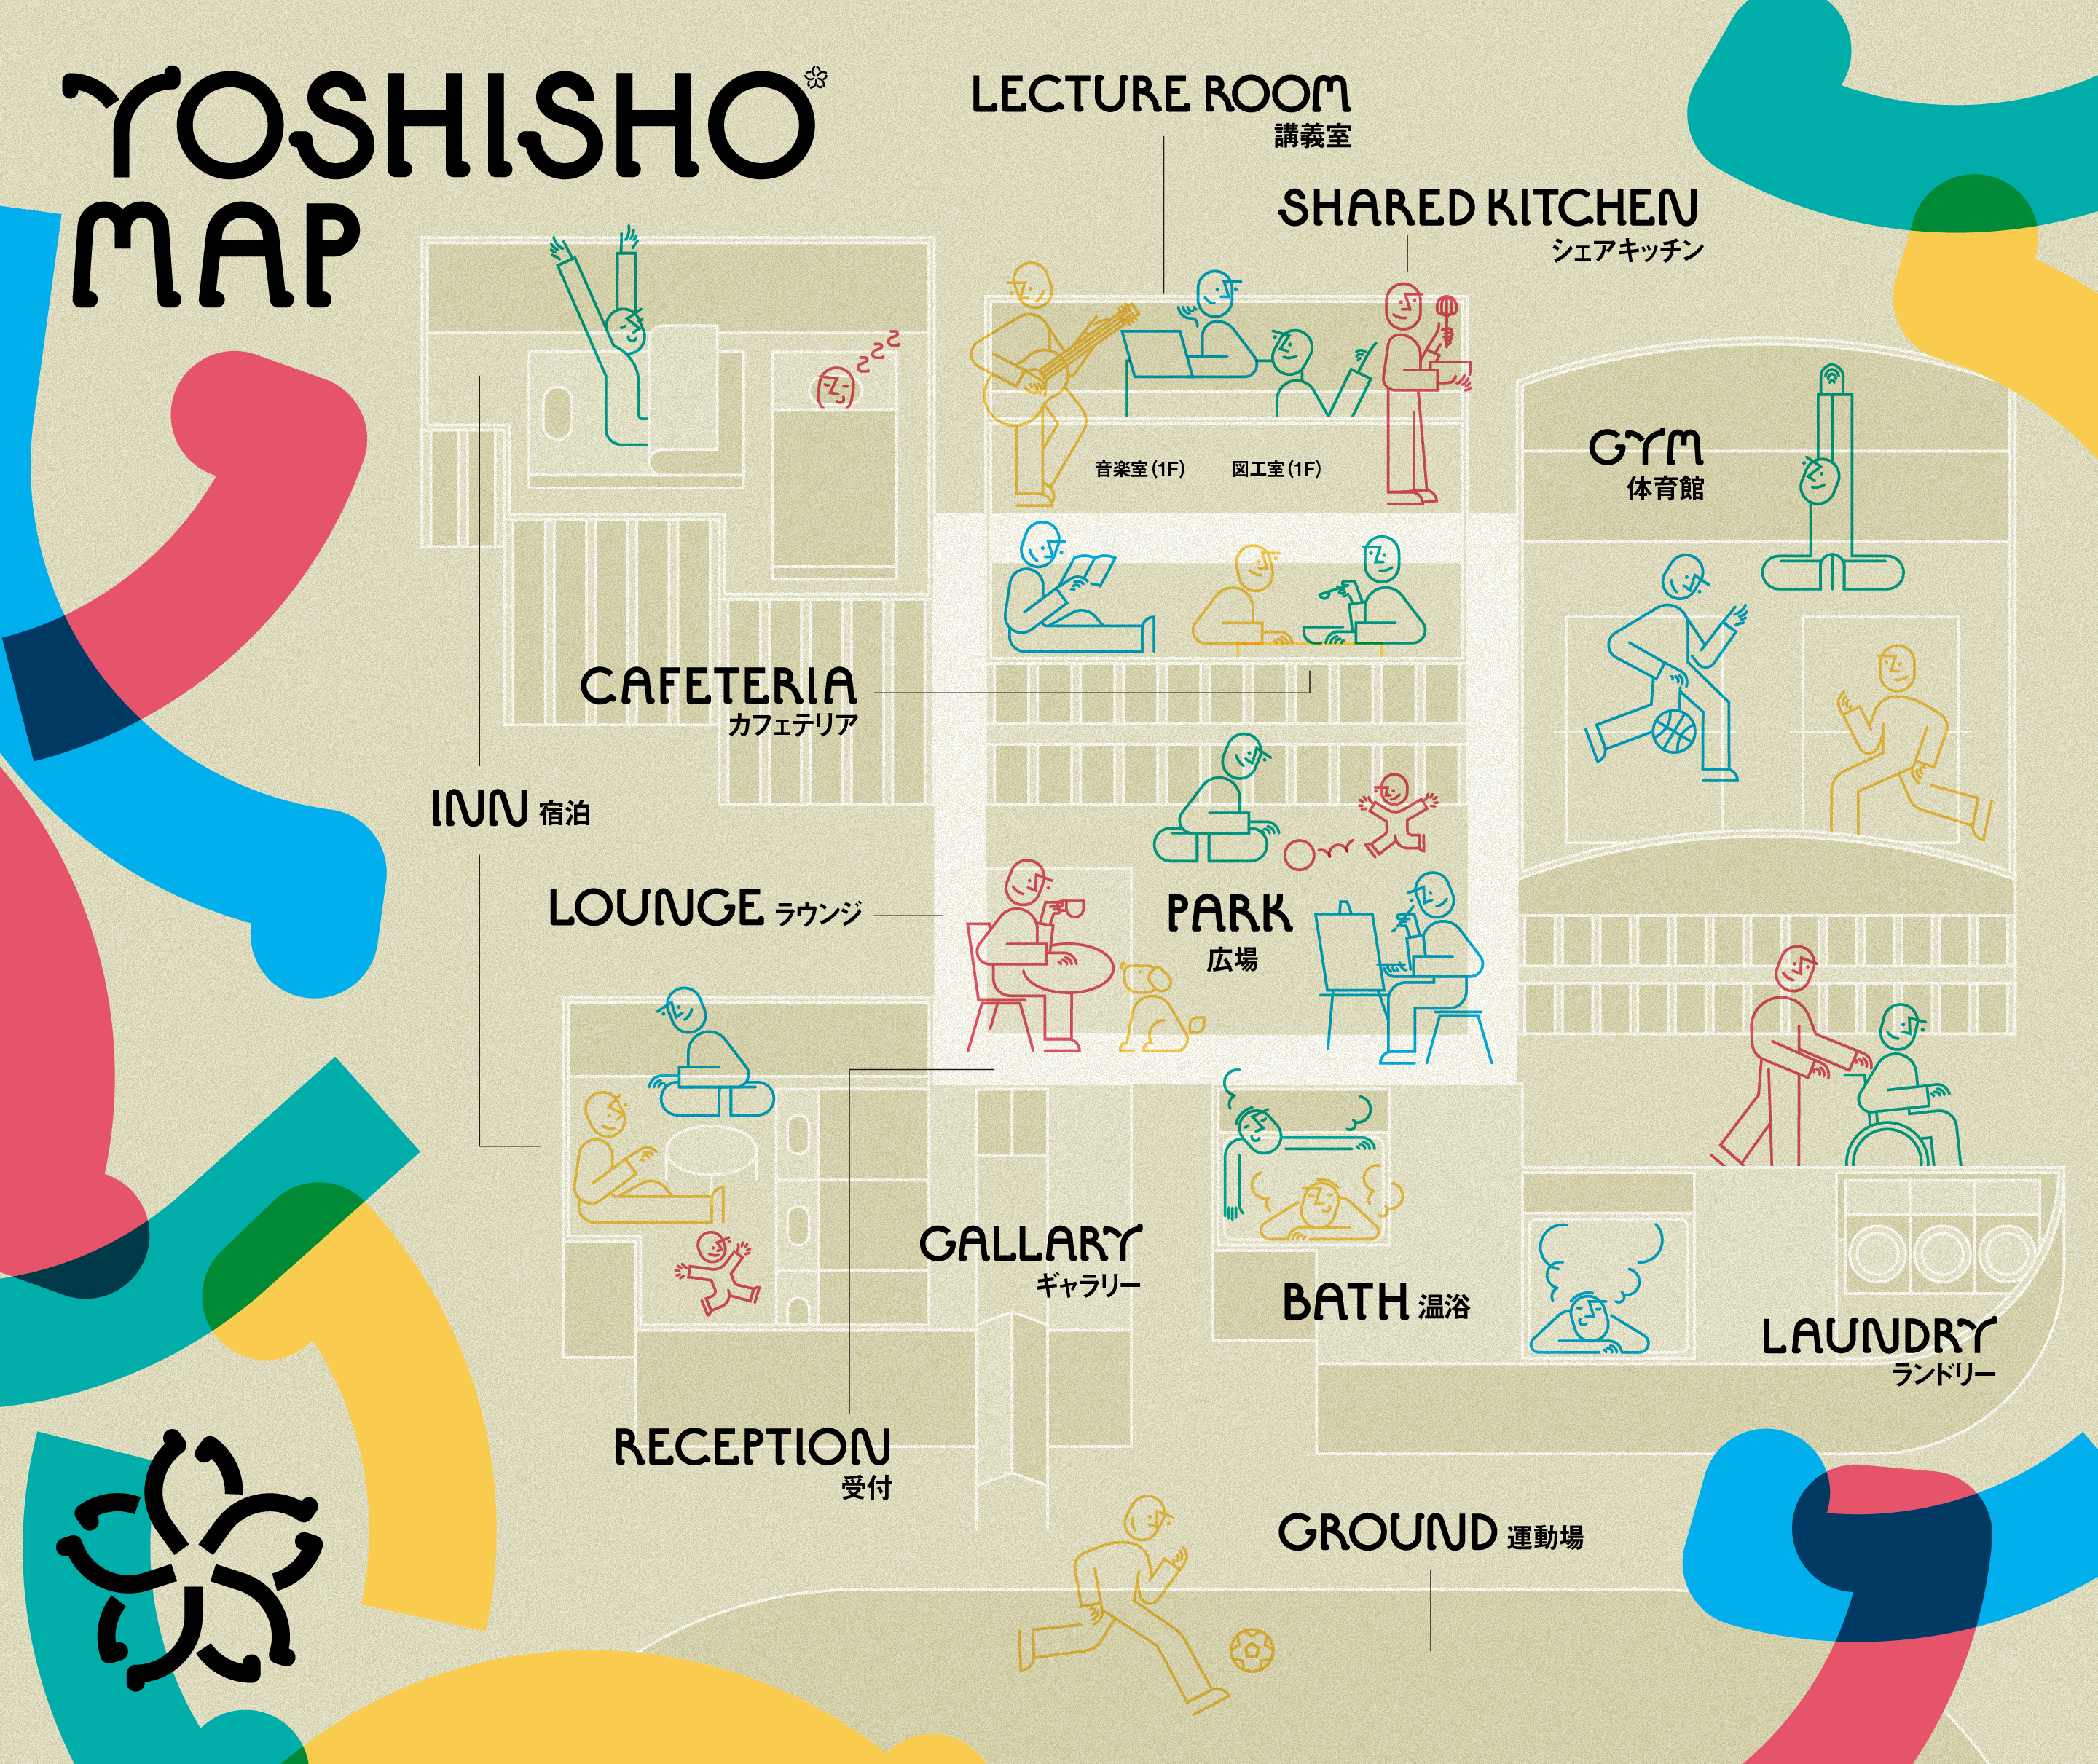
 YOSHISHO公式Instagram:



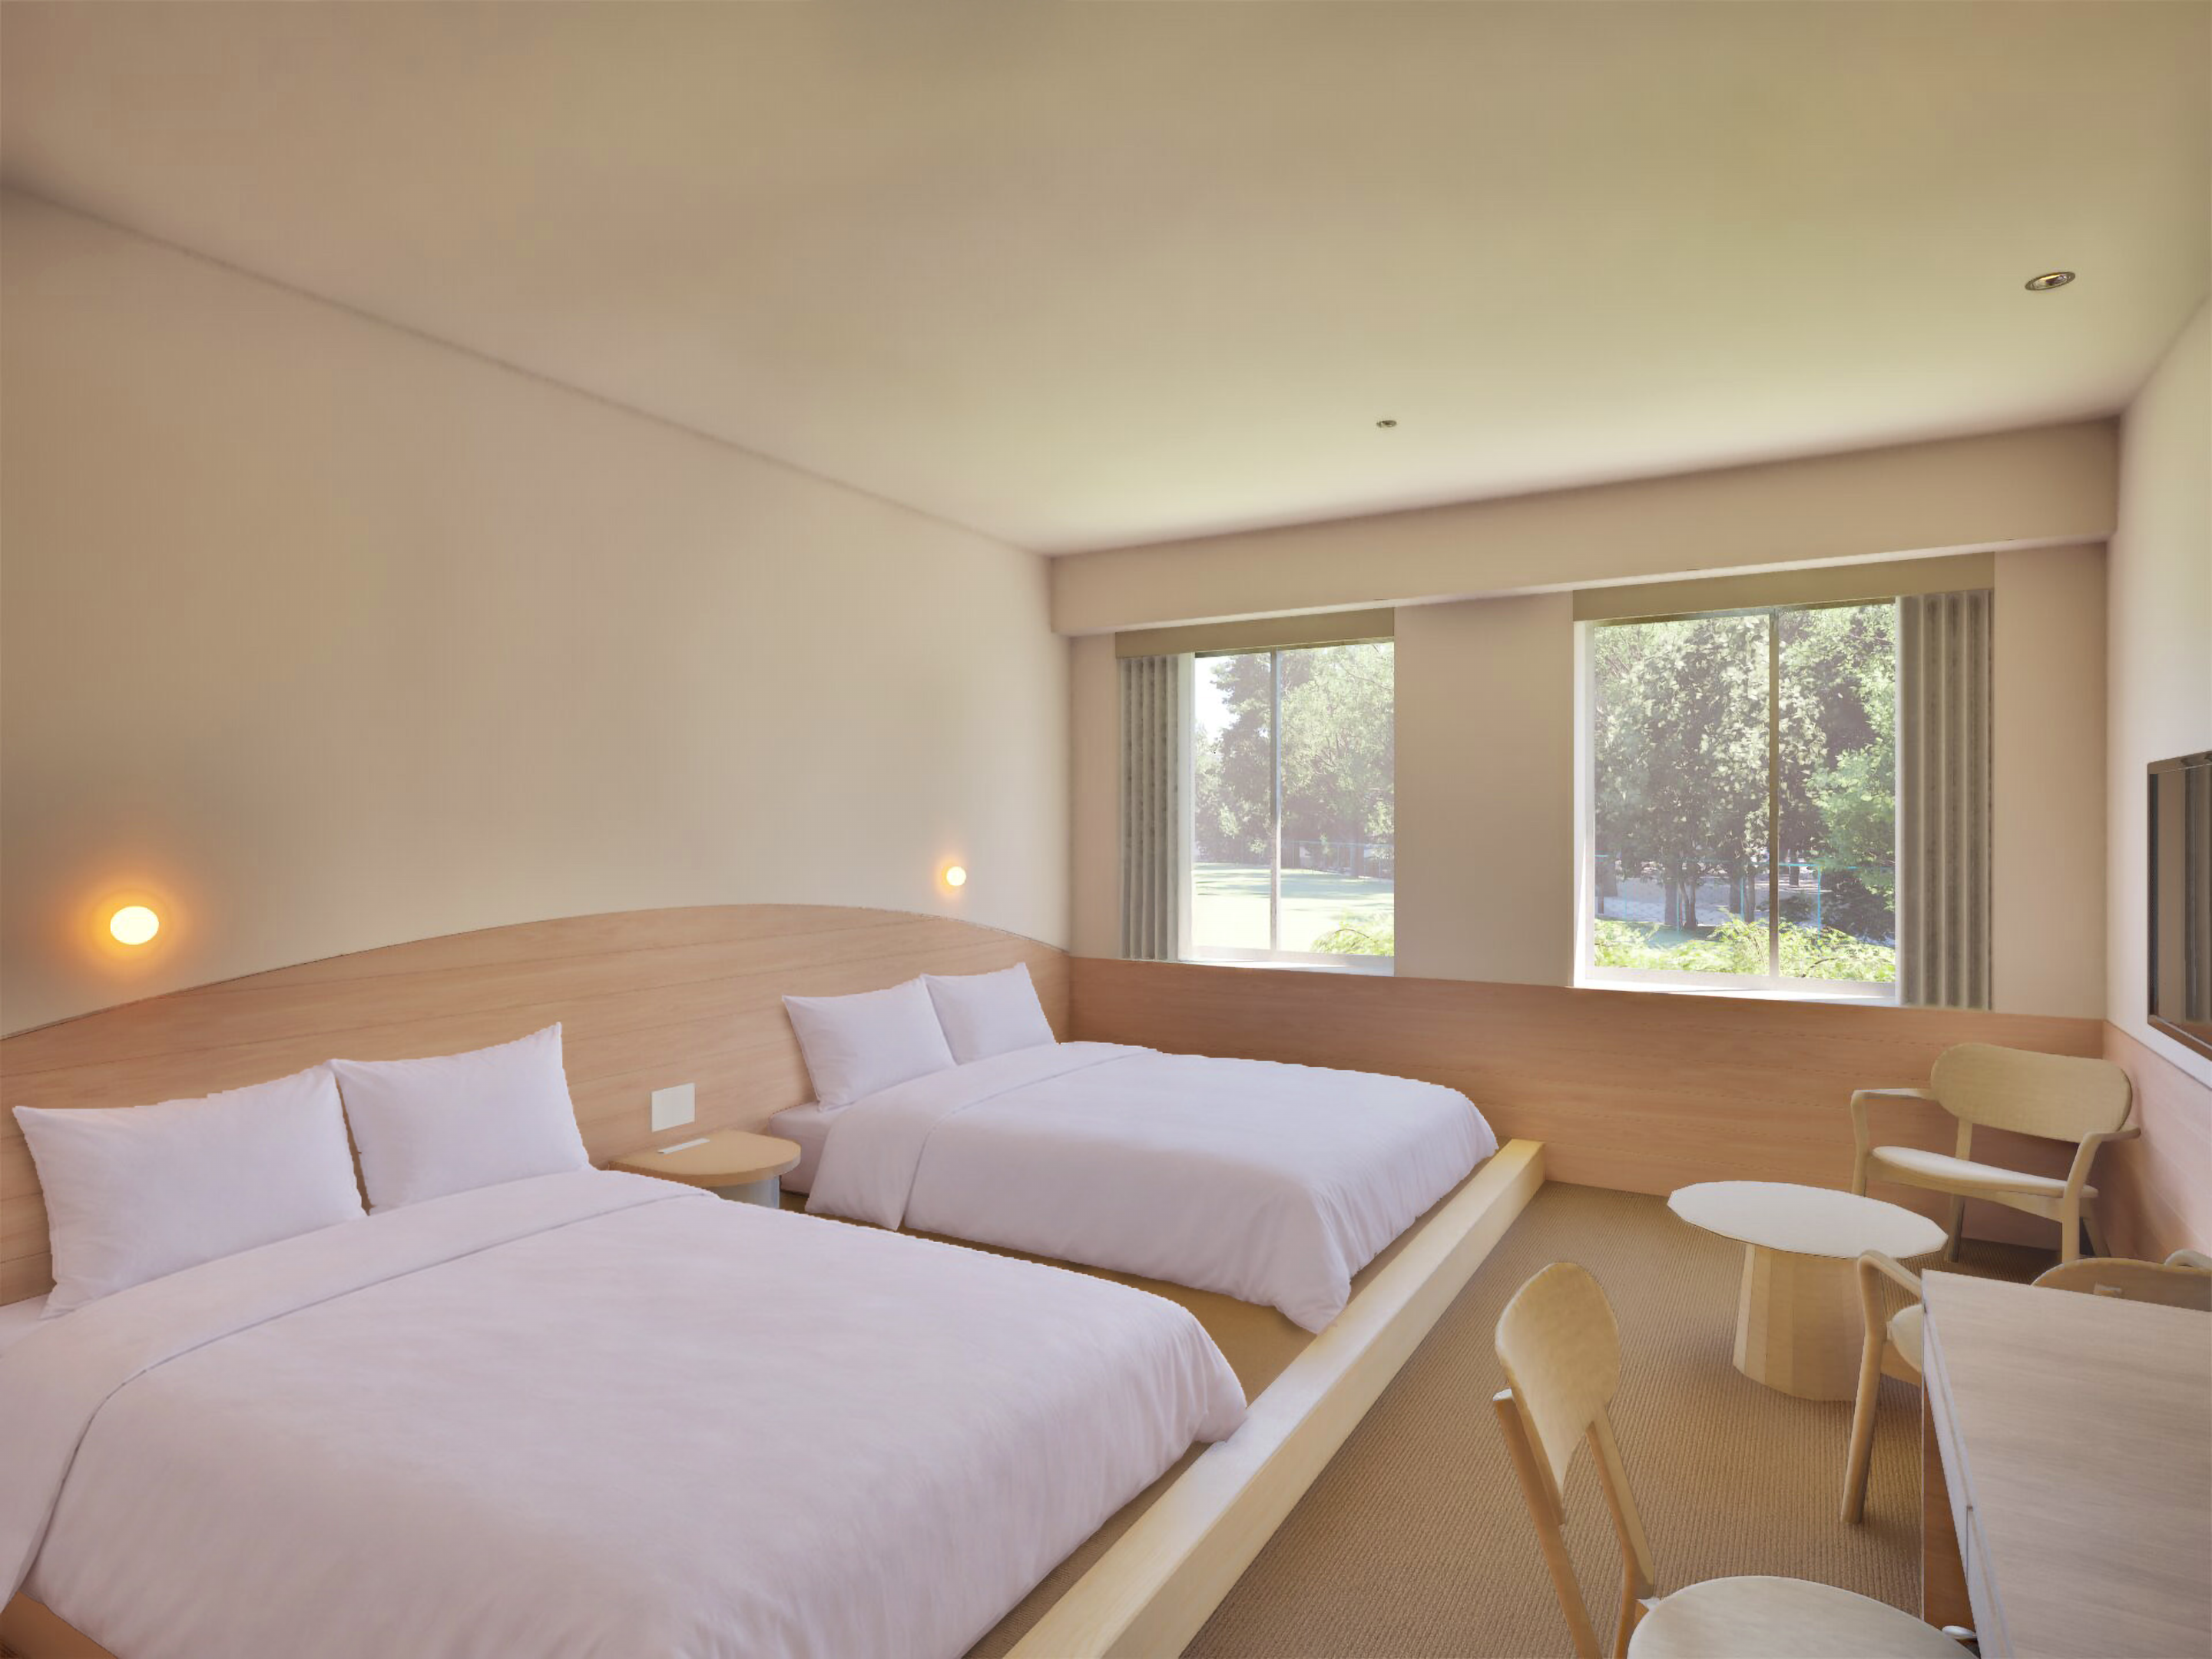
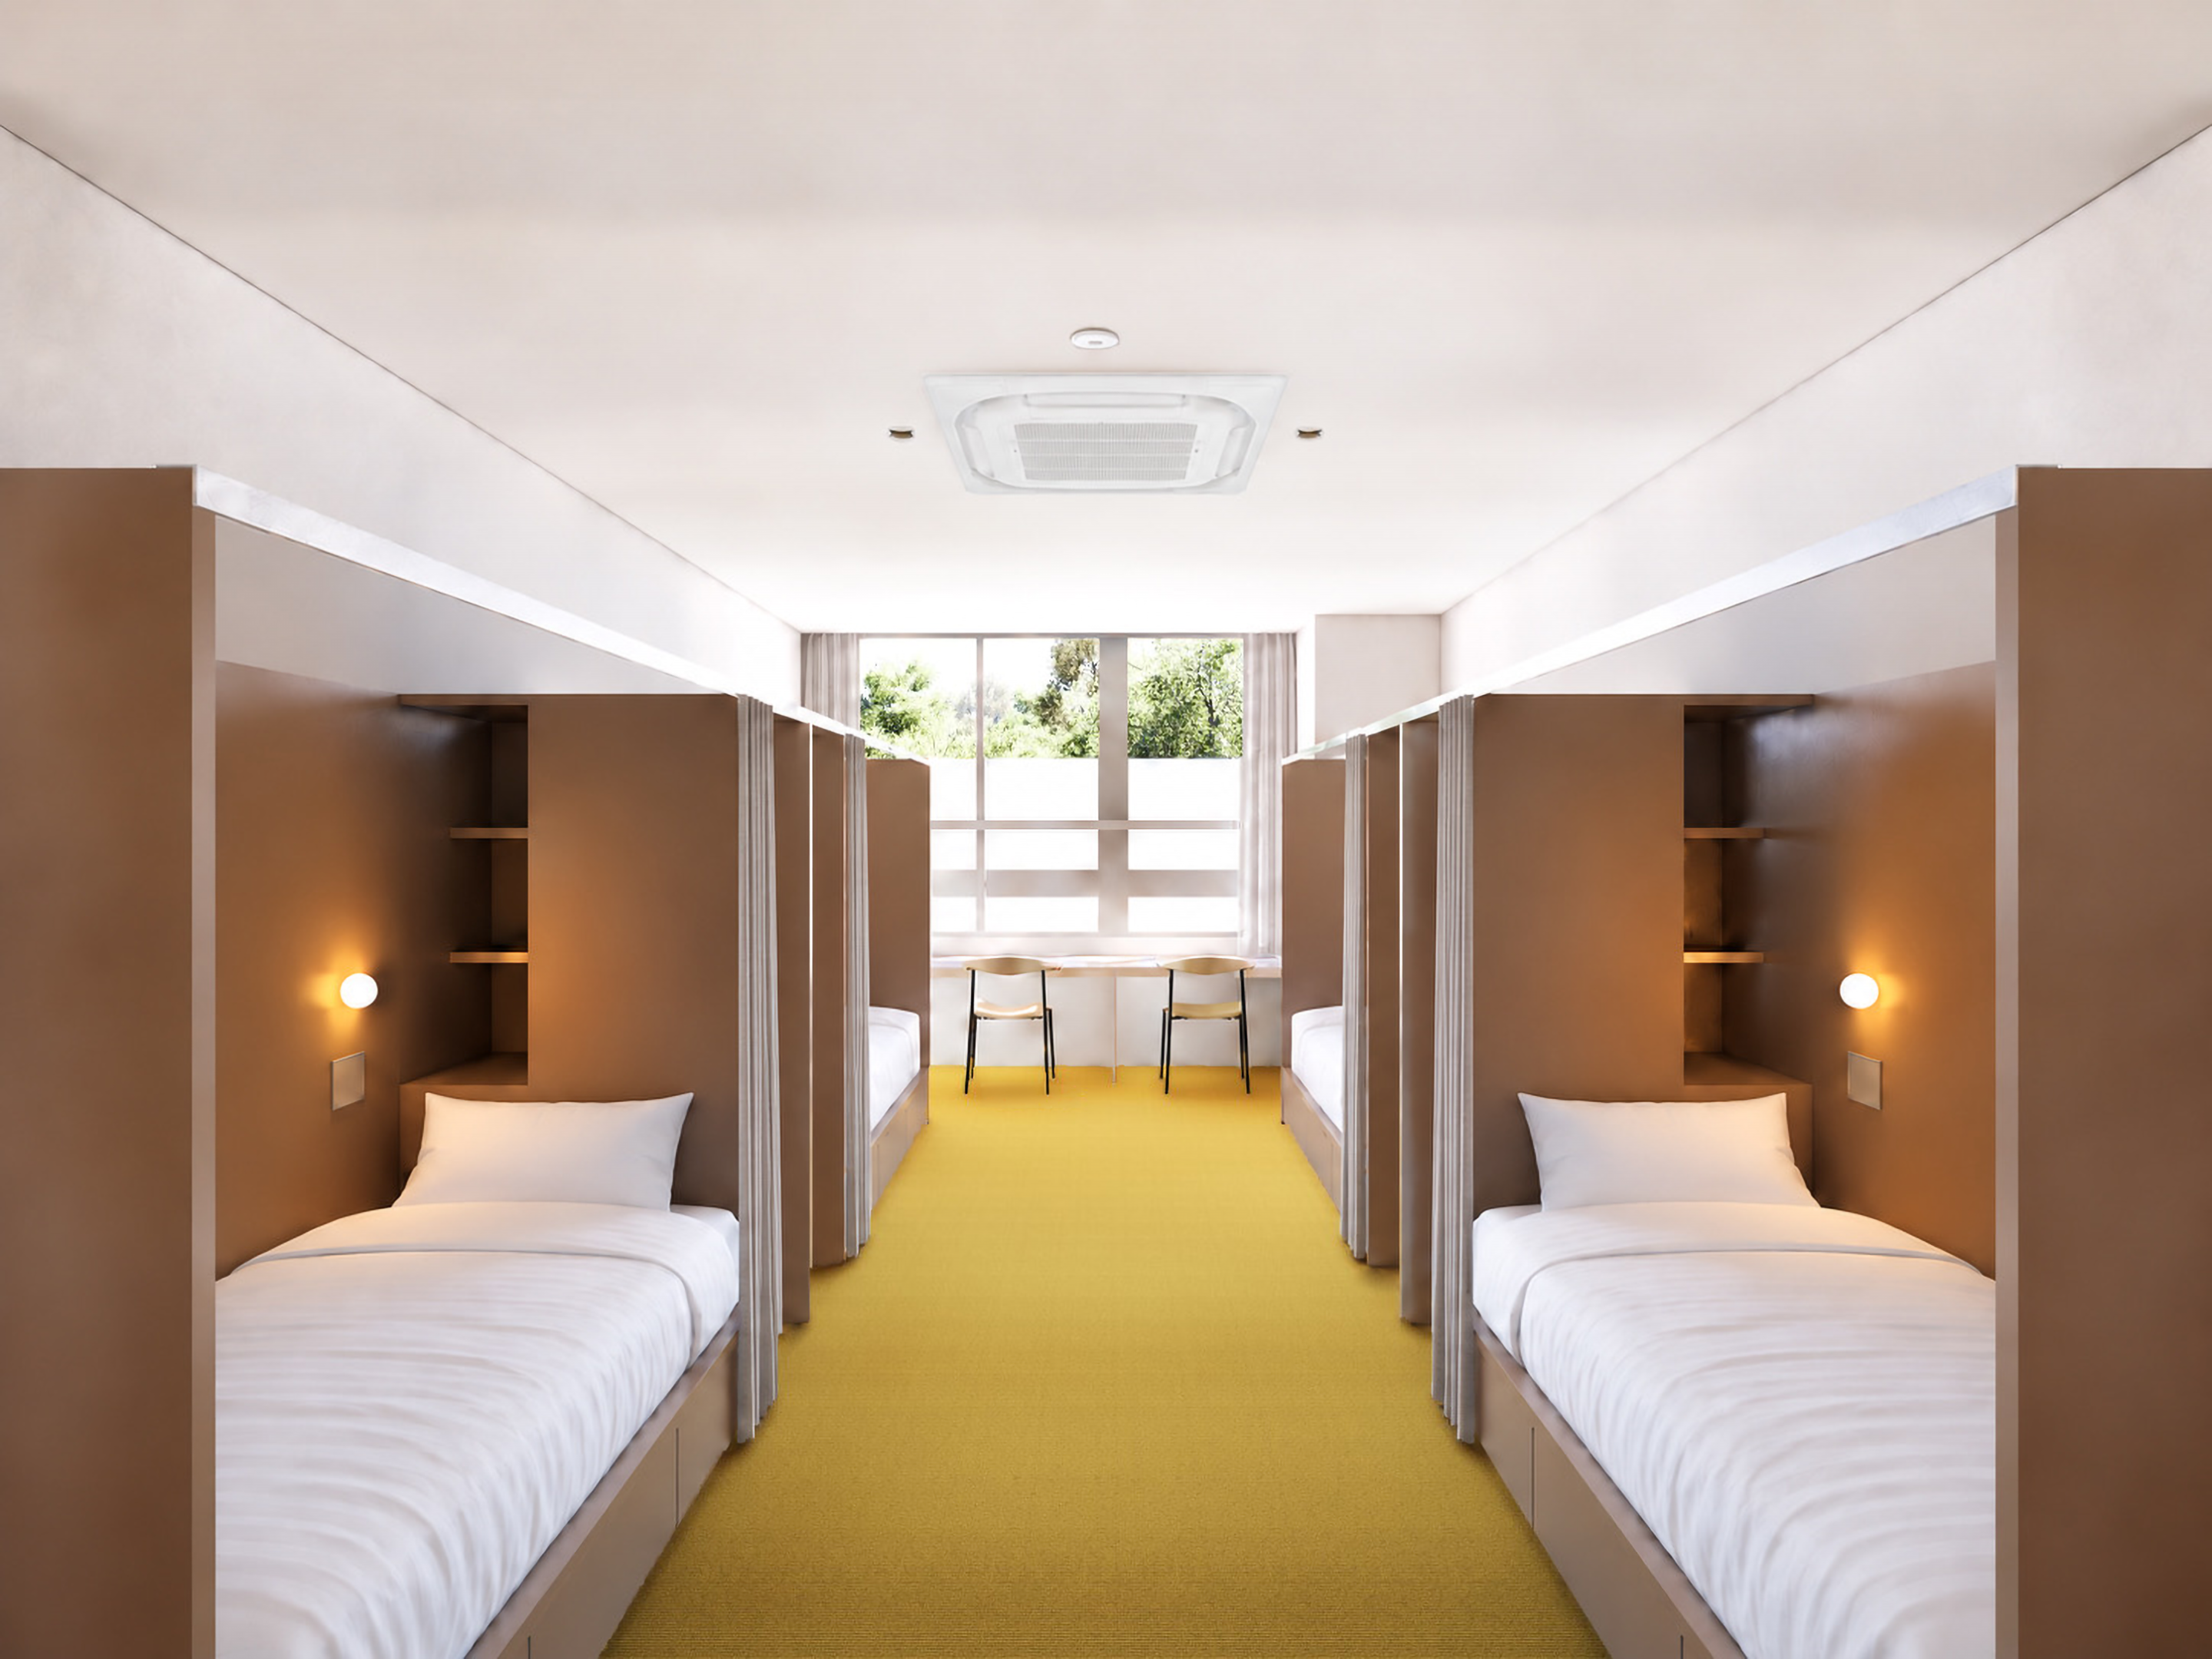
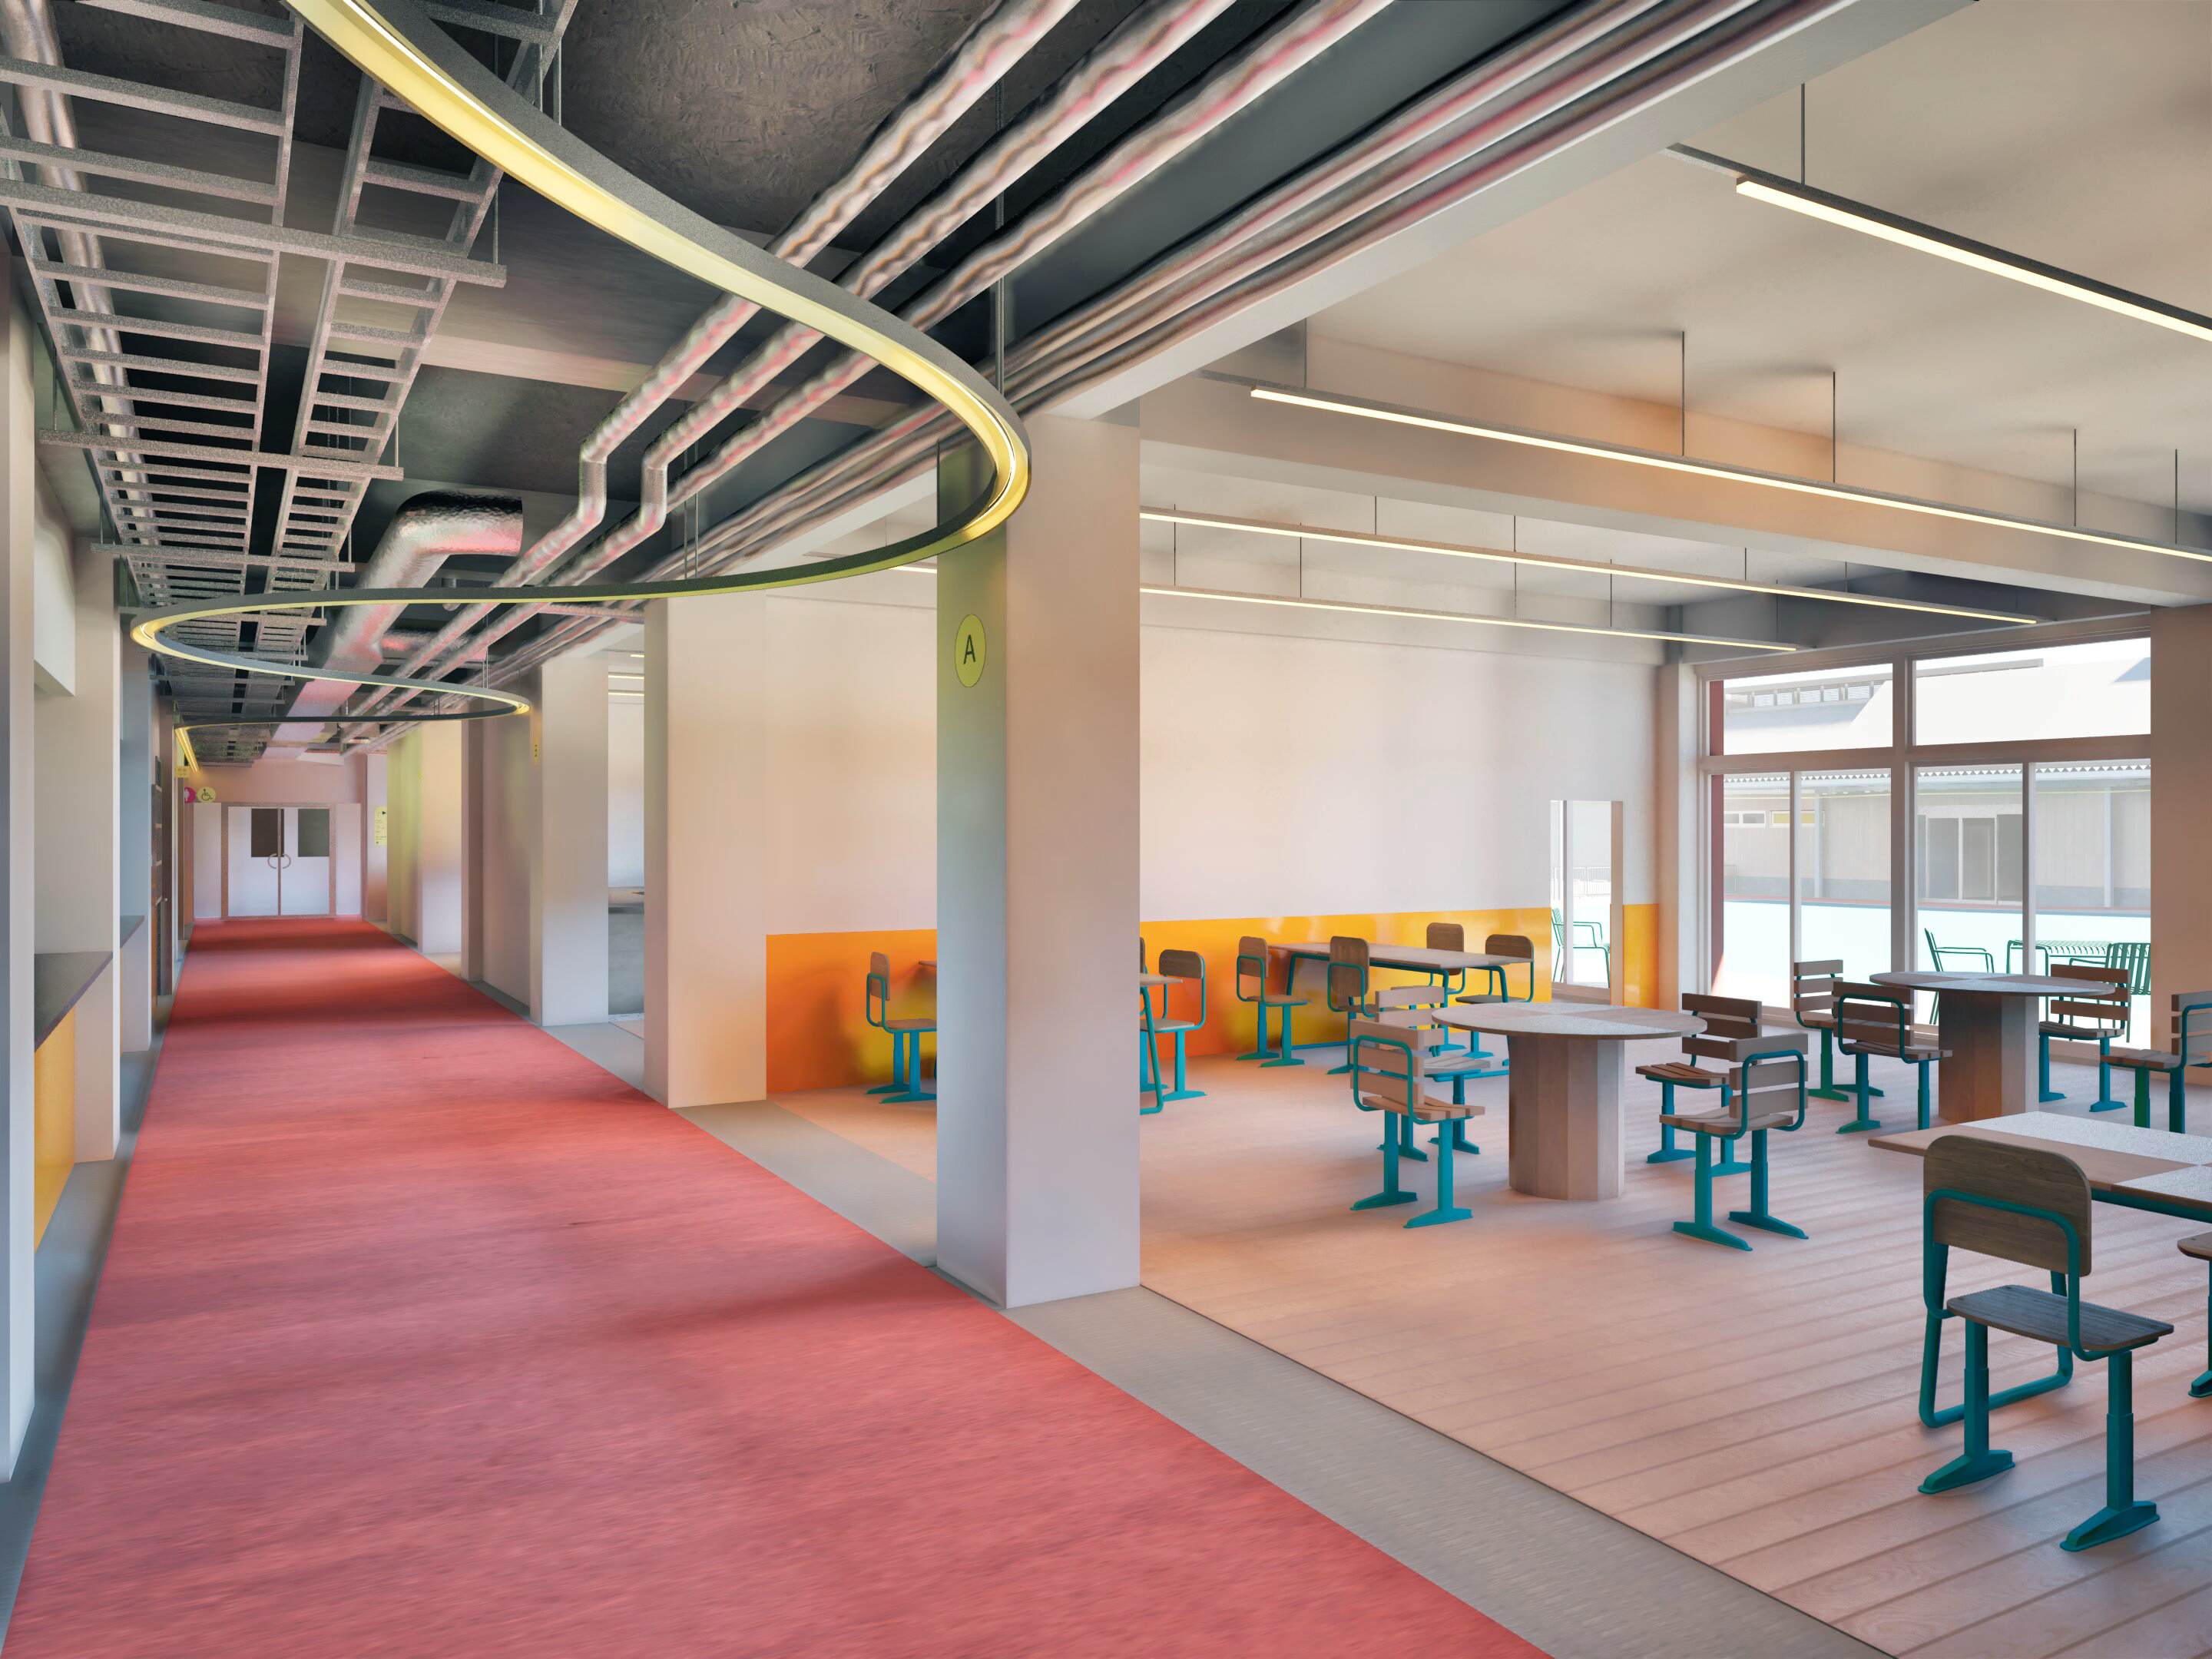
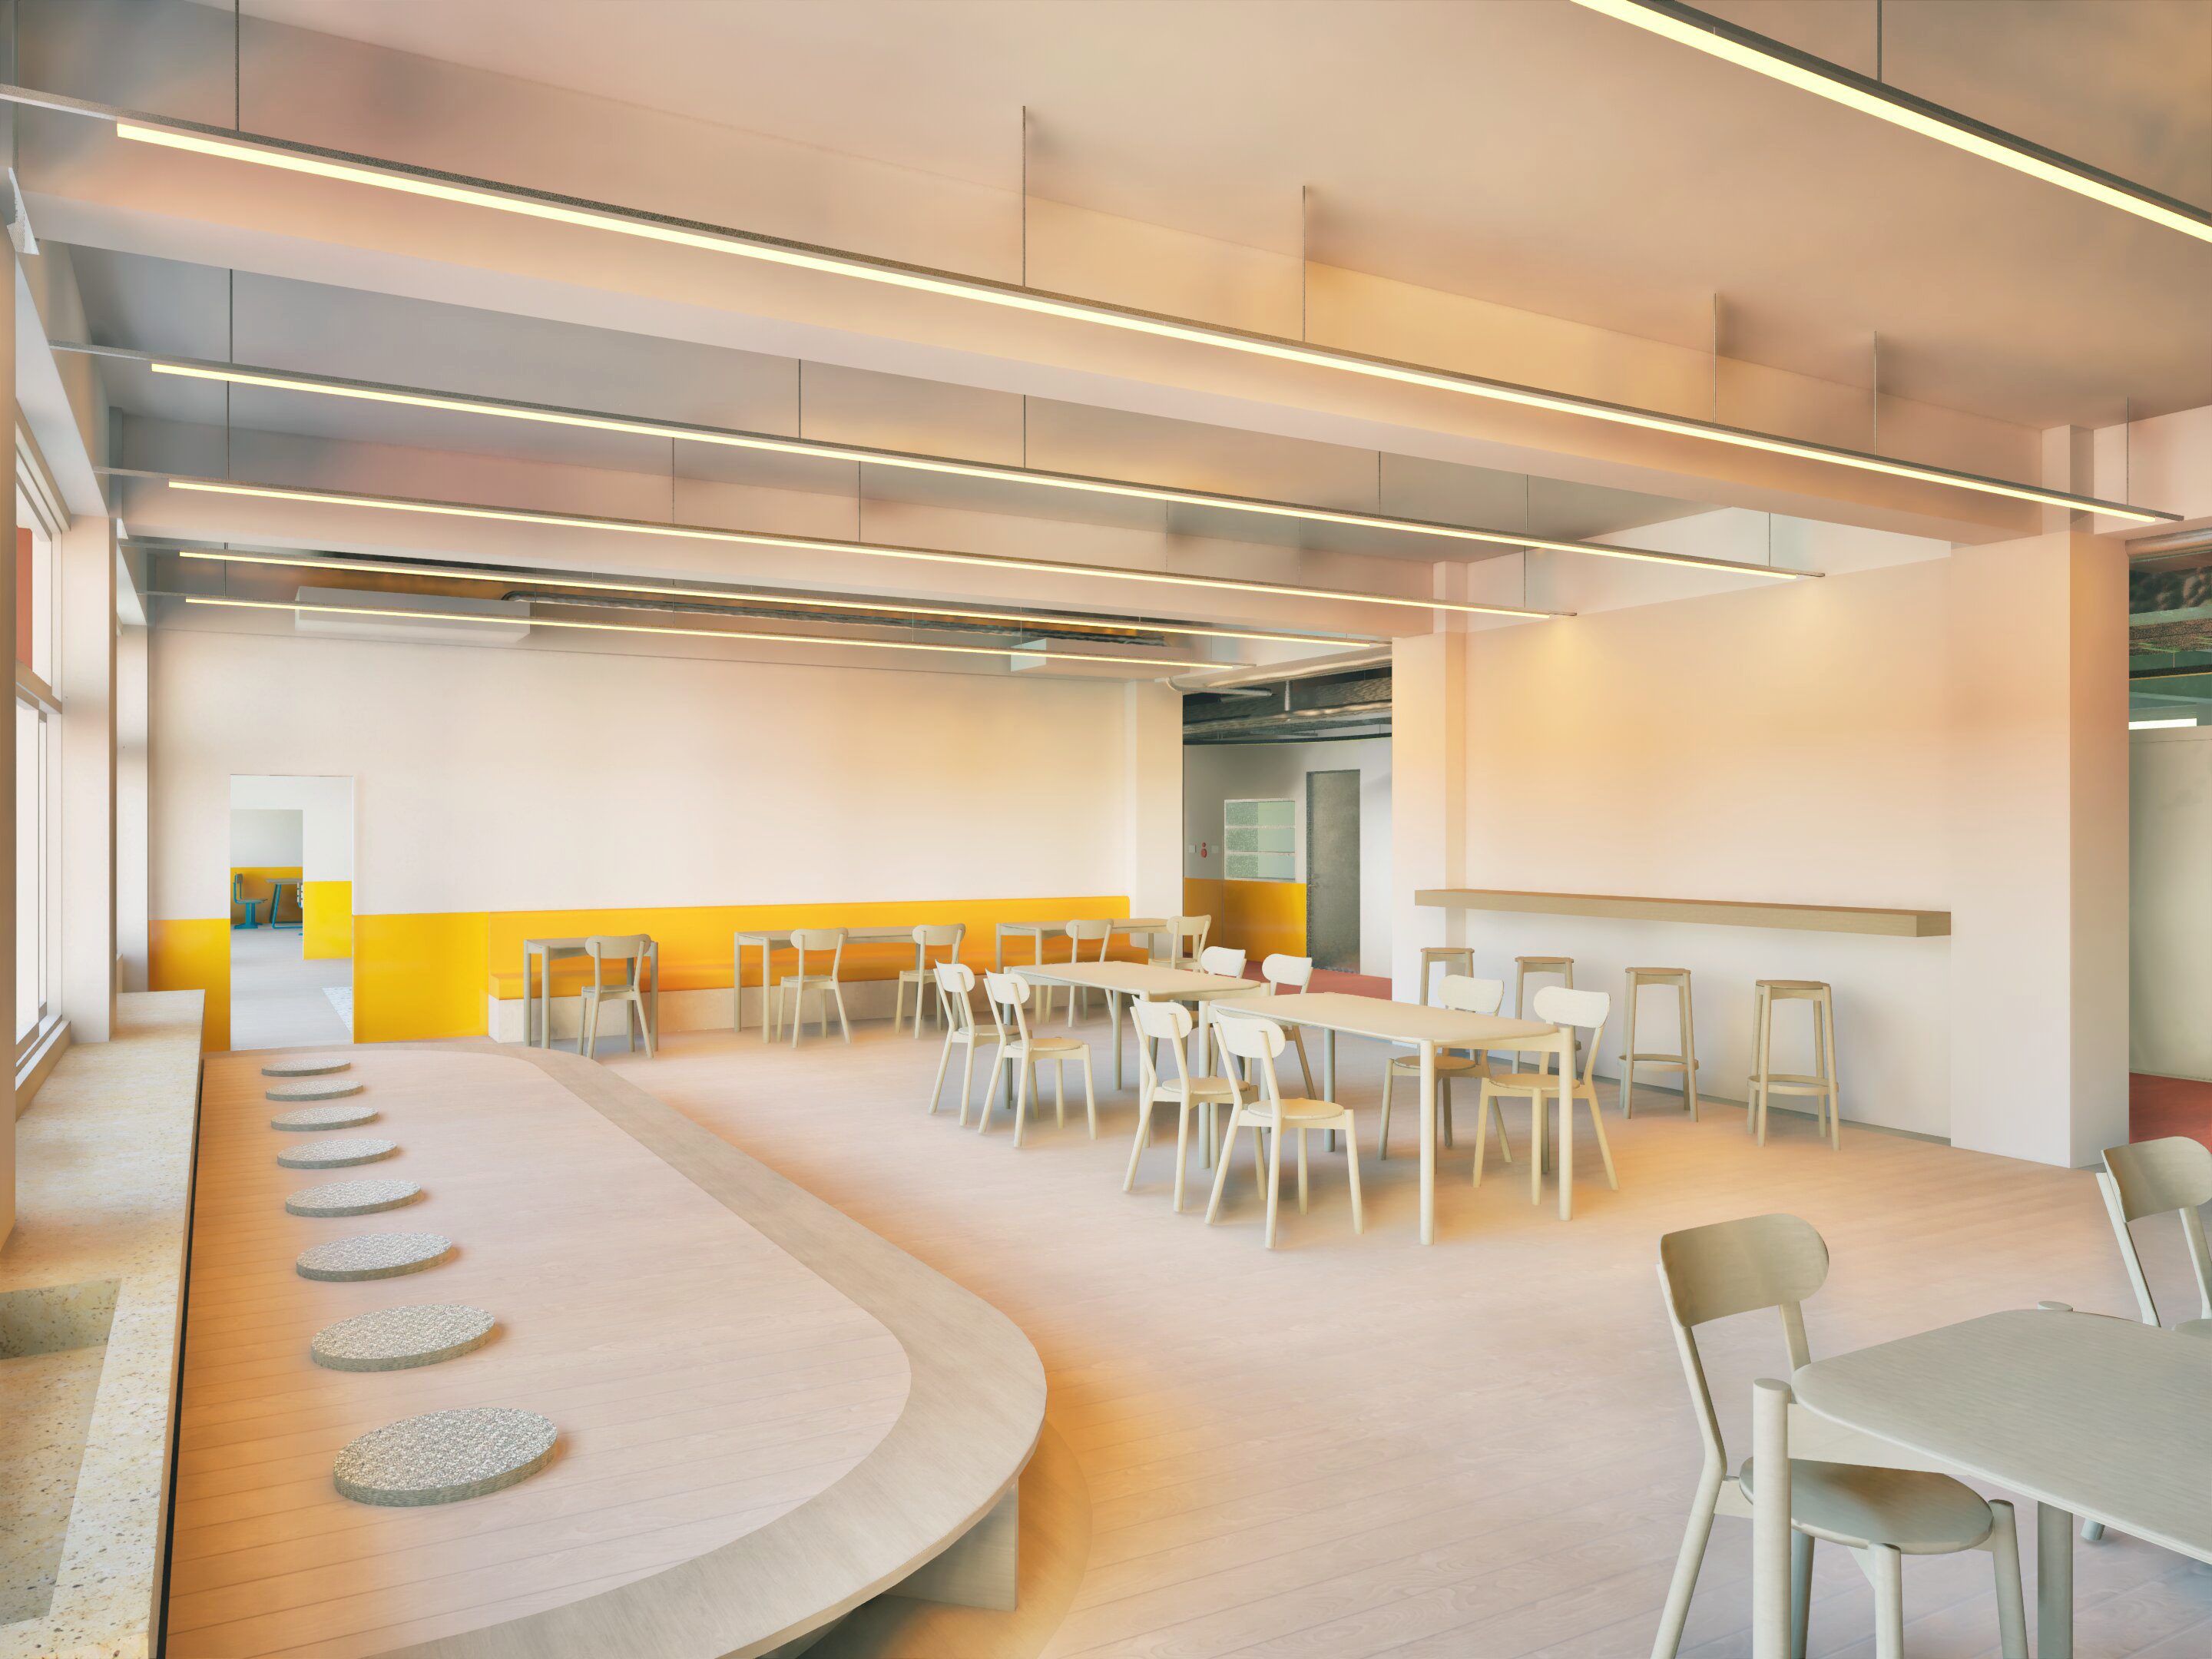
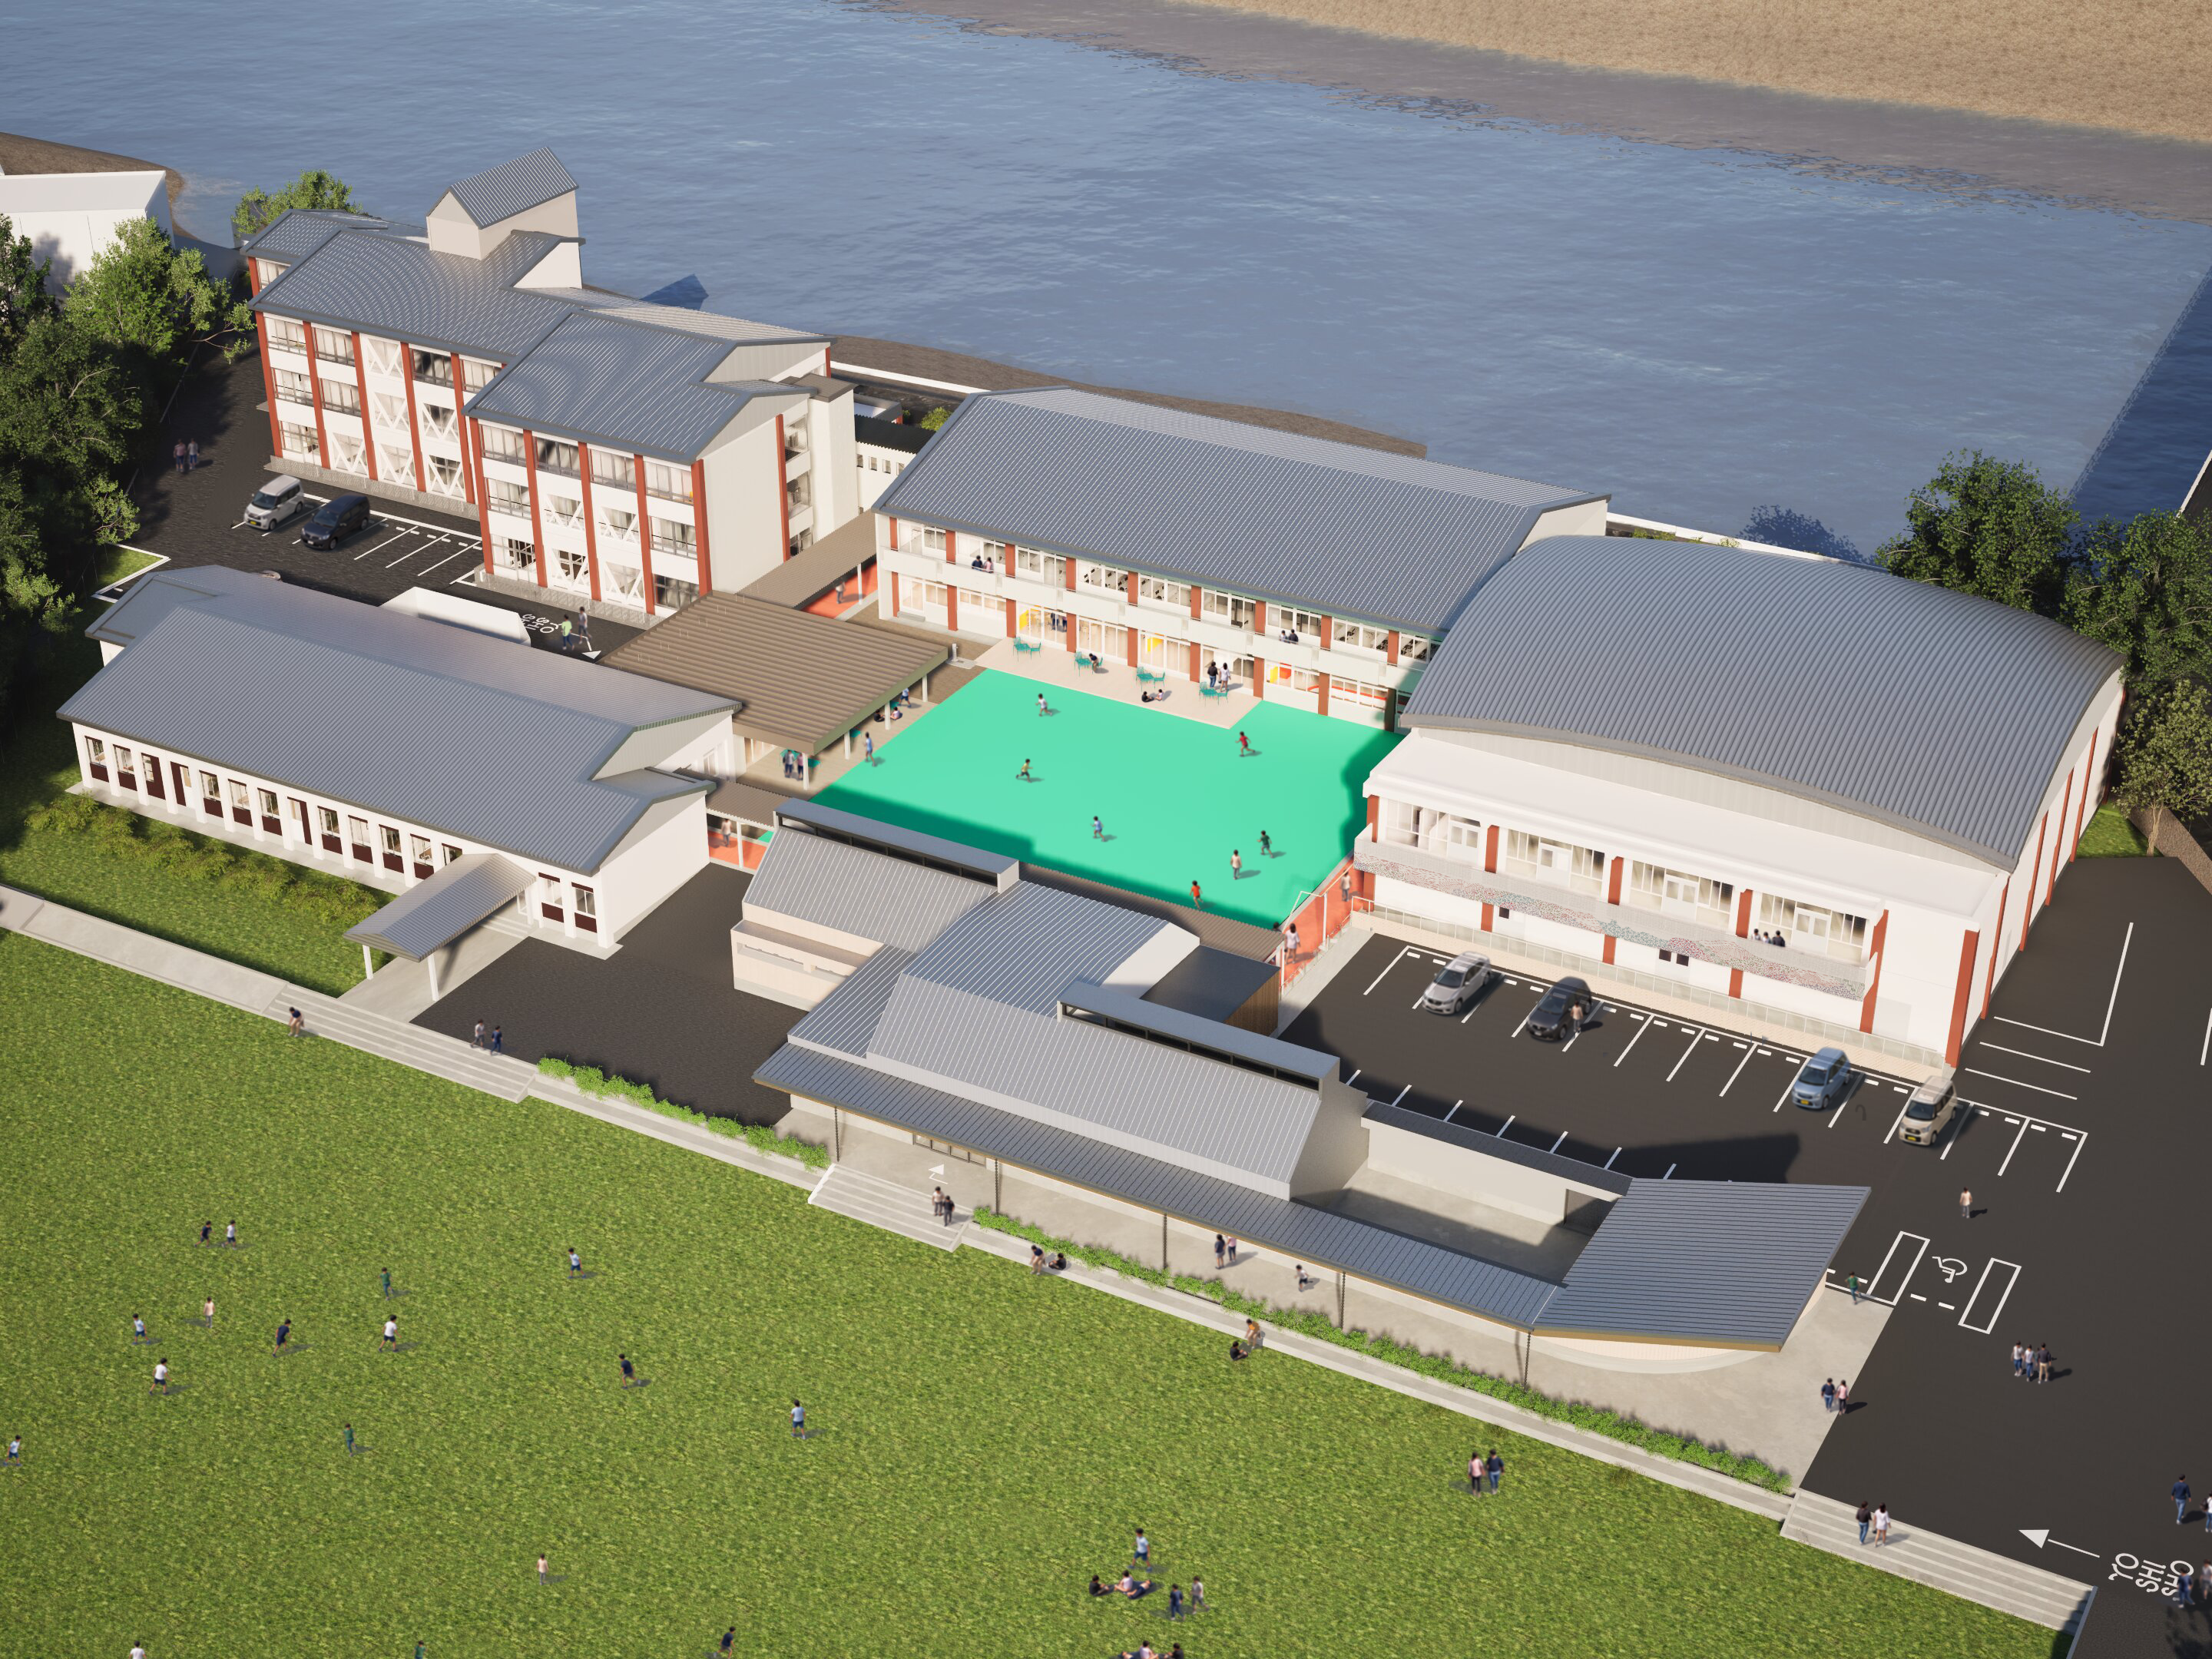
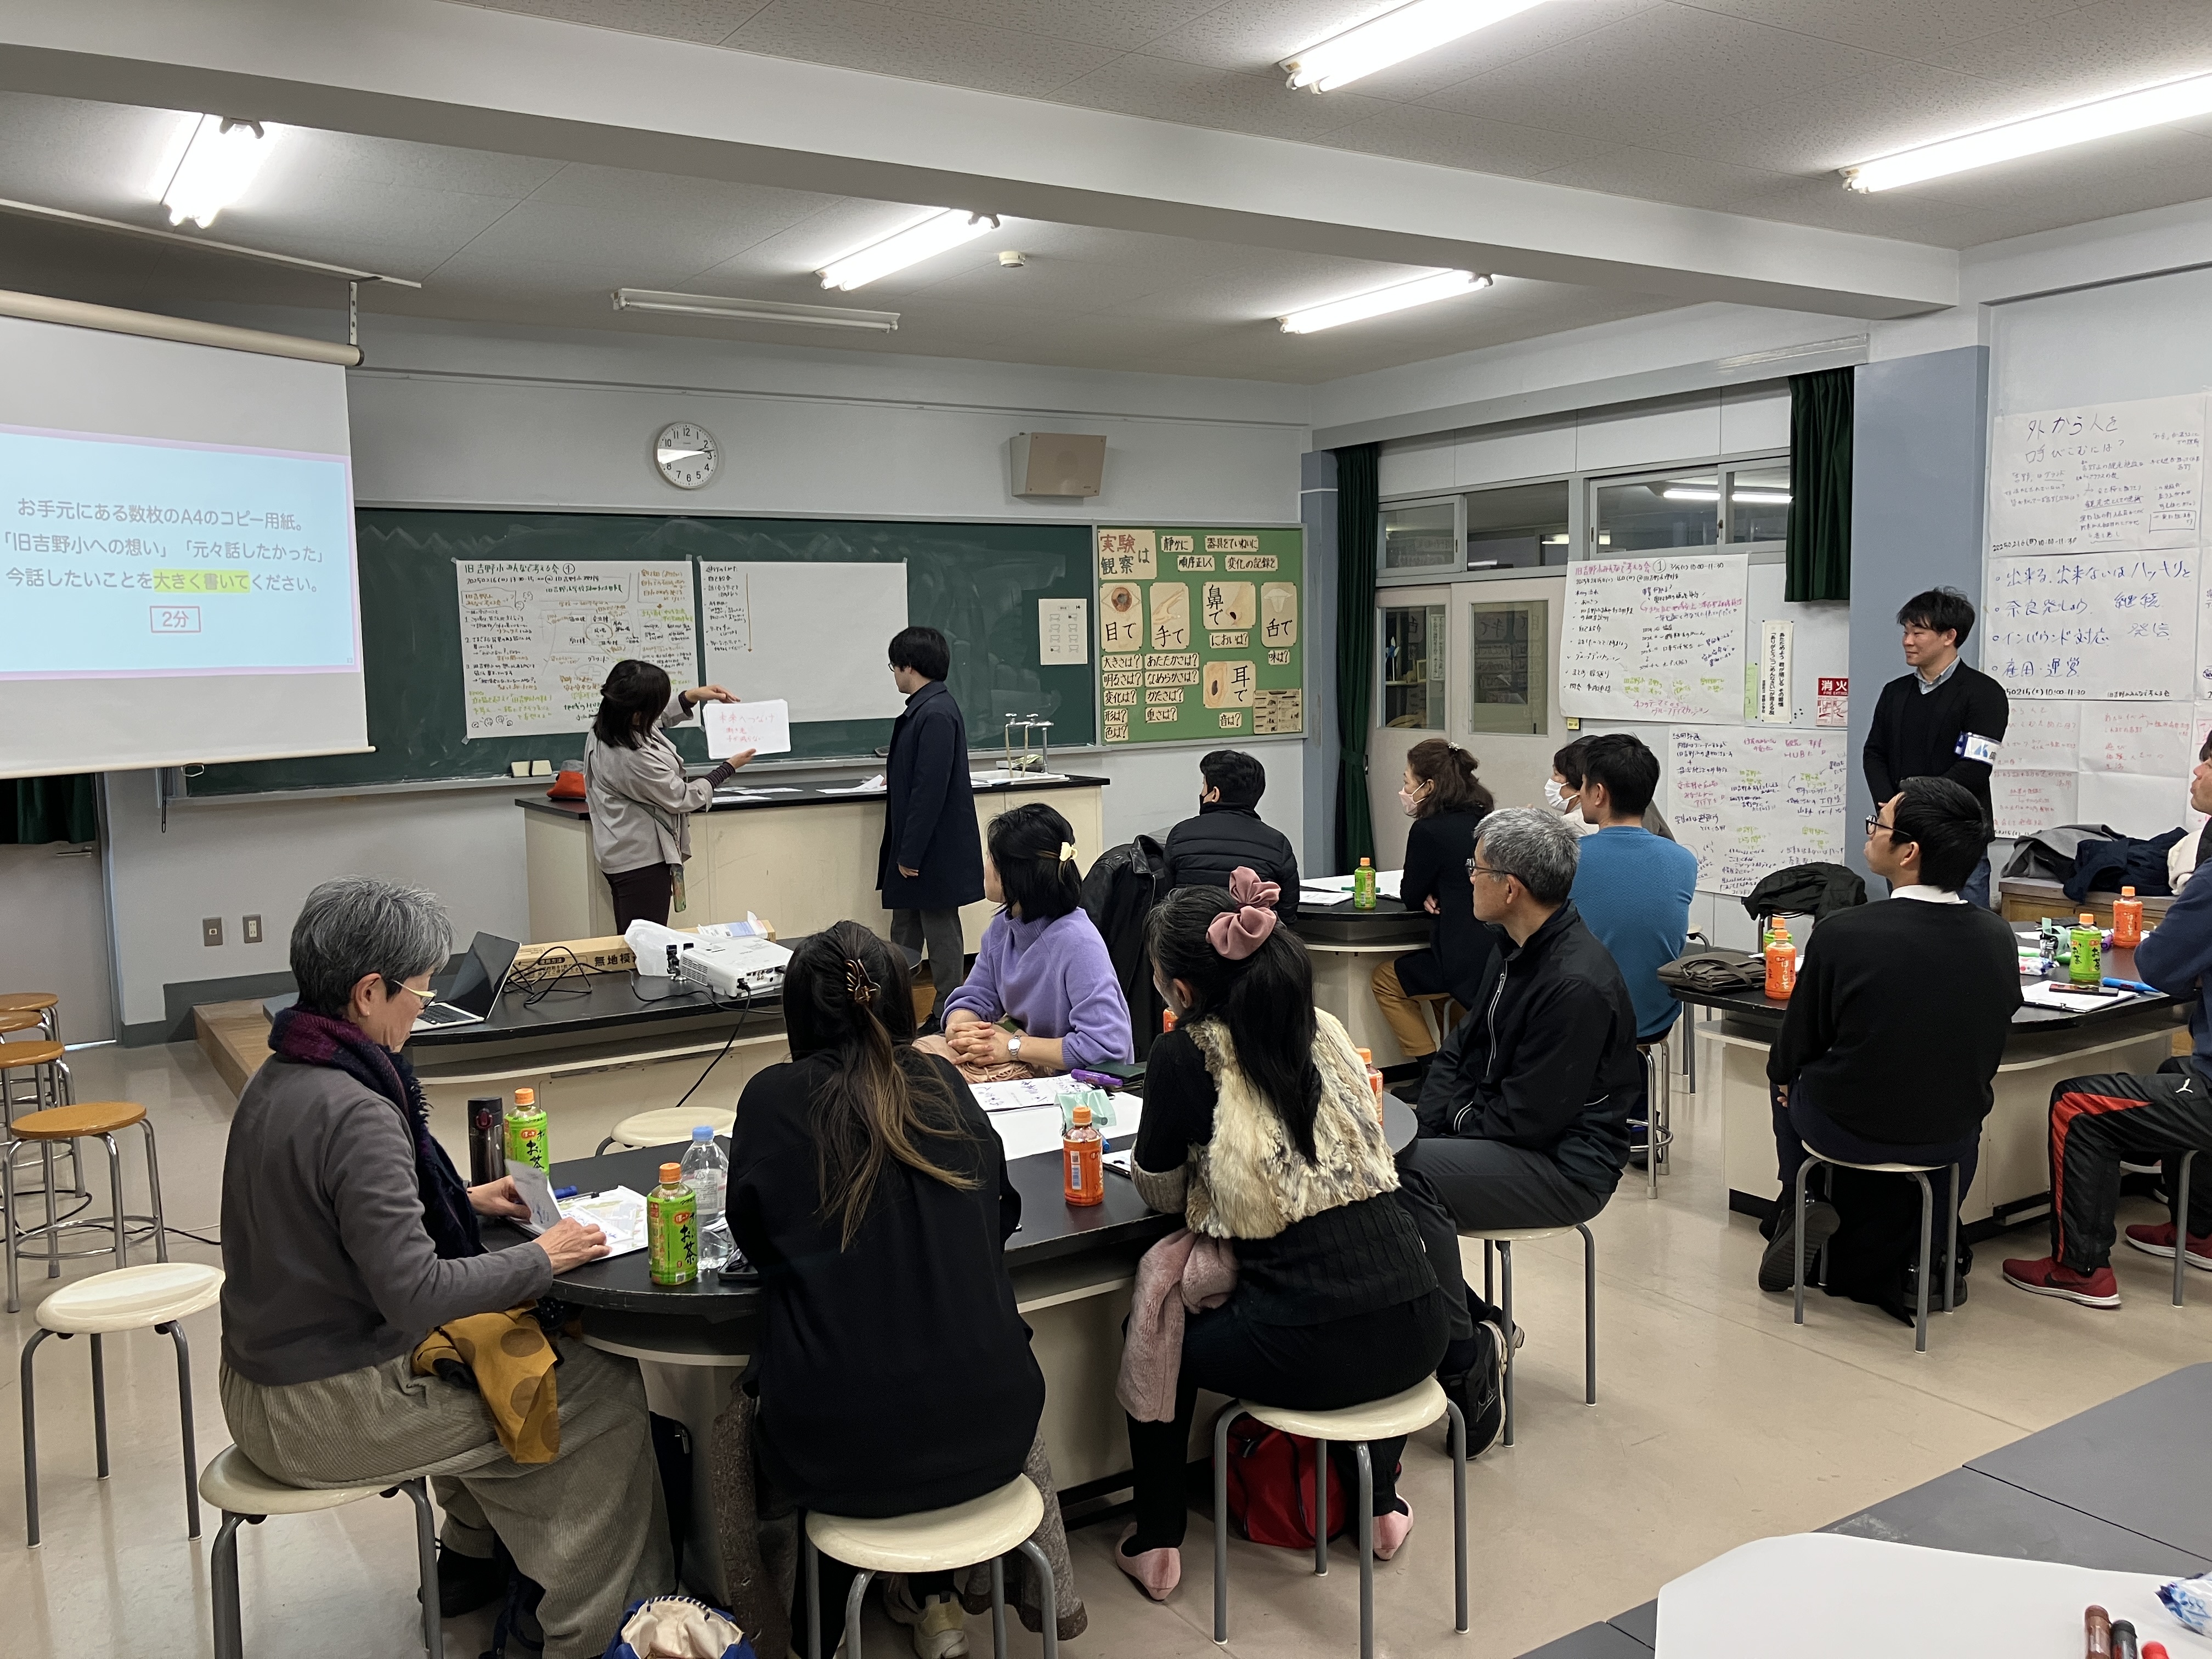
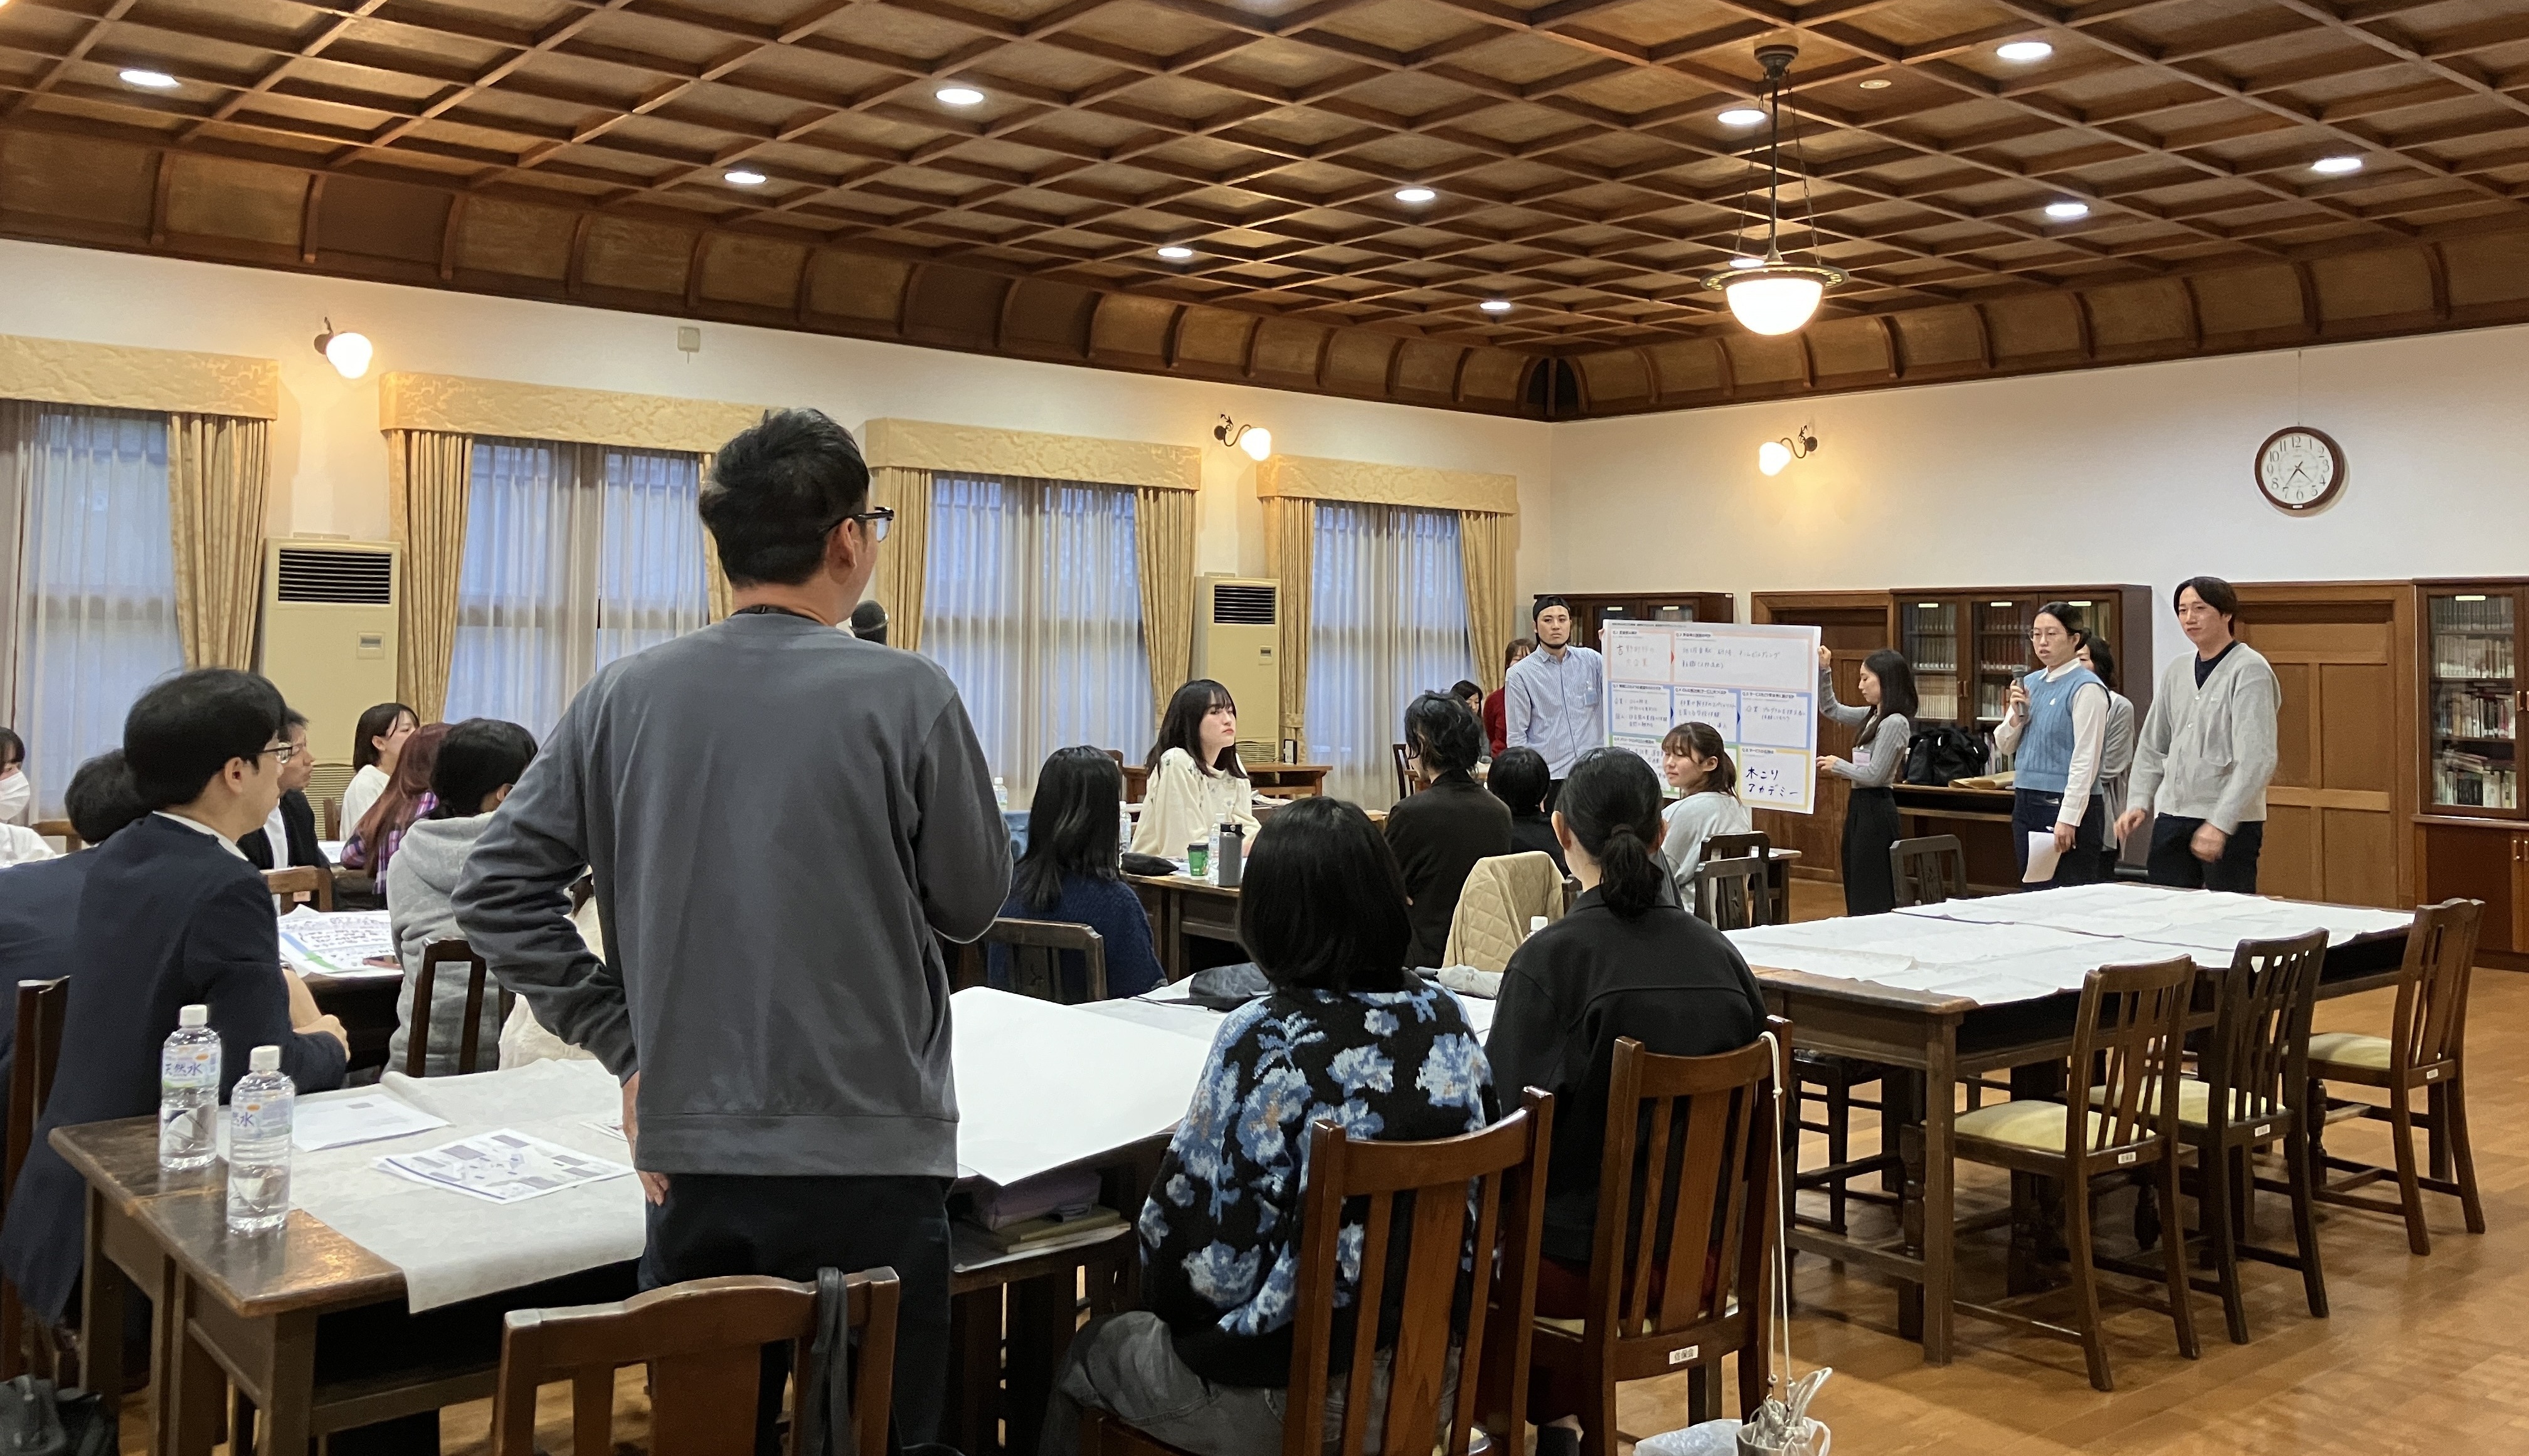

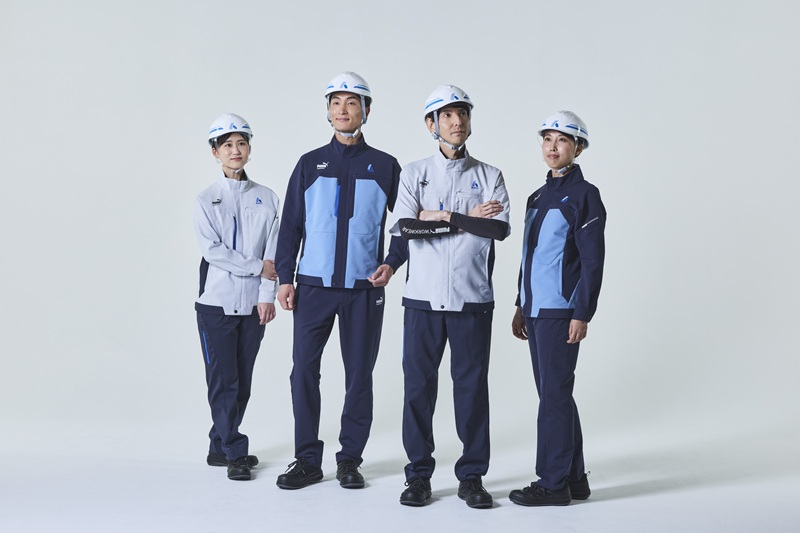
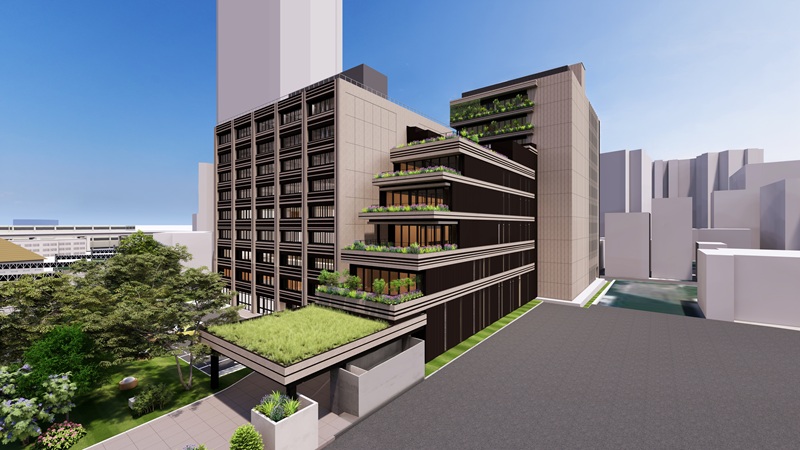
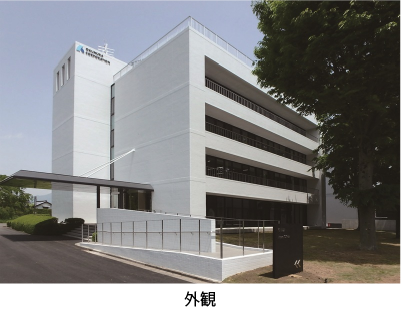
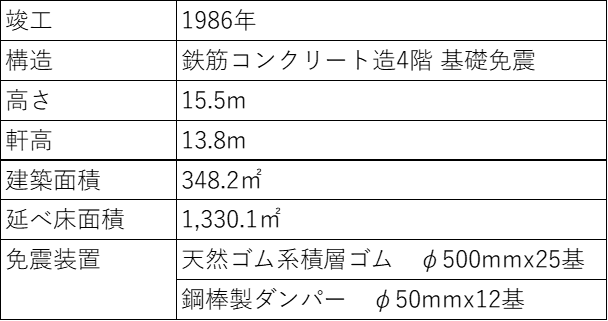

 ※3 プロジェクトマネジメント


 トップメッセージ
 経営理念・企業行動規範
 会社概要
 ビジョン
 中期経営計画
 事業所一覧
 CMギャラリー
 奥村組の歩み
 受賞実績
 事業紹介
 施工実績
 土木技術
 建築技術
 環境技術
 奥村組技術研究所
 決算情報
 有価証券報告書・
 その他開示情報
 電子公告
 財務ハイライト(連結)
 株主総会
 株主通信
 アニュアル・レポート
 株式に関するお手続き
 株価情報リンク
 単元未満株式の
 ディスクロージャー
 格付・社債情報
 トップメッセージ
 価値創造プロセス
 マテリアリティ(重要課題)
 環境
 社会
 ガバナンス
 奥村組のイノベーション
 ダイバーシティ・エクイティ
 DX戦略
 統合報告書
 GRIスタンダード対照表
 新卒採用
 キャリア採用
 インターンシップ
 福利厚生サイト
 採用活動における行動規範


 決算情報


Prompts
Click prompts to add them under the company line, click again to take one out, then copy the result into your AI chat. Shared by Asian Century Stocks and Uncovered Thai Stocks. Thank you.
ETFs Holding Okumura Corporation
Exchange-traded funds whose newest published daily portfolio holds one of the company's listings, largest weight first.
| ETF | Weight in ETF | Shares | Market value | As of |
|---|---|---|---|---|
| AVDE | 0.06% | 319,600 | $ 10.851M | Nov 16, 2026 |
| AVDS | 0.04% | 4,600 | $ 156.183K | Nov 16, 2026 |
| DISV | 0.02% | 28,600 | $ 956.911K | Nov 12, 2026 |
| DFIS | 0.02% | 28,600 | $ 956.911K | Nov 12, 2026 |
| DXIV | 0.01% | 800 | $ 26.767K | Nov 12, 2026 |
| DFIC | 0.01% | 31,000 | $ 1.037M | Nov 12, 2026 |
| DFAX | 0.00% | 16,400 | $ 548.718K | Nov 12, 2026 |
| DFSI | 0.00% | 1,600 | $ 53.533K | Nov 12, 2026 |
| DFAI | 0.00% | 16,300 | $ 545.372K | Nov 12, 2026 |