~第1四半期決算説明資料~ 目 次 ページ ページ I 決算ハイライト 1 IV 連結子会社情報 主要な連結子会社の業績 12 II 当第1四半期業績と通期予想 連結主要数値の内訳 連結損益計算書 2 連結貸借対照表 3 V 財務データ 損益計算書(個別) 4 報告セグメント別情報…
~第1四半期決算説明資料~
目 次
ページ
ページ
I 決算ハイライト
1
IV 連結子会社情報
主要な連結子会社の業績
12
II 当第1四半期業績と通期予想
連結主要数値の内訳
連結損益計算書
2
連結貸借対照表
3
V 財務データ
損益計算書(個別)
4
報告セグメント別情報
13
受注高(個別)
5
主要数値(連結・個別)
14
売上高(個別)
6
有利子負債・保証債務・設備投資
繰越高(個別)
7
研究開発費・減価償却費・金融収支
売上総利益(個別)
8
VI 主な経営指標
III 建設事業の業績詳細
経営指標の推移(連結・個別)
15
① 受注高
国内海外別・官民別の推移(個別)
9
工事種類別内訳と構成比(個別)
② 売上高
国内海外別・官民別の推移(個別)
10
工事種類別内訳と構成比(個別)
③ 繰越高
国内海外別・官民別の推移(個別)
11
工事種類別内訳と構成比(個別)
※本資料に記載の業績予想は、本資料の公表日現在において入手可能な情報に基づいて作成したものであり、実際の業績は今後様々な要因によって異なる結果となる可能性があります。尚、当資料で億円または百万円で表示している金額は、それぞれ億円または百万円未満を切り捨てて表示しております。
- 連結経営成績
売上高
1,026億円 (前年同四半期比 23.8%増)
営業利益
69億
円 (前年同四半期比 130.8%増)
経常利益
70億円 (前年同四半期比 176.1%増)
四半期純利益 46億円 (前年同四半期比 182.0%増)
- 建設事業受注高
連結受注高
904億円 (前年同四半期比 99.2%増)
個別受注高
8
62億円 (前年同四半期比 101.3%増)
国内土木工事 331億円 (前年同四半期比 139.1%増)国内建築工事 522億円 (前年同四半期比 83.8%増)海外工事
8億円 (前年同四半期比 54.3%増)
増収増益。国内土木建築工事の売上総利益が大幅に増加。
国内土木建築工事が大幅に増加。
I 2027年3月期第1四半期 決算ハイライト
II 当第1四半期業績と通期予想
◆連結損益計算書
(単位:億円)
金額
百分比%
金額
百分比%
金額
百分比% 増減率%
金額
百分比%
金額
百分比%
金額
百分比% 増減率%
453
904
99.2
3,810
4,15 0
4
,150
8.9
(25)
(-
)
(41)
62.7
(112)
(15
0)
(150)
(33.8)
建設
事業
779
933
19.7
3,677
3,910
3,
910
6.3
不動産事業
等
49
92
88.1
282
490
490
73.4
82
9
100.0
1
,026
100.0 23.8
3,9
60
100.0
4,400
100.0
4,400
100.0 11.1
建設事業
74
9.6
113
12.2 51.8
423
11.5
475
12.1
475
12.1 12.2
不動産事業等
15
32.2
24
26.4 54.2
119
42.2
105
21.4
105
21.4 ▲ 12.0
90
11.0
138
13.5 52.2
542
13.7
5
80
13.2
580
13.2
6.8
販売費及び一般管理費
60
7.3
68
6.7 12.9
262
6.6
295
6.7
295
6.7 12.4
30
3.7
69
6.8 130.8
280
7.1
285
6
.5
285
6.5
1.7
営業外収支
▲ 4
0
▲ 6
▲ 20
▲ 20
25
3.1
70
6.
8 176.1
273
6.9
265
6
.0
265
6.0 ▲ 3.2
特別損益
▲ 0
▲ 0
66
25
25
25
3.0
70
6.8 17
8.1
339
8.6
290
6
.6
290
6.6 ▲ 14.7
法人税等
9
24
101
95
95
▲ 0
▲ 1
▲ 2
▲ 10
▲
10
16
2.0
46
4.5 182.0
240
6.1
20 5
4
.7
205
4.7 ▲ 14.8
通 期
当第1四半期
(2026.
4.1 ~
2026.6.30)
前 期
当 期
(2026.4.1~2027.3.31)
2026/6
2026/3
2027/3
対
前期増減
売上
総利益
営業利益
期首予想
(2 0
25.4
.1~2026.
3.31)
期首予想
非支配株主に帰属する 四半期(当期)純利益
親会社株 主
に帰属する
四半期(当期)純利益
項 目
第1四半期累計期間
前第1四半期
対
前第1
四半期
増減
(202 5
.4.1~
2025.6.30)
実 績
2025/6
今回予想
建 設
事 業
受 注 高
(内子会社受注高)
経常利益
税引前純
利益
売上高
46
30
69
210
280
285
5.6%
3.7%
6.8%
5.8%
7.1%
6.5%
0
100200300
2024/6 2025
/6 2026/6 2025/3 2026/3 2027/3
(億円)
営業利益
営業利益
営業利益率
32
16
46
175
240
205
3.8%
2.0%
4.5%
4.8%
6.1%
4.7%
0
50
100150200250
2024/6 2
025/6 2026/6 2025/3 2026/3 2027/3
(億円)
親会社株主に帰属する四半期(当期)純利益
四半期(当期)純利益
当期純利益率
841
829
1,026
3,668
3,960
4,400
11.9%
11.0%
13.5%
12.0%
13.7%
13.2%
0
1,0002,0003,0004,00
0
5,000
2024/6 2025/6 2026/6 2025/3 2026/3 2027/3
(億円)
売上高・売上総利益率
売上高
売上総利益率
~第1四半期~
~ 通 期 ~
【主な増減要因(対前第1四半期)並びに発生原因】
①売上高
・国内土木工事の売上高の増加(44億円)・国内建築工事の売上高の増加(80億円)・海外工事の売上高の増加(28億円)
※連結子会社を含む
・不動産事業等売上高の増加(43億円)
※連結子会社を含む
②売上総利益
・国内土木工事の売上総利益の増加(13億円)・国内建築工事の売上総利益の増加(24億円)・海外工事の売上総利益の増加(0.5億円)
※連結子会社を含む
・不動産事業等売上総利益の増加(8億円)
※連結子会社を含む
(通期予想)
(通期予想)
(通期予想)
~第1四半期~
~ 通 期 ~
~第1四半期~
~ 通 期 ~
◆連結貸借対照表
(単位:億円)
金額
構成比%
金額
構成比%
増減額
増減率%
6,
860
100.0
6,516
100.0
▲ 343
▲ 5.0
4,815
70.2
4,502
69.1
▲ 313
▲ 6.5
(2,328)
(33.9)
(2,251)
(34.5)
(▲ 77)
(▲ 3.3)
(1.19)
(1.17)
(▲ 0.02)
6, 8
60
100.0
6,516
100.0
▲ 343
▲ 5.0
(28.4)
(29.5)
(1.1)
▲ 30
▲ 1
.5
2,044
29.8
2,013
30.9
資産
負債
資産 合計負債 合計
純資産
固定資産
流
動資産
固定負債
(D/Eレシオ 倍)
1,334
20.5
1,336
▲ 9.7
2,950
43.0
2,984
45.8
34
1.2
3,909
57.0
3,531
54.2
▲ 1
▲ 0.1
(内有利子負債)
(自己資本比率 %)
負債・純資産
合計
2026/3
2026/6
▲ 311
▲ 9.0
▲ 377
項 目
流動負債
3,479
50
.7
3,168
48.6
19.5
実 績
前 期
当第1四半
期
対前期末増減
(2 0
26.3.31)
(2026.6.30)
2,950
2,984
3,909
3,531
0
1,0002,0003,0004,0005,0006,0007,000
2026/3
2026/6
(億円)
資産の部
固定資産
流動資産
2,044
2,013
1,336
1,334
3,479
3,168
0
1,0002,0003,0004,0005,0006,0007,000
2026/3
2026/6
(億円)
負債・純資産の部
純資産
固定負債
流動負債
2,328
2,251
28.4%
29.5%
0
500
1,0001,5002,0002,
500
3,000
2026/3
2026/6
(億円)
有利子負債と自己資本比率
有利子負債自己資本比率
【主な増減要因(対前期末)】
①流動資産
・受取手形・完成工事未収入金の減少(▲355億円)・販売用不動産の減少(▲39億円)
②固定資産
・有形固定資産の増加(44億円)
③流動負債
・支払手形・工事未払金等の減少(▲70億円)・短期借入金の減少(▲70億円)・未成工事受入金の減少(▲53億円)
④固定負債
・長期借入金の減少(▲7億円)
⑤純資産
・四半期純利益の計上(46億円)・配当金の支払(▲51億円)
◆損益計算書(個別)
(単位:億円)
金額
百分比%
金額
百分比%
金額
百分比% 増減率%
金額
百分比%
金額
百分比%
金額
百分比% 増減率%
428
862
101.3
3,698
4,0 0
0
4,000
8.2
建設事業
75
9
904
19.1
3,552
3,750
3,
750
5.6
不動産事業
等
39
81
104.8
241
415
415
71.7
7
98
100.0
9
85
100.0 23.4
3,794
1
00.0
4,165
100.0
4,165
100.0
9.8
建設事業
73
9.7
112
12.4 52.7
415
11.7
470
12.5
470
12.5 13.1
不動産事業等
11
29.9
20
24.7 69.4
91
37.7
70
16.9
70
16.9 ▲ 23.1
85
10.7
132
13.5 55.1
506
13.3
5
40
13.0
540
13.0
6.6
販売費及び一般管理費
55
6.9
60
6.2
9.4
236
6.2
260
6.2
260
6.2 10.1
30
3.8
71
7.3 139.3
270
7.1
280
6
.7
280
6.7
3.6
営業外収支
▲ 1
0
▲ 0
▲ 15
▲ 15
28
3.6
72
7.
3 154.2
270
7.1
265
6
.4
265
6.4 ▲ 1.9
特別損益
▲ 0
▲ 0
74
25
25
28
3.5
72
7.3 15
5.7
344
9.1
290
7
.0
290
7.0 ▲ 15.8
法人税等
8
24
100
95
95
19
2.4
47
4.9 14
7.2
244
6.4
195
4
.7
195
4.7 ▲ 20.2
四半期(当期)純利益
通 期
前 期
営業利益経常利益
税引前純利益
建
設 事
業 受 注 高
売上高
売上
総利益
項 目
第1四半期累計期間
前第1四半期
(2025.4.1
~
2025.6.30)
実 績
2025/6
対
前期増減
対
前第1
四半期
増減
当第1 四
半期
(2
026.4.1~2026.
6.30)
2026/6
期首予想
当 期
(2026.4.1~
2027.3.31)
2026/3
2027/3
(2025.4.1~2026.3.31)
期首予想
今回予想
47
30
71
204
270
280
5.7%
3.8%
7.3%
5.9%
7.1%
6.7%
0
100200300
2024/6 2025
/6 2026/6 2025/3 2026/3 2027/3
(億円)
営業利益
営業利益営業利益率
50
28
72
201
270
265
6.2%
3.6%
7.3%
5.8%
7.1%
6.4%
0
100200300
2024/6 2025
/6 2026/6 2025/3 2026/3 2027/3
(億円)
経常利益
経常利益経常利益率
34 19
47
175
244
195
4.2%
2.4%
4.9%
5.0%
6.4%
4.7%
0
50
100150200250
2024/62
025/62026/62025/32026/32027/3
(億円)
四半期(当期)純利益
四半期(当期)純利益当期純利益率
822
798
985
3,479
3,794
4,165
11.6%
10.7%
13.5%
11.9%
13.3%
13.0%
0
1,0002,0003,0004,00
0
5,000
2024/6 2025/6 2026/6 2025/3 2026/3 2027/3
(億円)
売上高・売上総利益率
売上高売上総利益率
~第1四半期~
~ 通 期 ~
~第1四半期~
~ 通 期 ~
~第1四半期~
~ 通 期 ~
~第1四半期~
~ 通 期 ~
(通期予想)
(通期予想)
(通期予想)
(通期予想)
◆受注高(個別)
(単位:億円)
金額
構成比%
金額
構成比%
増減額
増減率%
金額
構成比%
金額
構成比%
金額
構成比%
増減額
増減率%
官 公 庁
66
15.4
264
30.7
198
300.7
535
14.5
建 土 民 間
72
16.9
66
7.7
▲ 5
▲ 8.2
280
7.6
計
138
32.3
331
38.4
192
139.1
815
22.1
1,250
31.3
1,250
31.3
434
53.2
木 海 外
5
1.3
8
1.0
3
54.1
454
12.3
250
6.3
250
6.3
▲ 204
▲ 45.0
計
144
33.6
339
39.4
195
135.8
1,270
34.3
1,500
37.5
1,500
37.5
229
18.1
設
官 公 庁
0
0.1
51
5.9
50
114
3. 1
建
民 間
283
66.3
471
54.7
187
66.1
2,318
62.7
計
284
66.4
522
60.6
238
83.8
2,433
65.8
2,500
62.5
2,500
62.5
66
2.7
築 海 外
0
0.0
0
▲ 5
▲ 0.1
0
0.0
0
0.0
5
事
計
284
66.4
522
60.6
238
83.8
2,428
65.7
2,500
62.5
2,500
62.5
71
3.0
官 公 庁
66
15.5
315
36.6
249
375.1
649
17.6
民 間
356
83.2
538
62.4
181
51.0
2,599
70.3
計
計
422
98.7
853
99.0
430
101.9
3,249
87.9
3,750
93.8
3,750
93.8
500
15.4
業
海 外
5
1.3
8
1.0
3
54.3
448
12.1
250
6.3
250
6.3
▲ 198
▲ 44.3
計
428
100.0
862
100.0
434
101.3
3,698
100.0
4,000
100.0
4,000
100.0
301
8.2
国内国内国内
第1四半期累計期間
項 目
前第1四半期
当第1四半期
対前第1
四半期
増減
(2025.4.
1
~2025.6.30) (2026.4.1~2026.6.30)
2025/6
2026/6
(2025.4.1~2026.3.31)
期首予想
通 期
前 期
当 期
(2026.4
.
1~2027.3.31)
2026/3
2027/3
対前期増減
今回予想
138
331
815
1,250
284
522
2,433
2,500
5
8
448
250
428
862
3,698
4,000
0
1,0002,0003,0004,00
0
5,000
2025/6 2026/6 2026/3 2027/3
(億円)
受注高
国内土木
国内建築
海 外
66
264
535
1,250
(国内)
72
66
280
5
8
454
250
(海外)
144
339
1,270
1,500
0
500
1,0001,5002,0002,
500
3,000
2025/6 2026/6 2026/3 2027/3
(億円)
土木受注高
官公庁
民 間
海 外
0
51
114
283
471
2,318
2,500
(国内)
0
0
0
(海外)
284
522
2,428
2,500
0
500
1,0001,5002,0002,
500
3,000
2025/6 2026/6 2026/3 2027/3
(億円)
建築受注高
官公庁
民 間
海 外
38.4%
60.6%
1.0%
受注構成比(当第1四半期)
国内土木国内建築海 外
~第1四半期~
~第1四半期~
~ 通 期 ~
~ 通 期 ~
~第1四半期~
~ 通 期 ~
(通期予想)
(通期予想)
(通期予想)
▲5
◆売上高(個別)
(単位:億円)
金額
構成比%
金額
構成比%
増減額
増減率%
金額
構成比%
金額
構成比%
金額
構成比%
増減額
増減率%
官 公 庁
175
22.0
201
20.4
25
14.6
811
21.4
建 土 民 間
80
10.0
98
10.0
18
23.2
399
10.5
計
255
32.0
299
30.4
44
17.3
1,211
31.9
1,300
31.2
1,300
31.2
88
7.3
木 海 外
37
4.7
57
5.9
20
53.8
195
5.2
170
4.1
170
4.1
▲ 25
▲ 13.2
計
293
36.7
357
36.3
64
22.0
1,407
37.1
1,470
35.3
1,470
35.3
62
4.5
設
官
公 庁
46
5.8
57
5.8
11
24.0
224
5.9
建 民 間
419
52.5
489
49.6
69
16.6
1,925
50.8
計
465
58.3
546
55.5
80
17.3
2,150
56.7
2,280
54.7
2,280
54.7
129
6.0
築 海 外
0
0.0
0
▲ 5
▲ 0.1
0
0.0
0
0.0
5
事
計
465
58.3
546
55.5
80
17.3
2,145
56.5
2,280
54.7
2,280
54.7
134
6.3
官 公 庁
221
27.8
258
26.2
36
16.5
1,035
27.3
民 間
499
62.6
587
59.7
88
17.6
2,325
61.3
計
計
721
90.3
846
85.9
124
17.3
3,361
88.6
3,580
86.0
3,580
86.0
218
6.5
業
海 外
37
4.7
57
5.9
20
53.9
190
5.0
170
4.1
170
4.1
▲ 20
▲ 10.8
計
759
95.0
904
91.8
145
19.1
3,552
93.6
3,750
90.0
3,750
90.0
197
5.6
25
3.2
27
2.7
1
7.4
106
2.8
103
2.5
103
2.5
▲ 3
▲ 2.9
6
0.9
50
5.1
43
635.3
106
2.8
310
7.4
310
7.4
203
190.9
7
1.0
4
0.4
▲ 3
▲ 45.2
29
0.8
2
0.0
2
0.0
▲ 27
▲ 93.1
39
5.0
81
8.2
41
104.8
241
6.4
415
10.0
415
10.0
173
71.7
合
計
798
100.0
985
100.0
186
23.4
3,794
100.0
4,165
100.0
4,165
100.0
370
9.8
国内国内国内
(2025.4.1~2025.6.30)
項 目
前第1四半期
不動産事業等
賃
貸 事 業
販 売 事 業
そ の 他
計
第1四半期累計期間
(2
026.4.1~2026.6.30)
今回予想
20 2
5/6
2026/6
通 期
前 期
当 期
(2026.4.1~2027.3.31)
2026/3
2027/3
(2025.4.1~2026.3.31)
期首予想
当第1
四半期
対前第1
四半期
増減
対前期増減
255
299
1,211
1,300
465
546
2,150
2,280
37
57
190
170
39
81
241
415
798
985
3,794
4,165
0
1,0
00
2,0003,0004,0005,000
2025/6 2026/6 2026/3 2027/3
(億円)
売上高
国内土木
国内建築
海 外
不動産事業等
175
201
811
1,300
(国内)
80
98
399
37
57
195
170
(海外)
293
357
1,407
1,470
0
500
1
,000
1,500
2025/6 2026/6 2026/3 2027/3
(億円)
土木売上高
官公庁
民 間
海 外
46
57
224
419
489
1,925
2,280
(国内)
0
0
0
(海外)
465
546
2,145
2,280
0
500
1
,000
1,5002,0002,500
2025/6 2026/6 2026/3 2027/3
(億円)
建築売上高
官公庁
民 間
海 外
30.4%
55.5%
5.9%
8.2%
売上構成比(当第1四半期)
国内土木国内建築海 外不動産事業等
~第1四半期~
~第1四半期~
~第1四半期~
~ 通 期 ~
~ 通 期 ~
~ 通 期 ~
(通期予想)
(通期予想)
(通期予想)
▲5
◆繰越高(個別)
(単位:億円)
金額
構成比%
金額
構成比%
増減額
増減率%
金額
構成比%
官 公 庁
2,093
32.7
1,990
29.1
▲ 103
▲ 4.9
1,926
28.0
建 土 民 間
731
11.4
587
8.6
▲ 143
▲ 19.6
619
9.0
計
2,824
44.1
2,577
37.7
▲ 247
▲ 8.7
2,546
37.0
木 海 外
666
10.4
907
13.3
241
36.2
957
13.9
計
3,491
54.5
3,485
50.9
▲ 5
▲ 0.2
3,503
50.9
設
官 公 庁
418
6.5
348
5.1
▲ 7
0
▲ 16.8
354
5.2
建 民 間
2,499
39.0
3,010
44.0
510
20.4
3,028
44.0
計
2,918
45.5
3,358
49.1
440
15.1
3,382
49.1
築 海 外
事
計
2,918
45.5
3,358
49.1
440
15.1
3,382
49.1
官 公 庁
2,512
39.2
2,338
34.2
▲ 173
▲ 6.9
2,281
33.1
民 間
3,230
50.4
3,598
52.6
367
11.4
3,647
53.0
計
計
5,743
89.6
5,936
86.7
193
3.4
5,929
86.1
業
海 外
666
10.4
907
13.3
241
36.2
957
13.9
計
6,410
100.0
6,844
100.0
434
6.8
6,886
100.0
国内国内
第1四半期累計期間
項 目
前第1四半期
当第1四半期
対前第1
四半期
増減
(2025.6.
3
0)
(2026.6.30)
2025/6
2026/6
前 期
2026/3
(2026.3.3
1)
通 期
国内
2,824
2,577
2,918
3,358
666
907
6,410
6,844
0
1,0002,0003,0004,00
0
5,0006,0007,0008,000
2025/6
2026/6
(億円)
繰越高
国内土木
国内建築
海 外
2,093
1,990
731
587
666
907
3,491
3,485
0
1,0002,0003,0004,00
0
2025/6
2026/6
(億円)
土木繰越高
官公庁
民 間
海 外
418
348
2,499
3,010
0
0
2,918
3,358
0
1,0002,0003,0004,00
0
2025/6
2026/6
(億円)
建築繰越高
官公庁
民 間
海 外
37.7%
49.1%
13.3%
繰越構成比(当第1四半期)
国内土木国内建築海 外
◆売上総利益(個別)
(単位:億円)
金額
利益率%
金額
利益率%
金額
増減ポイント
金額
利益率%
金額
利益率%
金額
利益率%
増減額
増減ポイント
22
8.7
35
12.0
13
3.3
163
13.5
180
13.8
180
13.8
16
0.3
2
7.9
3
6.4
0
▲ 1.5
1
0.7
10
5.9
10
5.9
8
5.2
25
8.6
39
11.1
14
2.5
165
11.7
190
12.9
190
12.9
24
1.2
48
10.4
72
13.3
24
2.9
250
11.7
280
12.3
280
12.3
29
0.6
0
9.9
0
9.9
▲ 0
0
0.0
0
0.0
0
48
10.4
72
13.3
24
2.9
250
11.7
280
12.3
280
12.3
29
0.6
70
9.8
108
12.9
38
3.1
414
12.3
460
12.8
460
12.8
45
0.5
2
7.9
3
6.4
0
▲ 1.5
0
0.5
10
5.9
10
5.9
9
5.4
73
9.7
112
12.4
38
2.7
415
11.7
470
12.5
470
12.5
54
0.8
9
38.7
11
41.1
1
2.4
35
33.7
34
33.0
34
33.0
▲ 1
▲ 0.7
1
25.7
9
18.0
7
▲ 7.7
50
47.8
35
11.3
35
11.3
▲ 15
▲ 36.5
0
4.8
▲ 0
▲ 1.0
▲ 0
▲ 5.8
4
15.0
1
25.0
1
25.0
▲ 3
10.0
11
29.9
20
24.7
8
▲ 5.2
91
37.7
70
16.7
70
16.7
▲ 21
▲ 21.0
85
10.7
132
13.5
47
2.8
506
13.3
540
13.0
540
13.0
33
▲ 0.3
(※1)一部売上原価の配賦基準見直しに伴い、変更後基準に基づき算定した金額を記載しております。
合
計
国 内海 外
計
計
国 内海 外
計
建設事業
土木
国
内
海 外
計
建築
不動産事業等
賃 貸 事 業
項 目
2025/6
計
販 売 事 業
そ の 他
202
6/6
当第1四半期
前第1四半期
通 期
2
027/3
当 期
(2026.4.1~2027.3.31)
対前期増減
(2025.4.1~2025.6.30) (2026.4.1~2026.6.30)
今回予想
対前第1
四半期
増減
期首予想
前 期
2026/3
(2025.4.1~2026.3.31)
第1四半期累計期間
25
39
165
190
8.6%
11.1%
11.7%
12.9%
0
50
100150200250300
2025/
6 2026/6 2026/3 2027/3
(通期予想)
(億円)
土木売上総利益
売上総利益売上総利益率
48
72
250
280
10.4%
13.3%
11.7%
12.3%
0
50
100150200250300
2025/
6 2026/6 2026/3 2027/3
(通期予想)
(億円)
建築売上総利益
売上総利益売上総利益率
25
39
165
190
48
72
250
280
11
20
91
70
85
132
506
540
10.7%
13.5%
13.3%
13.0%
0
100200300400500600
2025
/6 2026/6 2026/3 2027/3
(通期予想)
(億円)
売上総利益
土 木建 築不動産事業等
~第1四半期~
~ 通 期 ~
~第1四半期~
~ 通 期 ~
~第1四半期~
~ 通 期 ~
9
11
35
34
1
9
50
35
0
4
1
11
20
91
70
29.9%
24.7%
37.7%
16.7%
0.05.010.015.020.025.030
.0
35.040.0
0
306090
120150
2025/6 202
6/6 2026/3 2027/3
(億円)
不動産事業等売上総利益
賃 貸 事 業販 売 事 業そ の 他
~第1四半期~
~ 通 期 ~
(通期予想)
▲0
(
※
1)
III 建設事業の業績詳細
◆受注高の国内海外別・官民別の推移(個別)
(単位:百万円)
土 木
129,630
36.9%
204,591
49.9%
127,014
34.3%
14,414
33.6%
33,984
39.4%
国内官庁
88,321
25.1%
163,811
40.0%
53,500
14.5%
6,603
15.4%
26,458
30.7%
国内民間
30,859
8.8%
25,742
6.3%
28,093
7.6%
7,241
16.9%
6,648
7.7%
国 内 計
119,
181
33.9%
189,553
46.2%
81,594
22.1%
13,845
32.3%
33,107
38.4%
海 外
10,449
3.0%
15,038
3.7%
45,420
12.3%
569
1.3%
877
1.0%
建 築
221,614
63.1%
205,312
50.1%
242,805
65.7%
28,434
66.4%
52,268
60.6%
国内官庁
27,343
7.8%
23,678
5.8%
11,468
3.1%
39
0.1%
5,103
5.9%
国内民間
194,184
55.3%
181,624
44.3%
231,864
62.7%
28,394
66.3%
47,164
54.7%
国 内 計
221,
528
63.1%
205,302
50.1%
243,332
65.8%
28,434
66.4%
52,267
60.6%
海 外
86
0.0%
9
0.0%
▲ 527
▲0.1%
-
0.0%
1
0.0%
建設事業計
351,245
100.0%
409,904
100.0%
369,819
100.0%
42,848
100.0%
86,253
100.0%
国内官庁
115,664
32.9%
187,489
45.7%
64,969
17.6%
6,643
15.5%
31,561
36.6%
国内民間
225,044
64.1%
207,366
50.6%
259,957
70.3%
35,635
83.2%
53,812
62.4%
国 内 計
340,
709
97.0%
394,856
96.3%
324,927
87.9%
42,279
98.7%
85,374
99.0%
海 外
10,535
3.0%
15,048
3.7%
44,892
12.1%
569
1.3%
879
1.0%
◆受注高の工事種類別内訳と構成比(個別)
(単位:百万円)
土 木
129,630
100.0%
204,591
100.0%
127,014
100.0%
14,414
100.0%
33,984
100.0%
治山・治水
14,287
11.0%
42,249
20.7%
12,604
9.9%
281
2.0%
863
2.5%
鉄道
32,166
24.8%
29,005
14.2%
61,984
48.8%
3,179
22.1%
1,995
5.9%
上水道・下水道
17,248
13.3%
30,643
15.0%
1,817
1.4%
153
1.1%
328
1.0%
土地造成
8,136
6.3%
5,871
2.9%
3,149
2.5%
2,624
18.2%
1,238
3.6%
港湾・空港
5,178
4.0%
21,339
10.4%
1,237
1.0%
-
0.0%
7
0.0%
道路
38,902
30.0%
61,696
30.2%
28,130
22.1%
5,159
35.8%
6,037
17.8%
電線路
4
0.0%
1,228
0.6%
88
0.1%
-
0.0%
2
0.0%
その他
13,705
10.6%
12,557
6.0%
18,002
14.2%
3,016
20.8%
23,511
69.2%
建 築
221,614
100.0%
205,312
100.0%
242,805
100.0%
28,434
100.0%
52,268
100.0%
事務所・庁舎
50,585
22.8%
36,804
17.9%
70,375
29.0%
608
2.1%
8,496
16.3%
宿泊施設
941
0.4%
7,393
3.6%
488
0.2%
1,198
4.2%
1,022
2.0%
店舗
1,787
0.8%
2,516
1.2%
3,541
1.5%
179
0.6%
390
0.7%
工場・発電所
38,201
17.2%
37,465
18.2%
38,597
15.9%
18,222
64.1%
13,257
25.4%
倉庫・流通施設
49,708
22.4%
67,737
33.0%
103,390
42.6%
2,072
7.3%
419
0.8%
住宅
29,709
13.4%
31,307
15.2%
6,645
2.7%
1,138
4.0%
1,151
2.2%
教育・研究・文化施設
44,392
20.0%
8,799
4.3%
11,830
4.9%
1,700
6.0%
17,281
33.1%
医療・福祉施設
1,569
0.7%
360
0.2%
163
0.1%
12
0.0%
5,659
10.8%
娯楽施設
2,305
1.0%
164
0.1%
74
0.0%
59
0.2%
-
0.0%
その他
2,412
1.3%
12,763
6.3%
7,698
3.1%
3,242
11.5%
4,587
8.7%
建設事業
2024/3
2025/3
2026/3
2025/6
2026/6
2026/6
建設事業
2024/3
2025/3
2026/3
2025/6
◆売上高の国内海外別・官民別の推移(個別)
(単位:百万円)
土 木
125,698
34.8%
130,250
40.5%
140,732
39.6%
29,328
38.6%
35,768
39.6%
国内官庁
84,651
23.4%
78,105
24.3%
81,156
22.8%
17,553
23.1%
20,110
22.2%
国内民間
20,694
5.7%
29,063
9.0%
39,987
11.3%
8,017
10.6%
9,875
10.9%
国 内 計
105,345
29.1%
107,168
33.4%
121,143
34.1%
25,570
33.7%
29,985
33.2%
海 外
20,352
5.6%
23,081
7.2%
19,588
5.5%
3,758
5.0%
5,782
6.4%
建 築
235,860
65.2%
191,042
59.5%
214,507
60.4%
46,593
61.4%
54,655
60.4%
国内官庁
21,614
6.0%
21,622
6.7%
22,443
6.3%
4,621
6.1%
5,731
6.3%
国内民間
214,160
59.2%
169,410
52.7%
192,591
54.2%
41,972
55.3%
48,922
54.1%
国 内 計
235,774
65.2%
191,032
59.5%
215,034
60.5%
46,593
61.4%
54,654
60.4%
海 外
86
0.0%
9
0.0%
▲ 527
▲0.1%
-
0.0%
1
0.0%
建設事業計
361,558
100.0%
321,293
100.0%
355,239
100.0%
75,922
100.0%
90,423
100.0%
国内官庁
106,265
29.4%
99,727
31.0%
103,599
29.2%
22,174
29.2%
25,841
28.6%
国内民間
234,854
65.0%
198,473
61.8%
232,578
65.5%
49,989
65.8%
58,797
65.0%
国 内 計
341,120
94.3%
298,201
92.8%
336,177
94.6%
72,164
95.0%
84,639
93.6%
海 外
20,438
5.7%
23,091
7.2%
19,061
5.4%
3,758
5.0%
5,784
6.4%
◆売上高の工事種類別内訳と構成比(個別)
(単位:百万円)
土 木
125,698
100.0%
130,250
100.0%
140,732
100.0%
29,328
100.0%
35,768
100.0%
治山・治水
11,213
8.9%
11,890
9.1%
15,874
11.3%
2,941
10.0%
4,728
13.2%
鉄道
24,875
19.8%
34,820
26.7%
42,831
30.4%
8,122
27.7%
12,002
33.6%
上水道・下水道
16,960
13.5%
11,899
9.1%
10,477
7.4%
2,539
8.7%
1,917
5.4%
土地造成
5,109
4.1%
10,878
8.4%
8,711
6.2%
2,294
7.8%
1,910
5.3%
港湾・空港
10,911
8.7%
3,973
3.1%
4,790
3.4%
1,233
4.2%
394
1.1%
道路
43,767
34.8%
41,821
32.1%
42,257
30.0%
7,885
26.9%
9,787
27.4%
電線路
-
0.0%
338
0.3%
664
0.5%
219
0.7%
147
0.4%
その他
12,860
10.2%
14,628
11.2%
15,123
10.8%
4,091
14.0%
4,880
13.6%
建 築
235,860
100.0%
191,042
100.0%
214,507
100.0%
46,593
100.0%
54,655
100.0%
事務所・庁舎
33,126
14.0%
23,417
12.3%
50,020
23.3%
11,926
25.6%
10,509
19.2%
宿泊施設
6,192
2.6%
4,354
2.3%
6,586
3.1%
1,867
4.0%
790
1.4%
店舗
1,200
0.5%
3,047
1.6%
2,780
1.3%
206
0.4%
522
1.0%
工場・発電所
25,102
10.6%
37,497
19.6%
37,879
17.7%
6,455
13.9%
10,909
20.0%
倉庫・流通施設
91,113
38.6%
53,524
28.0%
64,453
30.0%
14,156
30.4%
16,171
29.6%
住宅
36,778
15.6%
29,509
15.4%
20,674
9.6%
4,647
10.0%
5,733
10.5%
教育・研究・文化施設
21,902
9.3%
25,568
13.4%
20,002
9.3%
3,365
7.2%
7,081
13.0%
医療・福祉施設
10,369
4.4%
5,463
2.9%
180
0.1%
17
0.0%
61
0.1%
娯楽施設
2,183
0.9%
1,196
0.6%
74
0.0%
-
0.0%
-
0.0%
その他
7,890
3.5%
7,463
3.9%
11,854
5.6%
3,951
8.5%
2,874
5.2%
建設事業
2024/3
2025/3
2026/3
2025/6
2026/6
2026/6
建設事業
2024/3
2025/3
2026/3
2025/6
◆繰越高の国内海外別・官民別の推移(個別)
(単位:百万円)
土 木
289,753
49.5%
364,094
54.0%
350,376
50.9%
349,180
54.5%
348,592
50.9%
国内官庁
134,637
23.0%
220,343
32.7%
192,687
28.0%
209,393
32.7%
199,036
29.1%
国内民間
77,199
13.2%
73,878
11.0%
61,984
9.0%
73,102
11.4%
58,757
8.6%
国 内 計
211,8
37
36.2%
294,221
43.6%
254,672
37.0%
282,496
44.1%
257,793
37.7%
海 外
77,916
13.3%
69,872
10.4%
95,703
13.9%
66,683
10.4%
90,798
13.3%
建 築
295,710
50.5%
309,980
46.0%
338,278
49.1%
291,820
45.5%
335,892
49.1%
国内官庁
44,387
7.6%
46,443
6.9%
35,468
5.2%
41,861
6.5%
34,839
5.1%
国内民間
251,323
42.9%
263,536
39.1%
302,810
44.0%
249,959
39.0%
301,052
44.0%
国 内 計
295,7
10
50.5%
309,980
46.0%
338,278
49.1%
291,820
45.5%
335,892
49.1%
海 外
-
0.0%
-
0.0%
-
0.0%
-
0.0%
-
0.0%
建設事業計
585,463
100.0%
674,074
100.0%
688,654
100.0%
641,000
100.0%
684,484
100.0%
国内官庁
179,024
30.6%
266,786
39.6%
228,156
33.1%
251,255
39.2%
233,876
34.2%
国内民間
328,522
56.1%
337,415
50.1%
364,794
53.0%
323,061
50.4%
359,809
52.6%
国 内 計
507,5
47
86.7%
604,201
89.6%
592,951
86.1%
574,317
89.6%
593,686
86.7%
海 外
77,916
13.3%
69,872
10.4%
95,703
13.9%
66,683
10.4%
90,798
13.3%
◆繰越高の工事種類別内訳と構成比(個別)
(単位:百万円)
土 木
289,753
100.0%
364,094
100.0%
350,376
100.0%
349,180
100.0%
348,592
100.0%
治山・治水
15,643
5.4%
46,002
12.6%
42,733
12.2%
43,343
12.4%
39,164
11.2%
鉄道
138,146
47.7%
132,320
36.3%
151,473
43.2%
127,377
36.5%
141,464
40.6%
上水道・下水道
22,859
7.9%
40,393
11.1%
31,733
9.1%
38,007
10.9%
30,144
8.6%
土地造成
20,197
7.0%
15,190
4.2%
9,628
2.7%
15,520
4.4%
8,957
2.6%
港湾・空港
3,498
1.2%
20,863
5.7%
17,310
4.9%
19,630
5.6%
16,924
4.9%
道路
68,961
23.8%
88,836
24.4%
74,708
21.3%
86,109
24.7%
70,958
20.4%
電線路
4
0.0%
894
0.2%
318
0.1%
675
0.2%
172
0.0%
その他
20,441
7.0%
19,591
5.5%
22,470
6.5%
18,516
5.3%
40,807
11.7%
建 築
295,710
100.0%
309,980
100.0%
338,278
100.0%
291,820
100.0%
335,892
100.0%
事務所・庁舎
61,503
20.8%
74,890
24.2%
95,245
28.2%
63,572
21.8%
93,193
27.7%
宿泊施設
3,710
1.3%
6,748
2.2%
650
0.2%
6,079
2.1%
878
0.3%
店舗
968
0.3%
436
0.1%
1,198
0.4%
409
0.1%
1,095
0.3%
工場・発電所
45,481
15.4%
45,449
14.7%
46,166
13.6%
57,216
19.6%
46,123
13.7%
倉庫・流通施設
50,746
17.2%
64,959
21.0%
103,896
30.7%
52,876
18.1%
88,090
26.2%
住宅
53,002
17.9%
54,800
17.7%
40,771
12.1%
51,292
17.6%
36,190
10.8%
教育・研究・文化施設
55,068
18.6%
38,299
12.4%
30,127
8.9%
36,634
12.6%
42,707
12.7%
医療・福祉施設
5,119
1.7%
17
0.0%
-
0.0%
12
0.0%
5,598
1.7%
娯楽施設
1,032
0.3%
-
0.0%
-
0.0%
59
0.0%
-
0.0%
その他
19,077
6.5%
24,377
7.7%
20,221
5.9%
23,668
8.1%
22,015
6.6%
建設事業
2024/3
2025/3
2026/3
2025/6
2026/6
2026/6
建設事業
2024/3
2025/3
2026/3
2025/6
IV 連結子会社情報(第1四半期)
◆主要な連結子会社の業績
(単位:百万円)
泰国西松建設【国際事業】
建設事業受注高 売 上 高
売上総利益
営業利益
経常利益
当期純利益
2025/6
2,462
2,119
48
▲ 54
▲ 45
▲ 42
2026/6
3,943
2,705
▲ 208
▲ 309
▲ 330
▲ 267
西松ベトナム【国際事業】
建設事業受注高 売 上 高
売上総利益
営業利益
経常利益
当期純利益
2025/6
▲ 162
282
72
21
27
27
2026/6
437
670
28
▲ 25
▲ 22
▲ 22
西松地所【環境・都市開発事業】
建設事業受注高 売 上 高
売上総利益
営業利益
経常利益
当期純利益
2025/6
-
729
85
25
10
2
2026/6
-
1,186
79
▲ 18
▲ 23
▲ 45
◆連結主要数値の内訳
(単位:百万円)
当 社
土木子会社
国際子会社
環境・都市開発
子 会 社
合 計
消 去
連 結 計
売
上
高
98,549
186
3,375
1,740
103,852
▲ 1,223
102,629
営
業
利
益
7,193
67
▲ 337
▲ 201
6,722
269
6,992
経
常
利
益
7,223
66
▲ 349
▲ 175
6,765
247
7,012
親 会 社 株 主 に 帰 属 す る四 半 期 純 利 益
4,780
48
▲ 285
▲ 173
4,369
281
4,651
総
資
産
604,152
194
11,408
75,678
691,434
▲ 39,808
651,626
有 形 固 定 資 産
148,296
6
470
39,605
188,379
816
189,196
純
資
産
181,973
49
4,861
42,806
229,692
▲ 28,345
201,347
有 利 子 負 債
204,270
75
1,530
21,772
227,648
▲ 2,538
225,110
V 財務データ
◆報告セグメント別情報(連結)
(単位:百万円)
2
025/6
2026/6
土木事業
売上高 外部顧客への売上高
25,688
30,259
セグメント間の内部売上高又は振替高
計
25,688
30,259
セグメント利益又は損失(▲)(※2)
374
1,745
建築事業
売上高 外部顧客への売上高
47,204
54,953
セグメント間の内部売上高又は振替高
11
計
47,216
54,953
セグメント利益又は損失(▲)(※2)
2,221
4,332
国際事業
売上高 外部顧客への売上高
5,823
8,701
セグメント間の内部売上高又は振替高
336
457
計
6,160
9,159
セグメント利益又は損失(▲)(※2)
▲ 95
▲ 401
環境・都市開発事業(※1)
売上高
外部顧客への売上高
4,191
8,714
セグメント間の内部売上高又は振替高
67
409
計
4,258
9,124
セグメント利益又は損失(▲)(※2)
508
1,011
計
売上高 外部顧客への売上高
82,907
102,629
セグメント間の内部売上高又は振替高
415
867
計
83,323
103,497
セグメント利益又は損失(▲)
3,009
6,688
調整額
売上高 外部顧客への売上高
セグメント間の内部売上高又は振替高
▲ 415
▲ 867
計
▲ 415
▲ 867
セグメント間取引消去
19
303
連結
売上高 外部顧客への売上高
82,907
102,629
セグメント間の内部売上高又は振替高
計
82,907
102,629
セグメント利益又は損失(▲)
3,029
6,992
(※2)当第1四半期会計期間より、報告セグメントごとの業績をより適正に評価するため、一般管理費等の配賦基準を見直し、報告セグメントの利益又は損失の算定方法を変更しております。なお、前第1四半期連結累計期間のセグ(
※1)従来「アセットバリューアッド事業」並びに「地域環境ソリューション事業」としていたセグメント区分を統合して、名称を「環境・都市開発事業」に変更し、報告セグメントの区分方法の見直しを行っております。
メント情報については、変更後の算定方法及び区分に基づき作成したものを記載しております。
◆主要数値(連結)
(単位:億円)
予 想
2024/6 2025/6 2
026/6 2025/3 2026/3 2027/3
有利子負債
2,161.4 2,354.8 2,251.1 2,142.1 2,328.3 2,400.0
保証債務
0.6
0.4
0.3
0.5
0.3
0.1
設備投資・出資
80.0
61.9
84.1
481.2
340.3
346.0
研究開発費
4.9
6.1
6.4
23.6
28.5
36.0
減価償却費
9.1
9.7
9.5
39.8
40.6
44.0
金融収支
1.0
▲ 2.0
▲ 3.1
▲ 4.4 ▲ 12.2 ▲ 22.0
※減価償却費は有形固定資産のみ
◆主要数値(個別)
(単位:億円)
予 想
2024/6 2025/6
2
026/6 2025/3 2026/3 2027/3
有利子負債
1,924.7 2,068.7 2,042.7 1,858.7 2,112.7 2,200.0
保証債務
107.1
0.0
0.0
97.6
0.0
0.0
設備投資・出資
75.1
58.0
72.5
443.7
270.3
312.0
研究開発費
4.9
6.1
6.4
23.6
28.5
36.0
減価償却費
8.5
9.2
9.1
36.5
38.1
37.0
金融収支
1.7
0.4
▲ 2.6
▲ 1.1
▲ 7.8 ▲ 20.0
※減価償却費は有形固定資産のみ
実 績
実 績
第1四半期
実 績
実 績
通 期
第1四半期
通 期
23.6
28.5
36.0
0
10203040
2025/3
2026/3
2027/3
(億円)
研究開発費(連結)
研究開発費
2,142.1
2,328.3
2,400.0
0
500
100015002000250030
00
2025/3
2026/3
2027/3
(億円)
有利子負債(連結)
有利子負債
(通期予想)
(通期予想)
VI 主な経営指標
◆経営指標の推移(連結)
第86期
第87期
第88期
第89期
第90期
第1
四半期
第1四半期
第1四半期
第1四半期
第1四半期
2022/6
2023/6
2024/6
2025/6
2026/6
建 設 事 業 受 注 高 (百万円)
39,863
35,229
105,837
45,384
90,400
売
上
高 (百万円)
69,722
84,194
84,141
82,907
102,629
営 業 利 益 (百万円)
3,778
1,013
4,677
3,029
6,992
経 常 利 益 (百万円)
4,306
1,691
4,877
2,540
7,012
親 会 社 株 主 に 帰 属 す る四 半 期 純 利 益
(百万円)
2,802
1,065
3,232
1,649
4,651
総
資
産 (百万円)
455,442
522,182
563,402
603,274
651,626
純
資
産 (百万円)
157,011
157,027
171,968
176,456
201,347
自 己 資 本 比 率 (%)
33.0
28.6
29.1
27.8
29.5
D / E レ シ オ (倍)
1.00
1.19
1.32
1.40
1.17
1 株 当 た り 純 資 産 (円)
3,805.42
3,790.09
4,152.32
4,254.01
4,869.06
1 株 当 た り 純 利 益 (円)
70.99
26.99
81.89
41.79
117.80
期 末 従 業 員 数 (人)
3,244
3,313
3,437
3,533
3,973
70.99
26.99
81.89
41.79
117.80
0
20406080
100120
2022/6 2
023/6 2024/6 2025/6 2026/6
(円)
1株当たり純利益
1株当たり純利益
3,805.42
3,790.09
4,152.32
4,254.01
4,869.06
33.0%
28.6%
29.1%
27.8%
29.5%
0
1000200030004000500
0
2022/6 2023/6 2024/6 2025/6 2026/6
1株当たり純資産と自己資本比率
1株当たり純資産
自己資本比率
(円)
◆経営指標の推移(個別)
第86期
第87期
第88期
第89期
第90期
第1四半期
第1四半期
第1四半期
第1四半期
第1四半期
2022/6
2023/6
2024/6
2025/6
2026/6
建 設 事 業 受 注 高 (百万円)
35,734
34,821
103,694
42,848
86,253
売
上
高 (百万円)
68,544
81,373
82,249
79,891
98,549
営 業 利 益 (百万円)
3,563
967
4,704
3,006
7,193
経 常 利 益 (百万円)
4,165
1,701
5,095
2,842
7,223
四 半 期 純 利 益 (百万円)
2,713
1,122
3,494
1,933
4,780
資
本
金 (百万円)
23,513
23,513
23,513
23,513
23,513
(発行済株式総数・・・千株)
(55,591)
(55,591)
(55,591)
(41,791)
(41,791)
総
資
産 (百万円)
436,537
500,335
519,863
554,680
604,152
純
資
産 (百万円)
146,401
145,709
157,941
162,628
181,973
自 己 資 本 比 率 (%)
33.5
29.1
30.4
29.3
30.1
1 株 当 た り 純 資 産 (円)
3,708.90
3,691.45
4,001.50
4,120.25
4,608.78
1 株 当 た り 純 利 益 (円)
68.75
28.43
88.53
48.98
121.06
期 末 従 業 員 数 (人)
2,899
2,929
3,017
3,068
3,199




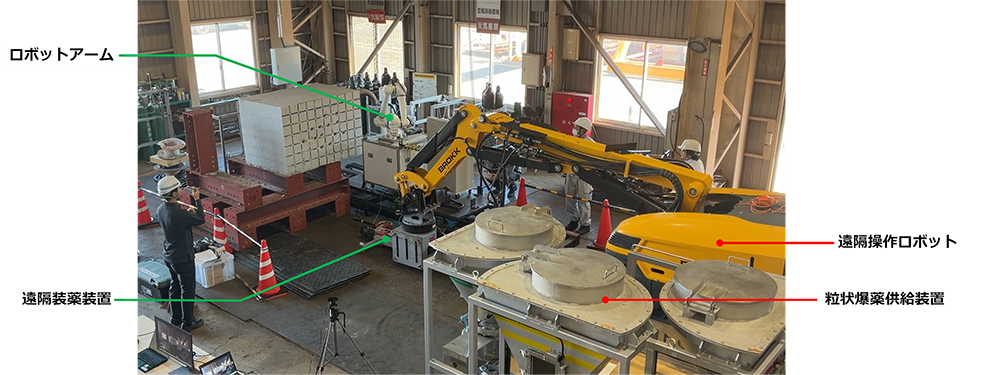 写真-1 遠隔装薬装置向け自動爆薬供給システム 全景
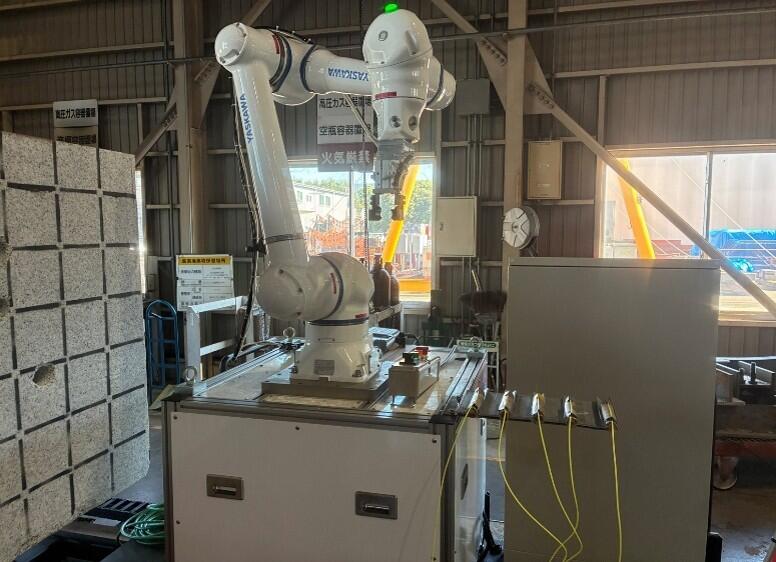
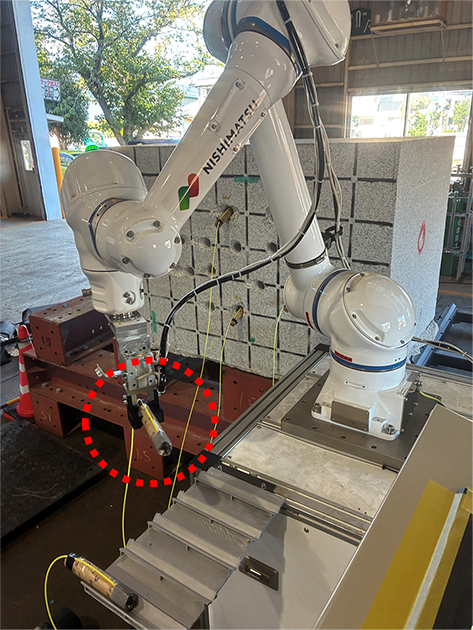
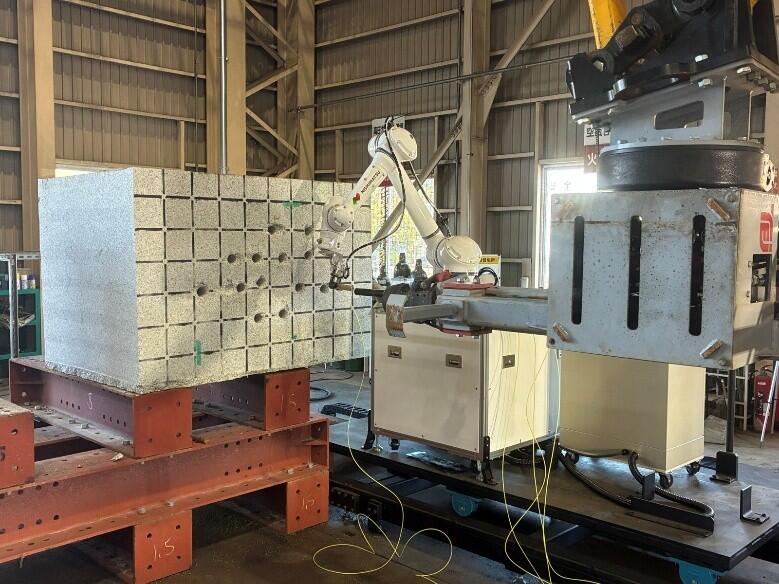
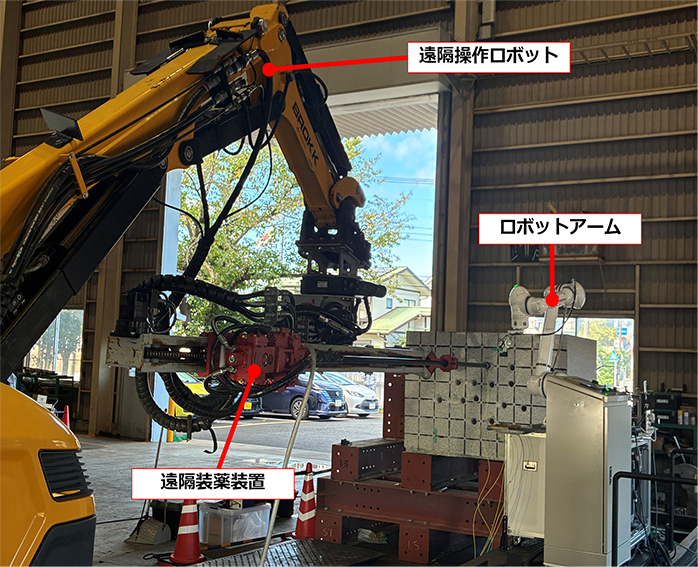
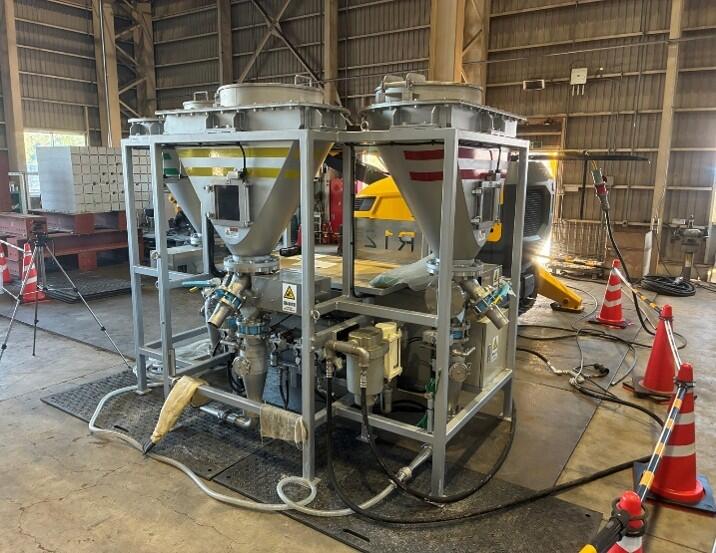
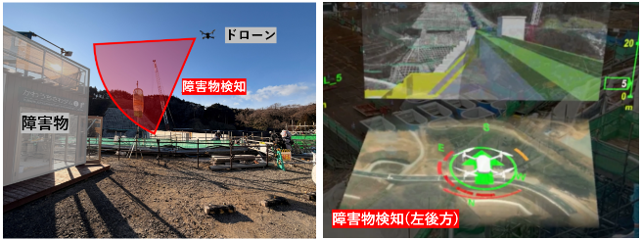 図4 HUDに表示される障害物の警告表示
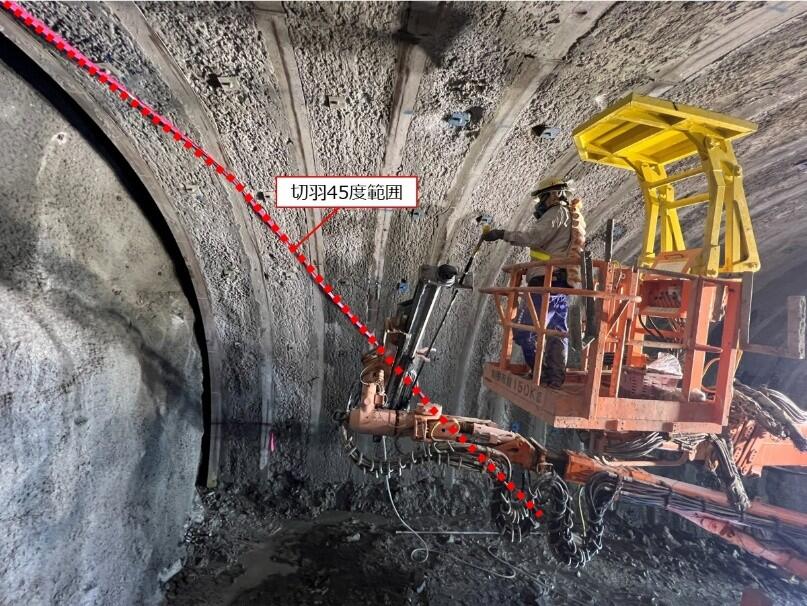
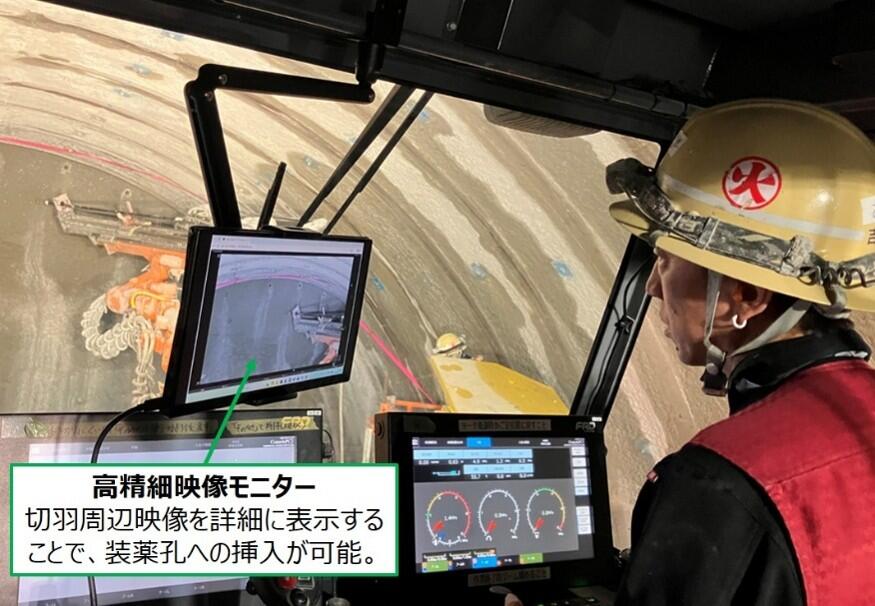
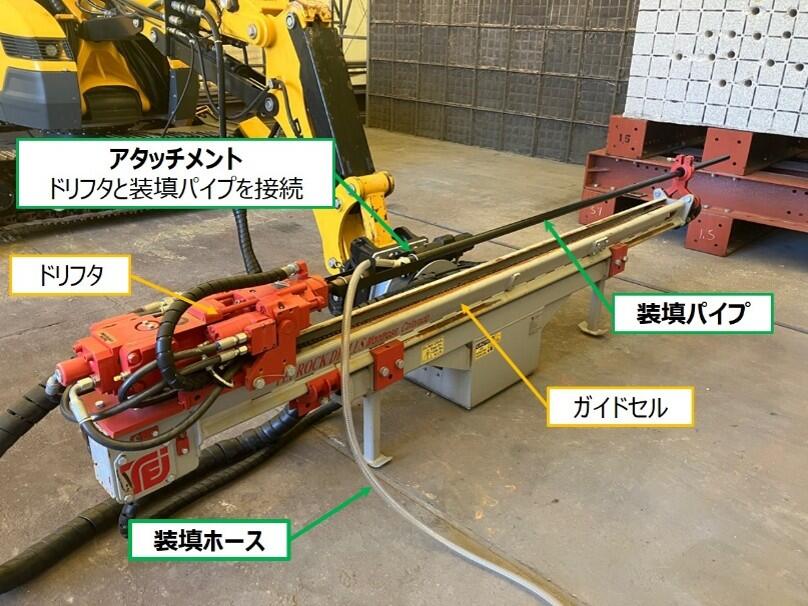
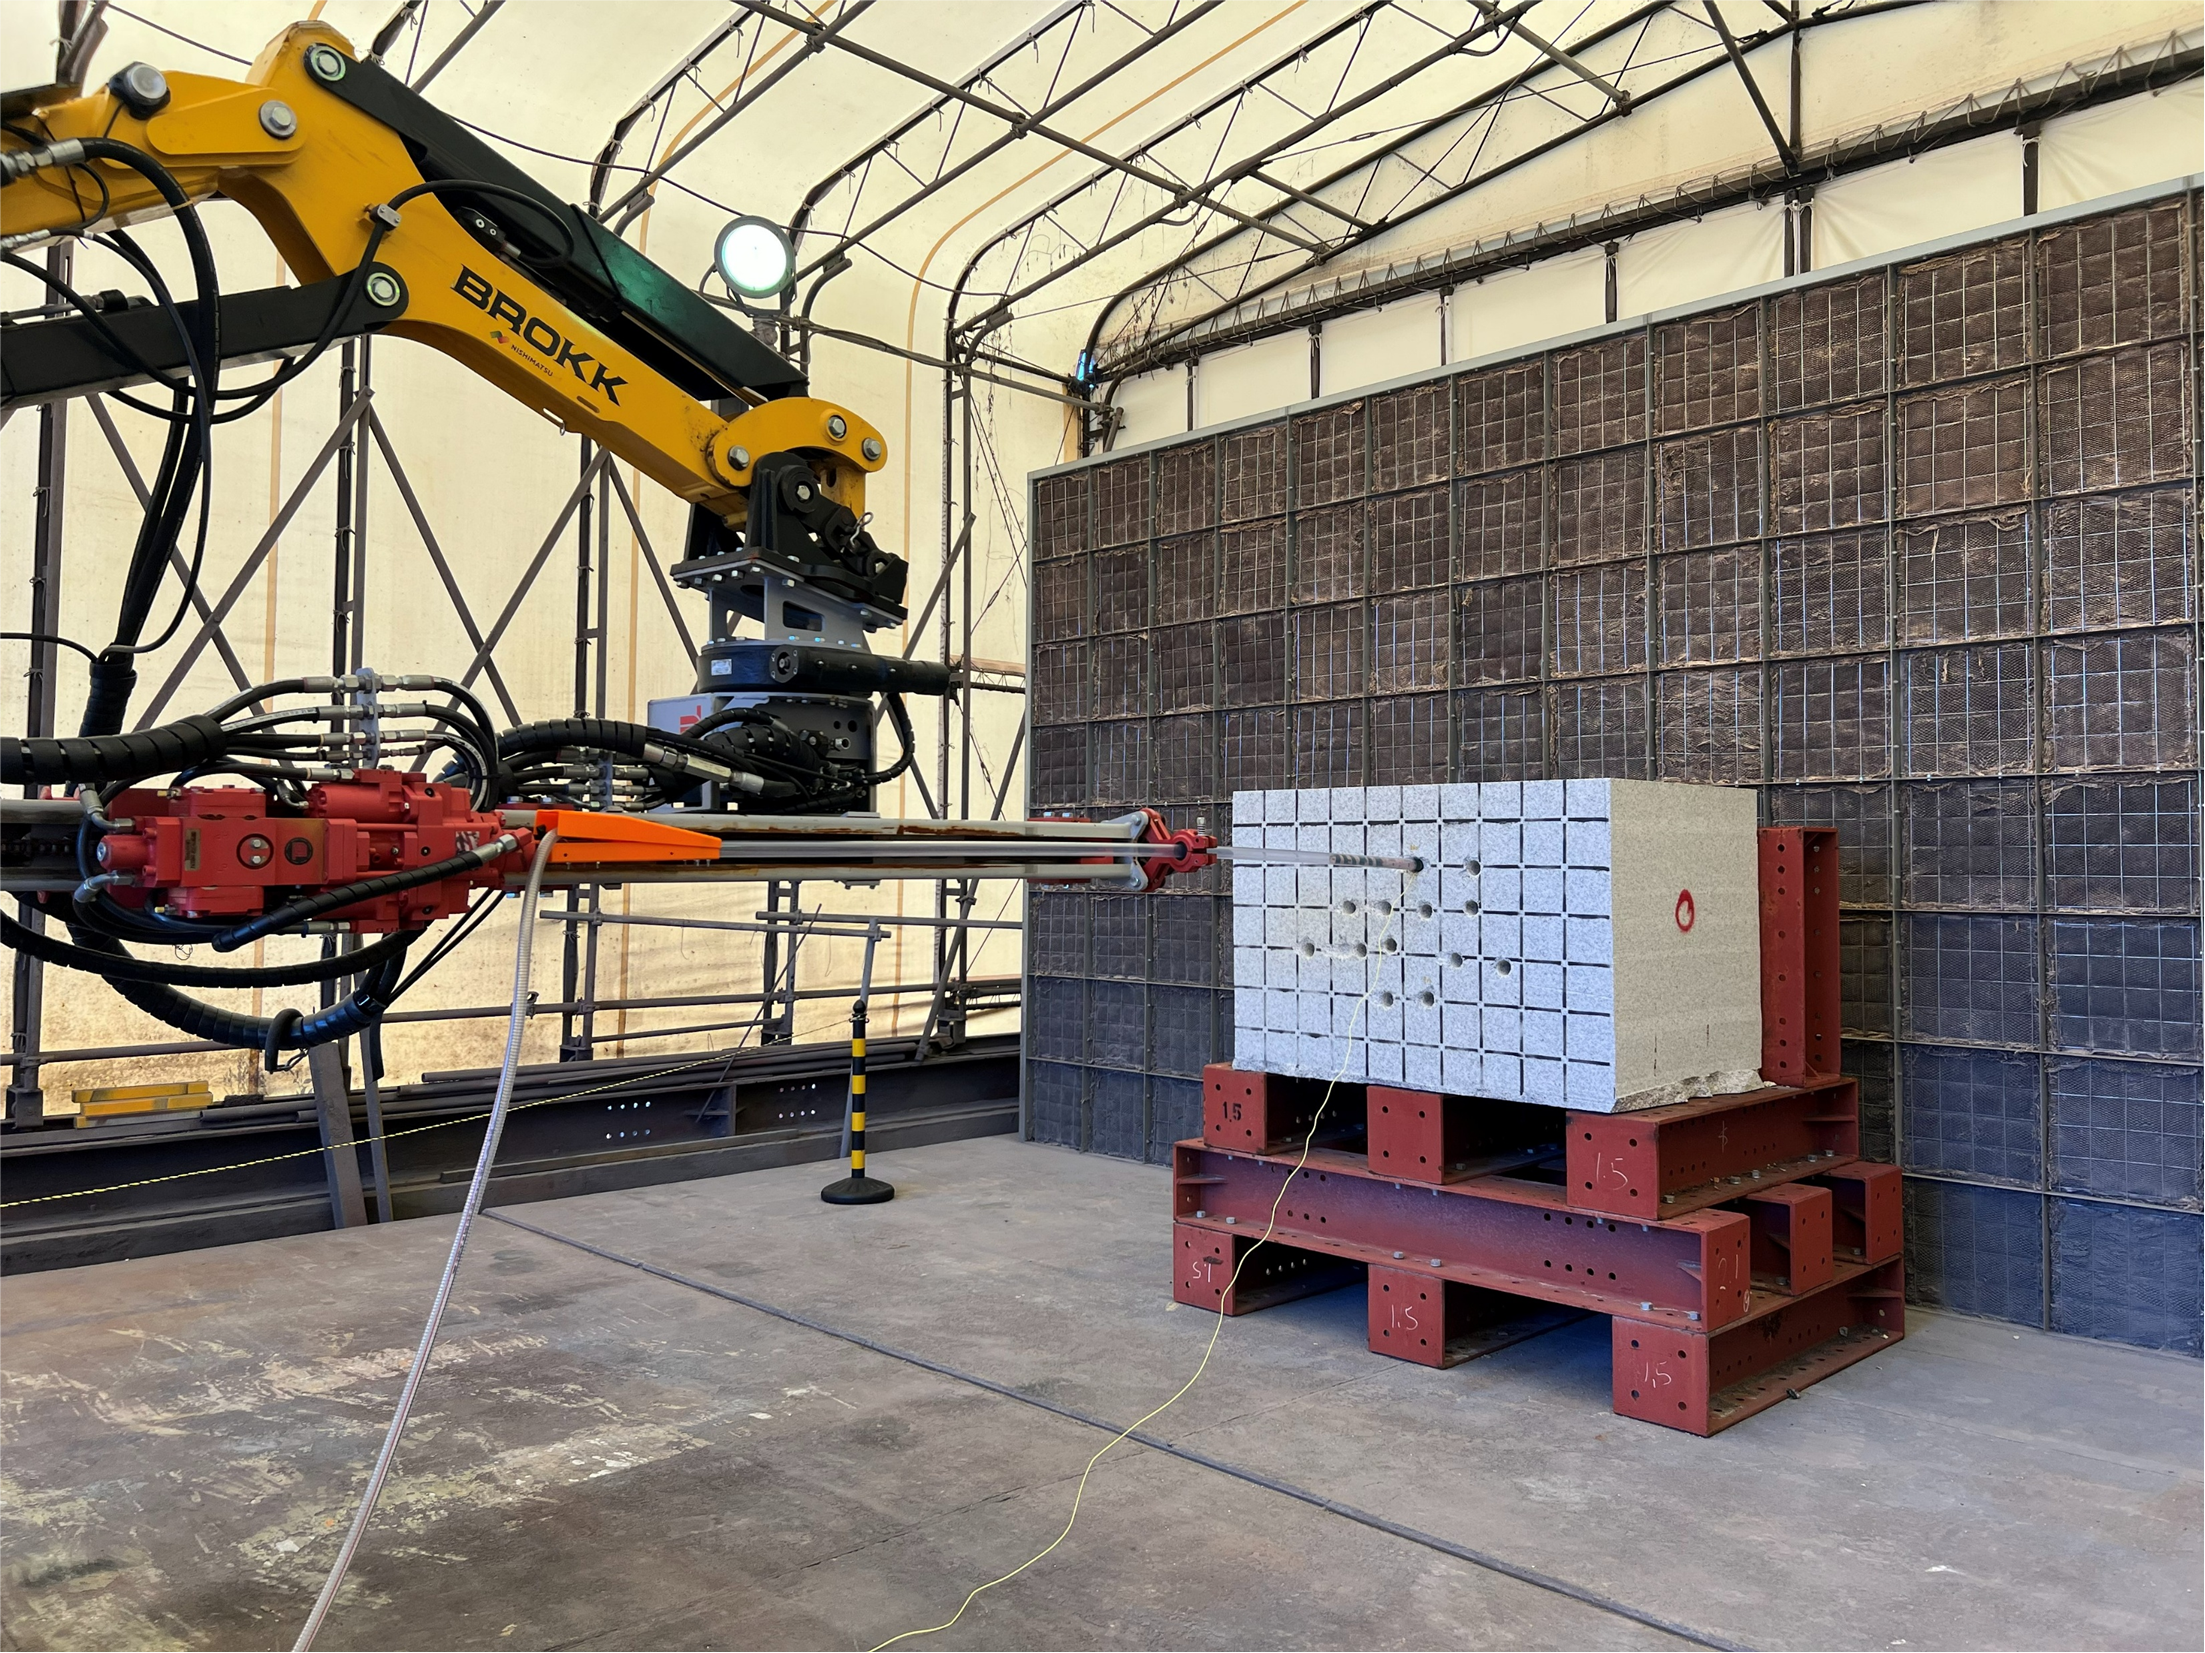
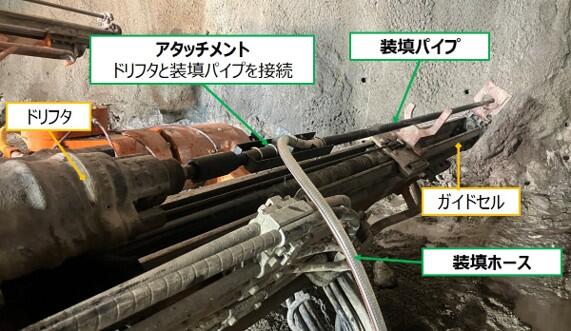 写真-1 遠隔装薬装置全景


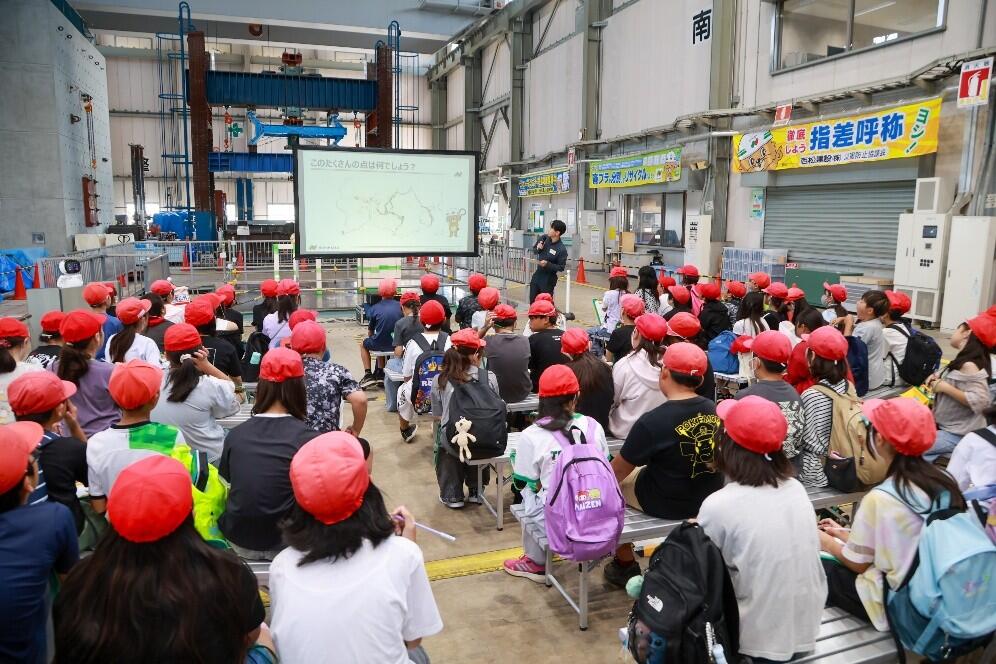

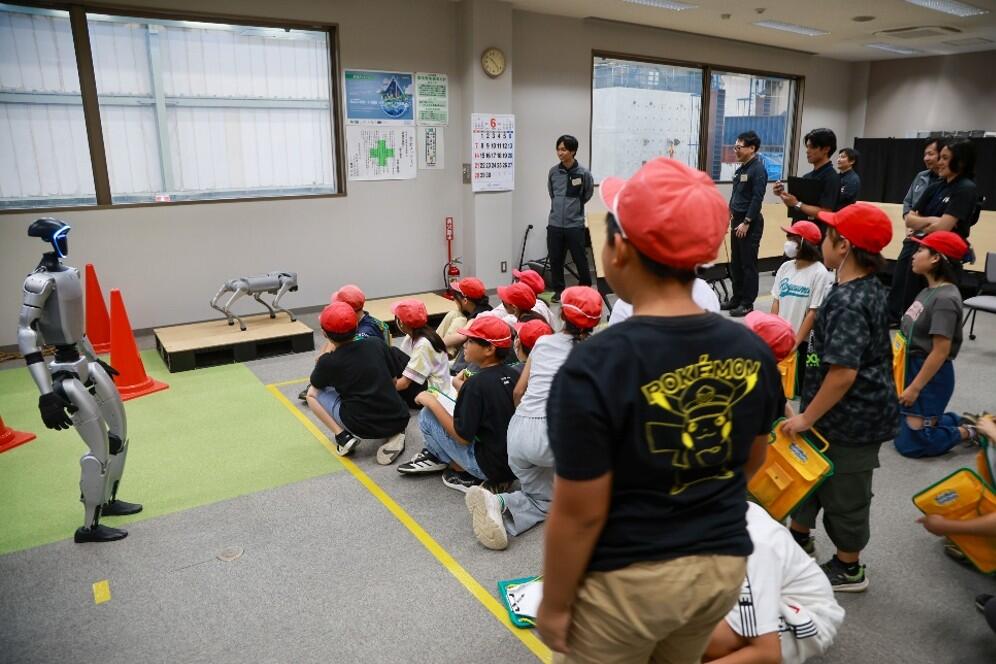

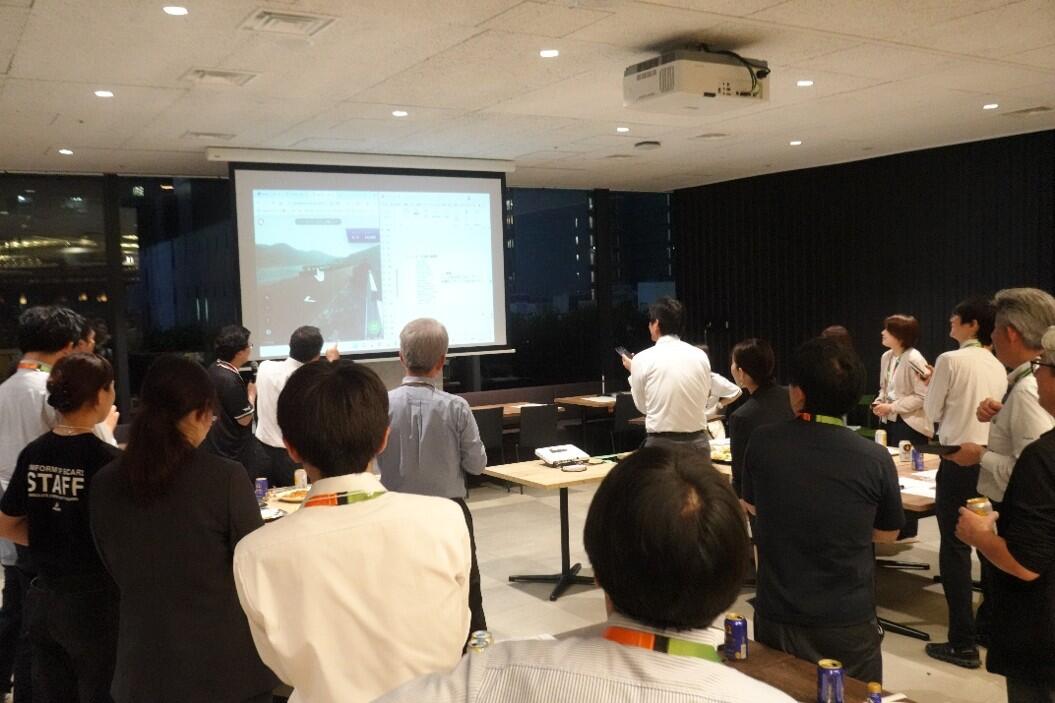
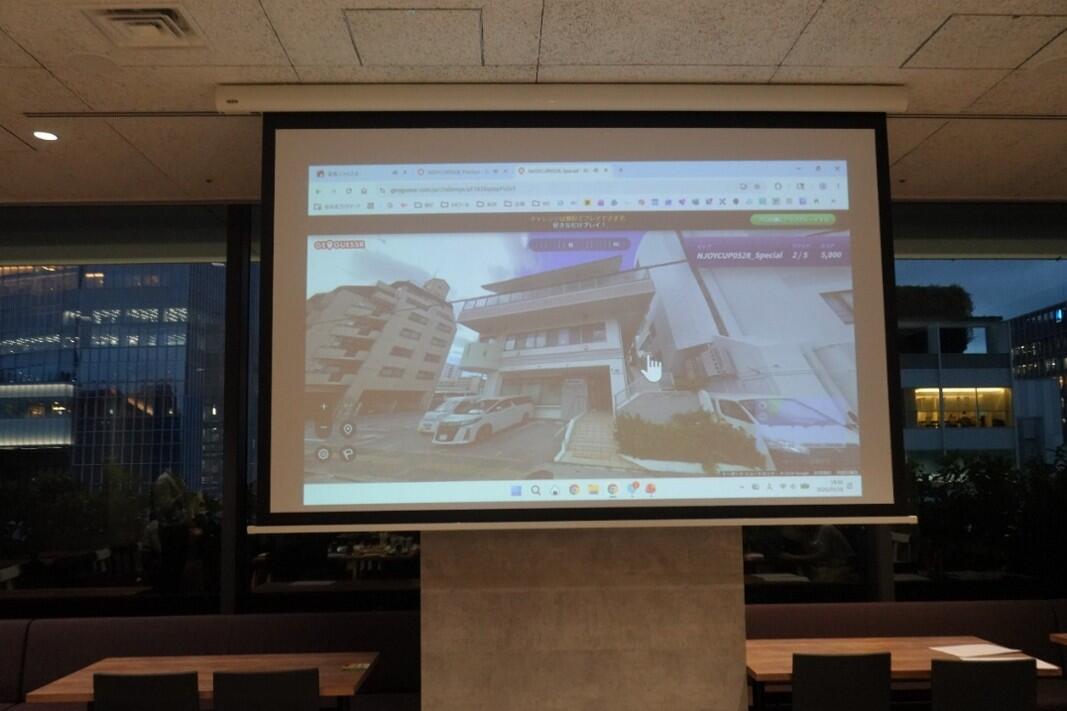 社内イベント「N JOY CUP」の様子
 図1 コンクリート自動吹付けシステム概要図
 図2 キャビン内におけるオペレータによる自動吹付け状況


