自己株式の取得状況に関するお知らせ
Bull 1
Bear 0
Capital return
Fiscal year ends May
Quarters are offset from the calendar — Q1 is Jun–Aug
|
Sakata Seed Corporation is a horticultural materials company that produces and distributes vegetable seeds, flower seeds, bulbs, seedlings, and agricultural supplies. The company operates through four main business segments: domestic wholesale, overseas wholesale, retail, and other services. In domestic wholesale, it supplies seed companies and producers in Japan. The overseas wholesale segment serves international seed companies and producers across regions including the Americas, Europe, Asia, and South America. The retail segment targets home gardening enthusiasts through home centers and mail-order sales in Japan. Additional services include landscaping construction, human resource dispatch, and commissioned research and development. Key subsidiaries include Sakata Seed America, Inc., Sakata Vegetables Europe S.A.S., Sakata Ornamentals Europe A/S, Sakata Seed Sudamerica Ltda., Sakata Seed Chile S.A., Sakata Korea Co., Ltd., Sakata Siam Seed Co., Ltd., Sakata Seed India Pvt Ltd., and Sakata Vietnam Co., Ltd. The group also includes subsidiaries such as Sakata Logistics Co., Ltd., Brolead Co., Ltd., and various cell-top production companies in Yamagata, Hida, and Fukuoka. Summarised from the annual report, fiscal year ended May 2026 |
Industry Agricultural Inputs | Homepage corporate.sakataseed.co.jp |
| Sector Basic Materials | IR page corporate.sakataseed.co.jp | |
|
Tags
vegetable seeds, flower seeds, bulbs, seedlings, agricultural supplies, seed distribution, horticulture, landscaping, research and development, Sakata Seed America Inc., Sakata Vegetables Europe S.A.S., Sakata Ornamentals Europe A/S, Sakata Seed Sudamerica Ltda., Sakata Seed Chile S.A., Sakata Korea Co. Ltd., Sakata Siam Seed Co. Ltd., Sakata Seed India Pvt Ltd., Sakata Vietnam Co. Ltd., NewBreed Ltd., Tikal Holding LLC, Domina S.R.L., Sakata Logistics Co. Ltd., Brolead Co. Ltd., Yamagata Celltop Co. Ltd., Hida Celltop Co. Ltd., Fukuoka Celltop Co. Ltd., Sakata Techno Service Co. Ltd., Sakata no Tane Green Service Co. Ltd., Genetwister Holding B.V.
|
Press page corporate.sakataseed.co.jp/news |
Metrics
| Valuation | |
|---|---|
| Market cap | ¥ 195.039B |
| Market cap (USD) | $ 1.219B |
| P/E | 15.10 |
| PEG | 1.75 |
| P/BV | 1.09 |
| P/S | 1.87 |
| P/OCF | 21.26 |
| P/FCF | 105.60 |
| Dividend yield | 2.0% |
| Turnover / mcap | — |
| Returns | |
|---|---|
| ROE | 7.1% |
| ROI | 6.6% |
| ROIC | 5.4% |
| Profit margin | 11.7% |
| Growth | |
|---|---|
| Revenue growing | Yes |
| Profits growing | No |
| Revenue up 3y | Yes |
| Revenue up 5y | Yes |
| Earnings growth 3y (net profit CAGR) | 8.6% |
| Quality | |
|---|---|
| Profitable | Yes |
| Margin expanding | No |
| Buying back stock | Yes |
| Diluting (TTM) | No |
| Debt/Equity | — |
| Podcast bulls (TTM) | Sign up |
| Podcast bears (TTM) | Sign up |
| Podcast sentiment (TTM) | Sign up |
| Podcast sentiment % (TTM) | Sign up |
| News sentiment (TTM) | 14 |
| Quality score | 11.1% |
| Insiders | |
|---|---|
| Buys, 1w | Sign up |
| Buys, 1m | Sign up |
| Buys, 1y | Sign up |
| Sells, 1w | Sign up |
| Sells, 1m | Sign up |
| Sells, 1y | Sign up |
Sign up to see this company's insider trades
| Figure | FY 2026 | FY 2025 | FY 2024 | FY 2023 | FY 2022 | FY 2021 | FY 2020 | FY 2019 | FY 2018 | FY 2017 | FY 2016 | FY 2015 | FY 2014 | FY 2013 |
|---|---|---|---|---|---|---|---|---|---|---|---|---|---|---|
| Revenue | 104.28B | 92.92B | 88.677B | 77.263B | 73.049B | 69.218B | 61.667B | 62.746B | 62.412B | 61.844B | 58.773B | 56.707B | 53.922B | 50.274B |
| Net profit | 12.163B | 9.711B | 16.162B | 9.489B | 12.256B | 7.636B | 6.094B | 6.856B | 5.767B | 6.112B | 5.215B | 3.82B | 2.681B | 3.098B |
| Free cash flow | 1.847B | -2.606B | 641M | 2.146B | 5.248B | 6.673B | 114M | -597M | -787M | 5.178B | 1.123B | — | — | — |
| Figure | FY 2026 | FY 2025 | FY 2024 | FY 2023 | FY 2022 | FY 2021 | FY 2020 | FY 2019 | FY 2018 | FY 2017 | FY 2016 | FY 2015 | FY 2014 | FY 2013 |
|---|---|---|---|---|---|---|---|---|---|---|---|---|---|---|
| Share price | 4.13K | 3.455K | 3.375K | 3.901K | 4.43K | 3.715K | 3.7K | 3.3K | 4.09K | 3.535K | 2.635K | 2.189K | 1.366K | 1.319K |
| Price performance 12m | 0.2 | 0.02 | -0.13 | -0.12 | 0.19 | 0 | 0.12 | -0.19 | 0.16 | 0.34 | 0.2 | 0.6 | 0.04 | — |
Filed figures
Lines the statements and their notes report beside the headline figures, read from the filings' XBRL as filed (no restatement applied), with figures computed from one filing's own lines. Cash-flow lines carry their cash direction: an outflow is negative. Each period links to its filing; a figure's period, report date and tag are in its tooltip.
| Figure | May 2017 | May 2018 | May 2019 | May 2020 | May 2021 | May 2022 | May 2023 | May 2024 | May 2025 | May 2026 |
|---|---|---|---|---|---|---|---|---|---|---|
| Balance sheet detail | ||||||||||
| Trade receivables (JPY) | 15.1B | 15.2B | 16.1B | 15.9B | 16.5B | 18.2B | 18.4B | 21.8B | 22.1B | 27.2B |
| ↳ YoY growth | +4.1% | +0.9% | +6.0% | -1.5% | +3.6% | +10.4% | +0.9% | +18.7% | +1.7% | +22.7% |
| ↳ 5y CAGR | +2.6% | +3.8% | +3.8% | +6.2% | +6.9% | +10.5% | ||||
| Borrowings, current (JPY) | 2.91B | 3.64B | 3.17B | 3.44B | 1.89B | 937M | 929M | 2.56B | 2.28B | 4.03B |
| Borrowings, non-current (JPY) | 1.28B | 1.26B | 1.98B | 1.27B | 894M | 553M | 536M | 1.08B | 587M | 1.55B |
| Cash and deposits (JPY) | 22.1B | 21.2B | 19.6B | 17.4B | 21B | 28.1B | 28.9B | 37.1B | 29.5B | 30.2B |
| Intangible assets (JPY) | 710M | 1.31B | 2.2B | 2.86B | 4.59B | 4.41B | 4.03B | 4.89B | 3.81B | 5.15B |
| Net debt (borrowings + leases - cash) (JPY) | -17.9B | -16.3B | -14.5B | -12.7B | -18.2B | -26.6B | -27.5B | -33.5B | -26.7B | -24.6B |
| Cash flow detail | ||||||||||
| Operating cash flow (JPY) | 7.61B | 4.62B | 5.53B | 3.44B | 11.4B | 10B | 8.35B | 6.97B | 5.1B | 9.17B |
| Purchases of property, plant and equipment (JPY) | -2.09B | -4.48B | -4.95B | -2.22B | -2.81B | -3.95B | -5.62B | -6.33B | -7B | -6.83B |
| Purchases of intangible assets (JPY) | -342M | -925M | -1.18B | -1.1B | -1.88B | -841M | -584M | -969M | -706M | -499M |
| Change in receivables (cash effect) (JPY) | -446M | -229M | -1.35B | -548M | -2M | — | 536M | -1.58B | -1.05B | -3.12B |
| Change in inventories (cash effect) (JPY) | -2.09B | -1.59B | -2.23B | -3.78B | 696M | -176M | -2.74B | -4.23B | -4.04B | -6.7B |
| Change in payables (cash effect) (JPY) | 2.15B | -983M | 433M | 747M | -464M | -363M | -398M | -570M | 1.37B | 602M |
| Dividends paid (cash effect) (JPY) | -1.13B | -1.24B | -1.57B | -1.47B | -1.47B | -1.82B | -2.08B | -2.66B | -3.07B | -3.46B |
| Share buybacks (cash effect) (JPY) | -3M | -8M | -1.48B | -2M | -2M | -910M | -4M | -1.83B | -2.15B | -3.29B |
| Interest paid (cash effect) (JPY) | -110M | -104M | -119M | -210M | -120M | -106M | -78M | -216M | -345M | -361M |
| Income taxes paid (cash effect) (JPY) | -2.13B | -2.5B | -1.81B | -2.13B | -2.24B | -2.71B | -5.02B | -3.36B | -8.66B | -2.82B |
| Operating cash flow before change in receivables (JPY) | 8.06B | 4.85B | 6.89B | 3.98B | 11.4B | — | 7.82B | 8.55B | 6.15B | 12.3B |
| Free cash flow (OCF - PPE - intangibles) (JPY) | 5.18B | -787M | -597M | 114M | 6.67B | 5.25B | 2.15B | -328M | -2.61B | 1.85B |
| Income detail | ||||||||||
| Research and development expense (JPY) | 5.44B | 5.69B | 5.62B | 6.32B | 6.98B | 8.13B | 9.07B | 10.4B | 10.6B | 12.9B |
| ↳ 5y CAGR | +6.9% | +8.4% | +9.8% | +13.1% | +10.9% | +13.1% | ||||
| Total comprehensive income (JPY) | 6.35B | 6.86B | 4.3B | 2.38B | 11.6B | 16.6B | 14.9B | 27B | 6.49B | 23.9B |
| Comprehensive income to owners (JPY) | 6.32B | 6.82B | 4.27B | 2.35B | 11.5B | 16.5B | 14.8B | 26.9B | 6.45B | 23.9B |
| Provision for credit losses (JPY) | -29M | 13M | 34M | 121M | -7M | 40M | -70M | 21M | 65M | 84M |
| Credit cost ratio (credit losses / average receivables) (%) | 0.2% | 0.1% | 0.2% | 0.8% | 0.0% | 0.2% | 0.4% | 0.1% | 0.3% | 0.3% |
| Segments | ||||||||||
| Domestic Wholesaling · Segment revenue (JPY) | — | — | — | — | — | — | — | 12.9B | 13.3B | 13.8B |
| ↳ YoY growth | +2.9% | +4.1% | ||||||||
| Domestic Wholesaling · Segment operating income (JPY) | — | — | — | — | — | — | — | 4.97B | 4.76B | 4.84B |
| Overseas Wholesaling · Segment revenue (JPY) | — | — | — | — | — | — | — | 69.6B | 74B | 84.9B |
| ↳ YoY growth | +6.4% | +14.7% | ||||||||
| Overseas Wholesaling · Segment operating income (JPY) | — | — | — | — | — | — | — | 18.2B | 20B | 21B |
| Retailing · Segment revenue (JPY) | — | — | — | — | — | — | — | 4.92B | 4.53B | 4.06B |
| ↳ YoY growth | -7.9% | -10.4% | ||||||||
| Retailing · Segment operating income (JPY) | — | — | — | — | — | — | — | -221M | -256M | -440M |
| Reported | Aug 29, 2017 | Aug 28, 2018 | Aug 27, 2019 | Aug 25, 2020 | Aug 24, 2021 | Aug 25, 2022 | Aug 27, 2024 | Aug 25, 2025 | Aug 25, 2025 | Aug 21, 2026 |
Sign up to see institutional holdings
Sign UpPodcast Mentions
Sign up to see podcast mentions and sentiment
Sign UpTimely disclosures published on TDnet, newest first, titles as filed in Japanese. The link opens the disclosure on TDnet. Filings with EDINET (periodic reports, extraordinary reports, offerings, holding and buy-back reports), newest first, titles as filed in Japanese. The link opens the filing on EDINET. Press releases from the company's own website, newest first.
自己株券買付状況報告書(法24条の6第1項に基づくもの)
Bull 1
Bear 0
Routine
サカタのタネが「花と野菜のプレミアムブレンド 培養土」を発売
Bull 1
Bear 0
Product/operations
暮らしになじむ洗練されたデザインに、厳しい環境下でも園芸の成功体験を
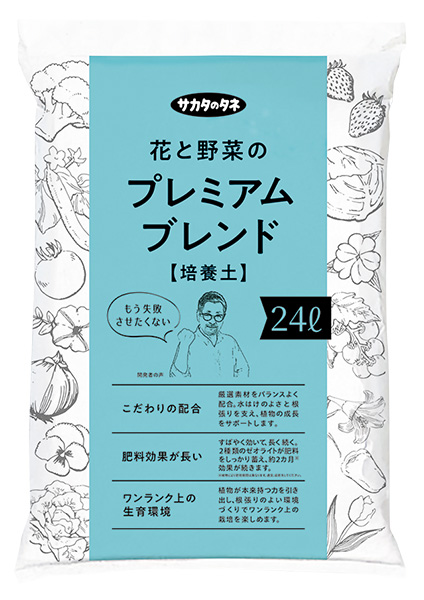
サカタのタネは、作物の根張りをサポートし、肥料効果が長い培養土「花と野菜のプレミアムブレンド 培養土」を当社通信販売で発売します。本商品は2026年春に販売した「花と野菜の培養土W-SOIL-305」を名称、パッケージを改め本格販売するものです。
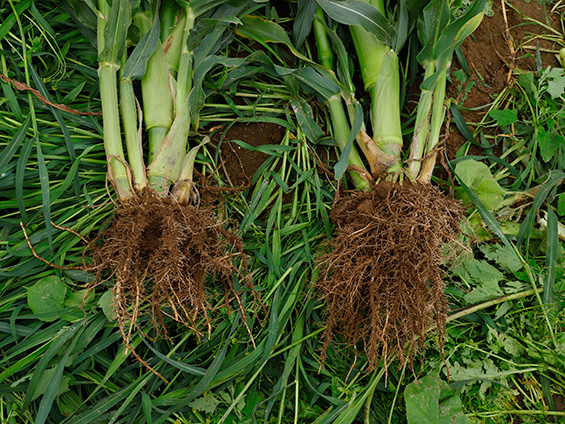
昨今、猛暑や豪雨、長雨など、植物にとって厳しい気候が恒常化しており、園芸初心者や中級者に失敗なく育てていただくことが家庭園芸の課題となっています。「花と野菜のプレミアムブレンド 培養土」は、初心者の方でも成功いただき、園芸の楽しさを知っていただくことをテーマに開発しています。具体的には、ピートモスや鹿沼土などの原料を独自の配合でブレンドすることで、団粒が発達しやすく、そのため、植物を支える主根だけでなく、肥料を吸収する細根もよく育ちます。昨今の厳しい環境下では、その対策として根をしっかりと育てることは非常に重要です。
また、園芸初心者にとって、追肥は忘れやすく、適切なタイミングを見極めることが難しい作業の一つです。「花と野菜のプレミアムブレンド 培養土」には保肥力(CEC)の向上などに幅広く働く特殊な腐植酸を、徐々に放出されるようにゼオライトに吸着させて配合しています。さらに、それとは別に肥料吸着用のゼオライトも配合し、最大2カ月分(※)の肥料効果を保つことができます。これにより、追肥忘れによる生育の停滞を軽減することが期待できます。
本格販売にあたり、今まで園芸に触れてこなかった層にもアプローチしていくため、ベランダや庭先などどこに置いても違和感がないようなシンプルなデザインを採用しました。
「花と野菜のプレミアムブレンド 培養土」は、オンラインショップを含む当社通信販売限定で、2026年11月中旬より受注を開始し、順次発送します。価格は1袋(24リットル入り)で1,980円(税込)です。
-
※
植物の種類により、肥効期間は異なります。適宜、追肥を行う必要があります。
「花と野菜のプレミアムブレンド 培養土」開発秘話
https://sakata-tsushin.com/yomimono/tokushu/detail_1567/
ニュース
最新情報 2026年 2025年 2024年 2023年 2022年


© SAKATA SEED CORPORATION 1999-2026








Prompts
Click prompts to add them under the company line, click again to take one out, then copy the result into your AI chat. Shared by Asian Century Stocks and Uncovered Thai Stocks. Thank you.
Sakata Seed Corporation (ticker 1377), listed in Japan.
Copied
ETFs Holding Sakata Seed Corporation
Exchange-traded funds whose newest published daily portfolio holds one of the company's listings, largest weight first.
| ETF | Weight in ETF | Shares | Market value | As of |
|---|---|---|---|---|
| AVDS | 0.02% | 3,300 | $ 89.04K | Nov 16, 2026 |
| DXIV | 0.01% | 900 | $ 24.146K | Nov 12, 2026 |
| DFIS | 0.01% | 19,600 | $ 525.854K | Nov 12, 2026 |
| DISV | 0.01% | 15,200 | $ 407.805K | Nov 12, 2026 |
| DFIC | 0.01% | 40,800 | $ 1.095M | Nov 12, 2026 |
| DFAX | 0.00% | 20,000 | $ 536.585K | Nov 12, 2026 |
| DFSI | 0.00% | 1,900 | $ 50.976K | Nov 12, 2026 |
| DFAI | 0.00% | 16,600 | $ 445.366K | Nov 12, 2026 |
| AVDE | 0.00% | 9,000 | $ 242.836K | Nov 16, 2026 |