|
Kyokuyo Co., Ltd. is a Japanese food company operating in the seafood and fresh food sectors. The group conducts business through four main segments: the seafood business, which involves the purchasing, processing, and sales of aquatic products; the fresh business, focused on processing and selling raw food items such as sushi ingredients and sashimi, including the capture, farming, and sales of bonito and tuna; the food business, which manufactures and sells commercial and retail frozen foods, canned goods, and seafood delicacies; and the logistics services business, which operates refrigerated warehouses. The company also engages in insurance agency services. Key subsidiaries include Kyokuyo America Corporation, Kyokuyo Suisan, Kyokuyo Foods, Joki, Kyokuyo Akitsu Reito, and Kyokuyo Sogo Service. Summarised from the annual report, fiscal year ended Mar 2026 |
Industry Packaged Foods | Homepage kyokuyo.co.jp |
| Sector Consumer Defensive | IR page kyokuyo.co.jp | |
|
Tags
seafood processing, sushi ingredients, frozen foods, canned goods, refrigerated logistics, aquaculture, commercial food service, Kyokuyo America Corporation, Kyokuyo Suisan, Kyokuyo Foods, Joki, Kyokuyo Akitsu Reito, Kyokuyo Sogo Service
|
Press page kyokuyo.co.jp/news |
Metrics
| Valuation | |
|---|---|
| Market cap | ¥ 55.56B |
| Market cap (USD) | $ 347.255M |
| P/E | 7.57 |
| PEG | 1.31 |
| P/BV | 0.68 |
| P/S | 0.16 |
| P/OCF | 17.39 |
| P/FCF | 81.95 |
| Dividend yield | 3.3% |
| Turnover / mcap | — |
| Returns | |
|---|---|
| ROE | 9.3% |
| ROI | 4.5% |
| ROIC | 4.6% |
| Profit margin | 2.0% |
| Growth | |
|---|---|
| Revenue growing | Yes |
| Profits growing | Yes |
| Revenue up 3y | No |
| Revenue up 5y | No |
| Earnings growth 3y (net profit CAGR) | 5.8% |
| Quality | |
|---|---|
| Profitable | Yes |
| Margin expanding | No |
| Buying back stock | No |
| Diluting (TTM) | No |
| Debt/Equity | — |
| Podcast bulls (TTM) | Sign up |
| Podcast bears (TTM) | Sign up |
| Podcast sentiment (TTM) | Sign up |
| Podcast sentiment % (TTM) | Sign up |
| News sentiment (TTM) | 4 |
| Quality score | -5.6% |
| Insiders | |
|---|---|
| Buys, 1w | Sign up |
| Buys, 1m | Sign up |
| Buys, 1y | Sign up |
| Sells, 1w | Sign up |
| Sells, 1m | Sign up |
| Sells, 1y | Sign up |
Sign up to see this company's insider trades
| Figure | FY 2026 | FY 2025 | FY 2024 | FY 2023 | FY 2022 | FY 2021 | FY 2020 | FY 2019 | FY 2018 | FY 2017 | FY 2016 | FY 2015 | FY 2014 | FY 2013 |
|---|---|---|---|---|---|---|---|---|---|---|---|---|---|---|
| Revenue | 334.612B | 302.681B | 261.604B | 272.167B | 253.575B | 249.197B | 262.519B | 256.151B | 254.783B | 236.561B | 226.626B | 218.35B | 202.387B | 178.046B |
| Net profit | 6.841B | 6.74B | 5.936B | 5.782B | 4.634B | 3.838B | 2.037B | 2.914B | 3.211B | 2.422B | 1.799B | 2.433B | 2.968B | 1.269B |
| Free cash flow | -3.979B | -315M | -7.057B | -8.542B | -5.987B | 3.602B | 6.462B | -6.182B | 1.829B | -2.131B | -2.461B | — | — | — |
| Figure | FY 2026 | FY 2025 | FY 2024 | FY 2023 | FY 2022 | FY 2021 | FY 2020 | FY 2019 | FY 2018 | FY 2017 | FY 2016 | FY 2015 | FY 2014 | FY 2013 |
|---|---|---|---|---|---|---|---|---|---|---|---|---|---|---|
| Share price | 4.968K | 4.141K | 3.736K | 3.439K | 3.328K | 3.063K | 2.546K | 2.836K | 3.804K | 2.938K | 2.582K | 2.841K | 2.621K | 2.114K |
| Price performance 12m | 0.2 | 0.11 | 0.09 | 0.03 | 0.09 | 0.2 | -0.1 | -0.25 | 0.29 | 0.14 | -0.09 | 0.08 | 0.24 | — |
Filed figures
Lines the statements and their notes report beside the headline figures, read from the filings' XBRL as filed (no restatement applied), with figures computed from one filing's own lines. Cash-flow lines carry their cash direction: an outflow is negative. Each period links to its filing; a figure's period, report date and tag are in its tooltip.
| Figure | Mar 2017 | Mar 2018 | Mar 2019 | Mar 2020 | Mar 2021 | Mar 2022 | Mar 2023 | Mar 2024 | Mar 2025 | Mar 2026 |
|---|---|---|---|---|---|---|---|---|---|---|
| Balance sheet detail | ||||||||||
| Trade receivables (JPY) | 29.1B | 32.9B | 35.5B | 33.4B | 32.9B | 28.7B | 33.1B | 34.7B | 36.9B | 39.2B |
| ↳ YoY growth | +17.6% | +12.9% | +8.1% | -5.9% | -1.7% | -12.7% | +15.3% | +4.8% | +6.5% | +6.2% |
| ↳ 5y CAGR | +5.8% | -0.3% | +0.1% | -0.5% | +2.0% | +3.6% | ||||
| Borrowings, current (JPY) | 29.4B | 29.4B | 34.5B | 35.6B | 18.1B | 30.7B | 38.8B | 45.3B | 43.8B | 61.2B |
| Borrowings, non-current (JPY) | 18.8B | 19.8B | 23.2B | 19.1B | 32.7B | 27B | 29.8B | 29B | 35.6B | 30.4B |
| Lease liabilities (JPY) | 521M | 439M | 360M | 454M | 396M | 385M | 371M | 308M | 542M | 489M |
| Cash and deposits (JPY) | 2.64B | 5.05B | 4.82B | 6.52B | 7.1B | 6.54B | 7.05B | 8.45B | 7.51B | 11B |
| Intangible assets (JPY) | 496M | 497M | 549M | 541M | 417M | 350M | 348M | 887M | 1.97B | 1.91B |
| Net debt (borrowings + leases - cash) (JPY) | 46B | 44.6B | 53.2B | 48.7B | 44.1B | 51.6B | 61.9B | 66.2B | 72.4B | 81.1B |
| Cash flow detail | ||||||||||
| Operating cash flow (JPY) | 601M | 3.2B | -4.12B | 9.41B | 6B | -1.13B | -6.24B | -1.72B | 5.84B | -745M |
| Purchases of property, plant and equipment (JPY) | -2.73B | -1.37B | -2.06B | -2.95B | -2.4B | -4.86B | -2.3B | -5.34B | -6.16B | -3.23B |
| Change in receivables (cash effect) (JPY) | -4.79B | -3.78B | -2.78B | 2.07B | 428M | 4.48B | -3.99B | -1.28B | -527M | -1.37B |
| Change in inventories (cash effect) (JPY) | 215M | -3.1B | -5.05B | 4.67B | -802M | -12.8B | -8.94B | -8.06B | -2.71B | -12.6B |
| Change in payables (cash effect) (JPY) | -1.24B | 4.72B | -1.42B | -1.4B | 975M | 952M | -1.67B | -498M | 101M | 3.15B |
| Dividends paid (cash effect) (JPY) | -525M | -630M | -649M | -760M | -754M | -864M | -972M | -1.08B | -1.19B | -1.55B |
| Interest paid (cash effect) (JPY) | -414M | -431M | -445M | -444M | -387M | -389M | -508M | -588M | -833M | -1.42B |
| Income taxes paid (cash effect) (JPY) | -1.09B | -1.75B | -1.27B | -929M | -1.56B | -2.69B | -1.95B | -3.49B | -1.43B | -3.86B |
| Operating cash flow before change in receivables (JPY) | 5.39B | 6.98B | -1.34B | 7.34B | 5.57B | -5.61B | -2.26B | -440M | 6.37B | 623M |
| Free cash flow (OCF - PPE - intangibles) (JPY) | -2.13B | 1.83B | -6.18B | 6.46B | 3.6B | -5.99B | -8.54B | -7.06B | -315M | -3.98B |
| Income detail | ||||||||||
| Research and development expense (JPY) | 280M | 290M | 304M | 343M | 336M | 317M | 338M | 365M | 332M | 354M |
| ↳ 5y CAGR | +4.6% | +2.5% | +3.1% | +3.7% | -0.6% | +1.0% | ||||
| Total comprehensive income (JPY) | 2.86B | 3.54B | 3.16B | 1.54B | 8.41B | 3.08B | 5.92B | 8.5B | 10.1B | 12B |
| Comprehensive income to owners (JPY) | 2.92B | 3.6B | 3.33B | 1.88B | 8.6B | 3.19B | 5.96B | 8.75B | 8.73B | 12.4B |
| Provision for credit losses (JPY) | 224M | -52M | -6M | 1M | -12M | -3M | 0.00 | 0.00 | 2M | 7M |
| Credit cost ratio (credit losses / average receivables) (%) | 0.8% | 0.2% | 0.0% | 0.0% | 0.0% | 0.0% | 0.0% | 0.0% | 0.0% | 0.0% |
| Segments | ||||||||||
| Food · Segment revenue (JPY) | — | — | — | — | 104B | 103B | 116B | — | — | — |
| ↳ YoY growth | -1.2% | +12.6% | ||||||||
| Food · Segment operating income (JPY) | — | — | — | — | 1.69B | 1.05B | 936M | — | — | — |
| Freshfoods Business · Segment revenue (JPY) | — | — | — | — | — | — | 77.5B | 71.2B | 74.4B | 79.1B |
| ↳ YoY growth | -8.2% | +4.5% | +6.4% | |||||||
| Freshfoods Business · Segment operating income (JPY) | — | — | — | — | — | — | 5.41B | 2.49B | 3.62B | 3.86B |
| Marine Products Business · Segment revenue (JPY) | — | — | — | — | — | — | 160B | 152B | 196B | 220B |
| ↳ YoY growth | -5.2% | +28.6% | +12.6% | |||||||
| Marine Products Business · Segment operating income (JPY) | — | — | — | — | — | — | 2.74B | 5B | 6.11B | 5.75B |
| Processed Food Business · Segment revenue (JPY) | — | — | — | — | — | — | 67.5B | 75.8B | 73.9B | 74.5B |
| ↳ YoY growth | +12.3% | -2.5% | +0.8% | |||||||
| Processed Food Business · Segment operating income (JPY) | — | — | — | — | — | — | 801M | 2.61B | 2.45B | 2.53B |
| Reported | Jun 27, 2017 | Jun 26, 2018 | Jun 25, 2019 | Jun 24, 2020 | Jun 24, 2022 | Jun 24, 2022 | Jun 25, 2024 | Jun 25, 2024 | Jun 25, 2025 | Jun 22, 2026 |
Sign up to see institutional holdings
Sign UpPodcast Mentions
Sign up to see podcast mentions and sentiment
Sign UpTimely disclosures published on TDnet, newest first, titles as filed in Japanese. The link opens the disclosure on TDnet. Filings with EDINET (periodic reports, extraordinary reports, offerings, holding and buy-back reports), newest first, titles as filed in Japanese. The link opens the filing on EDINET. Press releases from the company's own website, newest first.
「手軽に総菜 骨まで食べられるシリーズセット」が40名様に当たるキャンペーンを11月2日より実施~
2026年11月2日
株式会社 極洋(本社:東京都港区、代表取締役社長:井上誠)は、11月2日(月)より当社キャラクター「だんどり~にゃ」Xアカウントにて、「手軽に惣菜 骨まで食べられるシリーズセット」が40名様に当たるキャンペーンを実施します。
だんどり~にゃ【㈱極洋/キョクヨー 公式】(@dandori_nya)をフォローし、対象の投稿をリポストするとその場で当選が分かるキャンペーンで、期間中は毎日ご応募いただけます。
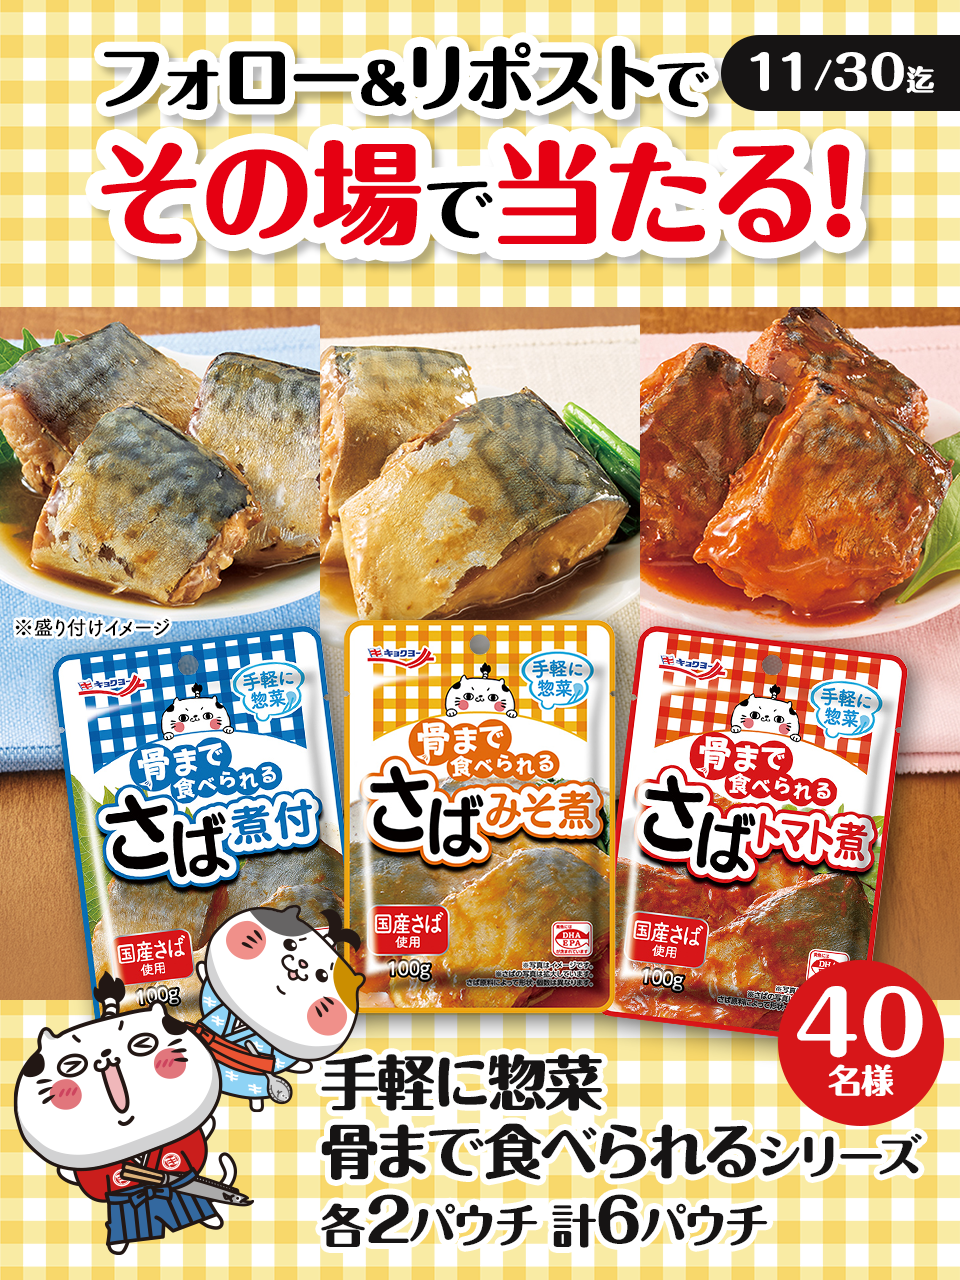
<キャンペーン概要>
-
実施期間 2026年11月2日(月)10:00~ 11月30日(月)9:59
期間中は毎日ご応募いただけます。 -
応募方法 ①だんどり~にゃ【㈱極洋/キョクヨー 公式】アカウント(https://x.com/dandori_nya )をフォロー
②本キャンペーン対象の投稿をリポスト -
賞 品 手軽に惣菜 骨まで食べられるさばみそ煮
手軽に惣菜 骨まで食べられるさば煮付
手軽に惣菜 骨まで食べられるさばトマト煮
各2パウチ 計6パウチ -
当選人数 40名様
-
結果確認 当選者には、その場でだんどり~にゃ【㈱極洋/キョクヨー 公式】よりDMが届きます。


 うなぎの蒲焼き弁当(一例)
 7月22日に配布され、喫食する様子
 新デザインの魚食啓発ポスター(一例)


Prompts
Click prompts to add them under the company line, click again to take one out, then copy the result into your AI chat. Shared by Asian Century Stocks and Uncovered Thai Stocks. Thank you.
ETFs Holding Kyokuyo Co., Ltd.
Exchange-traded funds whose newest published daily portfolio holds one of the company's listings, largest weight first.
| ETF | Weight in ETF | Shares | Market value | As of |
|---|---|---|---|---|
| DISV | 0.03% | 52,147 | $ 1.503M | Nov 12, 2026 |
| DFIS | 0.01% | 20,900 | $ 602.558K | Nov 12, 2026 |
| AVDS | 0.01% | 1,500 | $ 44.147K | Nov 16, 2026 |
| DXIV | 0.01% | 700 | $ 20.181K | Nov 12, 2026 |
| DFSI | 0.00% | 1,900 | $ 54.778K | Nov 12, 2026 |
| DFIC | 0.00% | 13,900 | $ 400.744K | Nov 12, 2026 |
| DFAX | 0.00% | 7,100 | $ 204.697K | Nov 12, 2026 |
| DFAI | 0.00% | 8,000 | $ 230.644K | Nov 12, 2026 |
| AVDE | 0.00% | 12,700 | $ 373.779K | Nov 16, 2026 |