The Webuild Group's digital channels Discover all our digital channels: an ecosystem that tells the story of the world we have built in 120 years of history Country Websites Webuild Australia Webuild Romania Stakeholders Supplier Development Hub Jobs…
The Webuild Group's digital channels
Discover all our digital channels: an ecosystem that tells the story of the world we have built in 120 years of history
Country Websites
Webuild Australia
Webuild Romania
Stakeholders
Supplier Development Hub
Jobs
Subsidiaries websites
Clough
Lane Construction
Fisia Italimpianti
CSC
Cossi Costruzioni
Seli Overseas
NBI
Multimedia
EVOLUTIO
We Build Value
Follow us on social channels
Webuild Worldwide
Search
EN
west
Go back
This document must not be disclosed, published, or distributed, in whole or in part, directly or indirectly, in any country where such disclosure, publication, or distribution would constitute a violation of applicable laws or regulations in that jurisdiction.
Public tender offer for the ordinary shares of Trevi-Finanziaria Industriale launched by Webuild
Webuild acquires an additional 4.68% of Trevi and reaches 34.58%
Webuild group owns more than one-third of Trevi capital and reinforces its position as main shareholder
The offer becomes mandatory and no longer subject to conditions
For Trevi shareholders, certainty of price, payment and timing
€5.165 all cash, a price within the ranges indicated by Trevi board
Notice pursuant to Articles 36, 41, paragraph 2, letter c), and 44, paragraph 2 of the regulation adopted by CONSOB Resolution No. 11971 of May 14, 1999, as subsequently amended and supplemented
Milan, October 30, 2026—In connection with the voluntary tender offer (the “Offer”) on all the ordinary shares of Trevi-Finanziaria Industriale S.p.A. (“Trevi”) launched by Webuild S.p.A. (“Webuild”), Webuild announces that as of today:
- It executed, through its financial advisor Intermonte SIM S.p.A., the purchases of Trevi shares indicated in Section I below of this press release, which are subject to the notification requirement pursuant to Article 41, paragraph 2, letter c), of the Issuers’ Regulation;
- As a result of these purchases, Webuild now holds a total stake in Trevi equal to 34.58% of the share capital, a circumstance that triggers Webuild’s obligation to launch a tender offer on all Trevi shares not already held, pursuant to Article 106, paragraph 1, of Legislative Decree No. 58 of February 24, 1998 (the “TUF”), resulting in the conversion of the Offer from a voluntary to a mandatory one, as further detailed in Section II below of this press release.
For the purposes of this press release, capitalized terms not otherwise defined shall have the meanings assigned to them in the document relating to the Offer made public on September 18, 2026.
I - Purchases of Trevi Shares
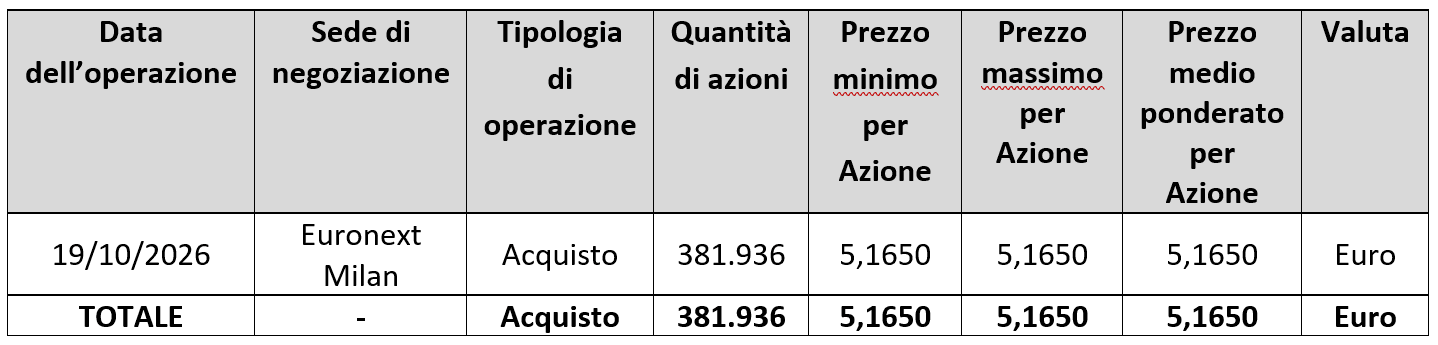
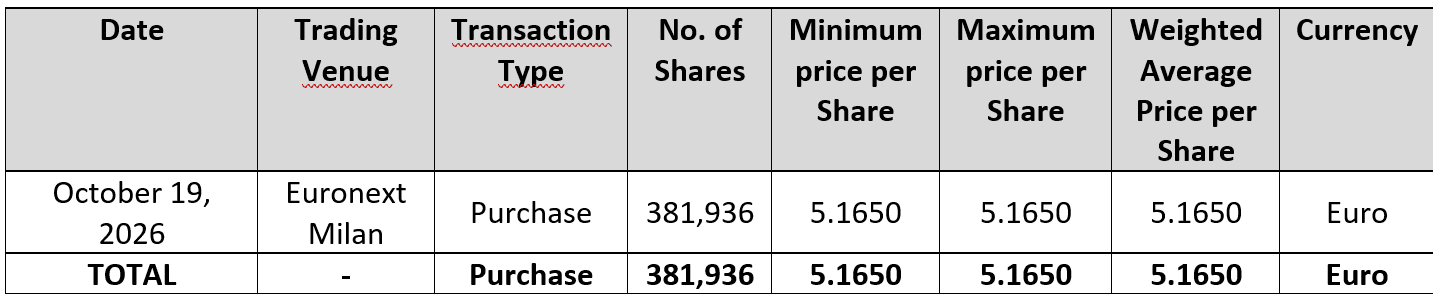
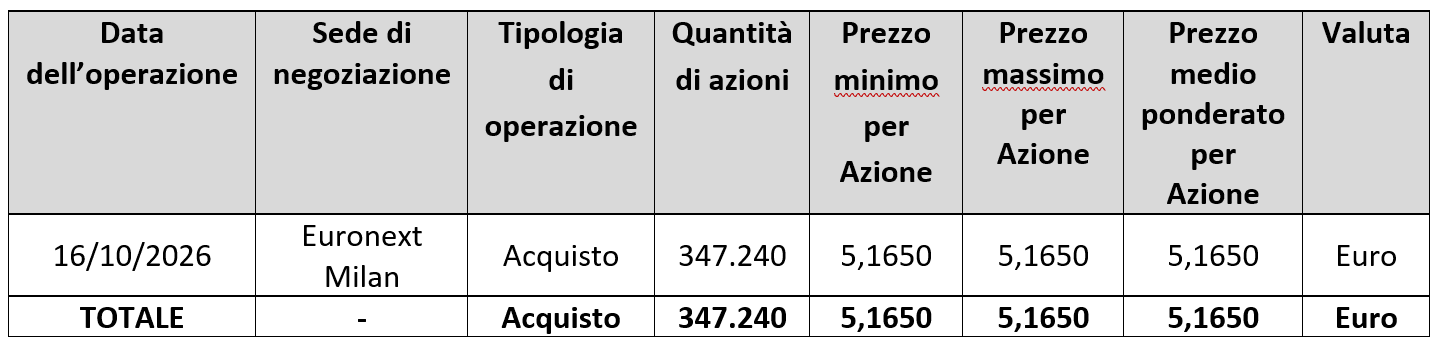
Today, Webuild executed the following purchases of Trevi shares on the market.

The purchases set forth in the table above were made at a unit price not exceeding Euro 5.165 (i.e., the price offered for each Trevi share in connection with the Offer and which falls within the price ranges indicated by the Trevi board).
Following the aforementioned purchases, Webuild holds a total of 22,675,764 Trevi ordinary shares, representing approximately 34.58% of the share capital and voting rights, with the consequences described in Section II below. Webuild Group owns more than one-third of the Trevi share capital.
II - Conversion of the Offer into a mandatory tender offer
A) Introduction
As a result of the purchases described in Section I above, Webuild has acquired a total stake in Trevi exceeding the 30% threshold pursuant to Article 106, paragraph 1, of the TUF, thereby triggering the obligation to launch a tender offer:
- covering all Trevi shares not already owned by Webuild (i.e., 42,902,452 ordinary shares);
- not subject to any conditions precedent; and
- at a price per share not lower than the highest price paid by Webuild in the six months prior to today’s date for purchases of Trevi ordinary shares, namely Euro 5.165.
However, in light of the fact that the Offer, launched by Webuild, is currently underway: (i) for all Trevi ordinary shares not already owned by Webuild; and (ii) at a price of Euro 5.165 per share, which is not lower than the highest price paid by Webuild in the six months prior to today’s date for purchases of Trevi ordinary shares, the Offer is hereby reclassified as a mandatory tender offer pursuant to Article 106 of the TUF.
B) Characteristics of the Offer following its reclassification
This Section sets forth the characteristics of the Offer following its reclassification as a mandatory tender offer.
For matters not described below, Trevi shareholders are invited to refer to the Offer Document and other information disclosed to the market by Webuild.
B.1) Shares Subject to the Offer
The Offer covers a maximum of 42,902,452 ordinary shares of Trevi, equal to 65.42% of the share capital and corresponding to all of the Issuer’s shares, excluding the 22,675,764 shares of the Issuer (equal to 34.58% of the share capital) already held by the Offeror, listed on Euronext Milan under ISIN code IT0005709909. The definition of “Shares Subject to the Offer” contained in the Offer Document shall therefore be deemed amended as a result of the foregoing.
Neither the Offeror nor the Persons Acting in Concert hold, directly or through subsidiaries, trust companies, or through intermediaries, any other financial instruments issued by the Issuer or having such instruments as their underlying asset.
B.2) Removal of Conditions Precedent
All Conditions Precedent are hereby removed; therefore, the completion of the Offer is no longer subject to any conditions.
B.3) Consideration, Maximum Outlay, Financing, and Cash Confirmation
The Consideration amounts to Euro 5.165 for each Share Subject to the Offer tendered and will be paid in full in cash on the Settlement Date, scheduled for November 27, 2026. The definition of “Consideration” contained in the Offer Document shall therefore be deemed amended as a result of the foregoing.
The Maximum Outlay to be borne by the Offeror in the event of full acceptance of the Offer will be equal to Euro 221,591,164.58. The definition of “Maximum Outlay” contained in the Offer Document shall therefore be deemed amended as a result of the foregoing.
The Offeror will meet the financial obligations necessary for the payment of the Consideration through the Financing, without prejudice to the Cash Confirmation issued by Intesa Sanpaolo S.p.A., Goldman Sachs Bank Europe SE, and Natixis S.A. Milan Branch, which remains in full force and effect.
B.4) Comparison of the Consideration with the historical prices of Trevi shares and certain indicators relating to the Issuer
Webuild provides below a comparison between the Consideration and the historical share prices of Trevi shares and certain indicators relating to the Issuer.
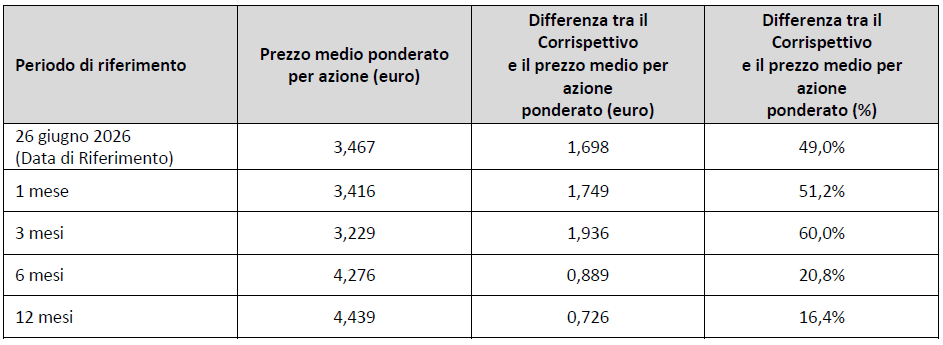
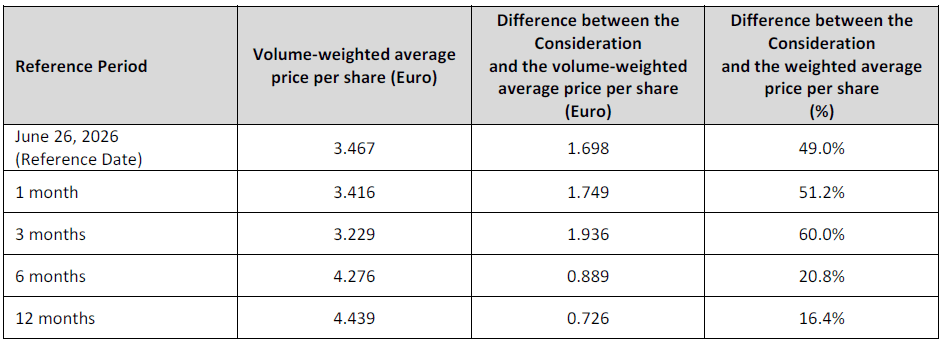
1) Volume-weighted averages over various time periods prior to the Reference Date
The following table shows a comparison between the Consideration and the volume-weighted arithmetic average of the official prices of the Issuer’s shares over the 1, 3, 6, and 12-month periods preceding the Reference Date (inclusive).
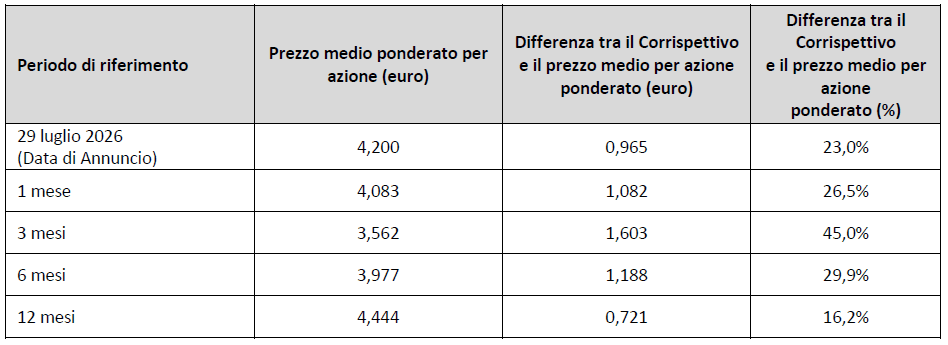
2) Weighted averages over various time periods prior to the Announcement Date
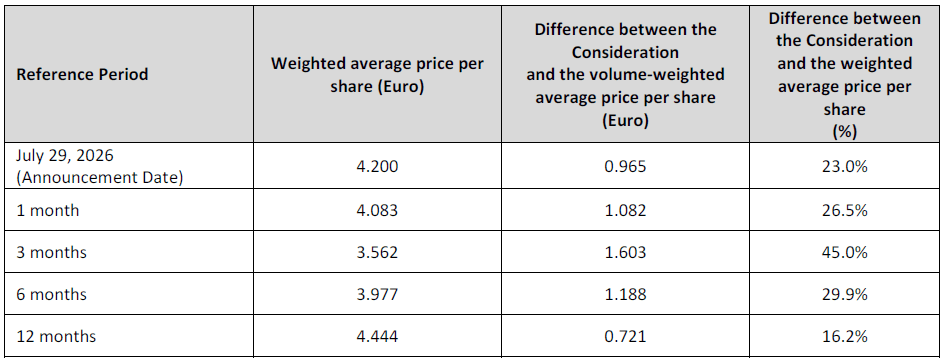
Furthermore, with reference to the Announcement Date, the table below compares the Consideration with the volume-weighted arithmetic average of the Issuer’s official share prices for the 1, 3, 6, and 12-month periods prior to the Announcement Date (inclusive).
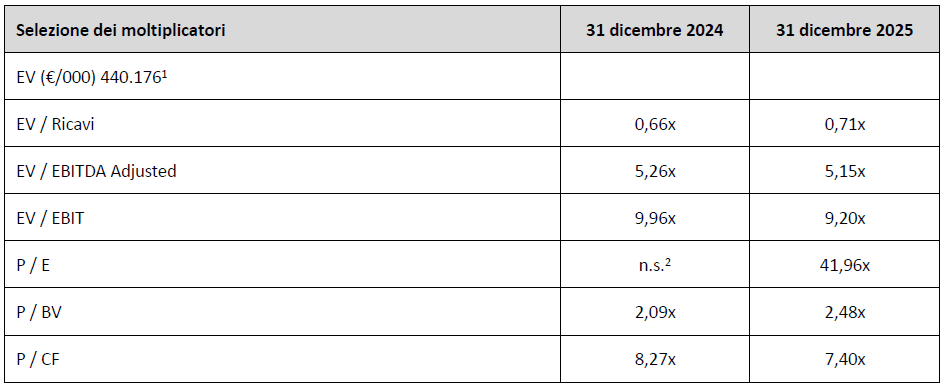
3) Comparison of the Consideration with certain indicators relating to the Issuer
The following table shows the EV/Revenue, EV/Adjusted EBITDA, EV/EBIT, P/E, P/BV, and P/CF multiples (for a description of which, see Section E.3 of the Offer Document) relating to the Issuer for the fiscal years ended December 31, 2024, and December 31, 2025, based on the value of the Issuer’s economic value (Consideration multiplied by the number of shares, net of treasury shares, as of the Offer Document Date) and the most recent financial data publicly available as of the Offer Document Date regarding: (i) net financial debt (amounting to 92.1 million euros as of June 30, 2026); (ii) non-controlling interests; (iii) liabilities related to employee severance indemnities; (iv) investments in affiliated companies and non-recurring financial assets.
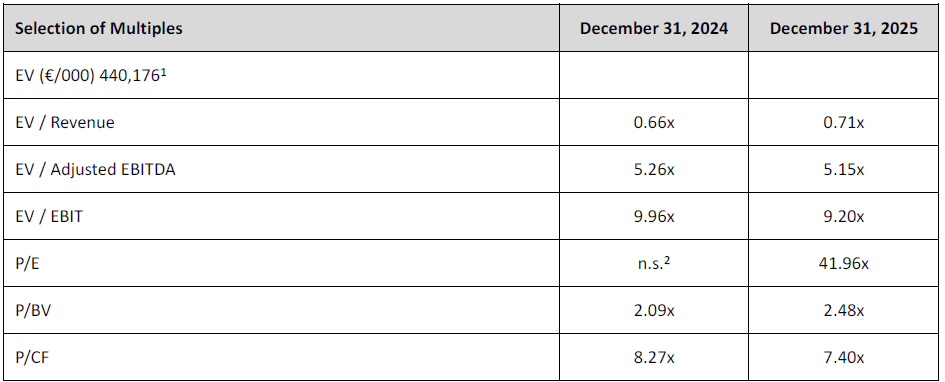
1 In its interim management report as of June 30, 2026, Trevi also reports a pro forma net financial debt of 95.0 million euros, reflecting refinancing transactions completed in early July 2026. Specifically: (i) payment of incidental expenses related to the capital increase; (ii) debt write-off as provided for in signed agreements; and (iii) repayment of existing financial debt with the simultaneous establishment of new credit lines. The inclusion of this figure in the calculations would not result in a materially significant change in the reported results.
2 The multiple was considered not significant (“n.s.”) because it was influenced by a particularly low net income in the reference fiscal year, which resulted in a multiple exceeding 100x.
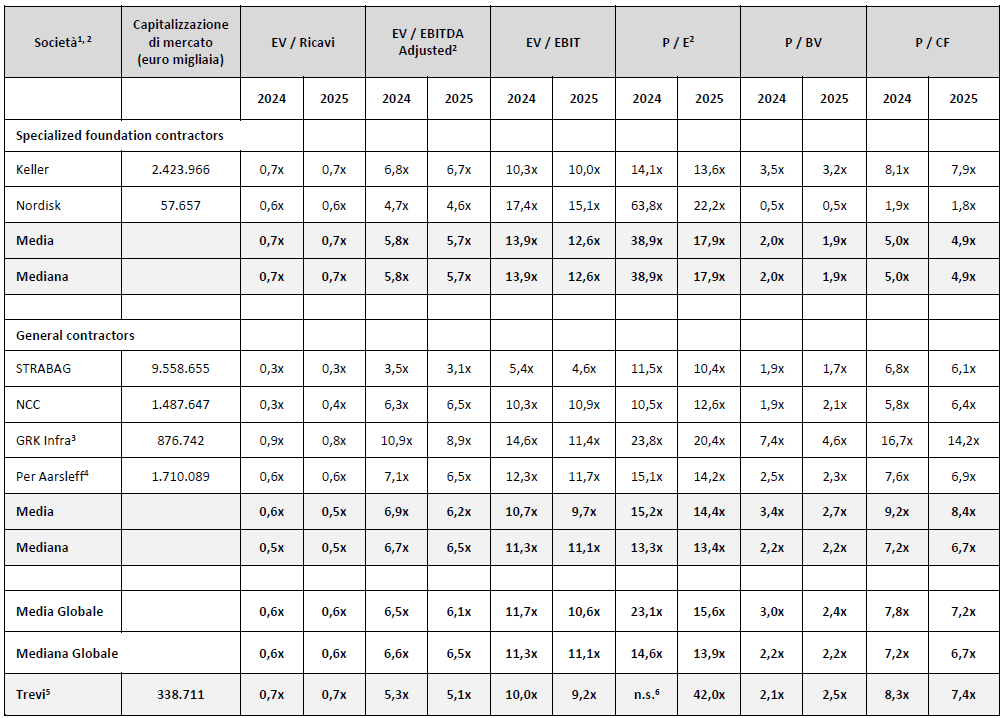
For illustrative purposes, the Issuer’s multiples indicated above were compared with similar multiples calculated for the fiscal years 2024 and 2025, based on a sample of companies listed on a stock exchange or with shares traded on a multilateral trading facility operating in the Issuer’s main business sectors, as further described in Section E.3 of the Offer Document.
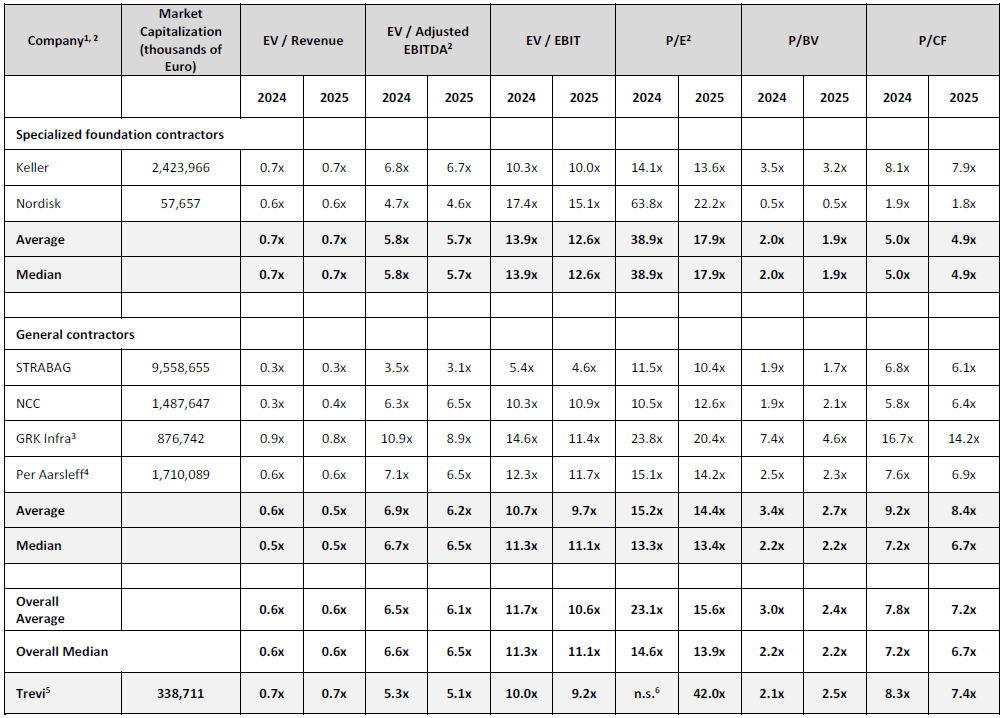
Source: Public filings and information from the Issuer and other companies, FactSet
- The companies’ EV was calculated based on their market capitalization as of the Announcement Date (taking into account the number of outstanding shares net of treasury shares). The financial metrics refer to the most recent figures available prior to the date of the Offer Document and are as of December 31;
- EBITDA and net income have been adjusted for items deemed non-recurring;
- The financial metrics reported relate to the year-end as of December 31, 2025. The figures for June 2026 were not considered, as they would have been distorted by acquisitions that took place in the first half of 2026 and are not yet fully reflected in the available financial data;
- The key metrics reported relate to the financial statements as of December 31, calculated using the “last twelve months” method;
- Calculated based on the Consideration.
- The multiple was considered not significant (“n.s.”) because it was influenced by a particularly low net income in the reference fiscal year, which resulted in a multiple exceeding 100x.
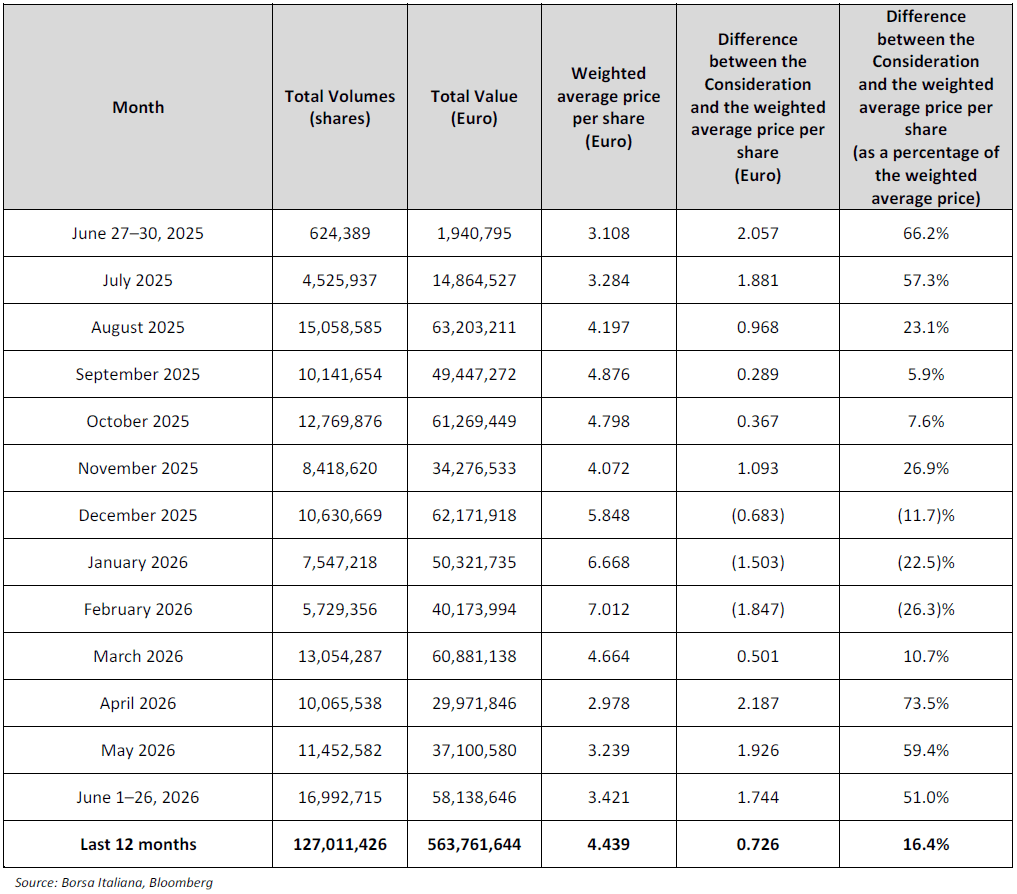
4) Weighted monthly average of the Issuer’s share prices recorded in the twelve months preceding the Reference Date
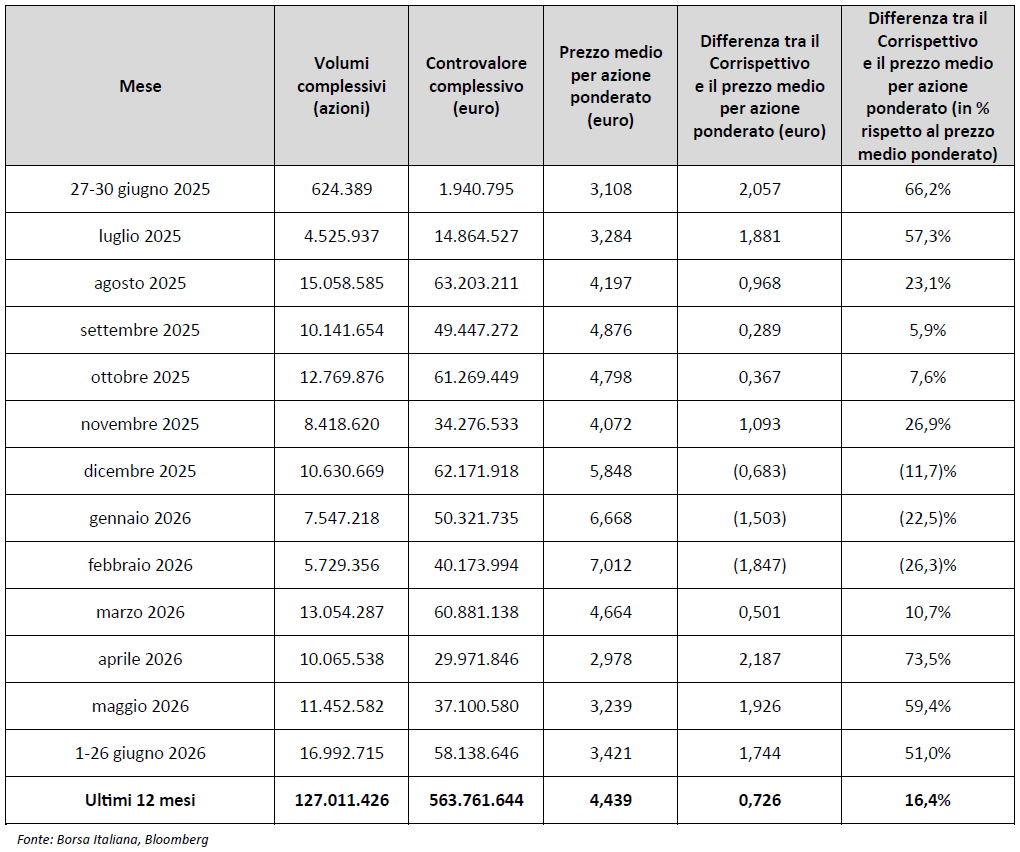
The following table shows the arithmetic averages, weighted by daily trading volume, of the official prices of the Issuer’s shares recorded in each of the twelve months preceding the Reference Date, as further described in Section E.4 of the Offer Document.
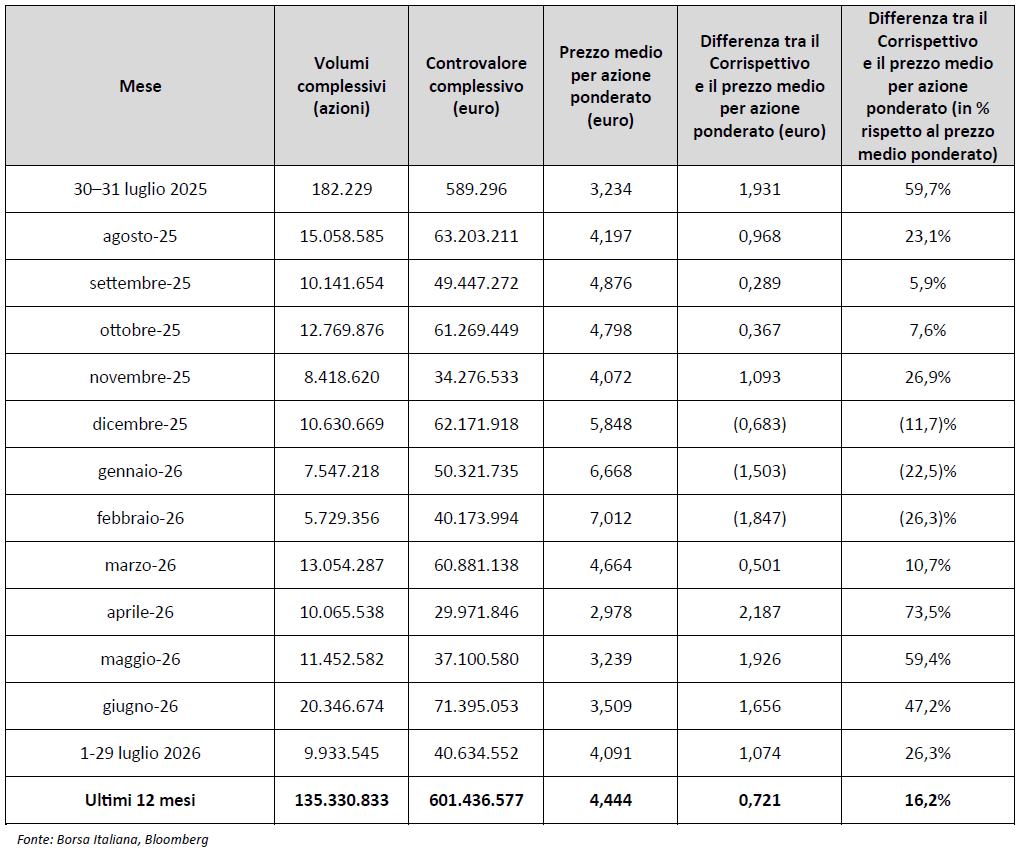
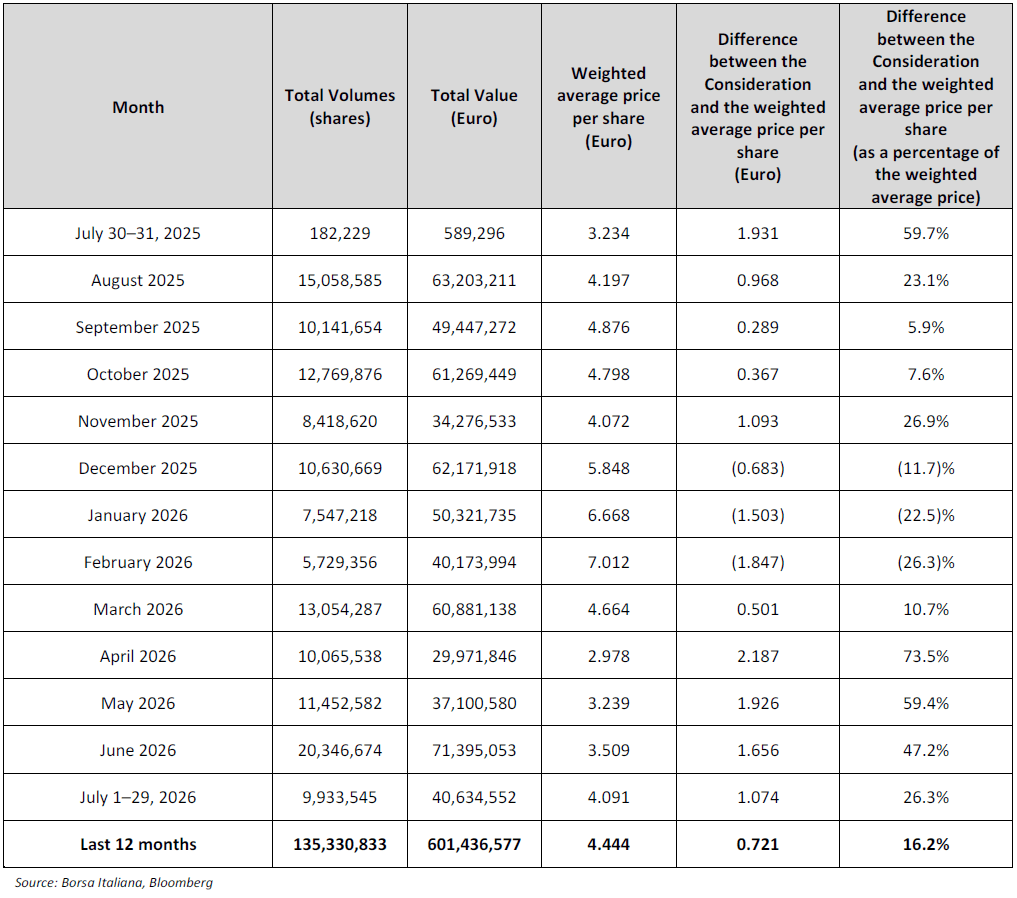
With reference to the Announcement Date, the table below shows the arithmetic means, weighted by daily trading volume, of the official prices of the Issuer’s shares recorded in each of the twelve months preceding the Announcement Date, as further described in Section E.4 of the Offer Document.
B.5) Acceptance Period and Settlement Date
The Acceptance Period will end at 5:30 p.m. Italian time on November 20, 2026, and the Settlement Date is confirmed for November 27, 2026.
B.6) Purpose of the Offer and Future Plans
Webuild reaffirms its intention to acquire the entire share capital of Trevi and to implement the industrial and strategic plans outlined in the Offer Document for the growth of the Trevi Group and the Webuild Group.
B.7) Additional Information
Along with this press release, Webuild is making a new Acceptance Form available to the public; provided, however, that any signing of a previous version of the Acceptance Form will be considered a valid acceptance of the Offer under the terms set forth in this press release.
* * * * * * *
This press release, the new Acceptance Form, and all documents relating to the Offer will be made available, among other places, on the websites
https://www.webuildgroup.com/it/investitori/opa-trevi
and
https://www.webuildgroup.com/en/investor-relations/opa-trevi
* * * * * * *
This communication does not constitute, and is not intended to constitute, an offer, invitation or solicitation to buy or otherwise acquire, subscribe for, sell or otherwise dispose of any financial instruments, and no sale, issuance or transfer of financial instruments of Trevi Finanziaria Industriale S.p.A. will be made in any country in violation of the applicable laws. The Offer takes place pursuant to the Offer document, approved by CONSOB. The Offer document contains the full description of the terms and conditions of the Offer, including acceptance procedures. The publication or dissemination of this communication in countries other than Italy may be subject to restrictions under applicable law, and accordingly any person subject to the laws of any country other than Italy is required to independently inform itself of any restrictions under applicable laws and to ensure compliance therewith. Any failure to comply with such restrictions may constitute a violation of the applicable laws of the relevant country. To the fullest extent permitted by applicable law, the parties involved in the Offer shall be deemed exempt from any liability or adverse consequence arising from the violation of such restrictions by such persons. This communication has been prepared in accordance with Italian law and the information disclosed herein may differ from that which would have been disclosed had the communication been prepared in accordance with the laws of countries other than Italy. No copy of this communication or any other documents relating to the Offer will be, or may be, mailed or otherwise transmitted or distributed in or from any country where the provisions of local law may give rise to civil, criminal or regulatory risks if information concerning the Offer is transmitted or made available to shareholders of Trevi Finanziaria Industriale S.p.A. in such country or other countries where such actions would constitute a violation of the relevant laws, and any person receiving such documents (including custodians, nominees or trustees) must not mail or otherwise transmit or distribute them to or from any such country. The contents of this communication are of an informational and preliminary nature and should not be construed as investment advice. The statements contained herein have not been independently verified. No representation or warranty, express or implied, is made as to, and no reliance should be placed on, the fairness, accuracy, completeness, correctness or reliability of the information contained herein. Neither Webuild S.p.A. nor any of its representatives nor its direct or indirect controlling shareholders shall accept any liability (whether in negligence or otherwise) arising in any way in connection with such information or in connection with any loss arising from its use or otherwise arising in connection with this communication. By accessing this communication, you agree to be bound by the foregoing limitations.
Download
30/10/2026 - Press release
picture_as_pdf
Webuild acquires an additional 4.68% of Trevi and reaches 34.58%
Information material - Bridge project over the Strait of Messina
Name *
Lastname *
Email *
Company/Media *
Phone number *
Country *
Informative Materials *
I, the undersigned, state that I have viewed the webuildgroup.com Privacy Policy
*
(*) Required information
Accept & RegisterThis site is protected by reCAPTCHA and the Google Privacy Policy
and Terms of Service
apply.
Webuild S.p.A.
a Company subject to direction and coordination of Salini Costruttori S.p.A.
Share Capital € 600,000,000.00
Milan Monza Brianza Lodi Business Registry and tax identification number 00830660155
VAT 02895590962
Group
Business Areas
Projects
Sustainability
Investor relations
Governance
Careers
Group
Business Areas
Projects
Sustainability
Investor relations
Governance
Careers
USEFUL LINKS
Webuild Australia
Webuild Romania
Cantieri trasparenti
Progetto Ponte sullo Stretto di Messina
EVOLUTIO Museum
We Build Value Magazine
ROMA
Via della Dataria, 22 - 00187
Tel: +39 06 67761
Fax: +39 06 677626288
Via Giulio Vincenzo Bona 65 - 00156
Tel: +39 06 417661
Fax: +39 06 6776 26720
ROZZANO
Centro Direzionale Milanofiori
Strada 6 - Palazzo L - 20089
Tel: +39.02.444 22111
Fax: +39.02.444 22293
contact us
[email protected]
FOLLOW US ON
subscribe to the newsletter
Stay up to date on Webuild Group news, initiatives and projects to find out how we operate in the world.
Subscribe
Cookie Preference
Whistleblowing
Disclaimer
Privacy Policy
Copyright © 2026 Webuild. All Rights Reserved.
Brief information on how we use cookies
The site uses technologies such as cookies, including ones from third parties, to personalize content and to analyze website traffic. We also share information on how you use the site, with our trusted partners, operating in the social media, advertising and statistical data sectors. By closing this banner, continuing to browse this page or clicking any of its elements, such as a link or button, you accept the use of technical cookies. To know more or to customize your choices, click on settings.