1/ Saipem at a glance / II Interim Directors' Report Condensed interim consolidated financial statements ANNEXES Saipem at a glance Interim Directors' Report Condensed interim consolidated financial statements ANNEXES We are a global leader in…
1/
Saipem
at a glance
/ II
Interim Directors'
Report
Condensed interim consolidated
financial statements
ANNEXES
Saipem
at a glance
Interim Directors'
Report
Condensed interim consolidated
financial statements
ANNEXES
We are a global leader in engineering services for the design, construction and operation of complex
infrastructures and plants in the energy sector, both offshore and onshore.
The vision that inspires us is “Engineering for a sustainable future”.
This is why we are engaged in the new low-carbon energy and industrial ecosystem. We are at the
forefront of the transition to Net Zero alongside our clients, with increasingly digitalised tools,
technologies, and processes, designed from the outset with environmental sustainability and safety in
mind.
1/
Saipem
at a glance
Interim Directors'
Report
Condensed interim consolidated
financial statements
ANNEXES
interim consolidated
financial REPORT
as of june 30, 2026
Disclaimer
By their nature, forward-looking statements are subject to risk and uncertainty since they
are dependent upon circumstances which should or are considered likely to occur in the
future and are outside of the Group’s control. These include, but are not limited to:
exchange and interest rate fluctuations, commodity price volatility, credit and liquidity
risks, HSE risks, the levels of capital expenditure in the oil industry and other sectors,
political instability in areas where the Group operates, actions by competitors, success of
commercial transactions, risks associated with the execution of projects (including
pandemic risks, geopolitical risks, supply chain risks and those risks related to ongoing
investment projects), in addition to changes in stakeholders’ expectations and other
changes affecting business conditions. Actual results could therefore differ materially from
the forward-looking statements. The financial reports contain in-depth analyses of some of
the aforementioned risks. Forward-looking statements and data are to be considered in
the context of the date of their release.
/2
Saipem
at a glance
Interim Directors'
Report
Condensed interim consolidated
financial statements
ANNEXES
General CONTENT
Interim results
................................................................................................................................................................................................................................................................
01
SAIPEM AT A GLANCE
02
INTERIM DIRECTORS' REPORT
03
CONDENSED INTERIM CONSOLIDATED FINANCIAL STATEMENTS
04
ANNEXES
..................................................................................................................................................................................................................................
.....................................................................................................................................................................................
4
6
24
.............
134
................................................................................................................................................................................................................................................................................................
220
3/
Saipem
at a glance
Interim Directors'
report
Condensed interim consolidated
financial statements
ANNEXES
INTERIM RESULTS
First half results show revenue and margins ahead of those recorded in the same period of 2025, underscoring
the strength and resilience of Saipem’s execution capabilities.
Against the backdrop of continuing logistical and operational challenges stemming from the conflict in the
Middle East, Saipem has been able to ensure the operational continuity of all projects currently in execution and
the safety of its personnel.
In the first six months of 2026, Saipem recorded revenue of more than €7.3 billion, up by 2% compared with the
same period last year, as evidence of operational continuity also in areas affected by the conflict. Adjusted
EBITDA of €836 million, up by 9% compared to last year, despite absorbing extra costs of approx. €70 million
arising from logistical and operational difficulties and from enhanced safety measures for personnel in the
Middle East. Adjusted net result of €131 million. Cash generation (free cash flow after the repayment of lease
liabilities) of €388 million. The net financial position, which reflects the €330 million in dividends paid in May,
improved both before and after lease liabilities.
From a commercial standpoint, the volume of orders booked in the first half of the year amounted to €5.7 billion,
up 33% compared with the same period last year, and a further €2.3 billion of orders have already been acquired
in July. These results, together with several additional opportunities currently under discussion, reinforce our
confidence that the 2026 order intake will exceed that of 2025.
Guidance for 2026 is updated to reflect the impact of extra costs in connection with the ongoing conflict, which
affect adjusted EBITDA with no impact on cash flow generation due to improved cash conversion dynamics.
Revenue in the first half of 2026 amounted to €7,345 million (€7,211 million in the first half of 2025) and adjusted
EBITDA amounted to €836 million (€764 million in the first half of 2025); both metrics increased compared with
the first half of 2025, by 1.9% and 9.4% respectively. The operating results reflect the improvement in operating
performance compared to the first half of 2025, in particular for the Engineering & Construction activities, both
Offshore and Onshore.
Asset Based Services accounted for 58.5% of revenue; Energy Carriers for 36.4% of revenue; Offshore Drilling
contributed 5.1% of revenue.
The adjusted net result amounted to a profit of €131 million in the first half of 2026 (€140 million in the first half
of 2025).
The net result amounted to a profit of €96 million net of charges related to redundancy programmes agreed with
Trade Union organisations, of €35 million.
Capital expenditure during the first half of 2026, mainly relates to maintenance and upgrades, amounted to
€133 million (€187 million in the first half of 2025).
Pre-IFRS 16 Net Financial Position as of June 30, 2026 amounted to a net cash of €1,078 million improved by
€79 million compared to December 31, 2025 (net cash of €999 million). Net debt, including IFRS 16 lease liability
of €1,187 million, amounted to €109 million, net of dividend payments of €330 million, improved by €163 million
compared to December 31, 2025.
In the first half of 2026, Saipem was awarded new contracts amounting to a total of €5,737 million (€4,301 million
in the first half of 2025). The backlog as of June 30, 2026 amounted to €29,861 million (€18,663 million in Asset
Based Services, €10,112 million in Energy Carriers and €1,086 million in Offshore Drilling), of which €7,321 million
to be executed in the second half of 2026.
The backlog including non-consolidated companies as of June 30, 2026 amounted to €29,960 million (€31,578
million as of December 31, 2025).
/4
SAIPEM INTERIM CONSOLIDATED FINANCIAL REPORT AS OF JUNE 30, 2026
Saipem
at a glance
INTERIM RESUTS
Interim Directors'
report
Condensed interim consolidated
financial statements
ANNEXES
5/
SAIPEM
AT A GLANCE
Interim Directors'
Report
Condensed interim consolidated
financial statements
ANNEXES
/6
SAIPEM INTERIM CONSOLIDATED FINANCIAL REPORT AS OF JUNE 30, 2026
SAIPEM
AT A GLANCE
Interim Directors'
Report
Condensed interim consolidated
financial statements
ANNEXES
Saipem at a glance
Saipem Industrial’s proposal ___________________________________________________________________________________________________________________
Company profile _________________________________________________________________________________________________________________________________________
Mission and values _____________________________________________________________________________________________________________________________________
Our approach to sustainability ________________________________________________________________________________________________________________
Saipem in the world ___________________________________________________________________________________________________________________________________
Where we operate ________________________________________________________________________________________________________________________________________________
Our people _______________________________________________________________________________________________________________________________________________________________
Our clients ___________________________________________________________________________________________________________________________________________________
Backlog ________________________________________________________________________________________________________________________________________________________
Financial performance ______________________________________________________________________________________________________________________________
Saipem SpA share performance _____________________________________________________________________________________________________________
Credit rating _______________________________________________________________________________________________________________________________________________
ESG indices and ratings ____________________________________________________________________________________________________________________________
8
9
11
12
14
14
16
17
18
19
20
22
23
SAIPEM AT A GLANCE
7/
SAIPEM
AT A GLANCE
Interim Directors'
Report
Condensed interim consolidated
financial statements
ANNEXES
Saipem Industrial’s proposal
Saipem plays a key role in the energy sector, contributing to the construction of energy plants and
infrastructures, both onshore and offshore, with a wide range of services. To achieve this, Saipem partners with
a large and diversified ecosystem of suppliers and subcontractors and safely manages multiple shipyards and
vessels.
In addition to its commitment to the energy industry, Saipem also operates in the infrastructure sector with
services in the civil construction and sustainable transport sectors, in particular railways.
Thanks to its engineering and project management capabilities, its vessels and construction sites and its
technological expertise, Saipem generates value for its clients in both traditional and renewable energy
segments. In particular, with reference to traditional energy segment, Saipem assists its clients throughout the
raw material production and processing value chain, offering services in offshore drilling, upstream, midstream,
downstream and also providing solutions for the production of fertilizers. In the field of renewable sources and
clean tech, it is involved in the construction of offshore wind infrastructures and biorefineries, as well as
proposing various industrial solutions in the decarbonisation field, such as CO2 management and hydrogen
treatment.
/8
SAIPEM INTERIM CONSOLIDATED FINANCIAL REPORT AS OF JUNE 30, 2026
SAIPEM
AT A GLANCE
Interim Directors'
Report
Condensed interim consolidated
financial statements
ANNEXES
company profile
We are a global leader in the engineering and construction of major projects for the energy and infrastructure
sectors, offshore and onshore.
We are a “one company” with distinctive competences, technological innovation capabilities and high-tech
assets, able of identifying and developing multiple solutions to meet our clients’ needs for a sustainable business.
�
�
SAIPEM AT A GLANCE
9/
SAIPEM
AT A GLANCE
Interim Directors'
Report
Condensed interim consolidated
financial statements
ANNEXES
We are a "One Company" active in five operative areas: Offshore E&C, Offshore Drilling, Onshore E&C,
Offshore Wind and Sustainable Infrastructures with distinctive capabilities, skills and high-tech assets, able to
identify and develop multiple solutions to meet our clients’ needs for a sustainable business. Our business model
is designed to foster synergies between our operating sectors and the market in which we operate. We aim to
develop solutions that enhance efficiency, minimise the environmental impact of our products and services, and
improve the safety of both employees and clients. The five operative areas are further defined and grouped
into three reporting segments: Asset Based Services, Offshore Drilling and Energy Carriers.
/ 10
SAIPEM INTERIM CONSOLIDATED FINANCIAL REPORT AS OF JUNE 30, 2026
SAIPEM
AT A GLANCE
Interim Directors'
Report
Condensed interim consolidated
financial statements
ANNEXES
mission AND valUES
01 / Mission
We work alongside our clients to transform their strategies and projects into
competitive, safe, and sustainable infrastructures, plants, and processes, supporting
them on their energy transition pathway towards Net Zero.
02 / Values
•�
•�
•�
•�
03 / Purpose
We value human ingenuity, fostering a culture of creativity and problemsolving.
We prioritise the health and safety of our people, communities, and the
environment.
We build relationships based on trust, rooted in responsibility and
transparency.
We embrace diversity and inclusivity, shaping a workplace where everyone
can thrive.
Always oriented towards technological innovation, the purpose that inspires us is
“Engineering for a sustainable future”.
For over 60 years, engineering has been in Saipem’s DNA, shaping its business,
activities, and industrial applications.
We design and develop new approaches to guarantee sustainable and safe access
to energy and mobility, thus contributing to the development of a more efficient and
responsible energy ecosystem.
Everything we do is based on a clear vision of tomorrow.
SAIPEM AT A GLANCE
11 /
SAIPEM
AT A GLANCE
Interim Directors'
Report
Condensed interim consolidated
financial statements
ANNEXES
OUR APPROACH TO SUSTAINABILITY
Guided by the vision “Engineering for a sustainable future”, our commitment is to generate sustainable value for
all our stakeholders by integrating environmental, social and governance (ESG) aspects into our business
strategies, processes and operational risk management.
The Policy “Our sustainable business” sets out the commitments that guide us in achieving the Sustainable
Development Goals (SDGs), defining the principles and pillars that support the sustainable growth of our
business.
It reinforces our commitment to operate responsibly in all the countries where we are present, guided by our
principles of ethics, respect, inclusion, transparency and fairness.
It also highlights the importance of sustainability as a fundamental lever for long-term value creation and
collective well-being, outlining five key dimensions underpinning our operational approach.
/ 12
SAIPEM INTERIM CONSOLIDATED FINANCIAL REPORT AS OF JUNE 30, 2026
SAIPEM
AT A GLANCE
Interim Directors'
Report
Condensed interim consolidated
financial statements
ANNEXES
To make this a tangible commitment, Saipem annually updates its Sustainability Plan, “Our journey to a
sustainable business”, which, combining business and financial objectives with sustainability criteria, represents
an integrated strategy to create value for stakeholders.
For further details on Saipem’s sustainable business, please refer to the section “Our sustainable business” in
this document.
SAIPEM AT A GLANCE
13 /
SAIPEM
AT A GLANCE
Interim Directors'
Report
Condensed interim consolidated
financial statements
ANNEXES
Saipem IN THE WORLD
01 / Where we operate
/ 14
SAIPEM INTERIM CONSOLIDATED FINANCIAL REPORT AS OF JUNE 30, 2026
SAIPEM
AT A GLANCE
SAIPEM AT A GLANCE
Interim Directors'
Report
Condensed interim consolidated
financial statements
ANNEXES
15 /
SAIPEM
AT A GLANCE
02 / Our people
/ 16
Interim Directors'
Report
Condensed interim consolidated
financial statements
ANNEXES
SAIPEM INTERIM CONSOLIDATED FINANCIAL REPORT AS OF JUNE 30, 2026
SAIPEM
AT A GLANCE
Interim Directors'
Report
Condensed interim consolidated
financial statements
ANNEXES
Our clients
Saipem's client portfolio is wide and diversified: as of the date of this report, the Company serves more than 30
clients. Consistent with Saipem’s wide ranging engineering capabilities, its client base currently includes leading
International Oil Company, major National Oil Companies, as well as operators active in the world of Utilities,
Infrastructures and Renewable Energy Sectors.
SAIPEM AT A GLANCE
17 /
SAIPEM
AT A GLANCE
Interim Directors'
Report
Condensed interim consolidated
financial statements
ANNEXES
Backlog
Backlog has increased significantly over the last years, thanks to a favourable reference market.
Saipem's backlog is currently very diversified, covering both offshore EPC and drilling activities (in shallow water
and deep water), and onshore EPC activities (including LNG plant projects, floating production, storage and
offloading units, fertilizer production plants, high-speed infrastructure).
/ 18
SAIPEM INTERIM CONSOLIDATED FINANCIAL REPORT AS OF JUNE 30, 2026
SAIPEM
AT A GLANCE
Interim Directors'
Report
Condensed interim consolidated
financial statements
ANNEXES
FINANCIAL PERFORMANCE
Saipem's financial performance has shown a steady improvement over the last three years thanks to the growth
of the backlog and the progressive decrease in incidence of problematic projects.
The growth revenue translated into growth in both EBITDA and profitability of the Group, furthermore, which also
experienced an enhancement in its EBITDA conversion rate to Operating Cash Flow.
SAIPEM AT A GLANCE
19 /
SAIPEM
AT A GLANCE
Interim Directors'
Report
Condensed interim consolidated
financial statements
ANNEXES
SAIPEM SpA SHARE PERFORMANCE
Saipem share performance in the first half of 2026 was overall positive, with a gradual appreciation over the
period. The share recorded its six-month low of €2.50 in the first trading session of the year and its six-month
high of €4.82 on June 15.
A first phase of growth was observed in the first two months of the year, with the price moving to around €3.50
at the end of February. This trend was benefited mainly by the announcement, in the final days of 2025, of some
significant offshore contracts with a total value of more than 4 billion dollars. The new contracts were
appreciated by the market as a positive indication of the resilience of the relevant market, despite concerns
linked to a possible oil oversupply which contributed to lead the oil price below 70 dollars per barrel. In the same
period, financial analysts revised upward the target prices for the Saipem share.
Further support to the share performance came from the publication of positive 2025 results, the announcement
of a 2026 guidance substantially in line with market consensus, and the confirmation of the proposal to pay, also
for 2026, a dividend in line with the 2025 one. The payment was completed on May 20, 2026, with the distribution
to shareholders of a dividend of approximately €330 million equal to €0.17 per share.
Since early March, the share has experienced a period of increased volatility, in a context characterised by the
intensification of the geopolitical tensions between the United States, Israel and Iran, which subsequently
evolved into a military escalation in the Middle-Est region. During this phase, the share underwent a correction,
reaching the price of €3.24 on March 6.
The resulting interruption of transit through the Strait of Hormuz had a significant impact on the global oil and
gas supply, leading to a rapid change in the market scenario, which shifted from fears of oversupply to a possible
deficit scenario. This dynamic was reflected in the Brent price, which went from approximately 60 dollars per
barrel to a peak of 118 dollars, with an average price close to 90 dollars per barrel over the first half of the year.
The new environment has strengthened investment prospects in the Oil&Gas sector, highlighting the need to
develop new infrastructure and further diversify sources of energy supply. These dynamics supported growth
expectations for the sector both in the short-and in the medium-long term, with a positive impact on the share
price.
A second phase of appreciation occurred following the presentation of the first quarter 2026 results, which took
place on April 22. At that time, the confirmation of the annual guidance – despite the tensions in the Middle East
– and an expanding commercial pipeline helped the share to reach its six-months high of €4.82.
In the second half of June, the signing of a memorandum of understanding between the United States and Iran
aimed at ending the conflict and restoring the transit through the Strait of Hormuz led to a normalisation of the
geopolitical and energy scenario. The Brent price consequently returned to the 70-75 dollars per barrel range,
with an impact on the sector’s prospects.
In such context, the Saipem share underwent a partial retracement, despite the announcements of significant
new awards, as well as the signing – on June 24 – of a binding purchase agreement for the sale of the shallowwater offshore drilling business. The transaction is expected to close by the third quarter of 2026 subject to the
satisfaction of the customary condition precedent, including obtaining the applicable regulatory approvals.
The Saipem share closed the month of June at €4.41.
/ 20
SAIPEM INTERIM CONSOLIDATED FINANCIAL REPORT AS OF JUNE 30, 2026
SAIPEM
AT A GLANCE
Interim Directors'
Report
Condensed interim consolidated
financial statements
ANNEXES
Details of performance during the reporting period are presented below.
Listing on the Milan Stock Exchange
2023
2024
2025
First half 2026
1.62
2.64
2.75
4.82
(€)
Ordinary shares:
1.14
1.26
1.62
2.50
1.40
2.06
2.29
3.76
1.47
2.51
2.43
4.41
SAIPEM AT A GLANCE
21 /
SAIPEM
AT A GLANCE
Interim Directors'
Report
Condensed interim consolidated
financial statements
ANNEXES
credit rating
As of the date of this document, Saipem’s long term issuer rating is BB+ with Credit Watch, with positive
implications according to Standard & Poor’s Global (S&P Global) and Ba1 with positive outlook according to
Moody’s.
On July 31, 2025, S&P Global placed Saipem’s credit rating under Credit Watch with positive implications. This
choice was motivated by the rating agency as a consequence of the announced signature of the binding merger
agreement between Saipem and Subsea7, which will lead to the creation of a more diversified, more profitable
group with a greater ability to generate cash flow. The rating agency reserves the right to resolve the Credit
Watch once the merger has been completed and the new company’s equity situation and capital allocation
policies have been examined.
On March 25, 2025, Moody’s revised the company’s rating upwards from Ba2 to Ba1, at the same time confirming
its positive outlook. The rating upgrade was determined by the improvement in Saipem’s operating performance
and the favourable market context, while the positive outlook was confirmed following the planned merger with
Subsea7.
RATING AGENCY
Standard & Poor’s
Moody’s
/ 22
LONG TERM
BB+
Ba1
OUTLOOK
Positive Credit Watch
Positive
LAST REVIEW DATE
July 31, 2025
March 25, 2025
SAIPEM INTERIM CONSOLIDATED FINANCIAL REPORT AS OF JUNE 30, 2026
SAIPEM
AT A GLANCE
Interim Directors'
Report
Condensed interim consolidated
financial statements
ANNEXES
ESG INDICES AND RATINGS
Over the years, Saipem has achieved positive assessments of the main ESG ratings and indices within its sector.
This reflects the Company’s continuous focus on sustainability issues, supported by the Sustainability Plan and
related ESG targets, as well as transparent and reliable sustainability reporting.
Main ESG ratings at June 30, 2026
Saipem's ESG ratings issued by the leading analysts Sustainalytics, ISS ESG Corporate, S&P Global and CDP, are
presented below.
MAIN ESG RATING AGENCIES
Sustainalytics (*)
ISS ESG Corporate
S&P Global
CDP
SCALE
100> 0
D- > A+
0> 100
D-> A
RATING
20.8
B81
B
AVERAGE SECTOR RATING
27.4
n/a
32
C
(*) The Sustainalytics ESG rating is based on risk exposure; therefore, a lower score indicates better performance.
SAIPEM AT A GLANCE
23 /
Saipem
at a glance
INTERIM DIRECTORS'
REPORT
Condensed interim consolidated
financial statements
ANNEXES
Interim directors'
report
/ 24
SAIPEM INTERIM CONSOLIDATED FINANCIAL REPORT AS OF JUNE 30, 2026
Saipem
at a glance
INTERIM DIRECTORS'
REPORT
Condensed interim consolidated
financial statements
ANNEXES
content
Highlights first half 2026 ______________________________________________________________________________________________________________________________
Main events of the first half __________________________________________________________________________________________________________________________
Governance ___________________________________________________________________________________________________________________________________________________
Operating review ___________________________________________________________________________________________________________________________________________
Organisational structure
Market conditions
New contracts and backlog
Capital expenditure
Asset Based Services and Offshore Wind --------------------------------------------------------------------------------------------------------------------------------------------------------------Asset Based Services
Offshore Wind
Energy Carriers and Sustainable Infrastructures ________________________________________________________________________________________
Energy Carriers
Sustainable Infrastructures
Offshore Drilling ---------------------------------------------------------------------------------------------------------------------------------------------------------------------------------------------------------------------------Financial and economic results ---------------------------------------------------------------------------------------------------------------------------------------------------------------------------------------Operating results
Balance sheet and financial position
Reclassified statement of cash flows
Key profit and financial indicators
Our sustainable business -------------------------------------------------------------------------------------------------------------------------------------------------------------------------------------------------------Net Zero Programme
Health, safety, environment and quality
Human resources
Research and development
Digital and ICT Services ---------------------------------------------------------------------------------------------------------------------------------------------------------------------------------------------------------Risk management -------------------------------------------------------------------------------------------------------------------------------------------------------------------------------------------------------------------------Additional information -------------------------------------------------------------------------------------------------------------------------------------------------------------------------------------------------------------Reconciliation of reclassified balance sheets used in the Directors' report
with the IAS/IFRS financial statements __________________________________________________________________________________________________________
Glossary ------------------------------------------------------------------------------------------------------------------------------------------------------------------------------------------------------------------------------------------------
26
28
29
33
33
33
34
36
37
38
42
45
45
50
53
56
56
60
63
65
67
69
71
78
90
98
101
121
125
128
25 /
Saipem
at a glance
INTERIM DIRECTORS'
REPORT
Condensed interim consolidated
financial statements
ANNEXES
highlights first half 2026
/ 26
SAIPEM INTERIM CONSOLIDATED FINANCIAL REPORT AS OF JUNE 30, 2026
Saipem
at a glance
INTERIM DIRECTORS'
REPORT
Condensed interim consolidated
financial statements
ANNEXES
27 /
Saipem
at a glance
INTERIM DIRECTORS'
REPORT
Condensed interim consolidated
financial statements
ANNEXES
main events of THE FIRST HALF
/ 28
SAIPEM INTERIM CONSOLIDATED FINANCIAL REPORT AS OF JUNE 30, 2026
Saipem
at a glance
INTERIM DIRECTORS'
REPORT
Condensed interim consolidated
financial statements
ANNEXES
GOVERNANCE
Saipem SpA adopts a traditional administration and control model which consists of:
≥�the Board of Directors, a central body in the corporate governance system, which is entrusted with the
management of the Company and which plays a fundamental guiding role, also for the achievement of
sustainable development objectives, as well as a central role in internal control and risk management;
≥�the Board of Auditors, dealing with supervision and control;
≥�the Shareholders' Meeting, as the corporate entity that conveys the will of the company through resolutions
adopted in accordance with the law and the Articles of Association. It is up to the Shareholders' Meeting to
appoint the Board of Directors and its Chairman for a period of maximum three financial years.
Taking into account the recommendations and principles of the Corporate Governance Code the Board of
Directors appointed the members of Remuneration and Nomination Committee, the Control and Risk Committee,
the Related Parties Committee and The Sustainability, Scenarios and Governance Committe. The Board of
Directors and each Committee have their own rules governing, specifically, their set-up, tasks, and operation.
Saipem's governance system is based on international best practices on the subject and, in particular, on the
principles included in the Corporate Governance Code – adhered to by the Company on December 17, 2020 –
as well as the applicable provisions included in the regulatory framework issued by the National Commission for
Companies and the Stock Exchange (Consob).
The "Corporate Governance and Shareholding Structure Report 2025" (hereinafter the “Report”) provides a
general and complete framework of the corporate governance system adopted by Saipem SpA. The Report,
drafted pursuant to Article 123-bis of the Italian Consolidated Law on Finance (TUF) is a stand-alone document
approved by the Board of Directors on March 10, 2026, and published on the Company's website
www.saipem.com under the "Governance | Documents" section.
The Report was drafted in accordance with the criteria contained in the "Format for Corporate Governance and
Shareholding Structure Report - X Edition (December 2025)" of Borsa Italiana SpA. It ensures to provide, in
accordance with the peculiarities of the business and corporate purposes, correct, exhaustive and effective
information, as required by the market.;
The Report illustrates the Company's profile and the principles it is based on, information on its shareholding
structure and its adherence to the principles mentioned in the Corporate Governance Code. It also includes the
main governance practices, as well as a summary of the main considerations that emerged from the analysis and
discussion of the annual letter by the Chairman of the Italian Corporate Governance Committee sent to all Italian
listed companies on December 18, 2024, containing the "2025 Report on the evolution of corporate governance
of listed companies - 13th report on the application of the Corporate Governance Code" and recommendations
for 2026.
The Report includes a detailed description of how the administration and control bodies and their committees
are structured and function, also in the light of the diversity policies adopted by Saipem and equal access to the
administration and control bodies of listed companies. It also includes an explanation of the roles, responsibilities
and competencies assigned to the Company's administration and control bodies. The Report also illustrates the
main characteristics of the internal control and risk management system.
It also acknowledges the adoption by Saipem SpA of: (i) the Management System Guideline on "Transactions
with Related Parties and Persons of Interest", which establishes the principles and rules to which Saipem SpA
and its subsidiaries must adhere in order to ensure the transparency and substantive and procedural fairness of
transactions with related parties and persons of interest, directors and statutory auditors and senior managers
with strategic responsibilities (SMSR) of Saipem, carried out by Saipem or its subsidiaries; (ii) the Management
System Guideline "Market Abuse", which establishes the principles and rules to which Saipem SpA and its
subsidiaries must adhere in the management within the Saipem Group and in the external communication of
corporate documents and information concerning Saipem. This is particularly relevant for material information
GOVERNANCE
29 /
Saipem
at a glance
INTERIM DIRECTORS'
REPORT
Condensed interim consolidated
financial statements
ANNEXES
SAIPEM HEAD OFFICE,
Spark 1
and inside information, the drawing, keeping and updating of Registers of persons who have access to the
aforementioned information, as well as the identification of relevant persons and the procedures for
communicating transactions carried out, also through third parties, on shares issued by Saipem or on other
financial instruments connected to these shares; (iii) the policy�for managing the dialogue with shareholders and
other stakeholders, in line with Recommendation No. 3 of the Corporate Governance Code, taking into account
the engagement policies adopted by institutional investors and asset managers.
The above documents are available on Saipem's website in the section “Governance | Documents”.
The criteria applied for determining the remuneration of Directors are illustrated in the “Report on Remuneration
Policy and Compensation Paid 2026”, drafted in accordance with Article 123-ter of Italian Legislative Decree
No. 58/1998 and Article 84-quater of the Consob Issuers Regulation published in the “Governance | Documents”
section of Saipem’s website.
/ 30
SAIPEM INTERIM CONSOLIDATED FINANCIAL REPORT AS OF JUNE 30, 2026
Saipem
at a glance
INTERIM DIRECTORS'
REPORT
Saipem SpA corporate bodies
GOVERNANCE
Condensed interim consolidated
financial statements
ANNEXES
31 /
Saipem
at a glance
/ 32
INTERIM DIRECTORS'
REPORT
Condensed interim consolidated
financial statements
ANNEXES
SAIPEM INTERIM CONSOLIDATED FINANCIAL REPORT AS OF JUNE 30, 2026
Saipem
at a glance
INTERIM DIRECTORS'
REPORT
Condensed interim consolidated
financial statements
ANNEXES
OPERATING REVIEW
Organisational structure
The Group is organisationally configured into separate business areas consistently with the Group's
Organisation Model, and includes:
•�
the organisational and geographical centralisation of staff structures, aimed at achieving high levels of
efficiency;
•�
the integration of project control and project risk management processes within the Chief Financial Officer
operating area, raising the level of sensitivity in risk analysis and management over the entire life cycle of
projects.
As of January 1, 2026, the Sonsub Robotics activities and the related organisational structure, previously
assigned to the Asset Based Services Business Line, were reallocated to the Drilling Business Line, which was
subsequently renamed Drilling and Sonsub. As a result, the organisational structure as of June 30, 2026
comprises the following Business Lines: Asset Based Services, Energy Carriers, Sustainable Infrastructures,
Offshore Wind, and Drilling and Sonsub.
The business lines, each with different dynamics, goals, and skills aimed at the technical and financial
development of the offers and the management of projects in the execution phase, as well as being centers of
excellence in technology and engineering, globally recognised by our customers, were structured as follows to
manage the Group’s portfolio:
≥�Asset Based Services – which manages the Offshore Engineering & Construction business – sea trunklines,
transportation & installation, subsea development – as well as the vessels and yards serving the Group’s
businesses;
≥�Energy Carriers – evolution of Saipem’s systems with a strong technological content, great attention to new
energy carriers and circularity; it brings together the Engineering & Construction business of “one-of-a-kind”
onshore and offshore projects, enhancing the extent, depth, and quality of our technical and management skill
portfolio; answering the new needs of the energy sector, it integrates the technical-operational skills
dedicated to the development, engineering, and execution of modular, repeatable and scalable systems, as
well as the monitoring and maintenance services based on digital technologies;
≥�Sustainable Infrastructures – to seize the opportunities of a sector that has become strategic in the energy
transition ecosystem, which will hopefully by accelerated by the Italian Recovery Fund;
≥�Offshore Wind – to consolidate Saipem’s role in the offshore wind sector through the unified management
and development of the business, with regard to the new opportunities to be pursued in the reference markets;
≥�Drilling and Sonsub – manages the Group’s fleet, which currently comprises drilling assets featuring a wide
range of technological capabilities, enabling operations across all water depths, from ultra deepwater to
shallow water environments. The segment also oversees the Sonsub business, which provides products and
services related to remotely operated vehicles (ROVs), drones and robotic equipment.
Market conditions
The current context is marked by a prolonged positive cycle in Saipem’s reference markets, particularly the
Oil&Gas market, driven by the growing need to access secure and economically sustainable energy sources. In
2026, according to preliminary IMF estimates, the world economy is expected to grow by 3.1% compared to
2025, in line with the previous year, despite rising uncertainties. This trend reflects a scenario shaped by
developments in the Middle East conflict between the United States and Iran, which have contributed to greater
geopolitical fragmentation and disrupted global crude oil and liquefied natural gas flows through the Strait of
Hormuz.
OPERATING REVIEW
33 /
Saipem
at a glance
INTERIM DIRECTORS'
REPORT
Condensed interim consolidated
financial statements
ANNEXES
Medium-term forecasts agree on the change in economic growth figures to around 3% per annum, in the light of
some ongoing geopolitical instabilities (particularly, the Russia-Ukraine conflict, tensions in the Middle East and
frictions between the United States and other countries), as well as economic ones.
During the first half of 2026, the energy sector was significantly impacted by the uncertainty of the geopolitical
context. In particular, within traditional energy sources such as oil and gas, supply tensions linked to restricted
flows through the Strait of Hormuz contributed to significant price volatility. As a result, Brent crude benchmark
prices averaged around 90 dollars a barrel during the half-year, exceeding earlier 2026 projections prior to the
outbreak of the US-Iran conflict. This situation, largely shaped by geopolitical uncertainty, did not, however,
prompt major oil companies to increase their investment in the global Oil&Gas market, with spending levels
remaining in line with previous years.
In today’s scenario, the major oil companies have continued to adopt strategies aiming to maintain their financial
solidity, at times through mergers and acquisitions and in line with the positive results obtained in traditional
business activities. In this context, there has been a renewed focus on core Oil&Gas segment activities, driven
by the growing emphasis on energy supply security. At the same time, there has been a slowdown in the
reallocation of portfolios towards energy transition investments.
In the field of renewable energy sources, particularly offshore wind power, there is a growing selectivity in the
development of new projects, with a gradual shift towards initiatives characterised by greater economic and
financial stability. This, together with the limitations in the supply chain, has worsened the short-term prospects.
Although some complexities remain, including the integration of renewables into the electricity transmission
system, the lack of sector standardisation and the developments in the policies supporting the sector, the overall
prospects for this market remain positive in the medium and long term, driven by growing demand for clean
energy.
New contracts and backlog
The backlog represents the value of the multi-year contracts awarded to the Group and is revised based on
contractual modifications and agreements made with clients. A project is included in the backlog upon receipt
of the award notification from the client.
/ 34
SAIPEM INTERIM CONSOLIDATED FINANCIAL REPORT AS OF JUNE 30, 2026
Saipem
at a glance
INTERIM DIRECTORS'
REPORT
Condensed interim consolidated
financial statements
ANNEXES
New contracts awarded during the first half of 2026
amounted to €5,737 million (€4,301 million in the first half
of 2025).
Of the total contracts awarded, 60% were attributable to
the Energy Carriers business, 31% to the Asset Based
Services business, and 9% to Offshore Drilling.
New contracts to be carried out abroad made up 81% of
the total; contracts awarded by Eni Group companies
were 22% of the overall figure. New contracts awarded
to Saipem SpA amounted to 17% of the total.
Saipem Group - New Contracts in the first half 2026
Year 2025
(€ million)
Amount
%
5,767
7,169
45 Saipem SpA
55 Group companies
12,936
100 Total
7,737
60 Asset Based Services
36 Energy Carriers
4,699
500
4 Offshore Drilling
100 Total
First half 2026
First half 2025
Amount
%
Amount
%
979
17
1,701
40
4,758
83
2,600
60
5,737
100
4,301
100
1,799
31
1,368
32
3,441
60
2,713
63
497
9
220
5
5,737
100
4,301
100
1,068
19
652
15
12,037
7 Italy
93 Outside Italy
4,669
81
3,649
85
12,936
100 Total
5,737
100
4,301
100
1,589
12 Eni Group
1,239
22
973
23
11,347
88 Third parties
4,498
78
3,328
77
12,936
100 Total
5,737
100
4,301
100
12,936
899
The backlog as of June 30, 2026 amounted to €29,861 million (€31,469 million as of December 31, 2025) broken
down as follow: €18,663 million for Asset Based Services, €10,112 million for Energy Carriers, and €1,086 million
for Offshore Drilling.
The breakdown of the backlog by business is as follows: 62% in the Asset Based Services business, 34% in the
Energy Carriers business, and 4% in Offshore Drilling.
94% of orders were on behalf of overseas clients, while orders from Eni Group companies represented 5% of
the overall backlog. The parent company Saipem SpA accounted for 40% of the total backlog.
The backlog including non-consolidated companies was €29,960 million (€31,578 million as of December 31,
2025).
OPERATING REVIEW
35 /
Saipem
at a glance
INTERIM DIRECTORS'
REPORT
Condensed interim consolidated
financial statements
ANNEXES
Saipem Group - Backlog as of june 30, 2026
June 30, 2025
(€ million)
June 30, 2026
Dec. 31, 2024
Amount
%
Amount
%
Amount
%
13,284
43 Saipem SpA
11,902
40
13,908
44
17,836
57 Group companies
100 Total
17,959
60
17,561
56
31,120
29,861
100
31,469
100
19,755
64 Asset Based Services
18,663
62
21,163
67
10,316
33 Energy Carriers
10,112
34
9,345
30
1,049
3 Offshore Drilling
100 Total
1,086
4
961
3
29,861
100
31,469
100
1,784
6
1,160
4
31,120
1,321
4 Italy
29,799
96 Outside Italy
100 Total
31,120
28,077
94
30,309
96
29,861
100
31,469
100
1,099
3
1,238
4 Eni Group
1,588
5
29,882
96 Third parties
100 Total
28,273
95
30,370
97
29,861
100
31,469
100
31,120
Capital expenditure
Capital expenditure made in the first half 2026 amounted to €133 million (€187 million in the first half 2025) and
mainly included the following business lines:
≥�for Asset Based Services: €81 million related to extraordinary maintenance and reinforcement of the FDS,
Saipem Constellation and of the JSD6000 vessel, which is leased from third-party and extraordinary
maintenance and upgrading of existing vessels;
≥�for Energy Carriers: €3 million related to purchase and extraordinary maintenance of equipment;
≥�for Offshore Drilling: €49 million related to maintenance and upgrading work on the vessels, in particular, on
the drillships Saipem 10000 and Santorini and jack-up Perro Negro 8.
In summary, capital expenditure in the first half 2026 are as follows:
Capital Expenditure
Year 2025
(€ million)
First half 2026
First half 2025
27
Saipem SpA
5
8
337
128
179
364
Other group companies
Total
133
187
202
Asset Based Services
81
96
15
Energy Carriers
3
5
147
Offshore Drilling
Total
49
86
133
187
364
Details of capital expenditure for the individual business lines are provided in the following paragraphs.
/ 36
SAIPEM INTERIM CONSOLIDATED FINANCIAL REPORT AS OF JUNE 30, 2026
Saipem
at a glance
INTERIM DIRECTORS'
REPORT
Condensed interim consolidated
financial statements
ANNEXES
ASSET BASED SERVICES
AND OFFSHORE WIND
Company information
Offshore Engineering & Construction projects are
managed by the Asset Based Services Business
Line, while projects in the Offshore Wind segment
are managed by the Offshore Wind Business Line.
The two business lines work in the same market,
sharing assets, vessels and fabrication yards, and
use the same resources to implement their projects.
Specifically, the Group manages the vessel fleet in a
unified and integrated manner, taking into account
the requirements, operating locations, intervention
schedules and contractual obligations of the orders
in execution referring (indistinctly) to both Asset
Based Services and Offshore Wind. The projects
managed by the two business lines are commented
separately below.
General overview
The Asset Based Services Business Line operates in the Offshore sector with a portfolio of skills, assets, and
services that allows coverage of a wide range of project types, including development of subsea fields, pipe
laying (including large diameters), and installation and lifting of offshore structures. The services offered by the
Business Line cover the entire “life of field” chain, from client care in the pre “Final Investment Decision” phase
(FID) to the development of the investment. They include engineering, implementation, installation, maintenance,
and modification activities, and ultimately, the decommissioning phase.
The service mentioned above are offered with complementary features, thanks to (i) a fleet of vessels that can
operate under complex operational and environmental conditions, (ii) to a network of fabrication yards and
logistics bases in Angola, Brazil, Indonesia, Guyana, Italy and Saudi Arabia, (iii) decades of engineering and project
management skills derived from experience in the sector. In particular, as of June 30, 2026, the fleet consists of
17 owned vessels and, consistently with the Company’s asset light strategy, some long-term leased vessels.
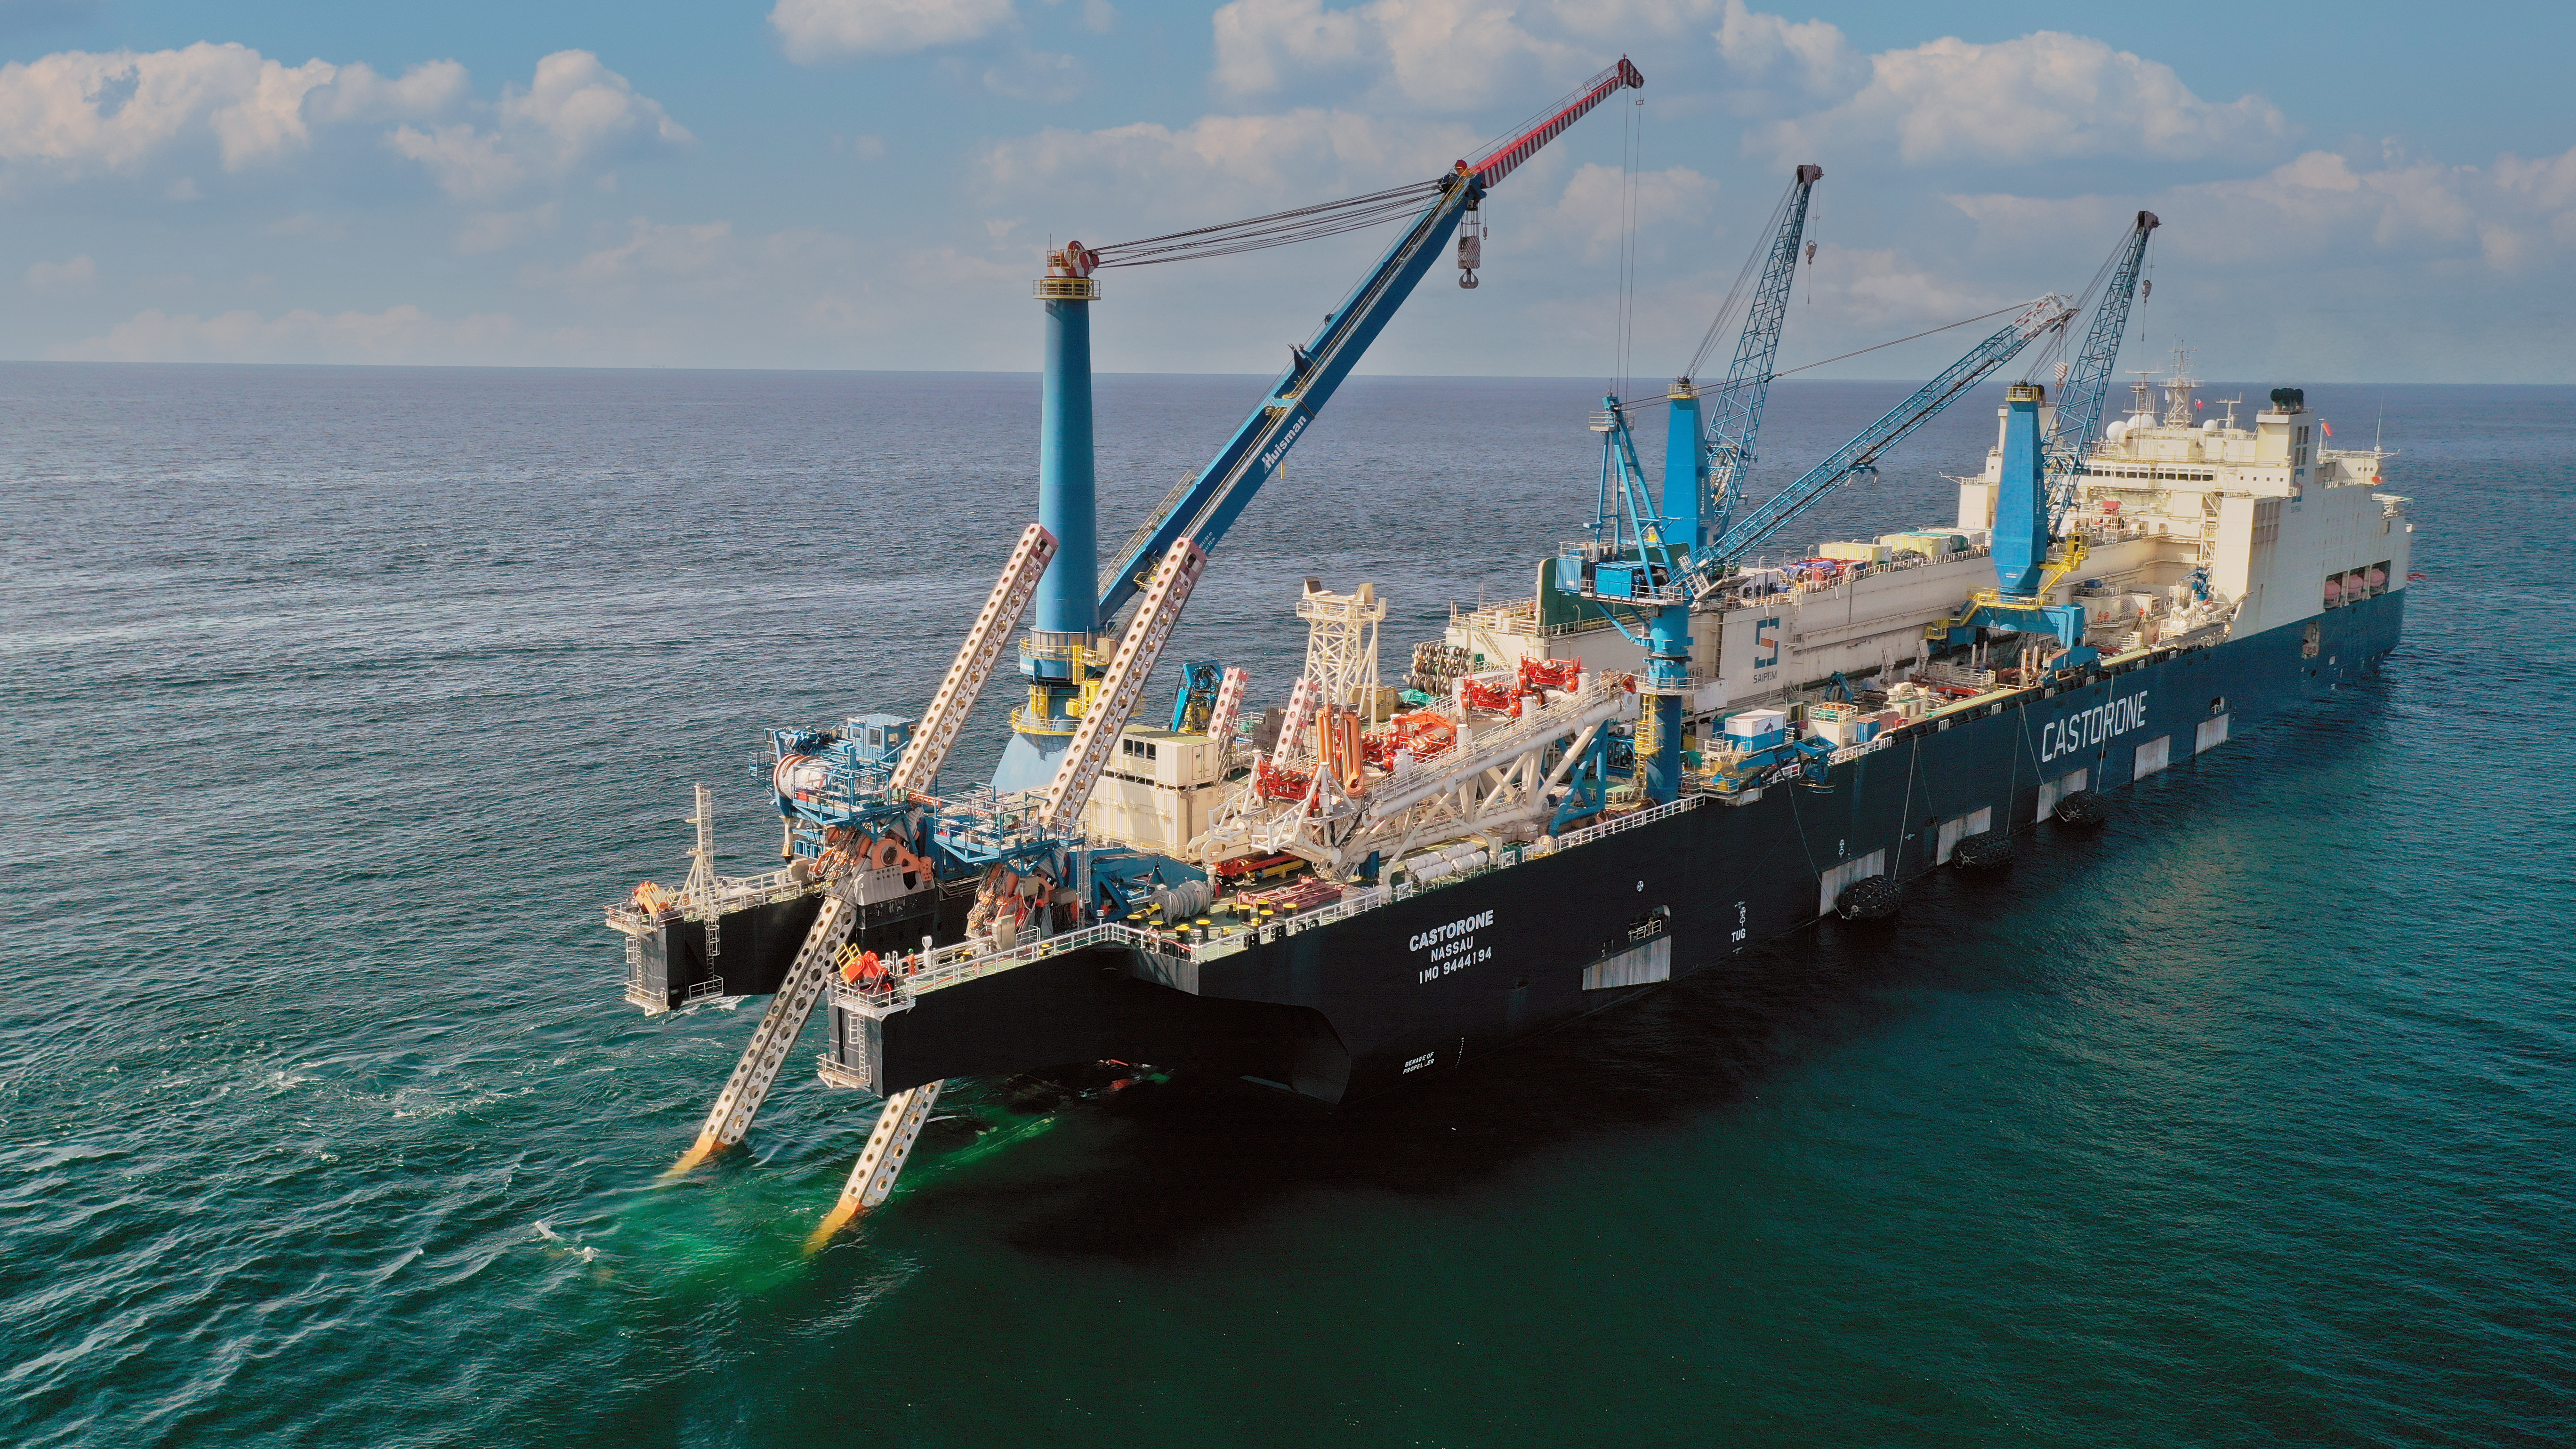
Among the main vessels of the fleet there are: the Saipem 7000, used for heavy lifting and decommissioning; the
pipelay vessel Castorone, used for laying large-diameter pipes; the FDS and FDS 2, used for the development of
subsea fields; the Saipem Constellation, used for field development activities thanks to its lifting and pipe-laying
capabilities for flexible pipelines; the Saipem Endeavour, used for pipe-laying and lifting.
As mentioned in the previous paragraph, the fleet and management facilities of Asset Based Services also
provide support to the Offshore Wind Business Line for renewable energy activities. The Business Line, in order
to optimise its production processes, pays special attention to technological innovations, automation, subsea
robotics and digitalisation.
Market conditions
The current context is marked by a prolonged positive cycle in Saipem’s reference markets, particularly the
Oil&Gas market, in line with the growing need to access secure and economically sustainable energy sources.
OPERATING REVIEW
37 /
Saipem
at a glance
INTERIM DIRECTORS'
REPORT
Condensed interim consolidated
financial statements
ANNEXES
In the offshore field, in recent years there has been a stabilisation of investments compared to the growth of
recent years, both in deep water and shallow water projects, with initiatives in the development of Subsea and
Conventional fields (offshore platforms and the related production and treatment plants). Specifically, in the
conventional market, despite the uncertainty caused by the geopolitical situation, the shallow-water segment in
the Middle East remains resilient, with developments in Saudi Arabia aiming principally to maintain oil production
in the country, and in Qatar and the United Arab Emirates, driven by the expansion of their natural gas production
capacities.
The subsea market, one of those that most suffered following the pandemic, has seen a solid resumption in
development activities, with oil operators seeking to develop Floating Production Storage and Offloading (FPSO)
systems (i) in West Africa and East Africa, with particular focus in countries such as Angola, Ivory Coast, Nigeria,
Namibia and Mozambique, (ii) in Brazil, Guyana and Suriname, and (iii) in Asia, particularly in Indonesia. The
trunkline segment, which is already crucial for energy procurement for Europe, has grown further in the energy
transition field, thanks to developments in the transport of CO2 to offshore storage sites.
In the field of renewable energy sources, particularly offshore wind power, there is a growing selectivity in the
development of new projects, with a gradual shift towards initiatives characterised by greater economic and
financial stability. This, combined with the constraints encountered in the supply chain, has contributed to a
deterioration of the short-term outlook. Although some complexities remain, including the integration of
renewables into the electricity transmission system, the lack of sector standardisation and the developments in
the policies supporting the sector, the overall prospects for this market remain positive in the medium and long
term, driven by growing demand for clean energy.
Capital expenditure
Capex carried out during the first half of 2026 focused on the execution of works aimed at class renewal,
implementing various improvements aimed at reducing the carbon footprint, and addressing specific
requirements arising from projects in the backlog. Among the vessels involved in the activities described above
are the FDS, Saipem Constellation, as well as the leased vessel JSD6000.
In line with operational needs, capex also continued to ensure the operation of equipment and yards.
Asset Based Services
New contracts
The most significant new contracts in the first half of 2026 were:
•�
for Azule Energy, a contract for transportation and installation (T&I) services in support of the Greater PAJ
project, located approximately 200 kilometres off the coast of Angola. The activities entail the engineering,
fabrication, transportation and installation of approximately 180 kilometres of rigid pipelines and subsea
facilities, at a water depth reaching up to 2,000 metres. The contract also includes the transportation and
installation of 38 kilometres of flexible flowlines and jumpers and 54 kilometres of umbilicals;
•�
for Saudi Aramco, a contract (Contract Release Purchase Order or CRPO) in Saudi Arabia under the existing
Long-Term Agreement (LTA) currently in force with Aramco. Saipem will be responsible for the engineering,
procurement, construction and installation (EPCI) of a trunkline, comprising approximately 65 kilometres
offshore and 12 kilometres onshore, as well as the related subsea facilities in the Safaniya oil field;
•�
for Saudi Aramco, two contracts in the Kingdom of Saudi Arabia, at the Safaniya oil field, known as Contract
Release Purchase Orders (CRPO), under its existing Long-Term Agreement. The first contract (CRPO 154)
covers the Engineering, Procurement, Construction and Installation (EPCI) of one water injection tie-in
platform, two water injection wellheads, approximately 5 kilometres of pipeline and approximately 15
kilometres of cables. The second contract (CRPO 155) includes the EPCI activities for four water injection
wellheads, as well as associated subsea facilities;
•�
for ExxonMobil, a Limited Notice to Proceed (LNTP), for the engineering, procurement, construction and
installation (EPCI) of the subsea structures, umbilicals, risers, and flowlines (SURF) system for the Longtail
project, located in the Stabroek Block offshore Guyana, at a water depth of approximately 1,750 metres.
/ 38
SAIPEM INTERIM CONSOLIDATED FINANCIAL REPORT AS OF JUNE 30, 2026
Saipem
at a glance
INTERIM DIRECTORS'
REPORT
Condensed interim consolidated
financial statements
ANNEXES
Work performed
Below are the main projects that were underway or were completed during the first half of 2026.
America
-� In Guyana, for ExxonMobil:
•�
activities continued on the Uaru project, involving the design, fabrication and installation of subsea
structures, risers, flowlines and umbilicals for a subsea production plant. The Saipem Constellation vessels
will be used, whilst the work of the vessels Castorone and FDS 2 has been completed;
•�
activities continued on the Whiptail project, the scope of which includes the engineering, procurement,
construction and installation (EPCI) of a subsea production plant. The vessels Castorone, FDS 2 and Saipem
Constellation will be used;
•�
engineering, procurement and construction work has continued as part of the Hammerhead project. The
vessel FDS 2 and the leased vessel Shen Da will be used in 2028;
•�
engineering and procurement work has begun as part of the Longtail project, which also involves the
construction and installation of the subsea system comprising structures, umbilicals, risers and flowlines
(SURF).
-� In Suriname, for TotalEnergies, activities continued on the Block 58 project, the scope of which includes the
engineering, procurement, supply, construction, installation, pre-commissioning and commissioning
assistance as well as the start-up of the Subsea Umbilicals, Risers and Flowlines (SURF) package. The vessels
FDS 2, Castorone and Constellation will be used.
-� In Brazil:
-� for Petrobras, work was completed on the execution of the Buzios 7 project, which involved the engineering,
procurement, construction, and installation of the Steel Lazy Wave Risers (SLWRs) and the corresponding
interconnecting flowlines between the subsea wells and the FPSO unit, as well as the associated service lines
and control umbilicals;
-� for TotalEnergies, work was completed on the Lapa Southwest project; the project involved the engineering,
procurement, construction and installation of subsea umbilicals, risers and flowlines, as well as subsea
production systems;
-� for Equinor, activities continued on the Raia project, the scope of which includes the engineering,
procurement, transport and offshore installation of a subsea pipeline to carry gas and the associated
structures, in deep waters, and the horizontal drilling activities for the coastal landfall; installation work was
completed in the first half of 2026 using the vessel Castorone.
North Sea
-� In Great Britain:
-� for EnQuest:
•�
works continued on the Thistle project relating to the decommissioning of the Thistle A platform, located
approximately 510 kilometres north-east of Aberdeen at a depth of 162 metres; the work includes the
engineering, preparation, removal and disposal of the jacket and topsides, with possible extension to further
subsea structures, and will be carried out by Saipem 7000;
•�
works continued on the Heather project relating to the decommissioning of the existing infrastructure at
the Heather oil field, located approximately 460 kilometres north-east of Aberdeen; the work involves the
engineering, preparation, removal and disposal of the upper jacket of the Heather platform using the Saipem
7000;
-� for Northern Endurance Partnership (NEP) and Net Zero Teesside Power (NZT) activities continued on two
projects for the development of offshore structures for CO2 transport and storage on the East Coast Cluster.
The scope of works includes the engineering, procurement, construction and installation of a 143 kilometres
offshore pipeline, with related landfalls and onshore control and inspection facilities for the Northern
Endurance Partnership (NEP) project, and the engineering, procurement, construction and installation of the
water evacuation line for the Net Zero Teesside (NZT) project.
OPERATING REVIEW
39 /
Saipem
at a glance
INTERIM DIRECTORS'
REPORT
Condensed interim consolidated
financial statements
ANNEXES
Mediterranean and Black Sea
-� In Egypt, for Petrobel, work continued on the Zohr project for the transportation and installation of high and
low voltage umbilicals and various subsea structures.
-� In Italy, for Eni, the work continued under the Cassiopea project for the transportation and installation of a rigid
pipeline, umbilicals and flexible lines, and the construction of a shore approach.
-� In Turkey, for Turkish Petroleum and under the existing Framework Agreement, the engineering and
procurement works continued for the two Sakarya 3 contracts, involving the engineering, procurement,
construction and installation (EPCI) of rigid flowlines and a Gas Export Pipeline (GEP). The offshore campaign
will be carried out by the pipelay vessel Castorone from the first half of 2027.
-� In Romania, for OMV-Petrom, works continued on the Neptun project, involving the engineering, procurement,
construction and installation (EPCI) of a gas treatment platform at a depth of approximately 100 metres, the
development of two subsea fields (at a depth of between 100 and 1,000 meters), a gas pipeline of around 160
kilometres and an associated fibre optic cable from the platform to the coast. Fabrication work on the gas
treatment platform has been completed at Saipem’s yards in Italy (Arbatax) and Indonesia (Karimun). Offshore
installation work began in the first half of 2026 using the Saipem 7000, Castoro 10 and Castorone vessels, as
well as the leased vessels Normand Maximus and JSD6000.
Africa
-� In Angola:
-� for Azule Energy (Eni & BP joint venture):
•�
work continued on the Quiluma and Maboqueiro WP5A project for the EPC-based construction of a jacket
and deck and the execution of the related hook-up and commissioning;
work continued on the Ndungu project, the scope of which includes the engineering, fabrication, transport
and installation of around 60 kilometres of rigid pipelines and subsea structures at a depth of 1,100 metres
and the transport and installation of pipelines, flexible connectors and 17 kilometres of umbilicals; offshore
installation works continued with the use of the vessel FDS and the leased vessel Shen Da;
•�
engineering works began on the Greater Paj project, which also includes the fabrication, transport and
installation of rigid pipelines and subsea structures. The contract also includes the transport and installation
of flexible flowlines, jumpers, and umbilical cables. The vessels FDS and Castorone will be used for the
offshore installation campaign;
-� for TotalEnergies, activities began on the Kaminho project, the scope of which includes the engineering,
procurement, supply, construction, installation, pre-commissioning and commissioning assistance and the
start-up phase of a SURF (Subsea Umbilicals, Risers, Flowlines) package, including around 30 kilometres of
pipelines and risers and umbilicals.
•�
-� In Libya, for Mellitah Oil & Gas, works continued on the Bouri Gas Utilisation project, which includes the
engineering, procurement, fabrication, installation and commissioning of a gas recovery module of
approximately 5,000 tonnes on the existing DP4 offshore structure, and the laying of 28 kilometres of pipeline
connecting the DP3, DP4 and Sabratha platforms. In the first half of 2026, the vessels Castoro 10 and Saipem
7000 were used to install the compression module and lay the two pipelines.
-� In Nigeria, for Shell Nigeria Exploration and Production Co (SNEPCo), the engineering and procurement
works continued on the Bonga North project, for which the scope of works includes the engineering,
procurement, construction and installation (EPCI) of risers and flowlines, subsea umbilicals and associated
subsea structures.
Middle East
-� In Saudi Arabia, for Saudi Aramco, works continued on the Long-Term Agreement. With reference to projects
in the portfolio awarded in previous years, engineering, procurement and fabrication activities continued, and
for some projects activities began on the offshore installation, using the leased vessel Dehe and the vessels
Saipem Endeavour, Saipem 3000 and Bautino 1.
/ 40
SAIPEM INTERIM CONSOLIDATED FINANCIAL REPORT AS OF JUNE 30, 2026
Saipem
at a glance
INTERIM DIRECTORS'
REPORT
Condensed interim consolidated
financial statements
ANNEXES
-� In Qatar:
-� for QatarEnergy:
•�
works continued on the North Field Production Sustainability (NFPS) EPCOL project, which involves the
engineering, procurement, construction and installation of both subsea and onshore pipelines, jackets and
wellhead platforms and risers, as well as the related support activities; the fabrication activities at the
Karimun yard in Indonesia and the offshore installation activities using the leased vessel Dehe were
completed in 2025;
•�
works continued for the North Field Production Sustainability (NFPS) EPC 2 project, which involves the
engineering, procurement, fabrication and installation of two offshore natural gas compressor stations to
support the production in the North Field, including two of the largest compression platforms on steel
jackets ever built, interconnecting bridges, accommodation modules, and interface modules. The
fabrication activities will be carried out at the Saipem yard in Karimun, Indonesia, and at the third-party
Bomesc (Tianjin) and COOEC (Quingdao) yards in China;
•�
works continued on the North Field Production Sustainability (NFPS) COMP3A & COMP3B project, which
includes the procurement, fabrication and installation of six platforms, as well as the installation of rigid
subsea pipelines in anti-corrosion alloy, composite underwater cable and fibre optic cables, as well as other
subsea structures. The fabrication activities will take place at the Saipem fabrication yard in Karimun,
Indonesia;
•�
engineering and procurement activities continued on the Sleepers project, which also includes the
construction and installation (EPCI) for the repair of damaged subsea pipelines in Qatar;
•�
engineering and procurement work began as part of the North Field Production Sustainability (NFPS)
Offshore Compression Complexes (COMP5) project, which involves the design, procurement, fabrication
and installation of two compression complexes, each including a compression platform, a living quarter
platform, a flare platform supporting the gas combustion system, and the related interconnecting bridges
(EPCI). Each complex will have a total weight of approximately 68,000 tonnes;
-� for Larsen & Toubru, engineering activities continued on the Ruya Batch 1 project, which involves the
engineering, transport and installation of a jacket, topside deck and a bridge. The installation activities are
planned for the second half of 2026 using the leased vessel Dehe.
-� In the United Arab Emirates, for ADNOC, works continued on the Hail and Ghasha project, the scope of which
includes the engineering, procurement and construction (EPC) of various offshore structures and 300
kilometres of subsea pipeline for connecting the drilling centres to the offshore treatment plant for carrying
the oil to the mainland. The project also includes the engineering, procurement and installation of 80 kilometers
of power cables and 70 kilometres of umbilicals to carry electricity to offshore rigs. Offshore installation
activities continued using the vessel Saipem Endeavour.
Caspian Sea
-� In Azerbaijan, for BP:
•�
as part of the framework agreement, activities continued for the engineering, procurement, construction
and installation of subsea infrastructures and life of field services in the Shah Deniz and Azeri Chirag
Gunashli fields using the client’s own Subsea Construction Vessel Khankendi;
•�
engineering works began on the Shah Deniz Compression project, involving the transport and installation
(T&I) of a new compression platform, as well as the engineering, procurement, construction and installation
(EPCI) of offshore pipelines connecting the new compression platform to the existing plants and all the main
permanent subsea works. The client’s own vessel Khankendi and the pipe-laying barge Israfil Huseynov will
be managed and operated by Saipem for the project execution.
Australia
-� for Chevron, works continued on the Jansz-lo project, which includes the transport and installation of a subsea
compressor station, manifold, field control station, as well as umbilicals and other facilities. The offshore
activities continued in 2025 using the leased vessel JSD6000; the vessel Saipem Constellation was used in the
first half of 2026.
OPERATING REVIEW
41 /
Saipem
at a glance
INTERIM DIRECTORS'
REPORT
Condensed interim consolidated
financial statements
ANNEXES
Indonesia
-� for British Petroleum Berau works continued on the Tangguh UCC project, including engineering,
procurement, construction and installation of two wellhead platforms, a CO2 re-injection platform and around
90 kilometres of associated pipelines.
Offshore Wind
Work performed
Below are the main projects that were underway during the first half of 2026.
In United Kingdom, for Neart na Gaoithe, as part of the NnG Offshore Windfarm project, activities related to
the close out of Punch List items and related to warranty are in progress.
In France, for Eoliennes Offshore du Calvados (EDF Renewables, Maple Power and Skyborne), Courseulles
project, all required monopiles with relevant transition structures required to support the 64 wind turbine
generators (WTG), are available for offshore installation. Thirty-two (32) locations have been drilled and
seventeen (17) monopiles and transition pieces have been completed.
/ 42
SAIPEM INTERIM CONSOLIDATED FINANCIAL REPORT AS OF JUNE 30, 2026
Saipem
at a glance
INTERIM DIRECTORS'
REPORT
Condensed interim consolidated
financial statements
Main leased vessels as of June 30, 2026
Dehe
Normand Maximus
JSD6000
GMS Endurance
Normand Samson
Bold Tern
Shen Da
Normand Frontier
Mubarak Supporter
QMS Gladiator
Hea Al Muzn
Mermaid Endurer
Normand Sentinel
Normand Navigator
OPERATING REVIEW
ANNEXES
Dynamically positioned vessel for pipe laying and heavy lifts up to 5,000 tonnes, capable of
performing installations in deep waters up to 3,000 metres and laying pipelines with a tension
capacity of up to 600 tonnes in S-Lay configuration.
Dynamically positioned vessel for the installation of umbilicals and flexible pipelines in water depths
of up to 3,000 metres, equipped with a crane with a lifting capacity of up to 900 tonnes and a
vertical lay tower with a tension capacity of 550 tonnes, also capable of installing rigid pipelines.
Dynamically positioned vessel for S-Lay and J-Lay pipeline installation and heavy lifts up to 5,200 tonnes
of static load. The J-Lay system has a maximum laying tension capacity of 1,500 tonnes and can safely
sustain the pipeline up to 2,000 tonnes. The S-Lay system has a maximum launch capacity of 700 tonnes
and a maximum hold back capacity of 900 tonnes. The JSD6000 is also equipped with a fully revolving
heavy lift crane with a lifting capacity of 5,200 tonnes on the main hook.
Self-propelled and dynamically positioned jack up vessel with accommodation capacity for up to
210 people. It is equipped with a 300 tonnes crane and a 15 tonnes auxiliary crane, features an
onboard storage area of approximately 1,000 square metres, and is capable of operating in water
depths of up to 65 metres.
Dynamic positioning construction support vessel, equipped with 1,450 square metres of deck storage
area, accommodation capacity for 100 people, a 250 tonnes main crane with active heave
compensation system, a 20 tonnes auxiliary crane, a 350 tonnes A Frame, and a bollard pull of 423
tonnes. The vessel is fitted with a moonpool and two Remote Operated Vehicles (ROVs). It is used for
subsea pipeline trenching activities employing the PL3 and BPL3 subsea ploughs.
Self-propelled jack-up vessel for the lifting and installation of offshore wind turbines, equipped with
a 1,600 tonnes crane and an onboard storage area of approximately 4,000 square metres. It is
capable of operating in water depths of up to 60 metres and has accommodation for 80 people.
Offshore construction vessel for the installation of rigid and flexible pipelines, as well as complex
structures such as risers and PLETs, in ultra�deep waters. It is equipped with an 800�tonnes crane
with active heave compensation and a DP3 dynamic positioning system. Its high storage capacity
and versatility ensure efficiency in offshore development projects.
Dynamically positioned vessel designed for multiple offshore operations, equipped with two
onboard cranes, a 60 tonnes main crane and a 12 tonnes auxiliary crane, and accommodation for
up to 182 people.
Multi�purpose dynamically positioned vessel equipped with two on�board cranes, comprising a
main crane with an 80-tonne lifting capacity and a secondary crane with a 12-tonne lifting capacity,
and providing accommodation for up to 182 personnel.
Self-propelled jack up vessel with dynamic positioning, equipped with four triangular lattice with k
type bracing legs measuring 110 metres, an onboard storage area of approximately 1,950 square
metres, a 400 tonnes main crane and a 50 tonnes auxiliary crane, and accommodation for up to
250 people.
Next generation self-propelled jack up vessel designed to provide high operational support and
stability during complex activities, equipped with four cylindrical legs measuring 85.5 metres, an
onboard storage area of approximately 1,000 square metres, a 100 tonnes main crane and a 15
tonnes auxiliary crane, and accommodation for 150 people.
DSV (Dive Support Vessel) designed for saturation diving and subsea support activities, equipped
with an integrated saturation system and a 100 tonnes crane for lifting and construction operations,
with accommodation capacity for 100 people plus 18 saturation divers.
DP3-class construction and offshore support vessel, featuring an overall length of 142.6 metres,
a beam of 25 metres, a gross tonnage of 15,008 GT, and a deadweight capacity of 9,000 tonnes. It
is equipped with a 1,800 square metres cargo deck, two subsea cranes with active heave
compensation, a moonpool, and accommodation facilities for up to 130 persons. The vessel is
employed in subsea operations and offshore construction activities.
DP3-class offshore support and construction vessel, with an overall length of 142.6 metres, a
beam of 25 metres, a gross tonnage of 15,008 GT, and a deadweight of 9,200 tonnes. It is equipped
with a 1,800 square metres cargo deck, offshore cranes with active heave compensation (250
tonnes and 50 tonnes), a handling system for two ROVs, a moonpool, and accommodation for up to
130 persons. The vessel is employed in subsea operations, IMR activities, and deepwater offshore
construction.
43 /
Saipem
at a glance
INTERIM DIRECTORS'
REPORT
Offshore fleet as of June 30, 2026
Saipem 7000
Saipem Constellation
Saipem FDS
Saipem FDS 2
Castorone
Saipem 3000
Saipem Endeavour
Condensed interim consolidated
financial statements
ANNEXES
Self-propelled, semi-submersible, dynamically positioned crane and pipelay vessel capable of
lifting structures of up to 14,000 tonnes and J-laying pipelines at depths of up to 3,000 metres.
Dynamically positioned vessel for the reel-lay of rigid and flexible pipelines in ultra�deep-water
depths. It is equipped with a 3,000 tonnes crane and a laying tower (800 tonnes capacity) equipped
with two tensioners each with a 400 tonnes capacity.
Dynamically positioned vessel utilised for the development of deep-water fields at depths of over
2,000 metres. Capable of launching pipes of up to 22” in diameter in J-lay configuration, able to lay
quadruple joint pipes (52-metre strings) with a holding capacity of up to 750 tonnes and a crane
with lifting capacity of up to 600 tonnes.
Dynamically positioned vessel used for the development of deep-water fields; it has a J�lay tower
with a holding capacity of up to 2,000 tonnes; capable of launching pipes with a maximum diameter
of 36”; able to lay quadruple joint pipes (52-metre strings) at depths of up to 3,000 metres. Also
capable of operating in S-lay mode with a crane with a lifting capacity of up to 1,000 tonnes.
Dynamically positioned pipelay vessel operating in S-lay mode with an S-lay stern stinger of over
120 metres consisting of three sections for shallow and deep-water operations, a tensioning
capacity of up to 750 tonnes, pipelay capability of up to 60 inches, on-board manufacturing
facilities for double and triple joints and pipe storage capacity in cargo holds.
Monohull, self-propelled, dynamically positioned lifting vessel, with drilling tower, capable of laying
flexible pipes and umbilicals in waters up to 3,000 metres deep and lifting heavy loads of up to
2,200 tonnes.
Barge for lifting heavy loads and laying pipes (in S-lay mode), suitable for launching single- or
double-joint pipes of up to 60” in diameter for shallow and deep-water operations, with a
tensioning capacity of up to 260 tonnes, equipped with a floating launch ramp composed of three
sections for deep-water operations, a mini ramp with adjustable structure for shallow-water
operations, and a rotating crane with a 1,100 tonne capacity.
Castoro 10
Trench/pipelay barge capable of burying pipes of up to 60” diameter in shallow waters.
Castoro 12
Barge capable of laying pipes of up to 40” diameter in ultra-shallow waters of a minimum depth of
1.4 metres.
Bautino 1
Shallow water post trenching and backfilling barge.
Castoro XI
Heavy-duty cargo barge.
Castoro 14
Cargo barge.
S43
Cargo barge.
S44
Launch cargo barge, for structures of up to 30,000 tonnes.
S45
Launch cargo barge, for structures of up to 20,000 tonnes.
S46
Cargo barge.
S47
Cargo barge.
/ 44
SAIPEM INTERIM CONSOLIDATED FINANCIAL REPORT AS OF JUNE 30, 2026
Saipem
at a glance
INTERIM DIRECTORS'
REPORT
Condensed interim consolidated
financial statements
ANNEXES
ENERGY CARRIERS
and SUSTAINABLE
INFRASTRUCTURES
Company information
Onshore Engineering & Construction projects fall under the Energy Carriers business line, while the Sustainable
Infrastructures business line manages the Sustainable Infrastructures segment. Comments on the projects
managed by the two Business Lines are shown separately below.
General overview
The Saipem Group’s Onshore Engineering & Construction is focused on the execution of large-scale projects
with a high degree of complexity in terms of engineering, technology, and operations, with a strong bias towards
challenging projects in difficult environments and remote areas.
Saipem enjoys a worldwide leading position, providing a complete range of integrated basic and detailed
engineering, procurement, project management and construction services, principally to the Oil&Gas, complex
civil and marine infrastructure and environmental markets.
In the Sustainable Infrastructure segment, the Saipem Group is mainly active in the design and construction of
complex infrastructure projects, especially in the transport sector, such as railway lines and in particular High
Speed/High-Capacity lines. These are complex works in terms of engineering and construction requiring an
increasing implementation of innovative digital and technological solutions capable of guaranteeing resilience
and energy efficiency, and which meet the requirements of the European taxonomy (DNSH principle “Do No
Significant Harm”), the classification system for environmentally sustainable economic activities, capable of
meeting the Sustainable Development Goals (SDGs) included in the United Nations 2030 Agenda.
Energy Carriers
Market conditions
In the first half of 2026, the overall positive outlook for the Oil&Gas market and the EPC (Engineering,
Procurement & Construction) sector continued, in line with the previous year, despite macroeconomic and
geopolitical volatility. Growth was primarily driven by demand for natural gas and LNG (Liquefied Natural Gas) and
the need to ensure energy security and cost
competitiveness.
The development of projects based on floating
solutions has further consolidated, while investments
in energy transition segments continue with greater
selectivity. Additionally, the adoption of modularisation
solutions for project execution continues to spread.
Geographically, the most active markets continue to be
APAC, particularly Indonesia, the Middle East, and the
Americas, with a focus on gas and LNG, while Europe
remains significant in the low carbon segments.
The main market opportunities were:
OPERATING REVIEW
45 /
Saipem
at a glance
•�
•�
•�
•�
•�
INTERIM DIRECTORS'
REPORT
Condensed interim consolidated
financial statements
ANNEXES
the continuation of major natural gas/LNG developments;
the growth of floating projects;
the advancement of pre-FID initiatives for CCUS and low carbon solutions in Europe;
the conversion of refineries into bio-refineries;
the development of natural gas monetisation projects in Africa and the Middle East.
Capital expenditure
Capital expenditure in the first half of 2026 in the Energy Carriers business line mainly related to the acquisition
and maintenance of equipment.
New contracts
The most important new contracts for 2025 were:
•�
for TotalEnergies, the notification of the extension of the Operation & Maintenance services contract linked
to the Kaombo project, offshore Angola. The extension will include operation and maintenance activities on
the two converted FPSO units (FPSO North and FPSO South), as well as on the related facilities;
•�
for Saudi Aramco, a contract for the Uthmaniyah Gas Compression Plant project in the Kingdom of Saudi
Arabia. The project involves engineering, procurement and construction (EPC) activities for a new
compression plant serving the non-associated gas field of Uthmaniyah;
•�
for Eni, the contract for the realisation of the new Priolo biorefinery in Sicily, in Italy. The contract covers
detailed engineering, procurement of materials and construction of the main units of the new biorefinery.
Work performed
Below are the main projects that were underway or were completed during the first half of 2026.
In Saudi Arabia,
- for Saudi Aramco:
•�
for the Marjan project, an EPC contract for the implementation of “Package 10” of the development
programme for the field of the same name, including gas treatment, sulphur recovery and tail gas treatment
plants, the completion of the remaining facility is underway, following the delivery to the client of the Early
Start-Up Systems. Three out of four units (AGRU Train 2, SRU Train 2, and AGRU Train 3) are in the advanced
stage of punch list closure for mechanical completion, and for the fourth (SRU Train 3), the final construction
and pre-commissioning activities are being completed;
•�
for the Berri project, an EPC contract to increase the capacity of the field of the same name through the
construction of new facilities in Abu Ali and Khursaniyah, the related pre-commissioning and mechanical
completion activities are in the advanced stages with the client, awaiting the definition of the shut-down
windows for the final tie-ins;
•�
for the Jafurah project, which includes the execution based on an EPC Lump Sum of approximately 800
kilometers of various types of pipelines within the development programme for the Jafurah gasfield located
on the border between Saudi Arabia and Qatar, the construction activities have been substantially
completed and the gas-in has been carried out across all the plant units;
•�
for the Uthmaniyah project, which involves the execution of a new compression plant on an EPC Lump Sum
basis to increase non-associated gas (NAG) production and extend the life of the field, the engineering and
procurement activities have begun, as part of Saipem’s own portion scope of work (NSH is responsible for
construction as its own portion).
In Israel, for Haifa Group, as part of the Ammonia Plant project, which includes the construction of an ammonia
plant on the Mishor Rotem site, the last construction activities are underway by the client, with QA/QC (Quality
/ 46
SAIPEM INTERIM CONSOLIDATED FINANCIAL REPORT AS OF JUNE 30, 2026
Saipem
at a glance
INTERIM DIRECTORS'
REPORT
Condensed interim consolidated
financial statements
ANNEXES
Assurance/Quality Control) supervision by Saipem. Commissioning activities managed by Saipem with the
support of the client have also begun.
In the United Arab Emirates:
•�
for ADNOC Sour Gas, subsidiary of the Abu Dhabi National Oil Co (ADNOC) Group, for the Optimum Shah
Gas Expansion (OSGE) & Gas Gathering project, the remaining construction phases are underway for the
additional variations requested by the client, with a part of the mechanical completion and start-up activities
completed;
•�
for ADNOC, the engineering and procurement activities have been substantially completed, while the
material deliveries and fabrication and construction activities are continuing at the sites, for the contract
relating to the “Offshore Facilities” package of the Hail and Ghasha Development Project, in joint venture
with National Petroleum Construction Co (NPCC). The aim of the project is to develop resources in the Hail
and Ghasha natural gas fields, located off the coast of Abu Dhabi, in the United Arab Emirates. The scope of
works includes the engineering, procurement, construction (EPC) and commissioning of four drilling centres
and an upstream treatment plant to be built on artificial islands by the client.
In Australia, for Perdaman Chemicals and Fertilizers, the engineering and procurement activities were
substantially completed, with almost all the modules already delivered and installed on site. The fabrication of
the last modules continues in India along with the construction on the Karratha site for the construction of the
urea production plant called Burrup Urea Project. The project is on an EPC basis for a plant that will have a
production capacity of 6,200 tonnes/day of urea. The project stands out for the high levels of energy efficiency
modularisation.
In Nigeria:
•�
for Dangote Fertilizer, FEED activities are underway for four more urea ammonia trains to be implemented
in the same fertiliser complex in the Lekki Free Trade Zone, Lagos State;
•�
for Nigeria LNG (NLNG), as part of the EPC contract LNG Bonny Train 7, in joint venture with Daewoo and
Chiyoda Corp, the construction works continue and the commissioning of the first plant systems has been
initiated. The project involves the construction of a double natural gas liquefaction plant, as well as all the
necessary utilities and port facilities for export, for the expansion of the existing LNG plant at Finima on
Bonny Island.
In Mozambique:
for TotalEnergies E&P Mozambique Area 1 (which acquired the Anadarko interests during 2019 for the
Mozambique LNG project), in a joint venture with McDermott Italia Srl and Mirai Engineering Italy Srl, Saipem
is implementing an LNG plant project for the construction of two natural gas liquefaction trains, as well as
all necessary infrastructure, storage tanks and port facilities for export. In late 2025, the project, on hold
since 2021 on instruction from the client TotalEnergies, received the notice of revocation of the state of
force majeure and the lift of the suspension from the client. The joint venture continues to cooperate with
the client to ensure the efficient resumption and continuation of the works;
•�
for Mozambique Rovuma Venture (joint venture between Exxon, Eni and CNODC), the engineering works,
in consortium with McDermott and CPECC, have been completed within the competitive FEED contract and
related EPC bid (submitted in JV with Daewoo) for the Rovuma LNG Phase 1 project for the initial
development of the LNG plant (Midstream), part of the wider Mozambique Full Field Development
(Mozambique Area 4 offshore fields). The client is in the final decision-making phase for the project award
and the start of specific EPC activities through a bridging contract.
•�
In Angola, for Azule Energy (Eni & BP JV), the construction, commissioning and start-up activities were
completed, together with the performance test, and the Provisional Acceptance Certificate was obtained, with
related start of the warranty period, for the Quiluma and Maboqueiro Project for the Onshore Gas Treatment
Plant, which involved the construction of a grass roots plant for gas treatment and compression in the northern
region of the country.
In Algeria, for Sonatrach, the engineering activities requested by the client were completed for the FEED (Front
End Engineering Design) and the activities relating to the fast-track EPC bid are underway for the Phosphate
OPERATING REVIEW
47 /
Saipem
at a glance
INTERIM DIRECTORS'
REPORT
Condensed interim consolidated
financial statements
ANNEXES
Integrated project and for the design of a new industrial complex, consisting of phosphate mining
infrastructures in the Bled El Hadba area, process units and ancillary units supporting the production of fertilisers
in the Oued Keberit area and the construction of railway lines connecting the mining and production plants to
the main railway line.
In Canada, for DOW Chemicals, the detailed engineering (with the finalisation of engineering deliverables for
construction) and procurement services have been completed (with the materials purchased by the client) in the
FS P2Z LP8 Gas Phase project, on a reimbursable basis, for the implementation of a polyethylene plant which is
part of a zero CO2 emissions petrochemical mega-project (Path2Zero Programme) in the state of Alberta.
In Italy, for Eni:
•�
within the Livorno biorefinery project in the existing industrial complex, the engineering and procurement
activities have essentially been completed, while the construction activities are continuing. The activities
include the project for the application of Ecofining™ per technology for the production of HVO
(Hydratreated Vegetable Oil);
•�
the upgrade is underway of the Venice biorefinery in the existing industrial complex. The aim of the
intervention is to increase bio-fuel production, particularly the production of Jet fuel (SAF - Sustainable
Aviation Fuel), by enhancing the plant’s capacity and improving feedstock flexibility, while also boosting
overall output. The first part of the project – specifically related to the introduction of SAF production and
mainly involving modifications to the HF2 unit (Isomerisation and Fractionation) – continues from the
previous months with the construction phase and is nearing completion of the engineering and procurement
phase;
•�
within the Priolo biorefinery project in the existing industrial complex, the engineering and procurement
activities have been initiated. The project involves the construction of eco-refining units to produce BioJet
(ASTM D7566) and HVO-diesel (ASTM D975).
In the UK, for Eni, the decommissioning activities are at the advanced stage and the engineering, procurement
and construction activities for the Eni Liverpool Bay CCS project involving the construction of a new CO2
electrical compression station, and the demolition and remediation of the existing Point of Ayr gas terminal plant.
In Sweden, for Stockholm Exergi AB, Phase 1 has been completed and Phase 2 is underway for the Stockholm
Exergi Beccs EPC Plant project for the construction of a capture, liquefaction, storage and offloading plant for
the CO₂ from combustion gases at the KVV8 electric power plant in the port of Stockholm. Engineering and
material procurement activities are currently underway.
In addition, major advancements were recorded in 2025 for the Saipem-owned Bluenzyme low carbon
technology, with:
•�
in Finland, for Ren-Gas, FEED activities in the BluenzymeTM project for the production of green methane
from captured CO2 and green hydrogen. These activities were completed during the year, leading the client
to select Bluenzyme as the product for CO2 capture and including it in the project financing structure;
•�
in Italy, at the Herambiente site in Ferrara, the CapturEste project continued with the permitting and frontend engineering phases. The project focuses on CO2 capture and is part of the development of the future
Eni-Snam CCS infrastructure in the Po Valley, where Saipem is involved as technological partner and EPC
Contractor in its capacity as supplier of the proprietary Bluenzyme capture technology.
Floaters and Operation & Maintenance
Below are the main FPSO and O&M (Operation & Maintenance) projects that were underway or were completed
during 2025.
In the “Leased FPSO” segment, in the first half of 2025 the Saipem-owned unit FPSO Gimboa carried out
operations for Sonangol P&P under a contract for the development of the Gimboa field, located in Block 4/05
offshore Angola, at a water depth of 700 meters. The vessel has the size for a production, treatment and storage
/ 48
SAIPEM INTERIM CONSOLIDATED FINANCIAL REPORT AS OF JUNE 30, 2026
Saipem
at a glance
INTERIM DIRECTORS'
REPORT
Condensed interim consolidated
financial statements
ANNEXES
capacity of 60,000 barrels/day. After a series of extensions, the contract is being closed following the depletion
of the production field.
In Mozambique, for Coral FLNG SA (JV of Eni and other partners) O&M services are underway for Coral's FLNG
unit. In the same project, in 2025 the client issued a new contract for the supply of spare parts.
In Angola:
-� for TotalEnergies:
•�
O&M services continue for the FPSOs Kaombo Norte and Kaombo Sul;
•�
engineering activities and material deliveries are underway for the Kaminho FPSO Block 20/11 contract.
Fabrication is underway for both the hull modification activities and the modules;
•�
within the Kaminho O&M Block 20/11 contract, preparations have begun ahead of the start of operations;
-� for Azule Energy (Eni & BP joint venture) within the Quiluma and Maboqueiro Project for the Onshore Gas
Treatment Plant, activities began on the preparations for the provision of O&M services.
In Ivory Coast, for Eni, the O&M services continue on the FPSO Firenze, re-named Baleine, in the related
contract. The unit works offshore in the Ivory Coast.
In Brazil, for Petrobras, in joint venture with Hanwha Offshore (previously Daewoo Shipbuilding & Marine
Engineering - DSME), in the P79 project the sail away of the Floating Production Storage and Offloading (FPSO)
unit, to develop the Buzios offshore field in Brazil was successfully completed. Punch list close-out and the last
commissioning activities are underway prior to handover to the client and the subsequent first oil.
In Congo, for Eni Congo, for the Scarabeo 5 Conversion project, the sail away of the semi-sub drilling rig
Scarabeo 5, reconverted into a floating unit for the separation and compression of gas produced in offshore
fields, was completed successfully. The unit has reached its final destination in the offshore field in Congo and
has completed the last tests ahead of the PAC (Provisional Acceptance Certificate).
In Indonesia, for Eni North Ganal, as part of the preliminary contract for the Kutei FPSO project, engineering
and procurement activities are underway for long lead items. Fabrication activities began on the hull at the CMHI
(China Merchants Heavy Industry) Fabrication Yard. This project, in joint venture with Tripatra, includes the
construction of a new FPSO unit to work in offshore fields in Indonesia.
In Sweden, for Stockholm Exergi AB, Phase 1 has been completed and Phase 2 is underway for the Stockholm
Exergi Beccs EPC Plant project for the construction of a capture, liquefaction, storage and offloading plant for
the CO₂ from combustion gases at the KVV8 electric power plant in the port of Stockholm. The engineering and
material procurement activities are currently underway and the in-yard prefabrication and site construction
activities are being initiated.
In addition, during the first half of 2026, activities related to Saipem’s proprietary low carbon BluenzymeTM
technology continued:
•�
in Finland, for Ren-Gas, following the completion of the FEED and the selection of the BluenzymeTM
technology for an e-methane production plant, activities to update and align the technical and financial offer
for the subsequent phases of the initiative continued;
•�
in Italy, at the Herambiente site in Ferrara, the FEED for the CapturEste project is underway, which involves
the application of the Bluenzyme 200 solution to the waste-to-energy plant, with the aim of supporting the
final investment decision and future integration with the Ravenna basin’s CCS infrastructure.
The study and commercial development activities for further applications of the BluenzymeTM technology in
Europe continued in the waste-to-energy, e-fuels, and hard-to-abate sectors.
OPERATING REVIEW
49 /
Saipem
at a glance
INTERIM DIRECTORS'
REPORT
Condensed interim consolidated
financial statements
ANNEXES
Floaters and Operation & Maintenance
Below are the main FPSO (Floating Production, Storage, and Offloading) and O&M (Operation & Maintenance)
projects that were underway or were completed during the first half of 2026.
In the “Leased FPSO” segment, in the first half of 2026 the Saipem-owned unit FPSO Gimboa carried out
operations for Sonangol P&P under a contract for the development of the Gimboa field, located in Block 4/05
offshore Angola, at a water depth of 700 meters. The vessel has the size for a production, treatment and storage
capacity of 60,000 barrels/day. After a series of extensions, the contract is being closed following the depletion
of the production field.
In Mozambique, for Coral FLNG SA (JV of Eni and other partners) O&M services are underway for Coral’s FLNG
unit. In the same project, in 2025 the client issued a new contract for the supply of spare parts.
In Angola:
-� for TotalEnergies:
•�
O&M services continue for the FPSOs Kaombo Norte and Kaombo Sul, which have been extended for a
further 8 years;
the engineering and procurement activities are being finalised and the material deliveries are underway for
the Kaminho FPSO Block 20/11 contract. Fabrication is underway for both the hull modification activities
and the modules;
•�
within the Kaminho O&M Block 20/11 contract, preparations have begun ahead of the start of operations;
-� for Azule Energy (Eni & BP joint venture) within the Quiluma and Maboqueiro Project for the Onshore Gas
Treatment Plant, the preparation activities are underway for the provision of O&M services.
•�
In Ivory Coast, for Eni, the O&M services continue on the FPSO Firenze, re-named Baleine, in the related
contract. The unit works offshore in the Ivory Coast.
In Brazil, for Petrobras, in joint venture with Hanwha Offshore (previously Daewoo Shipbuilding & Marine
Engineering - DSME), in the P79 project the handover to the client of the Floating Production Storage and
Offloading (FPSO) unit, to develop the Buzios offshore field in Brazil was successfully completed. Punch list
close-out and the last commissioning activities are underway prior to handover to the client and the subsequent
first oil.
In Congo, for Eni Congo, for the Scarabeo 5 Conversion project, the Provisional Acceptance Certificate, with
related start of warranty period, for the semi-sub drilling rig Scarabeo 5, reconverted into a floating unit for the
separation and compression of gas produced in offshore fields, was completed successfully. The unit has
reached its final destination in the offshore field in Congo and has completed the last tests ahead of the PAC
(Provisional Acceptance Certificate).
In Indonesia, for Eni North Ganal, as part of the preliminary contract for the Kutei FPSO project, engineering
and procurement activities are underway for long lead items. Fabrication activities are underway on the hull at
the CMHI (China Merchants Heavy Industry) Fabrication Yard. This project, in joint venture with Tripatra, includes
the construction of a new FPSO unit to work in offshore fields in Indonesia.
Sustainable Infrastructures
Market conditions
As regards the Sustainable Infrastructures sector, following the delays by Rete Ferroviaria Italiana in launching
new railway tenders in Italy, Saipem is also expanding its business on strategic transport infrastructures in
Europe, partly funded with European structural funds and investments. The extensive experience gained by
Saipem, as leader of consortia set up to implement the High Speed/High Capacity (HS/HC) railway lines
/ 50
SAIPEM INTERIM CONSOLIDATED FINANCIAL REPORT AS OF JUNE 30, 2026
Saipem
at a glance
INTERIM DIRECTORS'
REPORT
Condensed interim consolidated
financial statements
ANNEXES
Milan-Bologna and Milan-Verona in Italy, the first railway line in the United Arab Emirates and the project
underway relating to the High-Speed railway link in Florence allows Saipem to work in any context.
The Infrastructure sector continued to show positive short- and medium-term signs due to the major
investments in sustainable mobility and strategic works by governments, which are expected to continue in the
long-term with further developments in both the railway sector and sustainable mobility in a broader sense.
With a view to diversification, the Business Line focuses its attention of expanding its business also in
infrastructure segments other than railways (motorways, underground systems) and in new geographical areas
of interest.
New contracts
There were no new contracts in the first half of 2026.
Work performed
Below are the main projects that were underway or were completed during first half of 2026.
In Italy:
-� for Rete Ferroviaria Italiana (RFI):
•�
Brescia East-Verona HS/HC (High-Speed/High-Capacity) Line: activities are underway for the
construction of the Brescia East�Verona HS/HC (High-Speed/High-Capacity) line. During the first half of the
year, all works on the high-speed line were substantially completed to allow for the start of test train runs,
which began on June 3, one month ahead of the�Italian Recovery and Resilience Plan (PNRR) target set for
June 30, 2026. Activities are underway to complete the remaining minor works, while efforts continue to
finalise the dossiers required for the line’s commissioning, expected in the first quarter of 2027. The new
Brescia-Verona high-speed line, included in the TEN-T networks as a European rail corridor of strategic
importance and in the PNRR, runs for approximately 30 kilometres alongside the Milan-Venice motorway
and approximately 15 alongside the historic railway line, crossing 11 municipalities with high population and
industrial density. The new line will further enhance passenger and freight connections along the TurinVenice route, reducing travel times and promoting sustainable modal shifts;
OPERATING REVIEW
51 /
Saipem
at a glance
•�
•�
•�
INTERIM DIRECTORS'
REPORT
Condensed interim consolidated
financial statements
ANNEXES
Florence railway link project and associated new Belfiore High-Speed (HS) station: excavation of the
even-track tunnel was started and completed in the first half of 2026 with the first Tunnel Boring Machine
(TBM - Iris), which reached Belfiore station on June 16 (in addition to the excavation for the odd-track tunnel
which reached the station on December 11, 2025), after excavating approximately 3,000 metres, completing
the southern section of the tunnels for around 6,000 metres. Meanwhile, complex excavation and reinforced
concrete construction activities for the station continued. The excavation work to deepen the track level in
the station is currently underway and is expected to be completed by September 2026, while construction
of the base slab has commenced, and all the structural load-bearing elements of the new building are
scheduled for completion by October 2026. Meanwhile, the complex work of disposing of the excavated
volumes continued according to the procedures agreed upon with the client RFI and the designated
authorities. The Railway Link will play a key role in easing national rail traffic, which currently places a
significant burden on Florence’s railway network. It will enable high-speed trains to bypass Santa Maria
Novella station, increasing and accelerating both north-south high-speed traffic and local train services;
Verona West HS Node: design activities have been completed and work has begun, subject to delivery of
the construction areas by the client and the progressive approval of the project documents. The signing of
the agreement between RFI and Autobrennero (A22) has definitively allowed for the full commencement of
activities affecting the motorway. Construction of the new RFI office building at Verona Porta Nuova station
continued and the activities for the survey and disposal of the surface and subsurface anthropogenic waste
were initiated in the areas authorised by the provincial authorities. The project represents the completion of
the high-speed/high-capacity section with the introduction of high-speed services on a new dedicated line
to Verona Porta Nuova station, and with the new direct freight connection between the Po Valley and the
Brenner railway corridor, thus allowing trains to/from Austria/Germany to bypass the Verona hub, with
significant benefits in terms of traffic flow separation and reducing travel times;
Doubling of the Piadena-Mantova Railway Line: during the first half of 2026, design and construction
activities continued along the entire 35-kilometre line. Only a few specific sites remain on hold due to
pending approvals. In particular, earthworks are ongoing, while the installation of various steel decks for the
railway overpasses has been completed. Work is also underway on support structures and anti-derailment
walls to ensure the safety of the future railway. The Bozzolo station has been modified, allowing the opening
of the work front on the former railway yard. Special foundation works in the Oglio River continued for the
installation of the piers that will support the new viaduct, consisting of four 60-metre steel spans. This major
structure is currently being assembled. The entire project will enhance this strategically important transregional railway corridor (west-east axis), serving both commuter and freight traffic in the northern part of
Italy, while also increasing the capacity of the network serving the Milan railway hub.
/ 52
SAIPEM INTERIM CONSOLIDATED FINANCIAL REPORT AS OF JUNE 30, 2026
Saipem
at a glance
INTERIM DIRECTORS'
REPORT
Condensed interim consolidated
financial statements
ANNEXES
OFFSHORE DRILLING
General overview
As of June 30, 2026, Saipem’s Offshore Drilling fleet includes twelve vessels, divided as follows: six deep-water
units for operations at depths of up to 3,600 metres (drillships: Saipem 12000, Saipem 10000, Santorini and Deep
Value Driller; semisubmersibles: Scarabeo 8 and Scarabeo 9), five high specification jack-ups for operations at
depths of up to 400 feet (Perro Negro 7, Perro Negro 8, Perro Negro 10, Perro Negro 11 and Perro Negro 13) and
one standard jack-up for operations at depths of up to 150 feet (Perro Negro 4). Among the aforementioned
drilling rigs, the jack-ups Perro Negro 11, Perro Negro 13 and the drillship Deep Value Driller are owned by third
parties.
On June 24, Saipem announced the finalisation of an agreement for the sale to ADES of Saudi Arabian Saipem,
the Group company operating in shallow-water drilling in Saudi Arabia with the jack-ups Perro Negro 7, Perro
Negro 8, Perro Negro 11, Perro Negro 13, and Perro Negro 10, the latter of which is currently deployed in Mexico.
The agreement is expected to be executed by the third quarter of 2026.
During the first half-of the year, the Offshore Drilling fleet operated in Italy, Norway, Libya, the Eastern
Mediterranean, Egypt, West Africa (Angola, Ivory Coast, Ghana and Namibia), Mexico, Saudi Arabia and Indonesia.
With regard to the Sonsub operations, Saipem has continued to develop robotic and subsea monitoring
solutions for services supporting operations for complex subsea installations. Potential collaborations have
been explored to exploit available technologies and improve penetration in key markets.
Market conditions
The first half of the year unfolded against a macroeconomic context marked by heightened geopolitical
uncertainty, primarily driven by the outbreak of the conflict in the Middle East involving Iran, the United States
and Israel, alongside the ongoing Russia-Ukraine conflict. During the first half of 2026, the energy sector was
significantly affected by geopolitical uncertainty. In particular, within the traditional oil and gas markets, supply
concerns associated with restrictions on flows through the Strait of Hormuz contributed to elevated price
volatility, with Brent crude oil prices averaging approximately $90 per barrel during the period, above pre-conflict
expectations for 2026. This environment, largely shaped by geopolitical uncertainty, did not, however, prompt
major oil companies to increase investment levels in the global Oil&Gas market, which remained broadly in line
with those recorded in previous years. Against this backdrop, the Offshore Drilling market developed along two
distinct trends. The shallow-water segment, already affected by Aramco’s rig suspension and release
programme launched in 2024, maintained utilisation levels broadly in line with those recorded in 2025 but was
particularly exposed to the uncertainties arising from the geopolitical situation in the Middle East, its principal
market. At the same time, the deepwater segment continued to demonstrate solid medium-term fundamentals,
with utilisation rates reaching approximately 90% in the first half of 2026, an increase compared with 2025.
For Sonsub, the key short-term prospects have centred on the Defence sector, driven by the recognition of the
high potential of its Sonsub drone technology. Collaborations have continued in its core markets – Oil&Gas
(Equinor, Eni, Petrobras) and Defence (Italian Navy) – while also expanding into potential applications in Civil and
Scientific Research (ISPRA).
New contracts
For Offshore Drilling, the most significant new contracts during the first half of 2026 included:
-� for AkerBP, a 12-month extension beyond the already agreed contractual terms for operations in Norway in
2028 using the semisubmersible Scarabeo 8;
OPERATING REVIEW
53 /
Saipem
at a glance
INTERIM DIRECTORS'
REPORT
Condensed interim consolidated
financial statements
ANNEXES
-� for Petrobel, a 2-year extension with an option for an additional 12 months for the use of the jack-up Perro
Negro 4;
-� for Azule, extension of the activities related to the drillship Saipem 12000 for the drilling of two wells in Angola,
in continuity with the previously awarded contract with the same client;
-� for Eni, drilling of 4 firm wells and 2 optional wells in Mozambique starting from the second half of 2026 using
the drillship Saipem 12000;
-� for Rhino Resources, drilling of one firm well and one optional well in Namibia using the drillship Saipem 12000.
For Sonsub, the main new contracts for the first half of 2026 were:
-� for T. Mariotti of Genoa, a contract for the supply of the Hydrone-W underwater remotely operated vehicle
(ROV), for the new oceanographic research vessel Arcadia, operated by ISPRA (Italian Institute for
Environmental Protection and Research);
-� for the Italian Navy, a contract for Hydrone-L (a compact and easily transportable robotic system for
emergency interventions).
Capital expenditure
With regard to Offshore Drilling, activities were carried out during the first half of 2026 relating to class renewal
works and adaptations to specific requests of the client companies. Maintenance activities and adaptation to
the client’s technical specifications were performed in particular on the jack-up Perro Negro 8 and the drillships
Saipem 10000 and Santorini. Preparations also continued for other maintenance and adaptation activities to be
performed in the second half of this year and in the following year.
Work performed
During the first half of 2026, the Offshore Drilling fleet was used as follows:
-� ultra deep water/deep water units: Saipem 12000 completed the works for Azule in April; it was subsequently
deployed in Namibia to carry out works for Rhino, which ended in June; the drillship Saipem 10000 operated
for Eni in Libya until April; it was then sent to the shipyard for scheduled maintenance work; the drillship
Santorini carried out activities for Eni in Ghana and Ivory Coast until the end of March; it subsequently began
activities for Energean in the Eastern Mediterranean; the drillship Deep Value Driller was deployed in Indonesia
for works for Eni; the semisubmersible Scarabeo 9 completed the activities in Libya for Eni and was later moved
to West Africa in anticipation of works in the area; and the semisubmersible Scarabeo 8 continued the works
in Norway for AkerBP;
-� high specification jack-ups: the Perro Negro 7, previously suspended at the request of Saudi Aramco,
resumed operations in the Saudi Arabian offshore from mid-January; in the same area and for the same client,
the Perro Negro 13 operated continuously throughout the half-year, and the jack-ups Perro Negro 8 and Perro
Negro 11 completed the scheduled maintenance activities in March and February, respectively; while the Perro
Negro 11 was able to resume operations after its maintenance shutdown, the geopolitical situation in the Middle
East delayed the redeployment of the Perro Negro 8, which had to wait 40 days before being redeployed; and
the Perro Negro 10 continued to operate in Mexico for Eni;
-� standard jack-ups: the Perro Negro 4 continued to operate in the Red Sea for Petrobel.
As regards Sonsub, the execution of the Hydrone-D (underwater mine clearance drone) project continued with
Intermarine for the Italian Navy. The emergency pipeline repair contract also continued with the Sircos system
for Greenstream and Medgaz. The Hydrone-R drone remained operational in the Njord project, while the FlatFish
drone is scheduled to begin a deep-water offshore data acquisition campaign in Brazil for Petrobras at the end
of 2026
/ 54
SAIPEM INTERIM CONSOLIDATED FINANCIAL REPORT AS OF JUNE 30, 2026
Saipem
at a glance
INTERIM DIRECTORS'
REPORT
Condensed interim consolidated
financial statements
ANNEXES
Utilisation of vessels
The main vessel utilisation in the first half 2026 was as follows:
June 30, 2026
Vessel
(No. of days)
Semisubmersible platform Scarabeo 8
Semisubmersible platform Scarabeo 9
Drillship Saipem 10000
Drillship Saipem 12000 (1)
Drillship Santorini
Drillship Deep Value Driller () (1)
Jack-up Perro Negro 4
Jack-up Perro Negro 7 (1) (2)
Jack-up Perro Negro 8
Jack-up Perro Negro 10 (1)
Jack-up Perro Negro 11 ()
Jack-up Perro Negro 13 (*)
under contract
181
152
116
181
181
171
181
163
61
181
131
181
Idle
29
65
10
18
120
50
(1) Days on which the vessel underwent class recertification maintenance/preparation/mobilisation works.
(2) Days on which the vessel was idle.
(*) Leased vessel.
OPERATING REVIEW
55 /
Saipem
at a glance
INTERIM DIRECTORS'
REPORT
Condensed interim consolidated
financial statements
ANNEXES
FINANCIAL AND ECONOMIC
RESULTS
Operating results
The information to the market, in accordance with the requirement of IFRS 8, is presented following the reporting
segments below:
≥�Asset Based Services, which includes the Offshore Engineering & Construction and Offshore Wind
activities;
≥�Offshore Drilling, which includes Sonsub activities;
≥�Energy Carriers, which includes the Onshore Engineering & Construction, and Sustainable Infrastructures.
The sectors clustered in the reporting segments above have similar economic characteristics; moreover, the
Offshore Wind, Sustainable Infrastructures and Sonsub sectors are not, at present, so significant that they
deserve separate reporting, in accordance with IFRS 8.
As of January 1, 2026, Sonsub Robotics activities, previously included in the Asset Based Services Business
Line, were transferred to the Drilling Business Line, now now referred as Drilling and Sonsub. ROV Services
activities, on the other hand, remained in the Asset Based Services Business Line. The impact of the
reorganisation does not require the restatement of comparative periods.
Saipem Group - Income statement (*)
Year
2025
15,497
5
2025
% Ch.
7,345
7,211
1.9
6
1
(5,396)
(5,369)
Core business revenue
Other revenue and income
(11,570) Purchases, services and other costs
Net reversals of impairment losses (impairment losses)
33 on trade receivables and other assets
(2,249) Personnel expenses
1,716
First half
2026
(€ million)
6
19
(1,160)
(1,098)
Gross operating margin (EBITDA)
801
764
(561)
(459)
Operating result (EBIT)
240
305
(189) Net financial income (expense)
(66)
(94)
9
1
183
212
(87)
(72)
96
140
96
140
(1,037) Depreciation, amortisation and impairment losses
679
28
Net financial income (expense) on equity investments
518
Pre-tax profit (loss)
(207) Income taxes
311
Profit (loss) before non-controlling interests
(1) Non-controlling interests
310
Profit (loss) for the period
4.8
(21.3)
(13.7)
(31.4)
(31.4)
(*) Revenues and associated profit levels are not consistent over time, as they are influenced not only by market performance but also by climatic conditions and
individual project schedules in the Engineering & Construction sector, and by contract expiry and renegotiation timing in the Drilling sector.
Core business revenue during the first half of 2026 amounted to €7,345 million.
/ 56
SAIPEM INTERIM CONSOLIDATED FINANCIAL REPORT AS OF JUNE 30, 2026
Saipem
at a glance
INTERIM DIRECTORS'
REPORT
Condensed interim consolidated
financial statements
ANNEXES
Gross operating margin (EBITDA) was positive at €801 million. Depreciation, amortisation and impairment
losses on property, plant, equipment, intangible assets and right-of-use of leased assets totalled €561 million.
The operating result (EBIT) achieved the first half of 2026 is €240 million profit.
The main variations relating to the income statement items above are detailed below in the analysis by business
line.
The balance of net financial income (expenses) was negative by €66 million, a decrease of €28 million, due to
lower hedging costs of foreign exchange risk and, higher financial income determined by the higher level of
liquidity invested compared to the first half of 2025, only partly offset by charges for exchange differences and,
higher interests on lease liability.
The balance of net income (expenses) on equity investments was positive for €9 million, up €8 million, mainly due
to the current half year results of projects executed by companies accounted for using the equity method.
Pre-tax result amounted to a profit of €183 million. Income taxes amounted to €87 million compared to €72
million in the first half of 2025.
The net result recorded a profit of €96 million (profit of €140 million in the first half of 2025).
The operating result (EBIT) and the net result were affected by the provision for charges related to the
redundancy plan for a total of €35 million compared to the adjusted operating result (EBIT) and the adjusted net
result, respectevly.
The balance sheet items impacted by non-recurring charges in the first half of 2026 are detailed below:
(€ million)
Operating result (EBIT)
Charges for redundancies
Adjusted operating result (EBIT)
(€ million)
Net result
Charges for redundancies
Adjusted net result
First half
2026
240
35
275
First half
2025
305
305
First half
2026
96
35
131
First half
2025
140
140
Adjusted EBIT - EBIT reconciliation First half 2026
(€ million)
Adjusted operating result (EBIT)
Charges for redundancies
Total non-recurring charges
Operating result (EBIT)
FINANCIAL AND ECONOMIC RESULTS
Asset Based
Services
260
8
(8)
252
Energy
Carriers
1
23
(23)
(22)
Drilling
Offshore
14
4
(4)
10
Total
275
35
(35)
240
57 /
Saipem
at a glance
INTERIM DIRECTORS'
REPORT
Condensed interim consolidated
financial statements
ANNEXES
Adjusted operating result (EBIT) and destination of operating costs
Year
2025
(€ million)
Core business revenue
15,497
(14,321) Production costs
(150) Idle costs
First half
2026
2025
% Ch.
7,345
7,211
1.9
(6,831)
(6,658)
(53)
(75)
(118) Selling expenses
(36) Costs for research and development
(67)
(61)
(15)
(17)
Other operating income (expenses)
6
1
7
(200) General expenses
Adjusted operating result (EBIT)
679
(110)
(96)
275
305
(9.8)
In the first half of 2026, the Saipem Group achieved core business revenues of €7,345 million, an increase of
€134 million, up 1.9% compared to the first half of 2025, underscoring the strength and resilience of Saipem’s
execution capabilities.
Production costs, which include the direct projects costs, and the depreciation of the vessels and equipment
used, amounted to a total of €6,831 million, an increase of €173 million compared to the first half of 2025,
absorbing extra costs of approx. €70 million arising from logistical and operational difficulties and from enhanced
safety measures for personnel in the Middle East.
Idle costs recorded a decrease of €22 million compared to the first half of 2025, thanks to the good level of
operation of the offshore fleet. Selling expenses, amounting to €67 million, an increase of €6 million compared
to the first half of 2025, research and development expenses recognised under operating costs, amounting to
€15 million, were almost in line the first half of 2025 and general expenses, amounting to €110 million, increased
by €14 million primarily reflecting higher consultancy costs related to the Saipem-Subsea7 merger project.
Asset Based Services
Year
2025
9,044
(€ million)
Core business revenue
(7,745) Cost of sales
1,299
Adjusted gross operating margin (EBITDA)
(747) Depreciation and amortisation
552
Adjusted operating result (EBIT)
First half
2026
2025
4,299
4,083
(3,625)
(3,544)
674
539
(414)
(318)
260
221
Charges for redundancies
(8)
552
Operating result (EBIT)
252
221
Revenue amounted to €4,299 million in the first half of 2026, an increase of 5.3% compared to the first half of
2025, mainly attributable to higher volumes in the Pacific-Asia area and in the North Africa, partially offset by
lower volumes in the Rest of Europe.
The cost of sales, amounting to €3,625 million, increased by €81 million, absorbing extra costs of approx. €70
million including the extra costs related to the conflict in the Middle East.
Adjusted gross operating margin (EBITDA) for the first half of 2026 amounted to €674 million, equal to 15.7% of
revenue compared to the €539 million in the first half of 2025, equal to 13.2% of revenue.
Depreciation and amortisation amounting to €414 million, increased of €96 million compared to the first half of
2025, due to leased vessels entering operation, necessary for the execution of projects.
The adjusted operating result (EBIT) in the first half of 2026 was a profit of €260 million (€221 million in the first
half of 2025) while the operating result (EBIT) was a profit of €252 million and includes charges for redundancies
of €8 million.
/ 58
SAIPEM INTERIM CONSOLIDATED FINANCIAL REPORT AS OF JUNE 30, 2026
Saipem
at a glance
INTERIM DIRECTORS'
REPORT
Condensed interim consolidated
financial statements
ANNEXES
Energy Carriers
Year
2025
5,624
(€ million)
Core business revenue
(5,524) Cost of sales
100
Adjusted gross operating margin (EBITDA)
(84) Depreciation and amortisation
First half
2026
2025
2,674
2,667
(2,619)
(2,627)
55
40
(54)
(43)
16
Adjusted operating result (EBIT)
1
(3)
Charges for redundancies
(23)
16
Operating result (EBIT)
(22)
(3)
Revenue for the first half of 2026 amounted to €2,674 million broadly in line with the corresponding half of 2025,
the higher volumes recorded in the Pacific-Asia area and in Italy were almost entirely offset by lower volumes in
the Sub-Saharan Africa and in the Middle East.
The cost of sales, equal to €2,619 million, in line with the corresponding half of 2025.
Adjusted gross operating margin (EBITDA) for the first half of 2026 was positive for €55 million, equal to 2.1% of
revenue compared to the €40 million in 2025, equal to 1.5% of revenue.
Depreciation and amortisation were €54 million, up €11 million compared to the first half of 2025.
The adjusted operating result (EBIT) in the first half of 2026 was a profit of €1 million (loss of €3 million in the first
half of 2025) while the operating result (EBIT) was a loss of €22 million and includes charges for redundancies of
€23 million.
Offshore Drilling
Year
2024
829
(€ million)
Core business revenue
(512) Cost of sales
317
Adjusted gross operating margin (EBITDA)
(206) Depreciation and amortisation
First half
2026
372
2025
461
(265)
(276)
107
185
(93)
(98)
Adjusted operating result (EBIT)
14
87
Charges for redundancies
(4)
111
Operating result (EBIT)
10
87
111
Revenue for the first half of 2026 amounted to €372 million, in reduction of 19.3% compared to the
corresponding half of 2025. The decrease was mainly attributable to the lower contribution of the jack-up Perro
Negro 8 and Perro Negro 11 stopped for maintenance work in the current half, as well as of the jack-up Pioneer
Jindal and Perro Negro 12, which were fully operational in the corresponding half of 2025 and subsequently
returned to their respective owners. This effect was partially offset by the higher contribution of the drillship
Saipem 12000 and the jack-up Perro Negro 10, stopped for class recertification work during the first half of 2025.
Cost of sales was €265 million, recorded a decrease of €11 million compared to the first half of 2025.
The adjusted gross operating margin (EBITDA) for the first half of 2026 amounted to €107 million, equal to 28.8%
of revenue, compared to €185 million in the first half of 2025, equal to 40.1%.
Depreciation and amortisation amounted to €93 million, down of €5 million compared to the first half of 2025.
The adjusted operating result (EBIT) in the first half of 2026 was a profit of €14 million (€87 million in the first half
of 2025) while the operating result (EBIT) was a profit of €10 million and includes charges for redundancies of €4
million.
FINANCIAL AND ECONOMIC RESULTS
59 /
Saipem
at a glance
INTERIM DIRECTORS'
REPORT
Condensed interim consolidated
financial statements
Balance sheet and financial position
ANNEXES
Saipem Group - Reclassified consolidated statement of financial position (1)
The reclassified consolidated statement of financial position aggregates asset and liability amounts from the
IAS/IFRS statutory statement of financial position by function, under three basic areas: operating, investing and
financing.
The management believes that the proposed scheme provides useful information for investors because it makes
it possible to identify the sources of financial resources (own and borrowed funds) and their use in fixed assets
and working capital.
June 30, 2025
June 30, 2026
(€ million)
Property, plant and equipment
Dec. 31, 2025
2,469
2,700
641
Goodwill
641
641
27
Net intangible assets
38
38
2,786
1,036
Right-of-use of lease assets
4,490
3,015
558
917
1,068
1,213
4,216
4,592
3,052
3,245
452
479
712
868
(39) Equity investments
(23)
(25)
Non-current assets
4,193
4,567
4,451
(1,057)
(667)
(648) Provisions for risks and charges
(795) Working capital
(684)
(795)
(1,443) Net current assets
(195) Provision for employee benefits
(1,741)
(1,462)
(222)
(195)
192
Net assets (liabilities) held for sale
2,813
Net capital employed
2,422
2,910
2,608
Equity
2,312
2,637
1
1
Non-controlling interests
(854) Net financial debt (cash) pre-IFRS 16 lease liabilities
1,059 Lease liabilities
205
Net financial debt (cash)
Funding
Leverage pre-IFRS 16 (net borrowing/equity
(0.33) + third-party equity)
Leverage post-IFRS 16 (net borrowing/equity
0.08 + third-party equity)
2,813
1,995,631,862
Number of shares issued and outstanding
(1,078)
(999)
1,187
1,271
109
272
2,422
2,910
(0.47)
(0.38)
0.05
0.10
1,995,631,862
1,995,631,862
(1) For reconciliation with IAS/IFRS templates see “Reconciliation of reclassified balance sheets used in the Directors’ report with the IAS/IFRS financial statements” on
page 125.
Management uses the reclassified statement of financial position to calculate key ratios such as the Return On
Average Capital Employed (ROACE) and leverage used to indicate the robustness of the group’s capital
structure.
Non-current assets as of June 30, 2026, stood at €4,193 million, decreased by €374 million compared to
December 31, 2025. The decrease is due to depreciation and amortisation of €561 million, dividends on equity
investments of €21 million, as well as divestments and write-offs for €28 million, partly offset by, the positive
effect of the increase in the right-of-use of lease assets for €222 million, capital expenditure in property, plant
/ 60
SAIPEM INTERIM CONSOLIDATED FINANCIAL REPORT AS OF JUNE 30, 2026
Saipem
at a glance
INTERIM DIRECTORS'
REPORT
Condensed interim consolidated
financial statements
ANNEXES
and equipment, intangible assets and equity investments for €148 million, the positive change in equity
investments of €9 million, as well the net positive effect deriving mainly from the translation of financial
statements denominated in foreign currencies and other changes of €33 million. The change is also due to the
recognition of assets (liabilities) held for sale of fixed assets for €176 million following the agreement to sell
shallow water drilling activities.
Net current assets decreased by €279 million, going from a negative balance of €1,462 million as of December
31, 2025, to a negative balance of €1,741 million as of June 30, 2026. The variation is mainly attributable to the
decrease in net working capital of €390 million and in provisions for risks and charges of €111 million.
Provisions for employee benefits amounted to €222 million, up by €27 million compared to December 31,
2025. The increase is mainly related to the provisions for the period of charges for redundancies.
As of June 30, 2026, the net assets (liabilities) held for sale amounted to €192 million and mainly included fixed
capital, net working capital and employee benefits provision for shallow water drilling activities being divested.
As a result of the above analysis, the net capital employed decreased by €488 million, standing at €2,422 million
as of June 30, 2026, compared to €2,910 million as of December 31, 2025.
Equity amounts to €2,312 million as of June 30, 2026, a decrease of €325 million compared to December 31,
2025. The change is mainly attributable to the negative effect of the change in the fair value measurement of
derivative instruments hedging exchange rate and commodity risk for €93 million, the distribution of dividends
for €330 million, the positive effect of net income for the period of €96 million and the positive effect on
shareholders' equity deriving from the translation of financial statements denominated in foreign currencies and
other changes of €2 million.
Non-controlling interests amounted to €1 million as of June 30, 2026.
The pre-IFRS 16 net financial position as of June 30, 2026 was a positive €1,078 million. The net financial
position including the IFRS 16 lease liability of €1,187 million was negative €109 million.
As of June 30, 2026, gross debt pre-IFRS 16 lease liability effects amounted to €1,792 million, liquidity to €2,870
million of which €1,291 million is available cash.
Analyses of net financial debt (cash)
June 30, 2025
(€ million)
June 30, 2026 Dec. 31, 2025
Non-current financial assets
(1)
15
Non-current bank loans and borrowings
1,674
Non-current bonds and other financial liabilities
1,448
1,440
1,689
Net medium/long-term financial debt
1,448
1,439
(1,866)
(1,707)
(23)
(41)
(448)
(603)
(533)
(429)
60
53
(1,716) Cash and cash equivalents
(46) Financial assets measured at fair value through profit or loss
(522) Financial assets measured at fair value through OCI
(322) Other current financial assets
43
Current bank loans and borrowings
20
Current bonds and other financial liabilities
284
289
(2,543) Net short-term debt (liquid funds)
(2,526)
(2,438)
(854) Net financial debt pre-IFRS 16
(1,078)
(999)
498
Net current lease liabilities
674
649
561
Net non-current lease liabilities
513
622
205
Net financial debt
109
272
Cash and cash equivalents include: (i) cash and cash equivalents of €642 million in current accounts of projects
executed in partnership or joint venture; (ii) cash and cash equivalents of €311 million in current accounts
denominated in currencies subject to movement and/or convertibility restrictions; (iii) cash and cash equivalents
amounting to €1 million in current accounts frozen or subject to restrictions for a total of €954 million.
For information on net financial debt as required by Consob, Communication No. 5/21 of April 29, 2021, see Note
25 “Analyses of net financial debt”.
FINANCIAL AND ECONOMIC RESULTS
61 /
Saipem
at a glance
INTERIM DIRECTORS'
REPORT
Condensed interim consolidated
financial statements
ANNEXES
Statement of comprehensive income
First half
2026
(€ million)
Profit (loss) for the period
2025
96
140
- re-measurement of defined benefit plans for employees
1
3
-
change in fair value of equity investments measured at fair value through OCI
-
share of other comprehensive income (loss) of equity-accounted investments
relating to re-measurement of defined benefit plans
-
income tax relating to items that will not be reclassified
(1)
(100)
344
(1)
1
(13)
(19)
Other items of comprehensive income (loss)
Items that will not be reclassified subsequently to profit or loss:
Items that may be reclassified subsequently to profit or loss:
- change in the fair value of cash flow hedges
- change in the fair value of financial assets, other than equity investments,
measured at fair value through OCI
- exchange differences arising from the translation into euro of financial statements
in currencies other than the euro
- share of other comprehensive income (loss) of equity-accounted investments
- income tax relating to items that may be reclassified
16
(58)
Other items of comprehensive income (loss)
(97)
270
Comprehensive income (loss) for the period
(1)
410
(1)
410
Attributable to:
Equity including non-controlling interests
(€ million)
Equity including non-controlling interest as of January 1, 2026
Comprehensive result for the period
Dividends distributed to Saipem shareholders
2,638
(1)
(330)
Dividends distributed by other subsidiaries
Sale (purchase) of treasury shares
Variation of non-controlling interests
Share capital increase net of charges
Recognition of fair value of incentive plans
6
Other changes
Total changes
(325)
Equity including non-controlling interest as of Juner 30, 2026
2,313
Attributable to:
- Saipem Group
- non-controlling interests
/ 62
2,312
1
SAIPEM INTERIM CONSOLIDATED FINANCIAL REPORT AS OF JUNE 30, 2026
Saipem
at a glance
INTERIM DIRECTORS'
REPORT
Condensed interim consolidated
financial statements
Reclassified statement of cash flows (1)
ANNEXES
Saipem’s reclassified statement of cash flows derives from the statutory statement of cash flows. It enables
investors to understand the link existing between changes in cash and cash equivalents (deriving from the
statutory statement of cash flows) and in net financial debt (deriving from the reclassified statement of cash
flows) that occurred between the beginning and the end of the period. The measure enabling such a link is
represented by the free cash flows, i.e. the surplus or cash deficit remaining after the financing of investments.
The free cash flow closes alternatively on: (i) changes in cash and cash equivalents for the period by
adding/deducting cash flows relating to financial liabilities/assets (issuance/repayment of loan assets/financial
liabilities), to repayments for lease liabilities, equity (dividends paid, net repurchase of treasury shares, capital
issuance) and the effect of changes in the consolidation scope and of exchange differences on cash and cash
equivalents, or (ii) changes in net financial debt for the period by adding/deducting cash flows relating to equity,
and the effect of repayments of lease liabilities and of changes in the consolidation scope and of exchange
differences on net financial debt.
FINANCIAL AND ECONOMIC RESULTS
63 /
Saipem
at a glance
INTERIM DIRECTORS'
REPORT
Year
2025
310
1
Condensed interim consolidated
financial statements
ANNEXES
First half
2026
2025
(€ million)
Group’s profit (loss) for the period
96
140
Result of the period of other shareholders
563
459
adjustment:
1,065
Depreciation, amortisation and other non-monetary items
(17) Net (gains) losses on disposals of assets
(12)
Dividends, interest and income taxes
128
121
Cash flows generated by operating activities before changes in working capital
787
708
301
1,660
129
Changes in working capital related to operations
(285) Dividends received, income taxes paid, interest paid and received
1,504
Net cash flows from operating activities
210
294
(156)
(160)
841
842
(364) Capital expenditure
(133)
(187)
(18) Investments in equity, consolidated subsidiaries and business units
(15)
(4)
115
119
1,241
Disposals and partial sales of consolidated equity, business units and property,
plant and equipment
Other changes related to financing activities
Free cash flows
693
766
(377) Net change in receivables and securities held for non-operating purposes
69
(182)
(397) Changes in short and long-term loans and borrowings
9
(428)
(305)
(167)
(449) Repayments of lease liabilities
(40) Sale (purchase) of treasury shares
(333) Dividend distribution
Sale (purchase) of interests in consolidated companies
(13) Net change in convertible bonds
(83) Changes in consolidation and exchange differences on cash and cash equivalents
(451)
NET CASH FLOWS FOR THE PERIOD
1,241
Free cash flows
(330)
(331)
(7)
(7)
30
(93)
159
(442)
693
766
(449) Repayments of lease liabilities
(40) Sale (purchase) of treasury shares
(305)
(167)
(333) Dividend distribution
(13) Net change in convertible bonds
(330)
(331)
(90) Exchange differences on net financial debt and other changes
316
CHANGE IN NET FINANCIAL DEBT PRE-LEASE LIABILITIES
(1,133) Financing/closing for the period
(7)
(7)
28
(90)
79
171
(199)
(640)
449
Repayments of lease liabilities
305
167
73
Exchange differences and other variations
(22)
74
84
(399)
163
(228)
(611) Change in lease liabilities
(295)
CHANGE IN NET FINANCIAL DEBT
(1) For reconciliation with mandatory templates see “Reconciliation of reclassified balance sheets used in the Directors’ report with the IAS/IFRS financial statements”
on page 125.
Cash flows generated by operating activities before changes in working capital, positive for €787 million,
results from:
•�
the net profit for the period amounting to €96 million;
•�
depreciation, amortisation and impairment of tangible and intangible assets and right-of-use of leased
assets for €561 million, the valuation of equity investments using the equity method amounting to €9 million,
/ 64
SAIPEM INTERIM CONSOLIDATED FINANCIAL REPORT AS OF JUNE 30, 2026
Saipem
at a glance
INTERIM DIRECTORS'
REPORT
Condensed interim consolidated
financial statements
ANNEXES
the negative change in provisions for employee benefits amounting to €34 million and exchange rate
differences and other negative changes for a total of €23 million;
•�
net financial expense of €41 million and income taxes of €87 million.
The positive change in working capital related to operations, for €210 million, was due to the dynamics of cash
flows of projects underway.
Dividends received, income taxes paid, interest paid and received during the first half of 2026 were negative for
€156 million mainly relates to income taxes paid to income taxes paid net of reimbursed tax credits and to
interest paid.
The net cash flows from operating activities positive for €841 million, net of the negative cash flow from capital
expenditure and investments in equity, of €148 million generated a positive free cash flows of €693 million.
Repayments of lease liabilities generated a negative effect of €305 million. Exchange differences and other
changes on net financial debt, including negative net change in convertible bonds, produced a positive effect of
€21 million.
Therefore, considering the change deriving from the impact of dividend payments of €330 million, there was a
decrease in net debt pre-lease liabilities of €79 million.
The lease liabilities generated an overall positive effect of €84 million, due to the repayments of lease liabilities
for €305 million, to the net negative effect of new financing and contract closure and write-off during the period
for €199 million and other negative changes for a total of €22 million. The change in net financial debt
decreased by €163 million.
Key profit and financial indicators
Return On Average Capital Employed (ROACE)
Return On Average Capital Employed is calculated as the ratio between adjusted profit (loss) for the period
before non-controlling interest, less net financial expense after deducting the related tax effect and net average
capital employed. The tax rate applied to financial expense is 24%, as per the applicable tax legislation.
Return On Average Operating Capital (ROACE)
To calculate the Return On Average Operating Capital, the average capital employed is netted of capital
expenditure in progress that did not contribute to profit for the period.
There were no significant investments in progress in the two years compared.
Dec. 31, 2025 June 30, 2026 June 30, 2025
Profit (loss) for the period
(€ million)
311
267
328
Exclusion of net financial expense (net of tax effects)
(€ million)
189
161
106
Unlevered profit (loss) for the period
(€ million)
455
389
409
Capital employed, net:
- at the beginning of the period
(€ million)
2,501
2,813
2,567
(€ million)
2,910
2,422
2,813
Average capital employed, net
(€ million)
2,706
2,618
2,690
ROACE
(%)
16.81
14.86
15.20
ROACE operative
(%)
16.81
14.86
15.20
Net financial debt and leverage
Saipem management uses leverage ratios to assess the soundness and efficiency of the Group’s capital
structure in terms of an optimal mix between net borrowings and equity, and to carry out benchmark analyses
FINANCIAL AND ECONOMIC RESULTS
65 /
Saipem
at a glance
INTERIM DIRECTORS'
REPORT
Condensed interim consolidated
financial statements
ANNEXES
with the peers of the reference industry. Leverage is a measure of a company’s level of indebtedness, calculated
as the ratio between net financial debt and equity, including non-controlling interests.
Leverage pre-IFRS 16
Leverage post-IFRS 16
June 30, 2026
Dec. 31, 2025
(0.47)
0.05
(0.38)
0.10
Non-GAAP measures
This section provides the alternative performance indicators that, although not required by IFRS (non-GAAP
measures), are used in the “Interim Directors’ Report”.
Such indicators are disclosed to enhance the user’s understanding of the Group’s performance and are not
intended to be considered as a substitute for IFRS measures.
Specifically, the non-GAAP measures used in the Interim Directors’ Report are as follows:
•�
EBIT (Earnings Before Interest and Taxes): is an alternative widely used performance indicator for cash flow
calculations of a company and represents the operating result before financial expense and taxes;
•�
EBITDA (“Earnings Before Interest, Taxes, Depreciation & Amortisation”): is an alternative performance
indicator relating to operating performance, calculated by adding depreciation and amortisation to
operating result;
•�
Adjusted EBIT (Earnings Before Interest and Taxes) or earnings before financial income (expense): this is an
alternative performance indicator widely used in the calculation of cash flows for company and represents
the operating result before financial expenses and taxes net of special items;
•�
Adjusted EBITDA (Earnings Before Interests, Taxes, Depreciation & Amortisation) or adjusted gross
operating margin: is an alternative performance indicator related to operating performance, calculated by
adding depreciation and amortisation net of special items to the operating result;
•�
Free cash flow: is an indicator given by the cash flow deriving from the operating activities net the cash flow
deriving from the investments and disinvestments instrumental to operating activities;
•�
capital expenditure: this indicator is calculated by excluding equity investments from total investments;
•�
gross operating margin: a useful measure for evaluating the operating performance of the Group as a whole
and of the individual business segments, in addition to operating result. The gross operating margin is an
intermediate measure, which is calculated by adding depreciation and amortisation to operating result;
•�
non-current assets: the sum of net property, plant and equipment, net right-of-use leased assets, net
intangible assets and equity investments;
•�
net current assets: includes working capital and provisions for risks and charges;
•�
net invested capital: this is the sum of non-current assets, net current assets and the provision for employee
benefits;
•�
funding: this is the sum of equity, non-controlling interests and net debt;
•�
special items: they represent: (i) not-recurring events or transactions; (ii) events or transactions that are not
representative of normal business activities;
•�
net financial debt: this is calculated as financial debt less cash and cash equivalents, securities and other
financial assets not used in operating activities;
•�
new contracts: represents new project awards plus variation orders on existing projects;
•�
backlog: represents the expected future revenues from the awarded projects. The backlog, including
non-consolidated companies, is shown separately.
/ 66
SAIPEM INTERIM CONSOLIDATED FINANCIAL REPORT AS OF JUNE 30, 2026
Saipem
at a glance
INTERIM DIRECTORS'
REPORT
Condensed interim consolidated
financial statements
ANNEXES
OUR SUSTAINABLE business
Context
The complexity and challenges of the global system of energy generation, distribution and use, along with the
major impacts caused by climate change, have led to a scenario in which energy transition infrastructures and
plants are a decisive factor for ensuring a future of sustainable development for the world population. In this
context, Saipem reaffirms its ambition to be one of the leading players and enablers of energy transition and
ultimately of sustainable solutions for energy production.
Through its own assets, people, skills and technologies, the Company is indeed contributing to the
decarbonisation of the value chain in the energy sector, providing its clients with innovative design, engineering,
and technological solutions, proposing itself as a strategic partner for the achievement of Net Zero goals,
actively and responsibly involving the supply chain in this process.
Saipem’s industrial outlook and commitment to the energy transition therefore defines its path towards business
sustainability, guided by a medium-long term vision which, taking into account the economic, environmental and
social impacts of the business and the expectations of its stakeholders, translates into the integration of
sustainability topics into its strategies, processes, governance and in the relationships and communication with
the stakeholders in order to create shared value and greater opportunities for competitive advantage.
In this context, through its “Our Sustainable Business” Policy, Saipem defines the principles and pillars that
contribute to the sustainable success of its business. These principles serve as a guide for identifying actions
and initiatives aligned with the pursuit of the Sustainable Development Goals (SDGs).
In order to make these commitments a reality, the Company annually updates its Sustainability Plan, which is the
reference framework concerning material and prioritised sustainability topics and represents a tool for
implementing an integrated strategy combining business and financial targets with ESG (Environmental, Social,
and Governance) criteria, to create short- and long-term value for stakeholders.
Disclosure and stakeholder engagement
Saipem communicates its sustainability strategy, action lines and the objectives of the Sustainability Plan –
aligned with the Strategic Plan – to its stakeholders, and periodically reports on its performance, adopting, also
for 2025, a structured approach based on a dual level of reporting, designed to meet both regulatory
requirements and the specific information needs of a broad and diverse range of stakeholders.
On March 10, 2026, Saipem’s Board of Directors approved the “2025 Consolidated Sustainability Statement”
(the “Statement”), included in the 2025 Directors’ Report and prepared in accordance with Legislative Decree
No. 125/2024 on sustainability reporting, which transposes Directive (EU) 2022/2464 (Corporate Sustainability
Reporting Directive - CSRD) into Italian law. This document provides information on the management
performance related to sustainability aspects, describing the Group’s policies, actions and main results with
respect to impacts, risks and opportunities identified as relevant during the year, in terms of indicators and trend
analyses.
Prepared in line with the requirements of the European Sustainability Reporting Standards (ESRS), the document
is structured into specific sections: 1) general information (e.g. business strategy, governance and management
of sustainability-related impacts, risks and opportunities); 2) environmental information (including disclosures
pursuant to Article 8 of the Taxonomy Regulation, climate change, water and marine resources, biodiversity and
ecosystems, resource use and circular economy); 3) social information (own workforce, workers in the value
chain, affected communities); 4) governance information (business conduct); 5) entity-specific additional
information (cybersecurity); and 6) supplementary disclosure requirements (tax transparency). The document
ensures a high level of transparency, comparability and reliability of information through structured,
standardised content subject to rigorous control processes.
OUR SUSTAINABLE BUSINESS
67 /
Saipem
at a glance
INTERIM DIRECTORS'
REPORT
Condensed interim consolidated
financial statements
ANNEXES
The Statement is based on the results of the annual Double Materiality Assessment (DMA), which identifies
sustainability topics considered material and priority for the business, both from the perspective of impacts
generated externally on the environment and society and from a financial perspective, in terms of their ability to
affect value creation and business outlook.
The analysis, including its process and outcomes as summarised in the 2025 Statement, pinpointed the following
priority topics:
•�
environmental, such as climate change, biodiversity, water resources and circular economy;
•�
social, including the focus on Saipem people and workers along the value chain (e.g. health and safety
promotion, skills development, protection of human and labour rights, promotion of diversity, equity and
inclusion), as well as contributions to the social and economic development of local communities where the
Company operates;
•�
governance, such as business ethics and cybersecurity.
The relevance of the identified material topics is supported by a consolidated engagement process involving
internal stakeholders identified among the corporate functions responsible for the analysed sustainability
topics. In their assessments, internal stakeholders also considered inputs and views from external stakeholders
with whom they regularly interact.
The DMA process and its results were shared with some of the Group’s main subsidiaries and with workers’ trade
union representatives in order to validate the representativeness, consistency and completeness of the
outcomes.
Likewise, in continuity with its voluntary reporting practice started in 2006, Saipem complemented its mandatory
disclosures with the 2025 Sustainability Report, entitled “Delivering for Today. Building for Tomorrow”, a
voluntary supplementary document.
The document is designed to provide a more accessible and strategic form of communication, enhancing a less
technical narrative and offering an integrated view of the Company’s ESG commitment by showcasing projects,
initiatives and people’s experiences.
Together these documents effectively reflect the complexity of Saipem’s business and provide deeper insight
into stakeholder-relevant topics beyond regulatory requirements.
In the first half of 2026, the Company also published the Group document “Saipem Human Rights and Modern
Slavery Statement 2025”, in compliance with the UK Modern Slavery Act, the Australian Modern Slavery Act and
the Norwegian Transparency Act, following the favourable preliminary opinion expressed by the Sustainability,
Scenarios and Governance Committee on June 17, 2026, and the approval by the Board of Directors on June
24, 2026.
All the above documents are available in the “Sustainability” section of the Company’s website,
www.saipem.com.
This communication model is part of a broader structured and continuous stakeholder engagement approach.
During 2026, Saipem intends to continue its participation in consultation forums promoted by public bodies and
business associations, also contributing to the ESG debate within various managerial and professional
communities (such as the ESG Community of Cassa Depositi e Prestiti, Borsa Italiana, the International
Association of Oil&Gas Producers (IOGP), Assonime, the UN Global Compact Network Italy, and the Italian
professional association Sustainability Makers), including through its participation and contributions at events
such as the “Il Salone della CSR e dell’Innovazione Sociale” in Milan (Italy).
Among its key stakeholders, Saipem has continued to engage and involve its vendors in the process of joining
the open digital platform “Open-es”, a system initiative promoted by Eni to support the monitoring of
sustainability performance across the supply chain, foster a culture of sustainability and strengthen ESG
requirements in vendor evaluation.
With regard to financial stakeholders, Saipem maintains an ongoing dialogue thus ensuring maximum
transparency and equal access to information. Continuous engagement with these stakeholders and the
completeness of disclosures ensure an accurate representation of strategies and business plans to manage
ESG risks and seize opportunities arising from evolving scenarios and markets. This approach distinguishes
Saipem as among the leaders in its sector on ESG topics.
/ 68
SAIPEM INTERIM CONSOLIDATED FINANCIAL REPORT AS OF JUNE 30, 2026
Saipem
at a glance
INTERIM DIRECTORS'
REPORT
Condensed interim consolidated
financial statements
ANNEXES