Il Consiglio di Amministrazione approva i risultati al 30 settembre 2026
Bull 3
Bear 0
Results
|
Italmobiliare is an Italian investment holding company founded in 1946 and listed on the Milan Stock Exchange in 1980. Controlled by Efiparind and the Pesenti family, the company manages a diversified portfolio of investments and participations with a medium-to-long-term strategic vision. Its business segments include portfolio companies, which are controlled or associated entities where Italmobiliare participates in governance and strategic decisions, and participations in listed and unlisted companies across various sectors. The company also allocates liquidity and financial assets in conservative instruments to maintain a cash reserve for new investment opportunities. Italmobiliare invests in private capital funds to capture development opportunities in geographic areas or business sectors not directly covered by its core portfolio. Notable entities associated with the group include Caffè Borbone, Officina Profumo-Farmaceutica di Santa Maria Novella, and Tecnica Group, while the company has recently agreed to sell its stake in Capitelli to CA Animation. The group supports innovation and social impact through the Fondazione Pesenti. Summarised from the company's own disclosures, fiscal year ended Oct 2026 |
Industry Financial Conglomerates | Homepage italmobiliare.it |
| Sector Financial Services | IR page italmobiliare.it/it | |
|
Tags
investment holding, private capital, portfolio management, corporate governance, strategic investments, Efiparind, Caffè Borbone, Officina Profumo-Farmaceutica di Santa Maria Novella, Tecnica Group, Capitelli, CA Animation, Fondazione Pesenti
|
Press page italmobiliare.it/it/archivio/comunicati-stampa |
Metrics
| Valuation | |
|---|---|
| Market cap | — |
| Market cap (USD) | — |
| P/E | — |
| PEG | — |
| P/BV | — |
| P/S | — |
| P/OCF | — |
| P/FCF | — |
| Dividend yield | — |
| Turnover / mcap | — |
| Returns | |
|---|---|
| ROE | 4.0% |
| ROI | 3.9% |
| ROIC | 4.3% |
| Profit margin | 8.6% |
| Growth | |
|---|---|
| Revenue growing | Yes |
| Profits growing | No |
| Revenue up 3y | Yes |
| Revenue up 5y | No |
| Earnings growth 3y (net profit CAGR) | 38.3% |
| Quality | |
|---|---|
| Profitable | Yes |
| Margin expanding | No |
| Buying back stock | No |
| Diluting (TTM) | No |
| Debt/Equity | — |
| Podcast bulls (TTM) | Sign up |
| Podcast bears (TTM) | Sign up |
| Podcast sentiment (TTM) | Sign up |
| Podcast sentiment % (TTM) | Sign up |
| News sentiment (TTM) | 45 |
| Quality score | 14.3% |
| Insiders | |
|---|---|
| Buys, 1w | Sign up |
| Buys, 1m | Sign up |
| Buys, 1y | Sign up |
| Sells, 1w | Sign up |
| Sells, 1m | Sign up |
| Sells, 1y | Sign up |
Sign up to see this company's insider trades
Filed figures
Lines the statements and their notes report beside the headline figures, read from the filings' XBRL as filed (no restatement applied), with figures computed from one filing's own lines. Cash-flow lines carry their cash direction: an outflow is negative. Each period links to its filing; a figure's period, report date and tag are in its tooltip.
| Figure | Dec 2019 | Dec 2020 | Dec 2021 | Dec 2022 | Dec 2023 | Dec 2024 | Dec 2025 |
|---|---|---|---|---|---|---|---|
| Balance sheet detail | |||||||
| Trade receivables (EUR) | — | 76.9M | 130M | 206M | 257M | 341M | 428M |
| ↳ YoY growth | +68.9% | +58.3% | +24.8% | +32.8% | +25.7% | ||
| ↳ 5y CAGR | +41.0% | ||||||
| Cash and deposits (EUR) | 248M | 123M | 135M | 102M | 122M | 138M | 144M |
| Intangible assets (EUR) | — | 303M | 308M | 306M | 329M | 328M | 328M |
| Cash flow detail | |||||||
| Operating cash flow (EUR) | — | 88.8M | 72M | -78M | 71.5M | 18.2M | 19.4M |
| Purchases of property, plant and equipment (EUR) | — | -28.8M | -36.4M | -34.9M | -66.3M | -62M | -69.2M |
| Purchases of intangible assets (EUR) | — | -684,000 | -6.25M | -8.48M | -9.57M | -9.34M | -12.4M |
| Change in receivables (cash effect) (EUR) | — | -3.4M | -66.6M | -77.5M | -49.2M | -54.4M | -77.2M |
| Change in inventories (cash effect) (EUR) | — | -912,000 | -8.81M | -16.7M | 9.03M | -67.1M | -1.63M |
| Change in payables (cash effect) (EUR) | — | 5.72M | 7.9M | 21M | 3.67M | 32.3M | 17.5M |
| Dividends paid (cash effect) (EUR) | — | -84M | -39.9M | -80.2M | -41.9M | -147M | -47.3M |
| Share buybacks (cash effect) (EUR) | — | — | — | — | — | — | -6.07M |
| Interest paid (cash effect) (EUR) | — | -54,000 | -519,000 | -3.74M | -4.9M | -1.67M | -3.47M |
| Income taxes paid (cash effect) (EUR) | — | -19.6M | -29.4M | -74.7M | -7.62M | -36.8M | -19.9M |
| Operating cash flow before change in receivables (EUR) | — | 92.2M | 139M | -472,000 | 121M | 72.6M | 96.7M |
| Free cash flow (OCF - PPE - intangibles) (EUR) | — | 59.3M | 29.3M | -121M | -4.38M | -53.1M | -62.2M |
| Income detail | |||||||
| Total comprehensive income (EUR) | — | 74.8M | 188M | 40.5M | 111M | 124M | 93.7M |
| Comprehensive income to owners (EUR) | — | 39.5M | 160M | 23.8M | 91.8M | 108M | 82.1M |
| Reported | May 30, 2023 | May 30, 2023 | May 30, 2023 | May 30, 2023 | Apr 2, 2024 | Apr 15, 2025 | Apr 7, 2026 |
Sign up to see institutional holdings
Sign UpPodcast Mentions
Sign up to see podcast mentions and sentiment
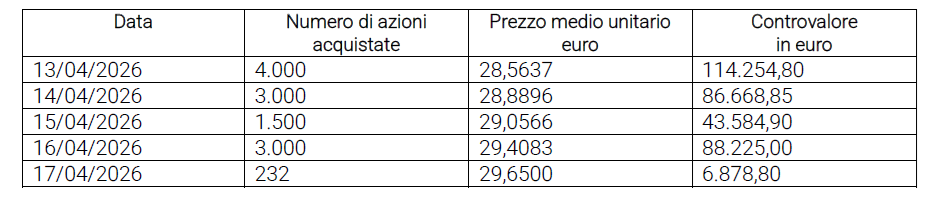
Sign UpRegulated releases stored at eMarket Storage and 1INFO, newest first, titles as filed, own-share transactions, internal dealing, holdings and voting-rights notices included. The link opens the filed PDF. Press releases from the company's own website, newest first.








Prompts
Click prompts to add them under the company line, click again to take one out, then copy the result into your AI chat. Shared by Asian Century Stocks and Uncovered Thai Stocks. Thank you.
Italmobiliare S.p.A. (ticker ITM), listed in Italy.
Copied
ETFs Holding Italmobiliare S.p.A.
Exchange-traded funds whose newest published daily portfolio holds one of the company's listings, largest weight first.
| ETF | Weight in ETF | Shares | Market value | As of |
|---|---|---|---|---|
| DFIS | 0.01% | 22,546 | $ 663.683K | Nov 12, 2026 |
| DXIV | 0.01% | 666 | $ 19.605K | Nov 12, 2026 |
| DFIC | 0.00% | 15,292 | $ 450.148K | Nov 12, 2026 |
| DFSI | 0.00% | 1,168 | $ 34.382K | Nov 12, 2026 |
| DFAI | 0.00% | 12,558 | $ 369.668K | Nov 12, 2026 |
| DFAX | 0.00% | 8,242 | $ 242.618K | Nov 12, 2026 |
| DISV | 0.00% | 1,876 | $ 55.223K | Nov 12, 2026 |