|
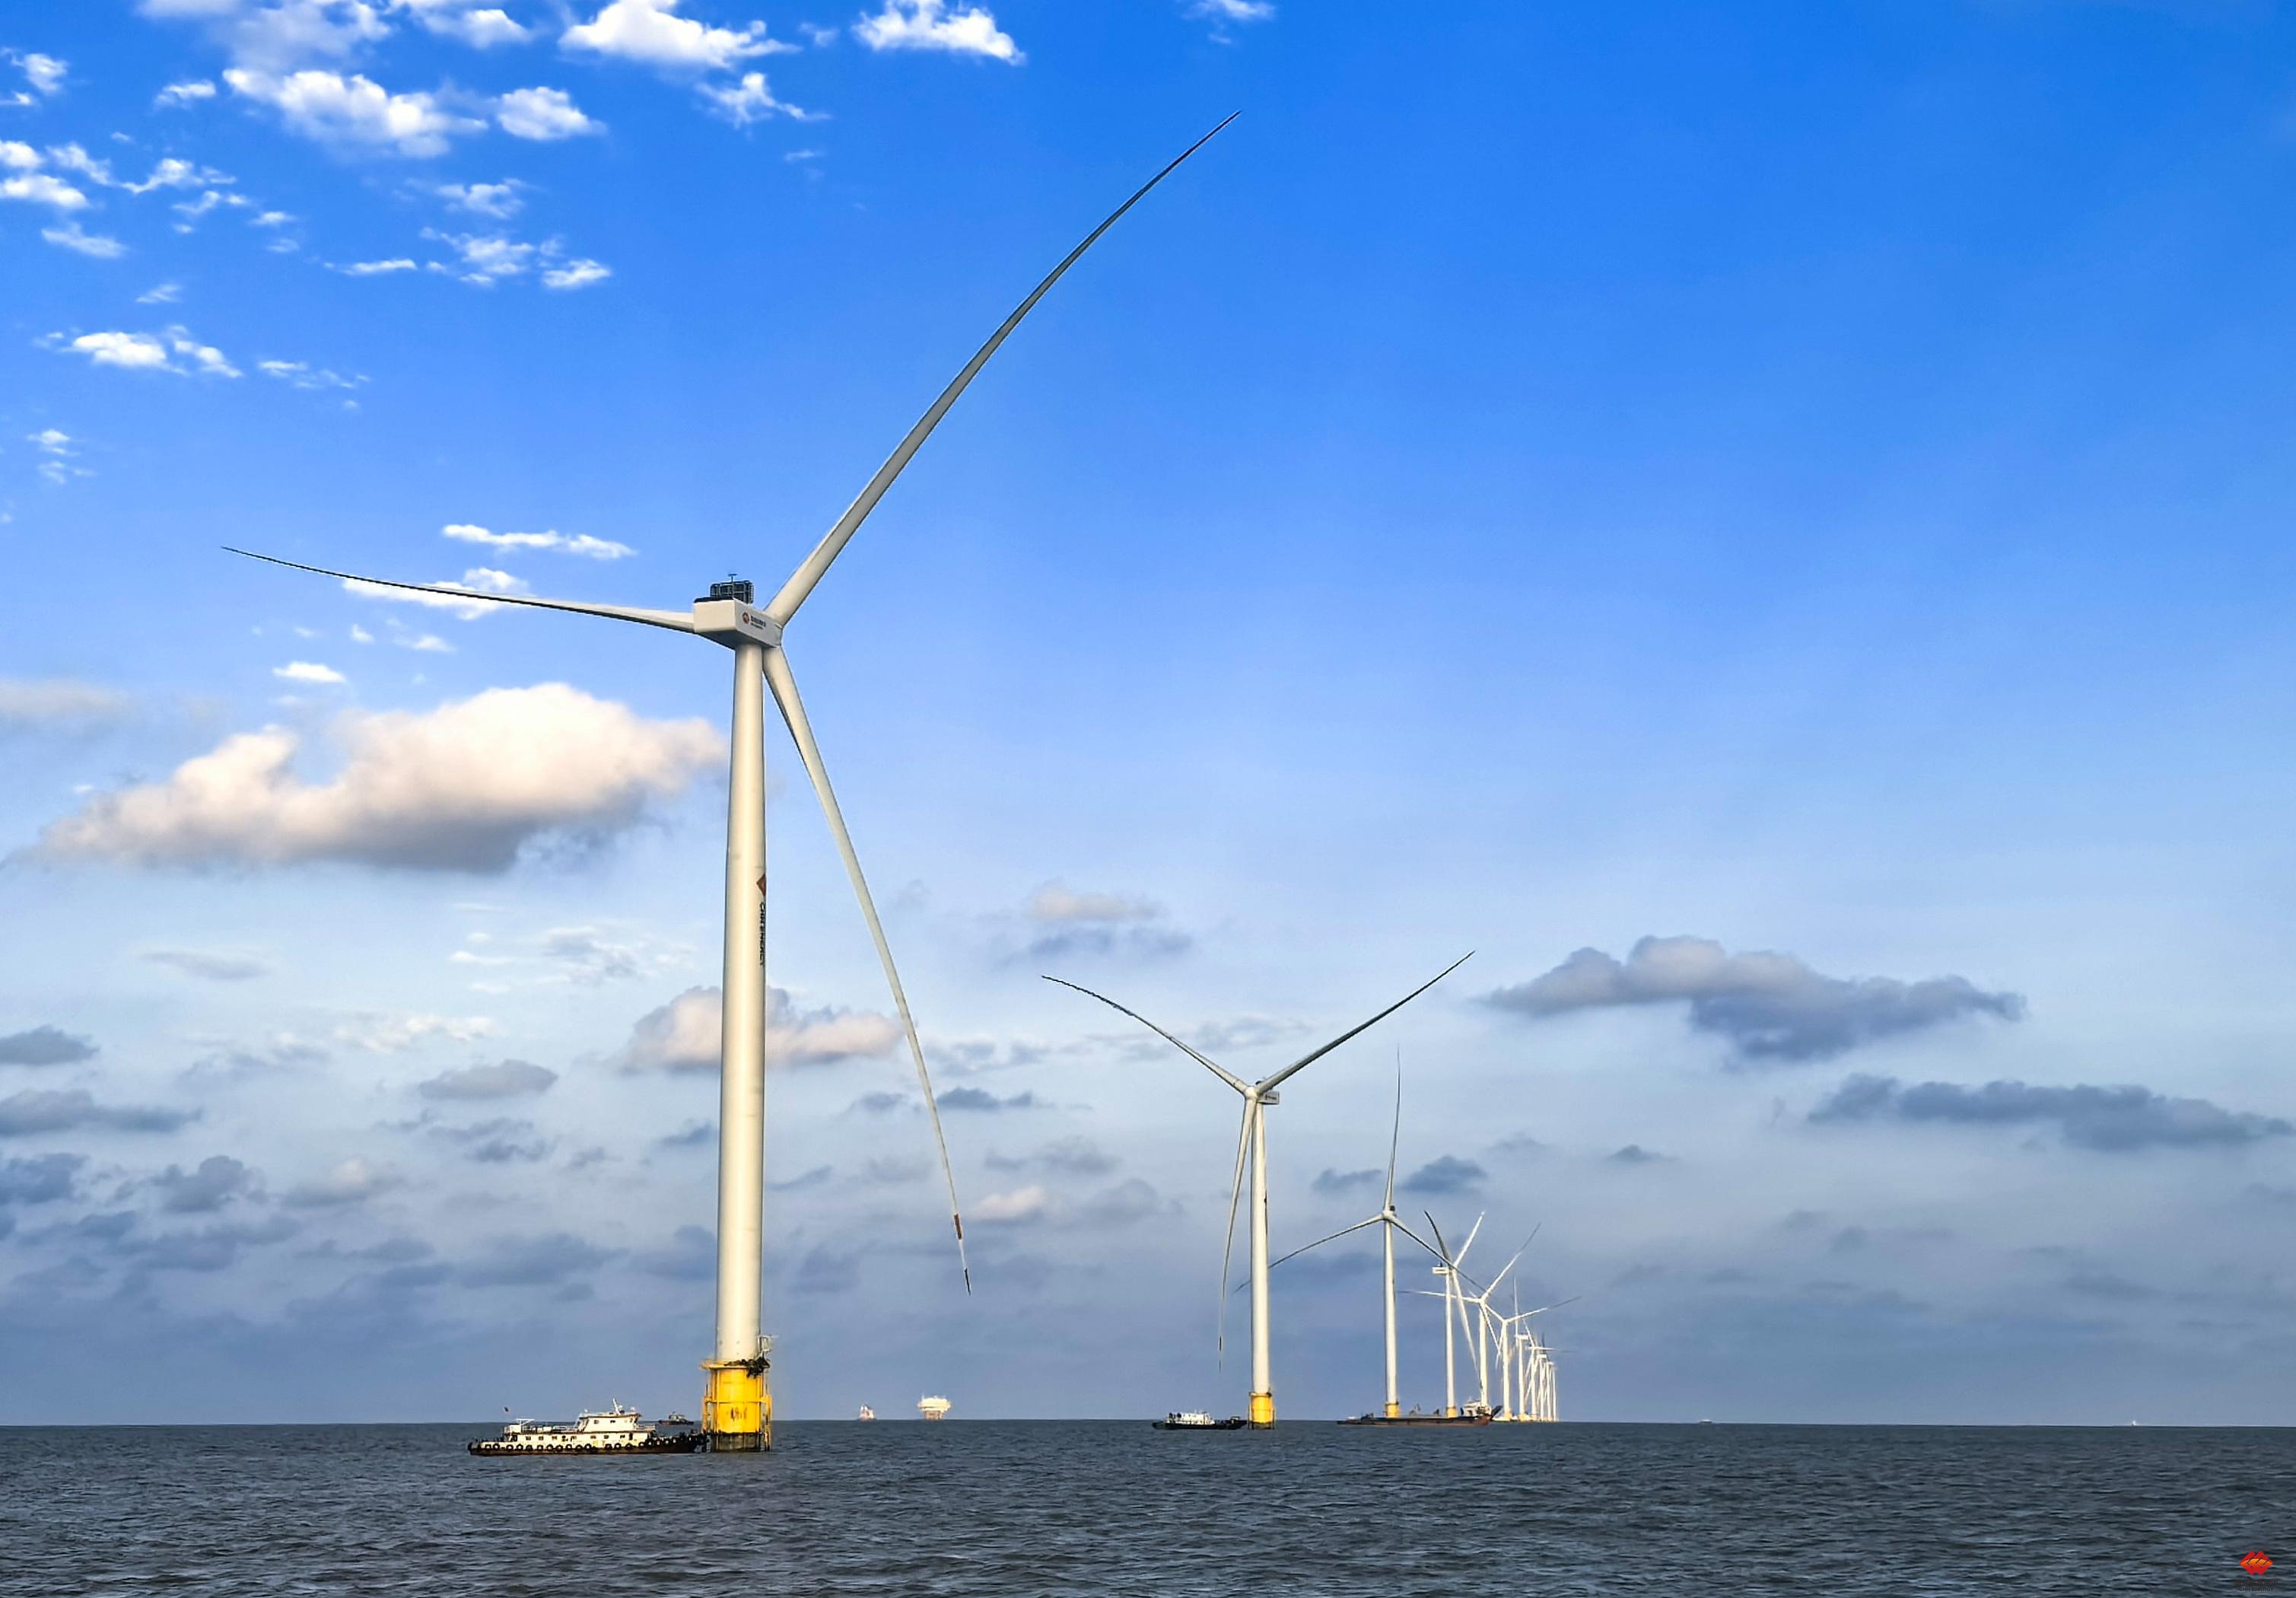
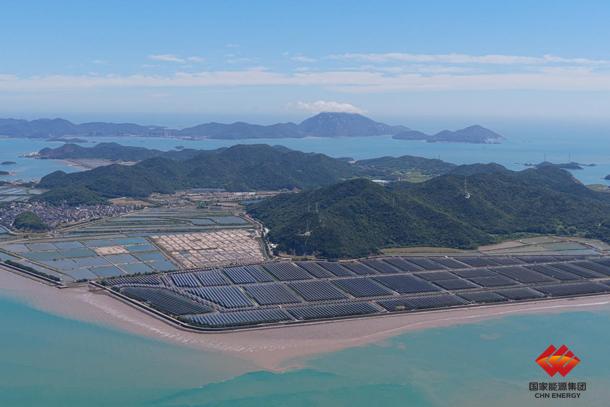
China Longyuan Power Group Corp. Ltd. is a power generation company engaged in the development and operation of wind, solar, and tidal energy projects. Founded in 1993, the company is a subsidiary of China Energy Investment Group Co., Ltd. Its business segments include wind power, solar power, and other renewable energy generation, with operations spanning 32 provinces in China as well as international markets in Canada, South Africa, and Ukraine. Key subsidiaries include Longyuan Canada Renewables Ltd. and Longyuan South Africa Renewables Proprietary Ltd. The company provides technical support services covering site design, predictive maintenance, power forecasting, and carbon asset management. It has established partnerships with Eskom in South Africa and is involved in wind power projects in Saudi Arabia. The company holds a dual listing on the A-share and H-share markets. Summarised from the company's own disclosures, fiscal year ended Apr 2026 |
Industry Utilities - Independent Power Producers | Homepage clypg.com.cn |
| Sector Utilities | IR page clypg.com.cn | |
|
Tags
wind power, solar power, tidal energy, renewable energy, offshore wind, power generation, carbon asset management, energy storage, Longyuan Canada Renewables Ltd., Longyuan South Africa Renewables Proprietary Ltd., Hero Asia Investment Limited, Hero Asia (BVI) Company Limited, CHN Energy, Qingyuan, Qianyuan, Guoneng Gong Xiang Hao
|
Press page — |
Metrics
| Valuation | |
|---|---|
| Market cap | HK$ 45.728B |
| Market cap (USD) | $ 5.828B |
| P/E | 8.80 |
| PEG | 1.90 |
| P/BV | 0.43 |
| P/S | 1.33 |
| P/OCF | 1.31 |
| P/FCF | — |
| Dividend yield | 1.3% |
| Turnover / mcap | 0.13% |
| Returns | |
|---|---|
| ROE | 6.4% |
| ROI | 2.3% |
| ROIC | 4.4% |
| Profit margin | 18.6% |
| Growth | |
|---|---|
| Revenue growing | No |
| Profits growing | No |
| Revenue up 3y | No |
| Revenue up 5y | No |
| Earnings growth 3y (net profit CAGR) | 4.6% |
| Quality | |
|---|---|
| Profitable | Yes |
| Margin expanding | No |
| Buying back stock | No |
| Diluting (TTM) | No |
| Debt/Equity | 168.8% |
| Podcast bulls (TTM) | Sign up |
| Podcast bears (TTM) | Sign up |
| Podcast sentiment (TTM) | Sign up |
| Podcast sentiment % (TTM) | Sign up |
| News sentiment (TTM) | 0 |
| Quality score | -5.9% |
| Insiders | |
|---|---|
| Buys, 1w | Sign up |
| Buys, 1m | Sign up |
| Buys, 1y | Sign up |
| Sells, 1w | Sign up |
| Sells, 1m | Sign up |
| Sells, 1y | Sign up |
Sign up to see this company's insider trades
| Figure | FY 2025 | FY 2024 | FY 2023 | FY 2022 | FY 2021 | FY 2020 | FY 2019 | FY 2018 | FY 2017 | FY 2016 | FY 2015 | FY 2014 | FY 2013 | FY 2012 | FY 2011 | FY 2010 |
|---|---|---|---|---|---|---|---|---|---|---|---|---|---|---|---|---|
| Revenue | 30.253B | 31.37B | 37.638B | 39.862B | 37.195B | 28.667B | 27.541B | 26.388B | 24.592B | 22.304B | 19.649B | 18.228B | 19.123B | 17.288B | 16.159B | 14.213B |
| Net profit | 5.618B | 7.686B | 6.868B | 4.903B | 6.159B | 4.726B | 4.325B | 3.924B | 4.55B | 3.415B | 2.881B | 2.555B | 2.049B | 2.593B | 2.638B | 2.013B |
Sign up to see institutional holdings
Sign UpPodcast Mentions
Sign up to see podcast mentions and sentiment
Sign UpAnnouncements and reports published on HKEXnews, newest first, monthly and next-day returns, proxy forms and board-meeting notices included. The link opens the announcement on HKEXnews. Press releases from the company's own website, newest first.



Prompts
Click prompts to add them under the company line, click again to take one out, then copy the result into your AI chat. Shared by Asian Century Stocks and Uncovered Thai Stocks. Thank you.
ETFs Holding China Longyuan Power Group Corp. Ltd.
Exchange-traded funds whose newest published daily portfolio holds one of the company's listings, largest weight first.
| ETF | Weight in ETF | Shares | Market value | As of |
|---|---|---|---|---|
| VCLN | 0.98% | 73,000 | $ 53.709K | Jul 31, 2026 |
| CCNR | 0.60% | 3,489,482 | $ 2.567M | Jul 31, 2026 |
| AVES | 0.07% | 1,475,000 | $ 1.031M | Nov 16, 2026 |
| AVEM | 0.04% | 13,341,000 | $ 9.328M | Nov 16, 2026 |
| NTSE | 0.02% | 17,000 | $ 10.839K | Jun 30, 2026 |
| DFAE | 0.01% | 1,876,000 | $ 1.319M | Nov 12, 2026 |
| DFEM | 0.01% | 1,522,000 | $ 1.07M | Nov 12, 2026 |
| DFAX | 0.00% | 766,000 | $ 538.519K | Nov 12, 2026 |
| DFSE | 0.00% | 35,000 | $ 24.606K | Nov 12, 2026 |