|
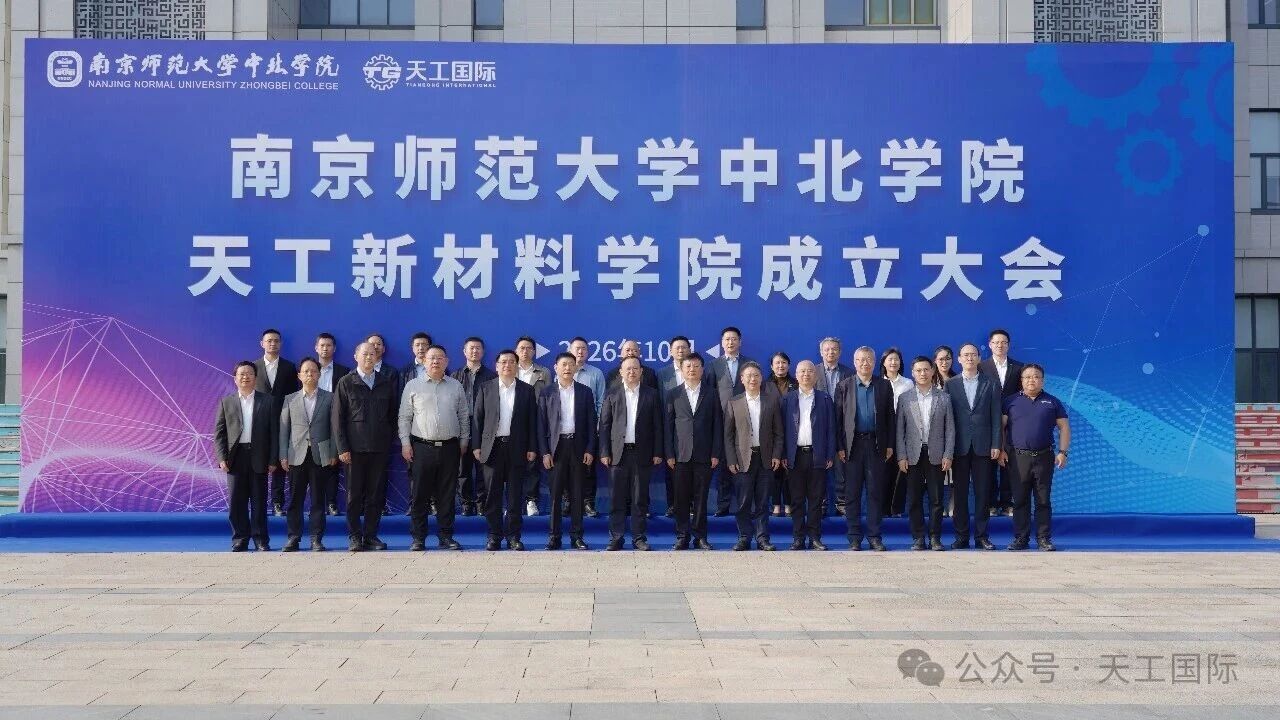
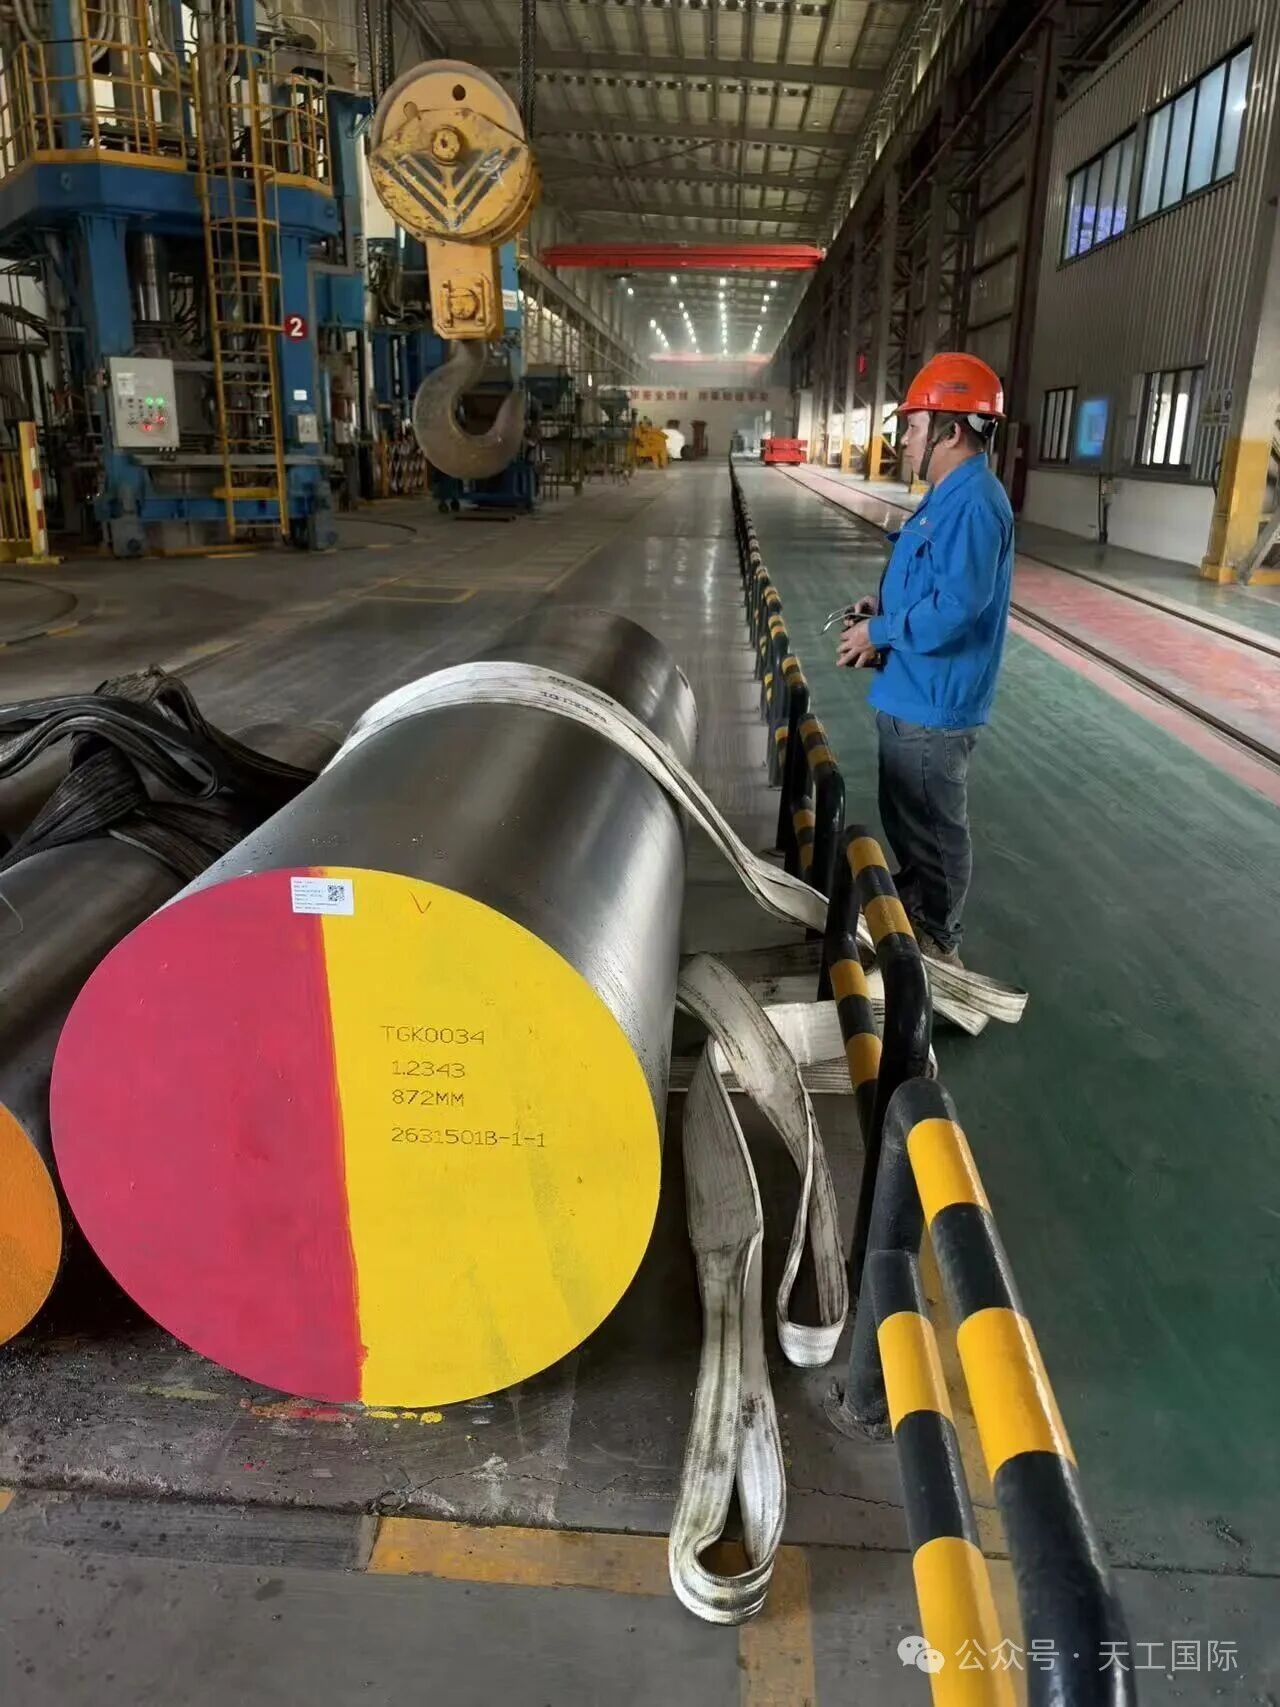
Tiangong International Company Limited is a manufacturer of advanced basic materials, key strategic materials, and precision cutting tools. The company produces high-speed steel, hot work steel, powder metallurgy products, titanium alloys, and cemented carbide tools. Its product portfolio includes injection ingots, hot isostatically pressed ingots, metal powders, and a range of cutting tools such as solid carbide tools and indexable inserts. The group serves industries including aerospace, automotive, marine, high-speed rail, petrochemicals, and consumer electronics. Tiangong International supplies customers in Europe, the Americas, and Asia, with sales networks established in countries including the United States, Russia, Czech Republic, South Korea, Turkey, Canada, Italy, Mexico, Thailand, India, Indonesia, and Vietnam. The company was founded in 1981 and listed on the main board of the Stock Exchange of Hong Kong in 2007. In May 2025, its subsidiary Jiangsu Tiangong Technology Co., Ltd. was listed on the Beijing Stock Exchange. The company has established partnerships with institutions such as the Chinese Academy of Sciences and Tsinghua University for research and development in powder metallurgy and additive manufacturing. Summarised from the company's own disclosures, fiscal year ended Apr 2026 |
Industry Specialty Chemicals | Homepage tggj.cn |
| Sector Basic Materials | IR page tggj.cn | |
|
Tags
high-speed steel, titanium alloy, powder metallurgy, cutting tools, cemented carbide, aerospace materials, automotive materials, precision manufacturing, Jiangsu Tiangong Technology Co. Ltd., Jiangsu Tiangong Cemented Carbide Technology Co. Ltd., Tiangong Precision Tools (Thailand) Co. Ltd., Tiangong Aihete Special Steel Co. Ltd., TPMD41A, TPMD41B, TP6210, WNMG080404
|
Press page — |
Metrics
| Valuation | |
|---|---|
| Market cap | HK$ 5.84B |
| Market cap (USD) | $ 744.259M |
| P/E | 13.03 |
| PEG | — |
| P/BV | 0.61 |
| P/S | 1.02 |
| P/OCF | 6.97 |
| P/FCF | — |
| Dividend yield | 1.4% |
| Turnover / mcap | 0.89% |
| Returns | |
|---|---|
| ROE | 5.2% |
| ROI | 3.8% |
| ROIC | 5.6% |
| Profit margin | 8.5% |
| Growth | |
|---|---|
| Revenue growing | No |
| Profits growing | Yes |
| Revenue up 3y | No |
| Revenue up 5y | No |
| Earnings growth 3y (net profit CAGR) | -7.4% |
| Quality | |
|---|---|
| Profitable | Yes |
| Margin expanding | Yes |
| Buying back stock | Yes |
| Diluting (TTM) | — |
| Debt/Equity | 33.3% |
| Podcast bulls (TTM) | Sign up |
| Podcast bears (TTM) | Sign up |
| Podcast sentiment (TTM) | Sign up |
| Podcast sentiment % (TTM) | Sign up |
| News sentiment (TTM) | 0 |
| Quality score | 25.0% |
| Insiders | |
|---|---|
| Buys, 1w | Sign up |
| Buys, 1m | Sign up |
| Buys, 1y | Sign up |
| Sells, 1w | Sign up |
| Sells, 1m | Sign up |
| Sells, 1y | Sign up |
Sign up to see this company's insider trades
| Figure | FY 2025 | FY 2024 | FY 2023 | FY 2022 | FY 2021 | FY 2020 | FY 2019 | FY 2018 | FY 2017 | FY 2016 | FY 2015 | FY 2014 | FY 2013 | FY 2012 | FY 2011 | FY 2010 |
|---|---|---|---|---|---|---|---|---|---|---|---|---|---|---|---|---|
| Revenue | 4.719B | 4.832B | 5.163B | 5.067B | 5.745B | 5.221B | 5.37B | 5.022B | 3.898B | 3.376B | 3.429B | 4.536B | 3.397B | 3.118B | 3.112B | 2.349B |
| Net profit | 400.228M | 358.757M | 370.209M | 503.535M | 664.371M | 537.024M | 395.146M | 258.835M | 169.099M | 110.571M | 72.623M | 463.466M | 469.727M | 444.892M | 365.327M | 235.921M |
Sign up to see institutional holdings
Sign UpPodcast Mentions
Sign up to see podcast mentions and sentiment
Sign UpAnnouncements and reports published on HKEXnews, newest first, monthly and next-day returns, proxy forms and board-meeting notices included. The link opens the announcement on HKEXnews. Press releases from the company's own website, newest first.



Prompts
Click prompts to add them under the company line, click again to take one out, then copy the result into your AI chat. Shared by Asian Century Stocks and Uncovered Thai Stocks. Thank you.
ETFs Holding Tiangong International Company Limited
Exchange-traded funds whose newest published daily portfolio holds one of the company's listings, largest weight first.
| ETF | Weight in ETF | Shares | Market value | As of |
|---|---|---|---|---|
| AVEE | 0.04% | 192,000 | $ 53.721K | Nov 16, 2026 |
| AVEM | 0.01% | 8,788,000 | $ 2.459M | Nov 16, 2026 |
| DFEV | 0.01% | 688,000 | $ 212.241K | Nov 12, 2026 |
| DFSE | 0.01% | 168,000 | $ 51.826K | Nov 12, 2026 |
| DFEM | 0.01% | 2,282,000 | $ 703.975K | Nov 12, 2026 |
| DFAE | 0.00% | 1,394,000 | $ 430.036K | Nov 12, 2026 |
| DFAX | 0.00% | 946,000 | $ 291.832K | Nov 12, 2026 |