HIGHLIGHTS Profit attributable to shareholders of the Company increased 11% year-on-year to HK$2,392.6 million. The Group’s diversified businesses delivered steady overall AOP growth of 3% yearon-year to HK$4,590.6 million, demonstrating the…
HIGHLIGHTS
Profit attributable to shareholders of the Company increased 11% year-on-year to
HK$2,392.6 million.
The Group’s diversified businesses delivered steady overall AOP growth of 3% yearon-year to HK$4,590.6 million, demonstrating the resilience of its business portfolio
amid a challenging operating environment.
The Financial Services segment recorded strong earnings growth and became the
Group’s largest AOP contributor for the first time.
The Group’s financial position remained solid. Total available liquidity stood at
approximately HK$31.3 billion as at 30 June 2026, comprising cash and bank
balances of approximately HK$20.8 billion and unutilized committed banking
facilities of approximately HK$10.5 billion.
Prudent and proactive balance sheet management. As at 30 June 2026, Net Debt
decreased by 20% year-on-year to HK$11.7 billion, and Net Gearing Ratio reduced
to 28% from 37% as at 30 June 2025.
Proposed final ordinary dividend for FY2026 is HK$0.33 per share (representing an
approximate 4% year-on-year increase on a comparable basis after adjusting the
FY2025 final ordinary dividend per share to reflect the enlarged share capital base
following the 1-for-10 bonus issue in December 2025). Together with the interim
ordinary dividend of HK$0.28 per share, the total ordinary dividends for FY2026 will
amount to HK$0.61 per share. The total ordinary dividends amount will be increased
by approximately 6% year-on-year to HK$2.8 billion, reflecting the Group’s
commitment to a sustainable and progressive policy, supported by the strong cash
flow generation of its strengthened business portfolio.
Proposed 1-for-10 bonus issue to recognize Shareholders’ long-standing support and
enhance share liquidity.
The board of directors (the “Board”) of CTF Services Limited (the “Company”) is pleased to
announce the audited consolidated results of the Company and its subsidiaries (collectively, the
“Group”) for the financial year ended 30 June 2026 (“FY2026”) together with comparative figures
for the financial year ended 30 June 2025 (“FY2025”).
1
BUSINESS REVIEW
Group overview
Against a backdrop of persistent macroeconomic uncertainty and subdued market conditions,
the Group delivered a resilient performance in FY2026. Attributable Operating Profit (“AOP”,
a non-HKFRS measure) registered a 3% year-on-year increase to HK$4,590.6 million. The net
non-operating loss in FY2026 mainly included fair value losses on investment properties,
impairment/remeasurement losses associated with the Roads segment and losses relating to a
disposal of an investment under the Strategic Investments segment. Profit attributable to
shareholders of the Company rose 11% year-on-year to HK$2,392.6 million. Overall, the result
demonstrates the quality of the Group’s diversified business portfolio, the effective execution
of its continuous portfolio optimization strategy, and disciplined financial management.
The Group’s earnings profile continued to evolve during FY2026. The Financial Services
segment became the largest AOP contributor for the first time, underpinned by solid growth in
the insurance business. This was partly offset by a weaker contribution from the Logistics
segment due to the impact of deferred tax provision as well as reflecting challenging market
conditions despite signs of stabilization. The Group’s earnings remained geographically
diversified with dual core regions, Hong Kong contributing 63% of AOP (FY2025: 58%) and
the Chinese Mainland contributing 33% of AOP in FY2026 (FY2025: 40%). Adjusted earnings
before interest, taxes, depreciation and amortization (“Adjusted EBITDA”, a non-HKFRS
measure of the Group’s operating profitability) increased by 1% year-on-year to
HK$7,394.5 million, while basic earnings per share rose to HK$0.53, representing year-onyear growth of 8%1.
The Group advanced with its portfolio optimization strategy in FY2026, recycling capital from
mature, traditional infrastructure assets into businesses with better long-term growth prospects,
higher scalability and greater recurring income potential. In line with this strategy, the Group
broadened its logistics platform through the acquisition of four logistics properties in the
Greater Bay Area and the Yangtze River Delta, further deepening its presence in key economic
regions of the Chinese Mainland. In September 2026, the Group completed its acquisition of
another logistics property in Jiaxing City, Zhejiang Province, creating a larger asset cluster in
the Yangtze River Delta and providing further operating efficiencies, portfolio synergies and
tenant servicing capabilities. As part of its efforts to build scalable businesses with attractive
recurring income characteristics, the Group has, up to the date of this announcement, also
expanded its exposure to artificial intelligence (“AI”)-related infrastructure by entering into
agreements to acquire a 70% equity interest in an artificial intelligence data centre (“AIDC”)
project in Hebei Province and a 40% equity interest in an AIDC project in Malaysia. Together,
these investments strengthen the Group’s presence in logistics and digital infrastructure,
positioning it to benefit from growing demand for high-standard warehouses and AI-related
infrastructure.
In parallel with the expansion of the logistics platform, the Group enhanced its Financial
Services segment by broadening the wealth management capabilities. During FY2026, the
Group acquired a 13.05% stake in uSmart Inlet Group Ltd. (“uSMART”), a technology-driven
financial services provider. In July 2026, the Group completed the acquisition of a 65% equity
interest in Blackhorn Group Limited (“Blackhorn”), an external asset manager. Collectively,
these investments significantly broaden the Group’s wealth management platform by extending
its product offerings, widening customer reach and adding advisory and asset management
capabilities to better capture and serve the growing number of high-net-worth customers.
1
Compared to basic earnings per share for FY2025 as adjusted to HK$0.49 per share for the bonus shares allotted
and issued in December 2025.
2
Beyond Logistics and Financial Services segments, the Group selectively invested in nextgeneration infrastructure aligned with long-term structural growth trends. During FY2026, the
Group partnered with Unisun Energy Services GmbH (“Unisun”) to develop Battery Energy
Storage System projects in Finland to address intermittency arising from the large-scale
transition towards green energy. The investment reflects the Group’s disciplined approach to
identifying opportunities with sustainable long-term demand drivers and expansion potential.
Alongside new investments, the Group continued its capital recycling initiatives to enhance
portfolio quality and improve capital efficiency. During FY2026, the Group aimed to monetize
its investment in Shoucheng Holdings Limited (“Shoucheng”) within the Strategic Investments
segment through the issuance of HK$2,218 million 0.75% exchangeable bonds due 2028
(“0.75% Exchangeable Bonds”), thereby unlocking value and strengthening its financial
flexibility to support future growth initiatives. The Group also announced the disposal of its
entire interests in Hunan Changliu Expressway in May 2026, enabling capital to be deployed
from a mature infrastructure asset into businesses with greater strategic relevance and growth
prospects. As at 30 June 2026, the assets of Hunan Changliu Expressway, together with its
associated liabilities, were classified as held-for-sale and the transaction was subsequently
completed in July 2026.
These strategic initiatives were underpinned by balance sheet resilience and disciplined
financial management. During FY2026, the Group maintained stable borrowing costs at
approximately 4.1% per annum (FY2025: approximately 4.1%) despite a dynamic interest rate
environment, while optimizing its debt mix and risk profile. Favourable movements in the
Secured Overnight Financing Rate (“SOFR”) contributed to an 11% reduction in profit
attributable to holders of perpetual capital securities. During the year, in view of the expected
appreciation of Renminbi (“RMB”) against the Hong Kong dollar, the Group proactively
reduced its RMB borrowings used as a natural hedge against RMB-denominated assets. As a
result, RMB debt decreased to approximately 46% of total debt as at 30 June 2026, down from
approximately 62% a year earlier. The ratio of RMB liabilities to RMB assets also moderated
to approximately 62% as at 30 June 2026 from approximately 80% as at 30 June 2025, allowing
the Group to benefit from greater net exposure to RMB assets while maintaining prudent
balance sheet management.
The Group continued to maintain diversified funding sources and strong access to capital
markets. Consistent with its strategy of reducing exposure to RMB borrowings, the Company
fully redeemed the first tranche of RMB1.5 billion Panda Bonds using internal resources upon
maturity in May 2026. The Company secured approval for up to RMB5.0 billion of debt
financing instruments under the 2026 Panda Bond Programme, providing additional flexibility
to access the onshore debt market in the future. In addition, following the issuance and
subsequent conversion of HK$850 million 2.8% convertible bonds due 2027 (the “2.8%
Convertible Bonds”), the public float of shares of the Company increased to approximately
26.63% as at 30 June 2026, which was above the minimum percentage prescribed under the
Rules Governing the Listing of Securities on The Stock Exchange of Hong Kong Limited (“the
Listing Rules”). This helped to further enhance share liquidity and support the Company’s
ability to attract a broader base of quality investors.
The Group’s disciplined financial management was further reflected in its robust credit profile.
China Lianhe Credit Rating Co., Ltd. reaffirmed the Company’s “AAA” rating with a stable
outlook. Japan Credit Rating Agency, Ltd. also affirmed the Company’s “A+” Foreign
Currency and Local Currency Long-term Issuer Ratings for the third consecutive year and
raised the rating outlook to “Positive” from “Stable”. These ratings reflect external recognition
of the Group’s financial resilience, improving business profile and continued access to
diversified funding channels.
3
Reflecting its commitment to Environmental, Social and Governance (“ESG”) principles, the
Group expanded its sustainable financing platform. The Group has made solid progress in
sustainable financing and remains fully on track to meet its target under “Breakthrough 2050”.
As at 30 June 2026, sustainability-linked and green facilities totalled approximately
HK$20.2 billion (30 June 2025: approximately HK$18.6 billion), representing approximately
45% (30 June 2025: approximately 39%) of total bond and loan facilities.
With ongoing portfolio optimization initiatives, disciplined capital allocation and prudent
leverage management, the Group’s financial position strengthened further during FY2026. Debt
maturing within one year decreased by 16% year-on-year, from approximately HK$9.4 billion
as at 30 June 2025 to approximately HK$7.9 billion as at 30 June 2026. Total available liquidity
stood at approximately HK$31.3 billion, comprising cash and bank balances of approximately
HK$20.8 billion and unutilized committed banking facilities of approximately HK$10.5 billion.
The net debt, being the aggregate of borrowings and other interest-bearing liabilities less cash
and bank balances (the “Net Debt”), decreased by 20% year-on-year to approximately
HK$11.7 billion, while the net gearing ratio, calculated as Net Debt over total equity (the “Net
Gearing Ratio”), decreased to 28%2 from 37% as at 30 June 2025, reinforcing the Group’s
capacity to pursue future growth opportunities while maintaining financial resilience.
Supported by robust recurring cash flow from its diversified earnings base, strong balance sheet
and ample liquidity, the Group remains committed to delivering a sustainable and progressive
dividend policy. The aim of its dividend policy is to steadily increase or at least maintain the
Hong Kong dollar value of total ordinary dividend annually. The prospective total dividend
growth, however, remains dependent upon the financial performance and future funding needs
of the Group.
For FY2026, the Board of the Company has resolved to recommend a final ordinary dividend of
HK$0.33 per share3, representing approximately 4% year-on-year increase on a comparable basis,
after adjusting the FY2025 final ordinary dividend per share to reflect the enlarged share capital
base following the 1-for-10 bonus issue in December 2025. Together with the interim ordinary
dividend of HK$0.28 per share distributed earlier in the year, the total ordinary dividends for
FY2026 will amount to HK$0.61 per share3. This marks the Group’s 23rd consecutive year of
ordinary dividend distribution, reflecting its commitment to sustainable and progressive
shareholder returns. The total ordinary dividends amount for FY2026 will be increased by
approximately 6% year-on-year to HK$2.8 billion, underscoring the Group’s commitment to
progressive shareholder returns supported by the strong cash flow generation of its diversified
business portfolio.
In addition, the Board has proposed a bonus issue of shares on the basis of one bonus share for
every ten existing shares held by the shareholders of the Company (the “Shareholders”) whose
names appear on the register of members of the Company on 23 November 2026 (the “Bonus
Issue”). The Bonus Issue is intended to allow Shareholders to receive a pro-rata increase in their
shares in the Company at no additional cost. The Board believes that the Bonus Issue will help
enhance the liquidity of the Company’s shares in the market and represents an appropriate and
balanced way to recognize the long-standing support of Shareholders.
2
The 0.75% Exchangeable Bonds, which are accounted for as financial liabilities at fair value through profit or loss,
are excluded from both the Net Debt and Net Gearing Ratio calculations. If the 0.75% Exchangeable Bonds were
included as debt, the net gearing ratio would be 33% as at 30 June 2026.
3
The proposed final ordinary dividend of HK$0.33 per share and the total ordinary dividends of HK$0.61 per share
for FY2026 are not directly comparable with the final ordinary dividend of HK$0.35 per share and the total ordinary
dividends of HK$0.65 per share for FY2025, respectively, due to the effect of the 1-for-10 bonus issue in December
2025.
4
Profit Contribution
For the year ended 30 June
2026
HK$’m
2025
HK$’m
4,590.6
4,466.2
(268.6)
(235.8)
(116.3)
(447.9)
(645.5)
(152.8)
25.4
70.0
(77.0)
575.7
(24.3)
(1,048.8)
(367.7)
(1,010.1)
(397.0)
(2,018.8)
(2,101.9)
Profit for the year after tax and non-controlling interests(2)
2,571.8
2,364.3
Profit attributable to:
Shareholders of the Company
Holders of perpetual capital securities
2,392.6
179.2
2,162.0
202.3
2,571.8
2,364.3
Attributable Operating Profit(1)
Non-operating items
Loss on fair value of investment properties, net of tax
Remeasurement, impairments and provisions, net
Net loss on disposal of projects
Share of non-operating income of an associated company
and joint ventures, net
Gain on fair value of exchangeable bonds
Share-based payment
Unallocated corporate office items
Net finance costs
Expenses and others
Notes:
(1)
Attributable Operating Profit/(Loss) is a non-HKFRS measure used by the Executive Committee of the
Company to assess the performance of the operating segments as detailed in note 2 to the “Results”
section of this announcement. The overall AOP of the Group represents the profit available for
appropriation before non-operating and unallocated corporate office items. It should not be considered
in isolation from, or as a substitute for, the Group’s financial information prepared in accordance with
HKFRS Accounting Standards. It may not be comparable to similar measures presented by other
companies.
(2)
Reconciliation from Attributable Operating Profit to profit for the year after tax and non-controlling
interests and related details of reconciling to consolidated income statement and notes thereto are set
out in note 2 to the “Results” section of this announcement.
5
Adjusted EBITDA(3)
For the year ended 30 June
Operating profit
Adjustments
Depreciation and amortization(4)
Other non-operating/non-cash items
Loss on fair value of investment properties(5)
Impairment loss on intangible concession rights(5)
Remeasurement loss on assets classified as held-for-sale(5)
Impairment loss related to an associated company(5)
Loss on partial disposal of interest in an associated company(5)
Profit on disposal of assets held-for-sale(5)
Fair value change of financial liabilities at fair value through
profit or loss (“FVPL”)(5)
Share-based payment(6)
Dividends received from associated companies and joint ventures
Other adjustments(7)
Adjusted EBITDA(3)
2026
HK$’m
2025
HK$’m
3,731.5
3,232.6
1,919.8
1,813.7
115.5
105.0
73.7
37.2
116.3
582.7
311.9
(42.7)
(70.0)
77.0
1,112.0
176.5
24.3
1,201.2
192.1
7,394.5
7,315.8
Notes:
(3)
Adjusted EBITDA is a non-HKFRS measure of the Group’s operating profitability and calculated as
operating profit excluding depreciation and amortization and other non-operating/non-cash items, plus
dividends received from associated companies and joint ventures, and any other relevant adjustments.
It should not be considered in isolation from, or as a substitute for, the Group’s financial information
prepared in accordance with HKFRS Accounting Standards. It may not be comparable to similar
measures presented by other companies.
(4)
Being the sum of amortization of intangible assets and intangible concession rights as well as
depreciation of property, plant and equipment and right-of-use assets as individually disclosed in note
3 to the “Results” section of this announcement.
(5)
As disclosed in note 4 to the “Results” section of this announcement.
(6)
As disclosed in note 3(a) to the “Results” section of this announcement.
(7)
Adjustments are mainly to include dividends from an associated company and a joint venture which
were reinvested by the Group.
6
OPERATIONAL REVIEW
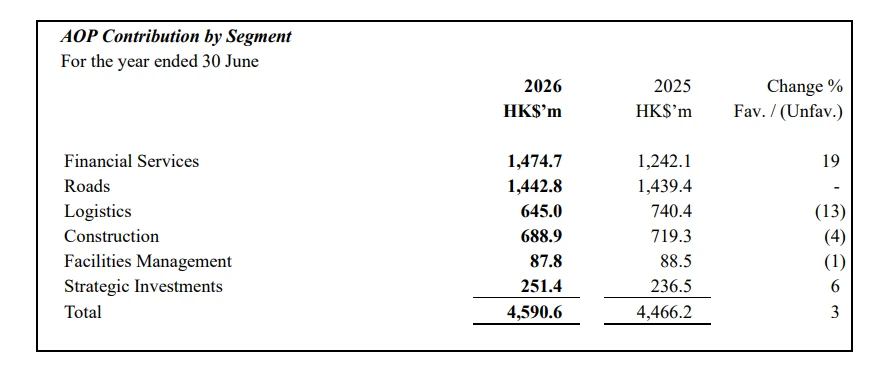
AOP Contribution by Segment
For the year ended 30 June
Financial Services
Roads
Logistics
Construction
Facilities Management
Strategic Investments
Total
2026
HK$’m
2025
HK$’m
Change %
Fav./(Unfav.)
1,474.7
1,442.8
645.0
688.9
87.8
251.4
4,590.6
1,242.1
1,439.4
740.4
719.3
88.5
236.5
4,466.2
19
(13)
(4)
(1)
6
3
Financial Services
The Financial Services segment became the Group’s largest AOP contributor in FY2026,
reflecting the continued shift of the Group’s portfolio towards businesses with higher growth
potential and more recurring earnings streams. Segment AOP rose by 19% to
HK$1,474.7 million, primarily driven by higher Contractual Service Margin (“CSM”) release
from Chow Tai Fook Life Insurance Company Limited (“CTF Life”). The result reflects the
growing scale and earnings contribution of the insurance business, as well as disciplined
execution across the segment. Earnings quality also remained resilient, supported by recurring
profit contribution from the insurance business.
The quality of CTF Life’s earnings strengthened during the year. CSM release rose 21% yearon-year to HK$1,368 million, while CSM balance, net of reinsurance, grew 22% to
HK$11.3 billion as at 30 June 2026, driven by profitable new business growth and favourable
investment performance. In addition, Value of New Business4 (“VONB”) increased by 30%
year-on-year to HK$1,308 million, while VONB margin, calculated as VONB divided by
Annual Premium Equivalent5 (“APE”), expanded to 37% in FY2026 from 30% in FY2025,
reflecting a more favourable product mix and successful product repricing initiatives. Together,
these indicators demonstrate CTF Life’s growing earnings capacity and provide greater
visibility over future earnings.
Business momentum remained broad-based across products, distribution channels and
customer segments. APE grew by 7% year-on-year to HK$3,540 million, while new business
premium6 increased by 74% year-on-year to HK$9,333 million. The stronger growth in new
business premium primarily reflected a higher contribution from single premium products
during the year, alongside continued customer demand across the product portfolio. Growth
was further aided by the ongoing enhancement of CTF Life’s diversified distribution platform.
4
Value of new business is the present value of distributable statutory earnings in the future (less the cost of holding
solvency capital) from new insurance business sold in a period.
5
Annual Premium Equivalent is a measure of new insurance business activity that is calculated as the sum of
annualized regular premiums from new insurance business plus 10% single premiums on new insurance business
written during a period.
6
New business premium is a measure of new insurance business activity that is calculated as the sum of annualized
first year premiums and single premiums from new insurance business that are due, whether or not received during
the year, including income which has accrued, where appropriate.
7
The agency channel delivered strong underlying growth, with APE rising 10% year-on-year to
HK$1,106 million and new business premium increasing 85% year-on-year to
HK$2,945 million. New business premium growth significantly outpaced the 6% increase in
agency headcount to over 2,200 agents as at 30 June 2026, reflecting enhanced productivity,
more effective sales execution and a higher-calibre agency force. Agency productivity in terms
of new business premium increased by 73% year-on-year. This was further evidenced by a 29%
year-on-year increase in Million Dollar Round Table (MDRT) registered members as at
31 December 2025, underscoring the growing professionalism and effectiveness of the agency
model.
The partnership channel also gained momentum, with APE rising by 16% year-on-year to
HK$2,241 million and new business premium surging by 138% year-on-year to
HK$5,135 million. The strong performance was driven by deeper engagement with new
brokers, improved sales support capabilities and deeper penetration of key local broker
relationships.
Customer demand was diversified across local customers, Chinese Mainland Visitors (“CMV”)
and overseas customers during FY2026. APE from local and overseas customers increased by
12% and 40% year-on-year, respectively, while APE from CMV remained steady year-on-year.
This was supported by closer broker engagement and the broader Chow Tai Fook Group
ecosystem, which enhanced customer acquisition, loyalty and overall customer experience.
The contribution from a broad and resilient customer base demonstrates the strength of CTF
Life’s customer franchise and the effectiveness of its diversified distribution strategy.
CTF Life’s strong business growth was underpinned by a disciplined and diversified
investment approach focused on sustainable long-term returns, prudent asset-liability
management and capital strength. As at 30 June 2026, assets under management rose 17% yearon-year to approximately HK$106.4 billion (30 June 2025: approximately HK$90.8 billion),
driven by business expansion and favourable investment performance. CTF Life’s investment
strategy is designed to generate sustainable risk-adjusted returns over the long term while
preserving capital strength and supporting the fulfilment of its obligations to policyholders.
The strategy seeks to balance investment return objectives with prudent risk management,
aiming to reduce earnings volatility, control and diversify risk exposures, and maintain
financial resilience across different market cycles. To this end, CTF Life maintained a
disciplined investment approach aligned with the long-term nature of its liabilities, with fixed
income investments represented approximately 70% (30 June 2025: approximately 70%) of
CTF Life’s investment portfolio (exclude unit-linked investments), of which investment-grade
securities accounted for approximately 90% (30 June 2025: approximately 90%) of total bond
holdings, and the fixed-income portfolio generated a stable investment yield of 4.6% per
annum (FY2025: 4.6% per annum). Asset-liability management remained prudent, with the
Hong Kong Risk Based Capital (“HKRBC”) effective duration gap maintained within a
conservative range.
CTF Life also maintained a robust financial position. As at 30 June 2026, its solvency ratio
under the HKRBC regime further edged up to 285% (30 June 2025: 279%), which is almost
three times the minimum regulatory requirement at 100%, delivering one of the highest
HKRBC solvency ratios among Hong Kong insurers and a stable ratio post dividend remittance.
The sound capital position not only supports dividend distribution but also helps preserve
sufficient capital headroom for future growth. Embedded value grew by 12% year-on-year to
HK$28.4 billion, driven by expected return on existing business, new business growth and
favourable market performance. CTF Life’s robust balance sheet continued to be recognized
by rating agencies, with Moody’s maintaining its A3 (stable) financial strength rating and Fitch
Ratings affirming its A- (stable) rating.
8
With its solid capital base and growing franchise, CTF Life invested in product innovation and
customer proposition enhancement during FY2026. CTF Life’s long-standing commitment to
policyholder value was demonstrated by the achievement of a fulfillment ratio at 100% or more
for three signature product series over 10 consecutive years and a 4.25% annual interest rate
on accumulated dividends for United States dollar participating policies for 14 consecutive
years. Building on this solid track record, CTF Life further broadened its product offerings
with new savings and indexed universal life insurance products. These products improved CTF
Life’s ability to address increasingly sophisticated customer needs, particularly in wealth
accumulation, legacy planning and high-net-worth solutions.
Beyond product innovation, CTF Life deepened customer engagement and service capabilities
through digital and healthcare ecosystem initiatives. During the year, it became the first life
insurer in Hong Kong to enable premium payments through AlipayHK, enhancing convenience
and accessibility for customers. It also extended its healthcare ecosystem to 23 partner medical
institutions across Hong Kong and the Greater Bay Area, providing priority access and direct
billing services. These initiatives reinforce CTF Life’s customer-centric strategy.
The strength of the Financial Services franchise gained further industry recognition during
FY2026. CTF Life received more than 80 corporate and insurance practitioner awards across
product innovation, customer service, talent development, digital transformation, marketing
and ESG initiatives. These accolades reflect CTF Life’s continued commitment to excellence,
innovation and creating value beyond insurance.
Beyond organic growth, the Group broadened its wealth management platform strategically.
Following completion of the investment in uSMART in November 2025, the Group holds a
13.05% equity interest in uSMART, which is accounted for as an associated company and
contributed positively to the Group’s AOP in FY2026. Benefiting from higher market turnover
driven by robust trading activity, uSMART delivered strong business momentum during the year,
with revenue increased to approximately fourfold year-on-year and a significant improvement in
earnings. The investment complements the Group’s insurance platform by providing exposure to
the growing popularity of independent digital securities brokerage globally and enhancing its
broader wealth management ecosystem.
Roads
As at 30 June 2026, the Group managed a portfolio of thirteen toll road projects across
Guangdong Province, Zhejiang Province, Hubei Province, Hunan Province, Tianjin
Municipality and Guangxi Zhuang Autonomous Region, with an aggregate roadway length of
approximately 880 kilometres.
In FY2026, the Roads segment reported AOP of HK$1,442.8 million, remaining broadly flat
year-on-year. The stable performance was mainly attributable to favourable RMB exchange
movements, lower finance costs and a higher contribution from Tangjin Expressway (Tianjin
North Section), where traffic flow increased following the completion of a major connecting
road expansion in October 2025. These positive factors were partly offset by weaker
performance at certain toll road assets amid uneven regional traffic recovery, together with the
non-recurrence of contribution from Shanxi Taiyuan-Gujiao Roadway (Gujiao Section), which
was disposed of in April 2025.
9
The operating environment remained challenging during FY2026. On a like-for-like basis,
average daily traffic flow and toll revenue declined by approximately 1% year-on-year. The
decrease was primarily attributable to temporary traffic disruptions arising from the ongoing
expansion works on Beijing-Zhuhai Expressway (Guangzhou-Zhuhai Section) and
Guangzhou-Zhaoqing Expressway, which resulted in partial road closures. In addition, traffic
flow on Suiyuenan Expressway normalized from the relatively high base recorded in FY2025,
when maintenance works on neighbouring road networks led to temporary traffic diversion to
the expressway. More broadly, traffic growth across the toll road portfolio remained largely
flat, while expansion of surrounding transportation networks continued to influence traffic
patterns across individual assets.
As at 30 June 2026, the toll road portfolio had an average remaining concession period of
approximately 11 years. The expansion works on Beijing-Zhuhai Expressway (GuangzhouZhuhai Section) and Guangzhou-Zhaoqing Expressway remain on schedule and are currently
expected to be completed by the financial year ending 30 June 2028. Upon completion, the
Group will be eligible to apply for extensions of the respective concession periods. These
projects form part of the Group’s ongoing efforts to lengthen the revenue-generating life and
enhance the competitiveness of its remaining toll road portfolio.
In parallel, the Group continued to advance its portfolio optimization strategy through
disciplined capital recycling. In May 2026, the Group announced the disposal of its entire
interest in the Hunan Changliu Expressway for approximately RMB1.61 billion, with the
equity consideration broadly equivalent to the Group’s net cash investment in the project’s
equity interests. The transaction followed management’s thorough evaluation of the Group’s
capital allocation priorities, taking into account the asset’s relatively limited contribution to
Roads segment AOP and cash flow generation, subdued growth profile and increasing
operational challenges. Completed in July 2026, the transaction strengthened the Group’s
balance sheet and facilitated the redeployment of capital towards businesses aligned with its
strategic priorities, offering more attractive long-term growth potential and risk-adjusted
returns. Following completion, the assets and associated liabilities of Hunan Changliu
Expressway ceased to be consolidated into the Group’s financial statements.
Logistics
The Logistics segment reported AOP of HK$645.0 million for FY2026, representing a decrease
of 13% year-on-year. Excluding the impact from deferred tax provisions for the logistics
properties in the Chinese Mainland, AOP declined 10% year-on-year. Continued growth in
contributions from China United International Rail Containers Co., Limited (“CUIRC”) helped
mitigate the lower earnings from ATL Logistics Centre Hong Kong Limited (“ATL”) in Hong
Kong. Excluding the impact from deferred tax, contributions from logistics properties in the
Chinese Mainland increased following the acquisition of four new logistics properties. Market
conditions in both Hong Kong and the Chinese Mainland have been improving gradually
during the financial year, supporting leasing activity and customer demand across parts of the
portfolio.
As at 30 June 2026, the Group’s Logistics Asset & Management portfolio comprised ATL in
Hong Kong and eleven logistics properties in the Chinese Mainland. The portfolio offered a
total gross leasable area of approximately 14.5 million sq ft, comprising 5.9 million sq ft in
Hong Kong and 8.6 million sq ft in the Chinese Mainland respectively.
10
Within Hong Kong, ATL operated against a backdrop of market volatility arising from
reciprocal tariffs, while the gradual recovery of Hong Kong’s economy provided some support
to business activities. ATL’s occupancy started to recover following more proactive marketing
and leasing initiatives, including attracting tenants from more resilient sectors, offering flexible
leasing arrangements, enhancing facility specifications and fostering closer collaboration with
leasing agencies. As at 30 June 2026, ATL’s occupancy rate rebounded sharply to 84.5%
(30 June 2025: 80.7%) from 75.2% as at 31 December 2025. Nonetheless, average occupancy
for FY2026 was lower than FY2025, reflecting the weaker occupancy level during the earlier
part of the financial year before the recovery gained traction in the second half. The improving
economic environment in Hong Kong, particularly the strong recovery in tourism and retailrelated activities, also drove demand from ATL’s core tenant base, including third-party
logistics, e-commerce, distribution operators and retailers. Leveraging its strategic location
and full-building ramp access, ATL further reinforced its position as a leading logistics and
distribution hub in Hong Kong.
Complementing ATL in Hong Kong, the Group’s logistics assets in the Chinese Mainland
provided additional sources of recurring income and portfolio diversification. The logistics
property market in the Chinese Mainland showed signs of recovery during FY2026, although
the pace of stabilization remained selective and varied across regions. Excluding the impact
from deferred tax, AOP from logistics properties in the Chinese Mainland recorded a 11%
growth year-on-year in FY2026, reflecting the immediate AOP contribution from newly
acquired logistics assets. As at 30 June 2026, the average occupancy rate across the seven
logistics assets in Chengdu, Wuhan and Suzhou was 86.3% (30 June 2025: 87.5%). Through
flexible leasing strategies and proactive asset management, the Group maintained a balanced
approach between occupancy retention and rental performance amid an evolving operating
environment.
During FY2026, the Group further expanded its logistics asset footprint and strengthened
portfolio synergies across the Chinese Mainland through the acquisition of four logistics
properties in Dongguan, Shanghai, Ningbo and Changzhou. Situated in economically vibrant
regions with favourable long-term fundamentals, these assets are underpinned by established
tenant bases and contributed recurring cash flows during the financial year. Following the
acquisitions, the Group’s logistics portfolio in the Chinese Mainland comprised eleven assets,
with an overall average occupancy rate of 86.2% as at 30 June 2026.
In addition to its logistics property investments, the Group maintains exposure to the growing
rail logistics sector through its 30% stake in CUIRC, which operates a nationwide network of
thirteen railway container terminals across key logistics corridors in the Chinese Mainland.
During FY2026, AOP increased by 2% year-on-year, while throughput rose by 8% year-onyear to 7,564,000 TEUs, driven by growing demand for rail freight services, ancillary logistics
services, and higher terminal handling volumes. The business also benefited from favourable
national policies promoting multimodal transportation, reducing logistics costs and improving
supply chain efficiency. To improve operational efficiency, CUIRC invested in its terminal
infrastructure upgrade, including the completion of automation projects at the Qingdao and
Wuhan terminals in June 2026.
11
Construction
The Construction segment is represented by CTFS Construction Group, which comprises four
established operating entities with complementary specialist capabilities: (i) Hip Hing Group,
one of Hong Kong’s leading building contractors, is frequently selected for technically
complex and high-quality projects, supported by its extensive project management capabilities,
design expertise and long-standing execution track record; (ii) Vibro Group focuses on
foundation and specialist geotechnical works, enabling CTFS Construction Group to
participate from the early stages of major development projects; (iii) Quon Hing Group
supports the ready-mixed concrete business; and (iv) Hsin Chong Aster provides electrical and
mechanical engineering services. Together, these entities enable CTFS Construction Group to
serve public-sector, institutional and private-sector clients across key stages of the construction
value chain. Their integrated platform enhances tender competitiveness, supports effective
project delivery and strengthens the resilience of the Construction segment.
During FY2026, CTFS Construction Group demonstrated resilience and order book momentum
amid a challenging market environment, securing new contracts with aggregate value of
approximately HK$16.9 billion. As at 30 June 2026, the gross value of contracts on hand
increased by 7% year-on-year from approximately HK$58.5 billion to HK$62.7 billion. As
existing projects progressed and revenue was recognized during the year, remaining works to
be completed stood at a healthy HK$34.9 billion, supported by continued replenishment from
new contract wins.
CTFS Construction Group maintained a high-quality order book with strong revenue visibility
during the year. As at 30 June 2026, government and institutional-related projects accounted
for 66% of remaining works to be completed, compared with 61% a year earlier, while privatesector projects accounted for the remaining 34%. Major contracts awarded during the financial
year included the design and build of a joint user complex and public open space at Cheung
Sha Wan Road in Sham Shui Po, the construction of a public housing development at Yip On
Factory Estate, the management contract for maintenance and completion works for the
subsidized sale flats development at Anderson Road Quarry Site R2-2, and the main contract
for Pak Shing Kok ventilation building property development at Chiu Shun Road, Tseung
Kwan O Town Lot No.132. These contract awards, spanning public-sector, institutional,
private-sector and specialist works, demonstrate CTFS Construction Group’s continued
competitiveness and support revenue visibility over the near-to-medium term.
While CTFS Construction Group strengthened its order book and project mix, profitability was
affected by project margin pressure during FY2026, AOP decreased modestly by 4% to
HK$688.9 million. Against this backdrop, CTFS Construction Group continued to strengthen
project resource deployment, cost discipline and operational efficiency across projects
execution and tendering activities, while maintaining stringent accounts receivable
management to support cash collection, working capital discipline and overall cash flow
resilience. Major projects undertaken during FY2026 included the commercial development at
Caroline Hill Road in Causeway Bay, the dedicated rehousing estate at Kwu Tung North Area
24, and the residential development at Ma Wo Road in Tai Po.
12
CTFS Construction Group’s execution capabilities and innovation focus helped differentiate it
in a competitive market environment and were reflected in several industry recognitions during
FY2026. Hip Hing Group received accolades for two landmark projects: Kai Tak Sports Park
(“KTSP”), which won the Quality Excellence Award and the Grand Award in the Hong Kong
Non-Residential (New Building – Government, Institution or Community) category at the
Quality Building Award - QBAHK, and the expansion of the Legislative Council Complex,
which won the Grand Award in the Hong Kong Building (Renovation/ Revitalization) category.
Innovation was also recognized at the CIC Construction Innovation Award, where Hip Hing
Group’s Distant Tower Crane Command System and Vibro Group’s multimodal LLM-powered
robotic dog were awarded, highlighting continued progress in construction safety, site
efficiency and technical innovation. CTFS Construction Group also invested further in
strengthening the quality and technical competency of its project management and tendering
teams, supporting its ability to secure and deliver increasingly sophisticated projects.
Facilities Management
The Facilities Management segment comprises businesses spanning convention, exhibition and
venue management services, healthcare services, and sports, entertainment and retail
operations. In FY2026, segment AOP decreased by 1% year-on-year to HK$87.8 million. Solid
growth from Gleneagles Hospital Hong Kong (“GHK”) helped mitigate the impact of a lower
contribution from Hong Kong Convention and Exhibition Centre (“HKCEC”), reflecting
higher depreciation and capital expenditure, as well as the Attributable Operating Loss (“AOL”)
recorded by Kai Tak Sports Park Limited (“KTSPL”), in which the Group holds a 25% interest,
during the ramp-up phase of KTSP.
Benefiting from the continued recovery in business travel and MICE (Meetings, Incentives,
Conventions and Exhibitions) activities, HKCEC strengthened its marketing and business
development initiatives to attract both new and returning large-scale events in FY2026.
Excluding the impact of increased depreciation and capital expenditure, AOP increased by 8%
year-on-year, supported by improved exhibition and conference rental income and higher food
and beverage revenue. HKCEC maintained a diversified event portfolio spanning exhibitions,
conferences, corporate meetings, entertainment events, seminars and banquets. During FY2026,
total attendance reached approximately 7.7 million across 786 events, broadly in line with prior
year.
GHK remained a key growth driver for the Facilities Management segment during FY2026,
supported by resilient demand across Hong Kong’s healthcare sector and structural growth in
private healthcare services. As a leading private multi-specialty hospital in Hong Kong, GHK
delivered solid operational and financial performance during the financial year. Revenue
maintained its upward trajectory, while EBITDA increased strongly by 15% year-on-year. AOP
contribution to the Group surged more than fourfold. Patient volumes continued to grow, with
the number of inpatients, outpatients and day cases rising by 3%, 1% and 9%, respectively. To
accommodate growing demand and support future capacity, the number of regularly utilized
beds rose to 365 as at 30 June 2026 (30 June 2025: 337), with the average occupancy rate
maintained at 60% (30 June 2025: 64%).
13
Beyond its strong operating performance, GHK further strengthened its long-term growth
platform through medical innovation and digitalization. Following the introduction of
histotripsy treatment for liver cancer in March 2025, the medical team initiated a pancreatic
cancer clinical trial and successfully completed Asia’s first combined pancreas and liver
histotripsy procedure in April 2026. As at 30 June 2026, more than 140 histotripsy procedures
had been performed for local and overseas patients, reinforcing GHK’s leading position in
innovative cancer treatment. In March 2026, GHK also established a strategic collaboration
with the Centre for Artificial Intelligence and Robotics, Hong Kong Institute of Science &
Innovation, Chinese Academy of Sciences, to promote the clinical adoption of AI and robotic
technologies.
GHK also expanded its healthcare ecosystem and outpatient network. The launch of Gleneagles
PharmaHome, a digital pharmacy offering online purchasing and home delivery services,
improved patient convenience and broadened access to healthcare services. In parallel,
Parkway Medical Services (Hong Kong) Limited (“Parkway Medical”), a business venture
between IHH Healthcare Berhad and the Group, further expanded GHK’s integrated healthcare
network. In October 2025, Gleneagles MediCentre in Admiralty commenced operations,
offering ambulatory care services across a range of specialties and strengthening patient access
and referral pathways. Together with GHK’s existing clinic network and healthcare facilities,
comprising seven clinics and one laboratory, these platforms contributed approximately 10%
of GHK’s gross profit through direct and indirect patient referrals and related healthcare
services during FY2026. These initiatives broadened patient acquisition, enhanced service
capabilities and supported future growth.
Alongside healthcare, the Group built its presence in Hong Kong’s sports, entertainment, retail
and mega-event economy through KTSP. During its first full year of operation, KTSP
established itself as Hong Kong’s premier integrated sports, entertainment and lifestyle
destination, bringing together world-class event venues, retail offerings and community
facilities within a single precinct. Since its official opening in March 2025 and up to 30 June
2026, KTSP had attracted over 20 million visits, hosted nearly 150 major international and
local sports and entertainment events and facilitated more than 250 days of sporting activities.
Key highlights included the Hong Kong Sevens, international football matches and concerts
by globally renowned artists such as Coldplay and BLACKPINK. Utilization rates at Kai Tak
Stadium and Kai Tak Arena achieved close to 90%, underscoring strong demand and the
growing appeal of the precinct. Kai Tak Mall also delivered encouraging results, benefiting
from strong visitor traffic and retail-event synergies, with occupancy reaching approximately
87% as at 30 June 2026 (30 June 2025: approximately 80%). While KTSPL remained in the
ramp-up phase and recorded an AOL during FY2026, KTSP’s operating metrics demonstrated
growing patronage, sustained high venue utilization and increasing market acceptance.
KTSP’s rising international profile and strong operational execution were recognized through
a number of industry accolades during FY2026. Notable achievements included being named
“Venue of the Year” at TheStadiumBusiness Awards 2026 and being included in TIME’s
“World’s Greatest Places 2026”. According to leading industry publication Pollstar, KTSP
ranked third globally and first in Asia by ticket sales in 2025, despite commencing operations
only in March 2025. These achievements reinforce KTSP’s position as a leading sports and
entertainment venue in the region.
14
Strategic Investments
This segment includes investments with strategic relevance and growth potential that enhance
shareholder value. The Group consistently employs a disciplined capital allocation approach
and the aggregated carrying amount of these investments accounted for approximately 3% of
the Group’s total assets at 30 June 2026 and 30 June 2025. The diversified portfolio mainly
includes (i) various minority stakes across listed equity, private equity, venture capital and preIPO opportunities with strategic allocations to capture high-growth potential across emerging
and transformative sectors including metals and mining, infrastructure assets services, digital
healthcare, advanced information technology and artificial intelligence; and (ii) new
investment in Battery Energy Storage System (“BESS”). During FY2026, AOP of the Strategic
Investments segment increased by 6% to HK$251.4 million, primarily comprising the share of
results, net fair value changes, and interest and dividend income from various investments.
During the year, the Group actively divested a number of investments within the Strategic
Investments segment that were considered to have reached their full return potential. These
divestments have generated aggregate proceeds of approximately HK$1.3 billion. In addition,
the Group aimed to monetize its approximately 10% stake in Shoucheng through the issuance
of 0.75% Exchangeable Bonds with an aggregate principal amount of HK$2,218 million. The
bonds were issued at 103.0% of the par value, enabling the Group to secure financing on
attractive terms while retaining the potential to realize additional value should bondholders
exercise their exchange rights. The transaction strengthened the Group’s liquidity position,
broadened its funding sources and enhanced financial flexibility for future capital deployment.
Alongside capital recycling initiatives, the Group continued to invest selectively in
opportunities aligned with long-term structural growth trends. During FY2026, the Group
partnered with Unisun, a leading global renewable energy solutions service provider, to
develop BESS in Europe. The projects are intended to address the intermittency associated
with the large-scale transition towards renewable energy by providing energy storage solutions
that support grid stability and reliability. The Group’s first BESS project, located in the city of
Iisalmi, Finland, has an installed capacity of 30 megawatts (“MW”)/65.2 megawatt-hours
(“MWh”), in which the Group holds a 75% interest, with Unisun holding the remaining 25%
interest and serving as the technical lead. The project is expected to commence operation in
the first quarter of 2027 and contribute to AOP from the financial year ending 30 June 2027
(“FY2027”) onwards. Building on this collaboration, the Group is anticipated to develop a
second BESS project in Petäjävesi, Finland, with a capacity of 125 MW/250 MWh, in which
the Group will indirectly hold an 87.5% equity interest. These projects reflect the Group’s
disciplined approach to identifying opportunities with sustainable long-term demand drivers
and further expanding its presence in the European energy storage market.
15
BUSINESS OUTLOOK
Financial Services
As the Group’s core growth engine, the Financial Services segment is well positioned to deliver
sustainable long-term growth. Supported by a strong capital position, diversified distribution
capabilities and a broadening wealth management platform, CTF Life is expected to remain a
key contributor to the Group’s earnings. It will uphold disciplined underwriting standards,
robust governance and strong compliance while adapting to evolving customer needs and
regulatory developments.
Demand for protection, savings, healthcare, wealth preservation and legacy planning solutions
remains resilient across local, Chinese Mainland and overseas customer segments. Hong Kong
insurance products remain attractive due to their multi-currency features, access to global
investment opportunities and attractive wealth planning attributes. Demand from Chinese
Mainland customers is expected to remain underpinned by interest rate differentials between
Hong Kong and the Chinese Mainland, increasing protection awareness and relatively low
insurance penetration, while various talent admission schemes continue to support demand
from Hong Kong customers. The gradual reallocation of household wealth from cash and real
estate into financial assets is also expected to support long-term demand for insurance and
wealth management products.
Following the establishment of its Bermuda operation, CTF Life is scaling its international
insurance platform with a focus on serving high-net-worth customers and addressing demand
for multi-jurisdictional insurance solutions. By leveraging strategic distribution partnerships,
CTF Life Bermuda is well positioned to access internationally mobile customers across key
wealth management markets and gradually expand its overseas customer base over the medium
to long term.
To capture these opportunities, CTF Life will continue to improve its multi-channel
distribution platform, lift agency productivity, deepen broker relationships and broaden its
product offerings. CTF Life will also continue to advance the digitalization of agency
distribution channel through targeted investments in recruitment and onboarding capabilities.
Leveraging data analytics, digital technologies and artificial intelligence, the end-to-end talent
acquisition and development journey will be enhanced, enabling a more efficient and datadriven experience for agents to improve recruitment effectiveness, accelerate new advisor
productivity and strengthen talent retention. Backed by ongoing product innovation and
disciplined execution, CTF Life is well placed to achieve profitable growth while further
reinforcing its market position.
16
Beyond insurance, the Group is broadening its wealth management platform to serve the
evolving needs of affluent and high-net-worth customers in Hong Kong and overseas. The
completion of the acquisition of a 65% interest in Blackhorn in July 2026 expanded the Group’s
external asset management capabilities and is expected to contribute earnings immediately.
Blackhorn’s results will also be consolidated into the Group’s financial statements as a
subsidiary. Together with CTF Life’s insurance platform, uSMART’s digital brokerage
capabilities and the broader Chow Tai Fook Group ecosystem, Blackhorn strengthens the
Group’s ability to provide a comprehensive suite of wealth management solutions spanning
insurance, investment, securities trading, financial planning and asset management. This
integrated platform broadens the Group’s customer proposition, supports customer acquisition
and cross-selling, and differentiates CTF Life from traditional insurers by connecting insurance
with broader wealth management and lifestyle-related services.
The Group will evaluate expansion opportunities prudently, taking into account market
potential, execution capabilities and regulatory considerations. Supported by growing demand
for wealth management solutions, a diversified distribution platform and an expanding product
and service offering, the Financial Services segment remains well positioned to drive the
Group’s long-term earnings growth.
Roads
The operating environment for the toll road sector remains challenging amid both structural
and cyclical headwinds. Toll road assets continue to face uneven traffic recovery across regions,
intensifying competition from ongoing expansion of road networks, evolving traffic patterns,
and rising operational and regulatory complexities. These factors have contributed to greater
earnings volatility and a more uncertain long-term growth outlook across the sector.
Although toll roads still provide stable cash generation, the sector is increasingly characterized
by limited growth prospects and finite concession lives. Accordingly, the Group will continue
to optimize its portfolio and recycle capital from mature assets into businesses with more
attractive long-term growth and return characteristics, selectively divesting assets where riskadjusted return prospects are less compelling.
Logistics
While macroeconomic uncertainties remain, leasing demand in Hong Kong has shown
encouraging signs of recovery. Supported by its strategic location, diversified customer base
and distinctive asset characteristics, ATL is well positioned to benefit from improving logistics
and distribution activity driven by tourism, retail and consumption-related demand. The Group
will focus on maintaining healthy occupancy, extending the weighted average lease expiry and
improving lease quality, further strengthening the resilience of its income base.
Alongside its Hong Kong operations, the Group remains constructive on the outlook for
modern logistics properties in economically vibrant regions of the Chinese Mainland,
particularly the Greater Bay Area, the Yangtze River Delta, and major metropolises in Western
China. While market conditions vary across locations, selected markets have begun to stabilize,
benefiting from growing city-distribution demand, ongoing e-commerce penetration and
resilient manufacturing and export activity. In addition, the future supply of high-quality
logistics facilities in key logistics hubs remains relatively limited. The Group will continue to
pursue selective investment opportunities in modern, strategically located and incomegenerating logistics assets that meet its disciplined investment criteria, with emphasis on
attractive valuations, established tenant bases and strong cash flow visibility.
17
In September 2026, the Group completed the acquisition of another logistics property in
Jiaxing City, Zhejiang Province. Located near the Group’s existing Yangtze River Delta assets,
the acquisition further advances the regional cluster strategy by enhancing operating
efficiencies, tenant servicing capabilities, and portfolio synergies. Following completion, the
logistics portfolio expanded to thirteen properties with a total gross leasable area of
approximately 15.05 million sq ft.
CUIRC continues to benefit from the structural growth of rail freight transportation in the
Chinese Mainland. Supported by favourable national policies promoting multimodal
transportation, logistics efficiency and cross-border trade, rail freight demand is expected to
maintain long-term growth. Ongoing development of Belt and Road Initiative transportation
corridors and deeper regional trade integration are expected to further support cross-border
cargo flows. With thirteen strategically located railway container terminals across the Chinese
Mainland, CUIRC remains well positioned to benefit from these long-term trends.
Building on its established logistics facilities and rail freight network, the Group is also
expanding into digital infrastructure. Growing demand for AI computing power, together with
the resulting surge in data storage requirements, is reinforcing the strategic importance of data
centres as critical enablers of the digital economy. Backed by increasing capital expenditure
from hyperscale cloud service providers and policies promoting computing power development,
demand for data centre capacity is expected to rise further. Recognizing the favourable longterm fundamentals of the sector, the Group intends to pursue a disciplined investment approach
in the AIDC sector, focusing on assets with established customer relationships, AI-ready
expansion potential, and attractive risk-adjusted returns, with the objective of building a
portfolio of high-quality digital infrastructure assets that generates recurring income and
supports long-term growth.
In line with this strategy, the Group has committed to invest in Huailai Cloud Exchange Data
Services Co., Ltd. (“Huailai AIDC”), acquiring a 70% equity interest. Located in Huailai,
Hebei Province, a key hub within China’s “East Data, West Computing” initiative, the project
has a planned IT capacity of 50MW, of which 30MW has been delivered and secured under
long-term lease with leading domestic internet companies. The acquisition provides immediate
exposure to the rapidly growing AI computing market while generating stable income
supported by contracted occupancy. It marks an important milestone in the Group’s expansion
into digital infrastructure and the transaction is expected to be completed in the fourth quarter
of 2026, with Huailai AIDC’s financial results expected to be consolidated into the Group’s
financial statements from FY2027 onwards. In addition, the Group also has an investment in a
fully operational AIDC project in Jiangsu Province, with over 50MW of IT capacity contracted
to leading internet companies.
Besides Chinese Mainland, the Group has been exploring opportunities in overseas market in
the AIDC sector. In this regard, the Group has entered into an agreement for the acquisition of
a 40% equity interest in an AIDC project in Johor, Malaysia (“Johor AIDC”), a leading
Southeast Asian data centre hub. Designed to support IT capacity exceeding 70MW, Johor
AIDC has secured long-term lease arrangements for the majority of the project's IT capacity
and is expected to commence operations in the first quarter of 2027.
Collectively, these investments mark the Group’s entry into the data centre sector and position
it to benefit from growing demand for AI computing, data storage and digital infrastructure
services across Asia, while enhancing its portfolio of recurring-income assets.
18
Construction
The Construction segment is expected to operate against a gradually improving market
backdrop. In the residential sector, improving transaction activity and renewed developer
participation in land tenders point to an early recovery in sentiment. At the same time,
government and institutional projects are expected to remain a key driver of industry activity.
The Hong Kong Government has indicated that capital works expenditure is expected to remain
at approximately HK$128 billion per annum through 2030/31 fiscal year, underpinned by
major infrastructure, public housing and other public works projects. In addition, the Northern
Metropolis is expected to create substantial opportunities across site formation, foundations,
infrastructure and building works over the coming decade. These developments provide a
supportive demand environment and long-term project visibility for established contractors
with proven execution capabilities.
Against this supportive demand backdrop, CTFS Construction Group is well positioned to
capture upcoming public-sector, institutional and private-sector opportunities, leveraging its
integrated capabilities across building construction, foundations, concrete supply and electrical
and mechanical engineering services. Its project management, engineering and design
expertise, together with continued investment in innovative construction technologies and
data-driven solutions, enhance its ability to deliver technically demanding projects while
improving site safety, productivity, execution quality and ESG performance. Importantly, these
innovation capabilities provide a clear point of differentiation against peers, strengthening
CTFS Construction Group’s competitiveness and supporting disciplined project selection.
Together with ongoing improvements in operational efficiency, resource allocation and the
technical competency of its project and tender teams, as well as a substantial order book and
visible project pipeline, CTFS Construction Group is well placed to sustain cash generation
and pursue quality growth over the medium to long term.
Facilities Management
Benefiting from the continued recovery of tourism, business travel and healthcare demand, the
growing popularity of experience-led consumption and the Hong Kong Government’s
initiatives to promote the mega-event economy, the Group remains confident in the long-term
prospects of its Facilities Management segment. Through HKCEC, GHK and KTSP, the
segment benefits from multiple structural growth drivers linked to Hong Kong’s position as an
international business, healthcare and events hub.
19
Amid evolving industry dynamics, HKCEC continues to adapt its event portfolio to changing
market demand while leveraging the Hong Kong Government’s support for the MICE industry.
Further reinforcing confidence in Hong Kong as a leading international events destination, the
Culture, Sports and Tourism Bureau entered into a five-year collaboration arrangement with
Art Basel in March 2026, underscoring the long-term commitment of one of the world's
premier art fairs to Hong Kong. Against this backdrop, HKCEC continues to expand beyond
its traditional strengths in exhibitions and conferences. In addition to reinforcing its position
in traditional exhibition and conferences, HKCEC is actively expanding into high-growth
sectors such as cryptocurrency, Web3, fintech and innovation. It also focuses on attracting new
international organizers, converting successful one-off events into recurring series, and
broadening its geographical reach by attracting organizers from emerging markets, including
the Middle East. Reflecting this strategy, LEAP East, a technology and innovation conference
connecting the Middle East and Asia, was held in HKCEC for the first time in July 2026,
marking the commencement of a three-year agreement that establishes Hong Kong as the
exclusive Asian host city for the event. In addition, the Hong Kong International Wine & Spirits
Fair, a leading trade event for the wine and spirits industry in Asia, is scheduled to take place
in November 2026 and will move from a biennial to an annual format. Together with a growing
pipeline of new and recurring events, these initiatives are expected to further diversify
HKCEC’s event portfolio and reinforce Hong Kong’s position as a premier international
convention and exhibition destination.
Reflecting a key pillar of the segment’s growth strategy, GHK will continue to strengthen its
clinical capabilities and broaden its healthcare ecosystem. In addition to introducing advanced
therapies such as stem cell therapy and CAR-T cell therapy, GHK will undertake facility
enhancement initiatives to improve operational productivity, patient flow and overall patient
experience, including the expansion of the Professorial Clinic, enhancement of outpatient
facilities and refurbishment of inpatient accommodation. With its core hospital infrastructure
now largely established, management’s focus is increasingly shifting towards improving
utilization, operational efficiency and service intensity across its healthcare platform. Parkway
Medical plans to expand specialist services beyond the hospital setting. A new Gastrointestinal,
Hepatobiliary and Pancreatic Specialists Clinic in Central is expected to commence operations
in FY2027, further broadening its outpatient network. In parallel, strategic partnerships,
including the collaboration with The Fullerton Ocean Park Hotel Hong Kong, will enhance
GHK’s presence in wellness tourism and preventive healthcare. Collectively, these initiatives
are expected to support patient acquisition, enhance service capabilities and long-term business
growth.
Representing the segment’s exposure to sports, entertainment, retail and experience-led
consumption, KTSP is expected to benefit from the Hong Kong Government’s continued
support in promoting mega-event economy. With a robust pipeline of international events in
FY2027, including the Hong Kong Football Festival 2026, Audi Football Summit 2026, and
the CTF Life Title Sponsor: 2026 TMElive International Music Awards, which were
successfully held between July and August 2026, as well as the upcoming BIGBANG 20262027 World Tour and BTS World Tour, KTSP is well positioned to strengthen its market
leadership and regional profile. As a recently commissioned precinct, KTSP remains in a rampup phase, with additional growth expected from increasing venue utilization, event frequency
and ancillary commercial activities. Continued efforts to enhance commercial yield across
venues and retail offerings, foster synergies between sports, entertainment, retail and dining
facilities, and enrich the overall visitor experience are expected to support long-term growth
and profitability. Through these initiatives, KTSP is expected to reinforce Hong Kong’s
position as a premier destination for sports, entertainment and mega-events while generating
broader tourism and economic benefits.
20
LOOKING FORWARD
The Group will leverage its diversified business portfolio, operational expertise and disciplined
capital allocation to navigate evolving market conditions and capture opportunities arising
from long-term structural growth trends. Building on the progress achieved in FY2026, the
Group will further optimize its portfolio by recycling capital from mature businesses into
higher-growth and more scalable sectors. In particular, the Group will deepen its presence in
Financial Services and Logistics segments, which benefit from favourable long-term demand
drivers and are expected to improve the quality, resilience and growth profile of the Group’s
earnings.
While macroeconomic uncertainty, interest-rate movements and sector-specific challenges are
expected to persist, the Group remains well positioned to manage risks and pursue sustainable
growth. With a solid balance sheet, ample liquidity, diversified funding channels and prudent
financial management, the Group will maintain a disciplined approach to capital deployment
and investment selection. Along with its growing portfolio of recurring-income businesses and
focus on operational excellence, these strengths provide flexibility to pursue strategic growth
opportunities while maintaining financial resilience.
In addition, the Company’s re-inclusion in the Hang Seng Composite Index and eligibility for
the Shanghai-Hong Kong Stock Connect and Shenzhen-Hong Kong Stock Connect
programmes have further enhanced its capital markets profile. The meaningful increase in
Southbound holdings since re-inclusion reflects broader access to Chinese Mainland investors
and growing market recognition of the Group’s evolving business mix and improving earnings
quality. Supported by its portfolio optimization strategy, disciplined financial management and
expanding growth platforms, the Group remains committed to creating sustainable long-term
value for Shareholders.
21
FINANCIAL RESOURCES
Treasury management and financing structure
The Group’s funding and treasury policy is designed to maintain a diversified and balanced
debt profile and financing structure. Through a centralized treasury function, the Group
actively monitors its cash position, cash flows and debt profile, while optimizing funding
efficiency and managing financing costs. To maintain ample financial flexibility with adequate
liquidity for the Group’s operations, potential investments and growth plans, the Group has
established a strong and diversified funding base and will continue to broaden its sources of
funding which include perpetual capital securities and debt issuance in capital markets as well
as bank borrowings, both offshore and onshore, for which the mix will vary from time to time
in response to prevailing financial market conditions. The capital structure of the Group was
44% debt and 56% equity as at 30 June 20267, compared with 47% debt and 53% equity as at
30 June 2025.
In July 2025, the Company repurchased the remaining outstanding principal amount of
HK$566 million of the HK$780 million 4.0% convertible bonds due 2025 (the “4.0%
Convertible Bonds”) and issued the 2.8% Convertible Bonds. The 2.8% Convertible Bonds
were fully converted into ordinary shares of the Company during the year. This issuance
together with the subsequent conversions has successfully restored the Company’s public float
to over 25%, thereby fulfilling the minimum public float requirement and enhancing the
liquidity and trading volume of the shares of the Company.
In October 2025, the Company issued the 0.75% Exchangeable Bonds which aimed to monetize
its investment in Shoucheng and to raise financing on attractive terms, capitalizing on the
favourable capital market conditions.
In March 2026, the Company received the notice of acceptance of registration of debt financing
instruments from the National Association of Financial Market Institutional Investors for the
aggregate principal amount of up to RMB5.0 billion under the 2026 Panda Bond Programme.
The debt financing instruments are issuable within two years from the receipt of the notice of
acceptance of registration and issuance could be made by the Company in multiple tranches as
and when appropriate.
7
The 0.75% Exchangeable Bonds are being accounted for as financial liabilities at FVPL and are excluded from the
debt calculation.
22
The Group closely manages its financial risks including interest rate exposure and foreign
exchange risks. Interest rate swap contracts are used to hedge against changes in short-term
interest rates, while foreign exchange forward contracts are used to hedge against foreign
currency risk of the Group’s businesses which involve foreign currencies. Cross currency swap
contracts and RMB borrowings are used to hedge the exposure to foreign exchange risk,
stemmed mainly from RMB denominated assets. The Group’s Financial Services segment also
enters into cross currency swaps and bond forward contracts to hedge against its foreign
currency risk and interest rate risk for bond investments respectively. The Group operates
mainly in Hong Kong and the Chinese Mainland and did not have any material exposure to
foreign exchange risk other than RMB and United States dollar during the current year.
Through RMB borrowings including offshore and onshore RMB bank loans, Panda Bonds and
cross currency swap contracts, about 62% of the Group’s RMB denominated assets were
naturally hedged as at 30 June 2026 (30 June 2025: about 80%). As at 30 June 2026, Hong
Kong dollar borrowings and RMB borrowings accounted for 54% and 46% respectively of the
Group’s total debt (30 June 2025: 38% and 62%). The reduction in the hedging ratio is a
strategic move of the Group in response to prevailing RMB exchange rate trend and market
dynamics. The Group adopts a flexible and disciplined approach to foreign exchange risk
management, adjusting its hedge positions from time to time in line with market developments
while maintaining prudent control over currency exposures.
Liquidity and capital resources
As at 30 June 2026, the Group’s total cash and bank balances amounted to
HK$20,760.7 million, compared with HK$20,210.7 million as at 30 June 2025. Cash and bank
balances as at 30 June 2026 were mainly denominated as to 29% in Hong Kong dollar, 53% in
United States dollar and 18% in RMB. The Group’s Net Debt as at 30 June 2026 was
HK$11,654.5 million, decreased by 20% from HK$14,651.1 million as at 30 June 2025. The
decrease in Net Debt was mainly due to proceeds from issuance of the 0.75% Exchangeable
Bonds, classification of Net Debt of Hunan Changliu Expressway as assets and liabilities heldfor-sale, full conversion of the 2.8% Convertible Bonds, proceeds from disposal of certain noncore investments and net operating cash inflow, partly offset by certain acquisitions and capital
expenditures and payment of dividend during the current year. The Group’s Net Gearing Ratio
decreased from 37% as at 30 June 2025 to 28% as at 30 June 20268. The reduction in Net
Gearing Ratio reflects a strengthening of the Group’s balance sheet and provides a solid
foundation to support the Group’s growth initiatives, while maintaining the Group’s financial
flexibility and resilience against market volatility. The Group’s total unutilized committed
banking facilities amounted to approximately HK$10.5 billion as at 30 June 2026 (30 June
2025: approximately HK$9.6 billion).
8
If the 0.75% Exchangeable Bonds were included as debt balance, the net gearing ratio would be 33% as at 30 June
2026.
23
Debt profile and maturity
The Group continues to maintain a prudent mix of fixed-rate and floating-rate borrowings to
optimize funding costs while managing interest rate risk. The proportion of fixed-rate debt to
total debt remained at an efficient level of 68% as at 30 June 2026 (30 June 2025: 70%),
providing a balanced debt profile and reducing the Group’s exposure to interest rate volatility.
As at 30 June 2026, the Group’s total debt decreased to HK$32,415.2 million from
HK$34,861.8 million as at 30 June 2025. The Group has managed to spread out its debt
maturity profile to reduce refinancing risks. Amongst the total debt as at 30 June 2026, 24%
will mature in the next 12 months, 25% will mature in the second year, 49% will mature in the
third to fifth year and 2% will mature after the fifth year.
As a result of the continued proactive management of our debt mix amid fluctuating market
interest rates, the average borrowing cost of the Group’s debt portfolio during FY2026 was
maintained at approximately 4.1% per annum (FY2025: 4.1%).
As at 30 June 2026, the Group provided pledges over the concession rights of the operation of
certain expressways as security for bank loans made to the subsidiary companies which own
and operate the expressways. The Group also provided a pledge over a proportion of equity
interest in a joint venture as a security for bank loans of that joint venture. Besides, the Group
provided pledges over the investment properties which include certain logistics centres in the
Chinese Mainland as well as certain office units and carpark spaces in Hong Kong as security
for certain bank loans of the Group.
Commitments
The Group’s total commitments for capital expenditures were HK$1,646.6 million as at
30 June 2026, compared with HK$3,006.5 million as at 30 June 2025. These mainly comprised
commitments for capital contributions to certain associated companies and joint ventures and
acquisition of subsidiaries of HK$1,363.5 million as well as additions of property, plant and
equipment/intangible assets of HK$160.2 million. Sources of funds for capital expenditures
include internal resources of the Group and committed external financing from reputable
international banks. Besides, the Group’s insurance business had commitments for financial
investment of HK$6,072.7 million as at 30 June 2026 (30 June 2025: HK$2,905.5 million)
which will be supported by internal resources.
Financial guarantee
Financial guarantee of the Group were HK$4,539.7 million as at 30 June 2026, compared with
HK$5,133.3 million as at 30 June 2025. These comprised guarantees for banking facilities of
associated companies and joint ventures.
Under the main transaction agreement and the related transaction documents in relation to the
disposal of aircraft leasing business by Goshawk Aviation Limited (“Goshawk”) to SMBC
Aviation Capital Limited (“SMBC”), the Group provides a financial guarantee to support the
performance of Goshawk of its payment obligation to satisfy claims that may be brought by
SMBC against Goshawk. The Group’s potential liability under the financial guarantee is
limited to a total amount of US$197.1 million (equivalent to approximately
HK$1,537.4 million) as at 30 June 2026 and 30 June 2025.
24
MAJOR ACQUISITIONS AND DISPOSALS
1.
On 3 October 2025, the Company issued 0.75% Exchangeable Bonds at the price of 103.0%
of the principal amount. These bonds are unsecured, have maturity of 3 years falling due
October 2028 and listed on the Vienna MTF operated by the Vienna Stock Exchange. The
bondholders have the rights to require the Company to redeem all or part of the bonds on
3 October 2027 at their principal amount, together with accrued but unpaid interest. The
bondholders also have the right (“Exchange Rights”) to exchange the bonds into the Group’s
investment in the shares of Shoucheng which are listed on The Stock Exchange of Hong
Kong Limited.
As of the date of this announcement, the Group holds approximately 10% of the total issued
shares in Shoucheng, which is accounted for as an associated company of the Group.
Pursuant to the terms and conditions of the bonds, the Group may dispose of substantially
all of its entire shareholding in Shoucheng, if the Exchange Rights underlying the entirety of
the bonds are fully exercised by the bondholders, with the bonds being exchangeable into
the shares of Shoucheng.
During the year, no exchangeable bond was exchanged into the shares of Shoucheng.
On 13 May 2026, an indirect wholly-owned subsidiary of the Company entered into an equity
transfer agreement to dispose of its 100% equity interest in Hunan CTFS Expressway Co.,
Ltd. (“Hunan CTFS”), which is principally engaged in the operation of the ChangshaLiuyang Expressway located in Hunan Province, the People’s Republic of China, for a total
consideration of approximately RMB1.61 billion, and Hunan CTFS agreed to repay all
outstanding amount of the shareholder loan and interest of approximately RMB212 million
after the completion date. The disposal of equity interest was completed on 24 July 2026 and
Hunan CTFS has ceased to be a subsidiary of the Company since then, and the loan to Hunan
CTFS and its accrued interest have been fully repaid as at the date of this announcement.
Save as disclosed above, there was no material acquisition and disposal of subsidiaries, associated
companies and joint ventures during FY2026.
25
RESULTS
The audited consolidated results of the Group for FY2026 together with comparative figures for
FY2025 are set out as follows:
Consolidated Income Statement
For the year ended 30 June
2026
HK$’m
2025
HK$’m
22,347.3
4,752.4
20,204.7
4,080.6
2
27,099.7
24,285.3
Cost of sales
Insurance service expenses
Net expenses from reinsurance contracts held
Insurance finance expenses
Other income and gains, net
Selling and marketing expenses
General and administrative expenses
3,5
3
(19,844.2)
(3,236.3)
(41.4)
(6,553.3)
7,441.5
(102.8)
(1,031.7)
(17,568.2)
(2,765.6)
(68.2)
(5,223.4)
5,587.8
(117.2)
(897.9)
Operating profit
Finance costs
Share of results of
Associated companies
Joint ventures
3
3,731.5
(1,494.2)
3,232.6
(1,470.3)
255.8
780.0
210.4
1,055.8
3,273.1
(702.2)
3,028.5
(666.3)
Profit for the year
2,570.9
2,362.2
Profit/(loss) attributable to
Shareholders of the Company
Holders of perpetual capital securities
Non-controlling interests
2,392.6
179.2
(0.9)
2,162.0
202.3
(2.1)
2,570.9
2,362.2
HK$0.53
HK$0.52
HK$0.49*
HK$0.49*
Note
Revenue
Non-insurance
Insurance
4
3
3
Profit before income tax
Income tax expenses
6
Earnings per share attributable to
shareholders of the Company
Basic
Diluted
7
- Adjusted for the bonus shares allotted and issued in December 2025.
26
Consolidated Statement of Comprehensive Income
For the year ended 30 June
2026
HK$’m
2025
HK$’m
2,570.9
2,362.2
384.3
10.9
(74.0)
6.7
(21.4)
166.6
361.9
459.9
33.7
19.2
257.6
(147.1)
482.6
6.9
241.7
(373.3)
106.7
111.3
Other comprehensive income for the year, net of tax
1,381.7
652.5
Total comprehensive income for the year
3,952.6
3,014.7
Total comprehensive income/(loss) attributable to
Shareholders of the Company
Holders of perpetual capital securities
Non-controlling interests
3,773.5
179.2
(0.1)
2,814.3
202.3
(1.9)
3,952.6
3,014.7
Profit for the year
Other comprehensive income
Items that will not be reclassified to profit or loss
Net fair value change on equity instruments as
financial assets at fair value through
other comprehensive income (“FVOCI”)
Remeasurement of post-employment benefit obligation
Items that have been reclassified/may be subsequently
reclassified to profit or loss
Net fair value change on debt instruments as financial
assets at FVOCI and other net movement
Release of reserve upon disposal of debt instruments as
financial assets at FVOCI
Release of reserves upon partial disposal of interest in an
associated company
Share of other comprehensive income of associated
companies and joint ventures
Share of release of reserve of a joint venture
Cash flow hedges
Net insurance finance (expenses)/income
Currency translation differences
27
Consolidated Statement of Financial Position
As at 30 June
2026
HK$’m
2025
HK$’m
6,177.4
6,178.4
6,313.5
1,156.7
791.4
5,165.6
16,538.1
1,341.7
104.5
1,272.1
11,207.5
89,386.4
319.3
28.0
8,784.8
11,148.1
20,760.7
4,483.4
6,186.8
10,961.9
4,949.6
1,226.9
949.9
4,720.1
16,151.7
1,418.6
97.4
1,419.7
13,236.1
69,888.4
255.8
20.8
11,491.1
9,710.1
20,210.7
Total assets
191,157.6
172,895.6
EQUITY
Share capital
Reserves
4,566.3
35,151.5
4,009.8
33,507.0
Shareholders’ funds
Perpetual capital securities
Non-controlling interests
39,717.8
2,347.1
26.5
37,516.8
2,347.8
17.1
Total equity
42,091.4
39,881.7
LIABILITIES
Deferred tax liabilities
Insurance contract liabilities
Financial liabilities related to unit-linked contracts
Borrowings and other interest-bearing liabilities
Financial liabilities at FVPL
Derivative financial instruments
Trade and other payables
Lease liabilities
Taxation
Liabilities directly associated with assets held-for-sale
1,103.4
93,743.5
4,364.5
32,415.2
2,183.5
1,224.4
10,392.9
550.1
589.2
2,499.5
1,152.1
77,481.8
4,183.6
34,861.8
1,267.2
12,907.2
716.9
443.3
Total liabilities
149,066.2
133,013.9
Total equity and liabilities
191,157.6
172,895.6
Note
ASSETS
Intangible assets
Intangible concession rights
Investment properties
Property, plant and equipment
Right-of-use assets
Associated companies
Joint ventures
Insurance contract assets
Reinsurance contract assets
Debt instruments as financial assets at amortized cost
Financial assets at FVOCI
Financial assets at FVPL
Derivative financial instruments
Inventories
Trade and other receivables
Investments related to unit-linked contracts
Cash and bank balances
Assets held-for-sale
28
9
10
13
11
12
13
Notes:
1.
Basis of preparation and accounting policies
The consolidated financial statements have been prepared in accordance with Hong Kong
Financial Reporting Standards (“HKFRS”), Hong Kong Accounting Standards (“HKAS”)
and interpretations (collectively, the “HKFRS Accounting Standards”) issued by the Hong
Kong Institute of Certified Public Accountants (“HKICPA”). The consolidated financial
statements have been prepared under the historical cost convention, as modified by the
revaluation of investment properties, certain financial assets and financial liabilities
(including derivative financial instruments) which have been measured at fair value.
Additionally, insurance contracts issued and reinsurance contracts held are measured on a
current value basis.
(a)
Adoption of amendments to standards
During FY2026, the Group has adopted the following amendments to standards which
are relevant to the Group’s operations and are mandatory for FY2026:
HKAS 21 (Amendments)
Lack of Exchangeability
The adoption of the amendments to standards does not have significant effect on the
results and financial position of the Group.
(b)
Standards and amendments to standards which are not yet effective
The following new standards and amendments to standards are mandatory for
accounting period beginning on or after 1 July 2026 or later periods but which the
Group has not early adopted:
HKAS 21 (Amendments)
HKAS 28 (Amendments)
HKFRS 9 and HKFRS 7
(Amendments)
HKFRS 9 and HKFRS 7
(Amendments)
HKFRS 10 and HKAS 28
(Amendments)
HKFRS 18
HKFRS 19 and HKFRS 19
(Amendments)
HKFRS 20
HKFRSs Amendments
Translation to a Hyperinflationary Presentation
Currency
Amendments to the Fair Value Option for Investments
in Associates and Joint Ventures
Amendments to the Classification and Measurement
of Financial Instruments
Contracts Referencing Nature-dependent Electricity
Sale or Contribution of Assets between an Investor
and its Associate or Joint Venture
Presentation and Disclosure in Financial Statements
Subsidiaries without Public Accountability:
Disclosures
Regulatory Assets and Regulatory Liabilities
Annual Improvements to HKFRS Accounting
Standards – Volume 11
29
Basis of preparation and accounting policies (continued)
(b)
Standards and amendments to standards which are not yet effective (continued)
HKFRS 18 “Presentation and Disclosure in Financial Statements” (“HKFRS 18”)
HKFRS 18 will replace HKAS 1 “Presentation of Financial Statements”, introducing
new requirements to enhance comparability of the financial performance of similar
entities and provide users with more relevant information and greater transparency.
The adoption of HKFRS 18 would not have any impact on the recognition or
measurement of items in the Group’s consolidated financial statements, but its impacts
on presentation and disclosure are expected to be pervasive, particularly in relation to
the consolidated statement of profit or loss and disclosure of management-defined
performance measures within the consolidated financial statements. HKFRS 18 is
mandatorily effective for accounting periods beginning on or after 1 January 2027.
The Group has commenced the assessment on the impact of adoption of the new
standards and amendments to standards, certain of which may be relevant to the
Group’s operations and may give rise to changes in accounting policies, changes in
disclosures and remeasurement of certain items in the consolidated financial
statements.
30
Revenue and segment information
The Group’s revenue is analyzed as follows:
2026
HK$’m
Financial Services
Roads
Logistics
Construction
Facilities Management
2025
HK$’m
Financial Services
Roads
Logistics
Construction
Facilities Management
Hong Kong
The Chinese
Mainland
Total
4,752.4
17,915.8
1,492.6
24,160.8
2,777.8
144.2
16.9
2,938.9
4,752.4
2,777.8
144.2
17,915.8
1,509.5
27,099.7
Hong Kong
The Chinese
Mainland
Total
4,080.6
15,359.0
1,905.5
21,345.1
2,778.7
142.1
19.4
2,940.2
4,080.6
2,778.7
142.1
15,359.0
1,924.9
24,285.3
Management has determined the operating segments based on the reports reviewed by the
Executive Committee of the Company that are used to make strategic decisions in accordance
with HKFRS 8 “Operating Segments”. The Executive Committee reviews the Group’s
internal reporting in order to assess performance and allocate resources. The Executive
Committee considers the businesses of the Group from product and service perspectives,
which comprised (i) Financial Services; (ii) Roads; (iii) Logistics; (iv) Construction;
(v) Facilities Management; and (vi) Strategic Investments.
The Executive Committee assesses the performance of the operating segments based on a
measure of Attributable Operating Profit (including share of results from associated
companies and joint ventures). This measurement basis excludes the effects of non-operating
and unallocated corporate office items. Corporate interest income, finance costs and
expenses are not allocated to segments.
31
Revenue and segment information (continued)
(a)
The information of the reportable segments provided to the Executive Committee for
FY2026 and related comparative figures is as follows:
Financial
HK$’m
Facilities
Strategic
Services
Roads
Logistics Construction Management Investments
Total
Total revenue
4,754.1
2,777.8
144.2
17,915.8
1,514.6
Inter-segment
(1.7)
(5.1)
(6.8)
4,752.4
2,777.8
144.2
17,915.8
1,509.5
27,099.7
2026
Revenue – external
27,106.5
Revenue from contracts with customers
Recognized at a point in time
2,777.8
192.3
2,970.1
185.6
17,915.8
1,317.2
19,418.6
185.6
2,777.8
17,915.8
1,509.5
22,388.7
4,566.8
144.2
4,711.0
4,752.4
2,777.8
144.2
17,915.8
1,509.5
27,099.7
1,438.3
827.0
72.8
627.9
171.8
204.1
3,341.9
36.4
161.5
8.7
61.0
(84.0)
141.8
325.4
454.3
563.5
(94.5)
923.3
1,474.7
1,442.8
645.0
688.9
87.8
251.4
4,590.6
Recognized over time
Revenue from other sources
Attributable Operating Profit/(Loss)
Company and subsidiaries
Associated companies
Joint ventures
Reconciliation
Non-operating items
Loss on fair value of investment properties, net of tax
(268.6) (i)
Remeasurement and impairments
(235.8) (ii)
Loss on disposal of a project
(116.3) (iii)
Share of non-operating income of an associated company and
joint ventures, net
25.4
Gain on fair value of exchangeable bonds
70.0
Share-based payment (note 3(a))
(77.0)
(iv)
Unallocated corporate office items
Net finance costs
(1,048.8)
Expenses and others
(367.7)
Profit for the year after tax and non-controlling interests
2,571.8
Profit attributable to holders of perpetual capital securities
(179.2)
Profit attributable to shareholders of the Company
2,392.6
(i)
Loss on fair value of investment properties recognized in the consolidated income statement is HK$115.5 million (note 4), in which losses of
HK$49.0 million is recognized as part of Attributable Operating Profit in various reportable segments. The amount also includes loss on fair value
of an investment property shared from a joint venture of HK$187.1 million (net of tax) which is included in “share of results of joint ventures” and
loss on fair value of an investment property shared from an associated company of HK$15.8 million which is included in “share of results of
associated companies”.
(ii)
The amount mainly represents impairment loss on intangible concession rights of HK$105.0 million (note 9), remeasurement loss on assets classified
as held-for-sale of HK$73.7 million (note 4) and impairment loss related to an associated company of HK$37.2 million (note 4) which are included
in “other income and gains, net”.
(iii)
The amount represents loss on partial disposal of interest in an associated company of HK$116.3 million (note 4) which is included in “other income
and gains, net”.
(iv)
The amount is included as fair value change of financial liabilities at FVPL in “other income and gains, net” (note 4).
32
Revenue and segment information (continued)
(a)
The information of the reportable segments provided to the Executive Committee for
FY2026 and related comparative figures is as follows: (continued)
Financial
HK$’m
Services
Facilities
Roads
Strategic
Logistics Construction Management Investments Corporate
Total
2026
Amortization of intangible assets
100.1
6.5
31.2
137.8
1,195.8
1,195.8
Depreciation of property, plant and equipment
23.4
99.9
0.1
55.0
144.8
0.1
14.8
338.1
Depreciation of right-of-use assets
103.0
0.4
0.6
46.4
88.6
9.1
248.1
6,553.3
6,553.3
Amortization of intangible concession rights
Insurance finance expenses
Net (gain)/loss on fair value of financial assets at FVPL
(2,299.2)
1.7
(281.8)
(2,579.3)
Interest income
(3,164.5)
(67.1)
(19.4)
(20.1)
(69.6)
(20.4)
(291.9)
(3,653.0)
Finance costs
11.9
75.6
10.4
40.6
13.4
1.6
1,340.7
1,494.2
Income tax expenses
155.1
333.3
30.1
107.6
20.7
55.4
702.2
Additions to assets (remark)
174.2
39.6
1,171.4
221.3
95.7
123.5
7.2
1,832.9
125,312.4
14,041.7
4,687.6
9,998.9
2,735.4
3,116.6
9,561.3
169,453.9
350.7
2,672.0
245.2
188.2
145.3
1,561.7
2.5
5,165.6
5,967.9
9,450.7
15.0
828.4
276.1
16,538.1
Total assets
125,663.1
22,681.6
14,383.5
10,202.1
2,880.7
5,506.7
9,839.9
191,157.6
Total liabilities
99,556.4
4,652.7
696.5
8,733.9
773.8
216.2
34,436.7
149,066.2
As at 30 June 2026
Company and subsidiaries
Associated companies
Joint ventures
Remark:
Represented assets expected to be recovered more than 12 months after the reporting period other than financial instruments, deferred tax assets,
post-employment benefit assets, insurance contract assets and reinsurance contract assets.
33
Revenue and segment information (continued)
(a)
The information of the reportable segments provided to the Executive Committee for
FY2026 and related comparative figures is as follows: (continued)
Financial
HK$’m
Facilities
Strategic
Construction Management
Investments
Total
1,931.9
24,293.7
(7.0)
(8.4)
1,924.9
24,285.3
Services
Roads
Logistics
Total revenue
4,082.0
2,778.7
142.1
15,359.0
Inter-segment
(1.4)
4,080.6
2,778.7
142.1
15,359.0
2025
Revenue – external
Revenue from contracts with customers
Recognized at a point in time
2,778.7
705.9
3,484.6
189.6
15,359.0
1,219.0
16,767.6
189.6
2,778.7
15,359.0
1,924.9
20,252.2
3,891.0
142.1
4,033.1
4,080.6
2,778.7
142.1
15,359.0
1,924.9
24,285.3
3,205.3
Recognized over time
Revenue from other sources
Attributable Operating Profit/(Loss)
Company and subsidiaries
1,242.1
829.1
86.1
655.3
200.5
192.2
Associated companies
216.3
(7.5)
64.0
(112.0)
79.4
240.2
Joint ventures
394.0
661.8
(35.1)
1,020.7
1,242.1
1,439.4
740.4
719.3
88.5
236.5
4,466.2
Reconciliation
Non-operating items
Loss on fair value of investment properties
(447.9) (v)
Impairments and provisions, net
(645.5) (vi)
Net loss on disposal of projects
(152.8) (vii)
Share of non-operating income of a joint venture, net
575.7
Share-based payment (note 3(a))
(24.3)
(viii)
Unallocated corporate office items
Net finance costs
(1,010.1)
Expenses and others
(397.0)
Profit for the year after tax and non-controlling interests
2,364.3
Profit attributable to holders of perpetual capital securities
(202.3)
Profit attributable to shareholders of the Company
2,162.0
(v)
Loss on fair value of investment properties recognized in the consolidated income statement was HK$582.7 million (note 4), in which losses of
HK$131.2 million was recognized as part of Attributable Operating Profit in various reportable segments.
(vi)
The amount mainly represented share of impairment loss of a joint venture of HK$328.1 million which was included in “share of results of joint
ventures” and impairment loss on intangible concession rights of HK$311.9 million (note 9) which was included in “other income and gains, net”.
(vii)
The amount mainly represented profit on disposal of assets held-for-sale of HK$42.7 million (note 4) which was included in “other income and
gains, net” and share of loss from a joint venture of HK$206.3 million associated with its disposals of subsidiaries, including the related release of
reserves, which was included in “share of results of joint ventures”.
(viii)
The amount represented share of non-operating income of a joint venture of HK$607.8 million less professional fee incurred, which was included
in “share of results of joint ventures”.
34
Revenue and segment information (continued)
(a)
The information of the reportable segments provided to the Executive Committee for
FY2026 and related comparative figures is as follows: (continued)
Financial
HK$’m
Services
Facilities
Roads
Strategic
Logistics Construction Management Investments Corporate
Total
2025
Amortization of intangible assets
85.0
4.0
31.2
120.2
1,136.8
1,136.8
Depreciation of property, plant and equipment
29.4
99.5
0.1
54.3
111.7
0.1
14.9
310.0
Depreciation of right-of-use assets
106.8
0.3
0.6
40.1
89.9
9.0
246.7
5,223.4
5,223.4
Amortization of intangible concession rights
Insurance finance expenses
Net (gain)/loss on fair value of financial assets at FVPL
(2,531.2)
1.9
(144.8)
(2,674.1)
Interest income
(3,007.6)
(57.8)
(2.1)
(33.3)
(98.8)
(73.5)
(278.6)
(3,551.7)
Finance costs
17.5
99.3
7.7
38.5
18.4
0.2
1,288.7
1,470.3
Income tax expenses/(credit)
119.2
373.8
10.3
129.5
33.7
(0.2)
666.3
Additions to assets (remark)
385.4
56.2
16.3
329.6
109.7
3.1
900.3
152,023.8
As at 30 June 2025
Company and subsidiaries
110,327.9
14,130.6
2,950.2
10,107.6
2,558.1
3,202.3
8,747.1
Associated companies
2,392.6
264.2
167.8
183.4
1,709.4
2.7
4,720.1
Joint ventures
5,543.2
9,454.8
893.9
259.8
16,151.7
Total assets
110,327.9
22,066.4
12,669.2
10,275.4
2,741.5
5,805.6
9,009.6
172,895.6
Total liabilities
85,582.9
4,810.6
317.8
8,873.4
864.5
72.2
32,492.5
133,013.9
Remark:
Represented assets expected to be recovered more than 12 months after the reporting period other than financial instruments, deferred tax assets,
post-employment benefit assets, insurance contract assets and reinsurance contract assets.
35
Revenue and segment information (continued)
(b)
Additional information of assets and liabilities by the following line items:
As at 30 June 2026
HK$’m
Assets
Intangible assets
Intangible concession rights
Investment properties
Associated companies
Joint ventures
Insurance contract assets
Reinsurance contract assets
Debt instruments as financial assets at
amortized cost
Financial assets at FVOCI
Financial assets at FVPL
Trade and other receivables
Investments related to unit-linked contracts
Cash and bank balances
Assets held-for-sale
Others
Liabilities
Insurance contract liabilities
Financial liabilities related to
unit-linked contracts
Borrowings and other
interest-bearing liabilities
Financial liabilities at FVPL
Trade and other payables
Liabilities directly associated with
assets held-for-sale
Others
(c)
Non-financial
services and
corporate
Financial
Services
Total
270.2
6,178.4
5,812.1
4,814.9
16,538.1
5,907.2
501.4
350.7
1,341.7
104.5
6,177.4
6,178.4
6,313.5
5,165.6
16,538.1
1,341.7
104.5
618.3
2,713.0
8,279.9
13,782.9
4,483.4
2,003.3
65,494.5
1,272.1
10,589.2
86,673.4
504.9
11,148.1
6,977.8
292.1
125,663.1
1,272.1
11,207.5
89,386.4
8,784.8
11,148.1
20,760.7
4,483.4
2,295.4
191,157.6
93,743.5
93,743.5
4,364.5
4,364.5
32,102.4
2,183.5
9,963.2
312.8
429.7
32,415.2
2,183.5
10,392.9
2,499.5
2,761.2
49,509.8
705.9
99,556.4
2,499.5
3,467.1
149,066.2
Information by geographical areas:
HK$’m
Hong Kong
The Chinese Mainland
Others
Assets expected to be
recovered more than
12 months (remark)
2026
2025
10,152.2
10,316.0
149.2
20,617.4
10,345.5
13,902.2
27.4
24,275.1
Remark: Represented assets expected to be recovered more than 12 months after the reporting period
other than financial instruments, deferred tax assets, post-employment benefit assets,
insurance contract assets and reinsurance contract assets.
36
Operating profit
Operating profit of the Group is arrived at after crediting and charging the following:
Note
Crediting
Gross rental income from investment properties
Less: outgoings
Charging
Auditors’ remuneration
- Provision for current year
- Under-provision in prior years
Cost of inventories sold
Cost of construction
Amortization of intangible assets
Amortization of intangible concession rights
Depreciation of property, plant and equipment
Depreciation of right-of-use assets
Agency commission and allowances
Expenses on short-term leases
Expenses on variable lease payments
Staff costs (including directors’ emoluments and
share-based payment)
Other costs and expenses
9
(a)
Amounts attributed to insurance contracts
Amortization of insurance acquisition cash flows
Incurred claims and other directly attributable
expenses
Losses on onerous contracts, net of reversal
Represented by
Cost of sales
Insurance service expenses
Selling and marketing expenses
General and administrative expenses
(a)
5
2026
HK$’m
2025
HK$’m
228.7
(56.6)
172.1
223.2
(57.1)
166.1
22.3
0.6
90.9
15,094.4
137.8
1,195.8
338.1
248.1
2,526.5
8.2
165.6
22.3
0.6
547.8
12,776.3
120.2
1,136.8
310.0
246.7
2,506.9
7.2
120.3
3,539.8
1,443.2
3,196.2
1,283.2
24,811.3
(3,832.6)
1,262.8
22,274.5
(3,691.2)
964.6
1,976.2
(2.7)
24,215.0
1,828.9
(27.9)
21,348.9
19,844.2
3,236.3
102.8
1,031.7
24,215.0
17,568.2
2,765.6
117.2
897.9
21,348.9
The Group recognized the total share-based payment expense of HK$77.0 million
(2025: HK$24.3 million) for the current year in relation to share options granted by the
Company.
37
Other income and gains, net
2026
HK$’m
2025
HK$’m
2,579.3
2,674.1
1,896.7
70.0
1,002.6
42.7
2,540.4
589.4
44.1
479.1
739.1
156.1
2,350.0
572.9
58.9
569.9
405.5
168.0
(712.5)
(455.1)
(361.9)
(122.1)
(115.5)
(459.9)
(541.0)
(582.7)
(116.3)
(105.0)
(73.7)
(37.2)
(4.0)
(311.9)
94.8
(2.0)
2.1
(4.6)
7,441.5
(13.5)
(0.2)
12.7
5,587.8
6,841.2
600.3
7,441.5
5,477.2
110.6
5,587.8
Note
2026
HK$’m
2025
HK$’m
3
90.9
15,094.4
4,658.9
19,844.2
547.8
12,776.3
4,244.1
17,568.2
Note
Net gain on fair value of financial assets at FVPL
Net gain associated with investments related to
unit-linked contracts
Fair value change of financial liabilities at FVPL
11
Profit on disposal of assets held-for-sale
Interest income
- Debt instruments as financial assets at FVPL
- Debt instruments as financial assets at FVOCI
- Debt instruments as financial assets at amortized cost
- Bank deposits and others
Dividend income
Others
Charges associated with financial liabilities related to
unit-linked contracts
Net loss on disposal of debt instruments as financial assets
at FVOCI
Net loss on fair value of derivative financial instruments
Loss on fair value of investment properties
Loss on partial disposal of interest in an associated
company
Impairment loss on intangible concession rights
9
Remeasurement loss on assets classified as held-for-sale 13
Impairment loss related to an associated company
Net exchange (loss)/gain
Expected credit loss provision, net of reversal
- Debt instruments as financial assets at FVOCI
- Debt instruments as financial assets at amortized cost
- Trade and other receivables
Represented by
Net investment income and gains from insurance business
Others
Cost of sales
Cost of inventories sold
Cost of construction
Cost of services rendered
38
Income tax expenses
Hong Kong profits tax is provided at the rate of 16.5% (2025: 16.5%) on the estimated
assessable profits for the year. Taxation on the Chinese Mainland and overseas profits has
been calculated on the estimated taxable profits for the year at the rates of tax prevailing in
the regions in which the Group operates. These rates range from 12% to 25% (2025: 12% to
25%). Withholding tax on dividends is mainly provided at the rate of 5% or 10% (2025: 5%
or 10%).
The assessable profits of the Group’s insurance business are computed in accordance with
the special provisions of the Hong Kong Inland Revenue Ordinance (“IRO”). Profits tax for
the life insurance business, as defined by IRO, is computed at a rate of 16.5% (2025: 16.5%)
of 5% of net premiums (gross premiums received less reinsurance premiums ceded) of the
life insurance business in accordance with Section 23(1)(a) of IRO and for non-life long term
insurance business, is computed using the adjusted surplus method upon implementation of
the HKRBC regime in accordance with Cap. 41 of the Insurance Ordinance.
The amount of income tax charged to the consolidated income statement represents:
Current tax
Hong Kong profits tax
The Chinese Mainland and overseas taxation
Deferred tax credit
2026
HK$’m
2025
HK$’m
272.3
514.5
(84.6)
702.2
247.7
526.5
(107.9)
666.3
Share of taxation of associated companies and joint ventures of HK$124.8 million (2025:
HK$74.8 million) and HK$210.3 million (2025: HK$198.5 million) respectively are
included in the consolidated income statement as share of results of associated companies
and joint ventures respectively.
Pillar Two income taxes
The Group, as a subsidiary of a wider in-scope multinational enterprise group, is subject to
the Pillar Two tax reform.
Pillar Two legislation in Hong Kong were enacted on 6 June 2025, with the domestic
minimum top-up tax (“HKMTT”) and income inclusion rule (“IIR”) retroactively effective
from 1 January 2025, which are applicable to the Group from FY2026 onwards. An annual
top-up tax return in Hong Kong shall be filed by 30 September 2027. Based on the Group’s
internal assessment with the information currently available, top-up tax under Pillar Two
legislations in Hong Kong is not expected to be material, however it is subject to further
assessment and the relevant internal charging mechanism to be determined, if applicable, by
the wider group.
Other major jurisdictions where the Group operates, including the Chinese Mainland, have
not enacted or substantively enacted the Pillar Two legislations. The Group will continue the
assessment on the potential impact of Pillar Two legislations to the Group’s operations.
39
Earnings per share
The calculation of basic earnings per share for FY2026 is based on earnings of
HK$2,392.6 million (2025: HK$2,162.0 million) which represented profit attributable to
shareholders of the Company; and on the weighted average of 4,498,425,294 ordinary shares
outstanding during the year (2025: 4,400,196,166 shares after adjusting for the issuance of
bonus shares in December 2025).
The calculation of diluted earnings per share is based on earnings of HK$2,392.6 million
(2025: HK$2,162.0 million) as stated above; and on the weighted average number of
ordinary shares outstanding adjusted by the effects of all dilutive potential ordinary shares.
The calculation of weighted average number of shares for calculating diluted earnings per
share is as follows:
Number of shares
2026
Weighted average number of shares for
calculating basic earnings per share
Effect of dilutive potential ordinary shares
4.0% Convertible Bonds
2.8% Convertible Bonds
Share options
Weighted average number of shares for
calculating diluted earnings per share
2025*
4,498,425,294
4,400,196,166
4,750,959
53,210,834
6,212,420
43,914,940
4,562,599,507
4,444,111,106
- Adjusted for the bonus shares allotted and issued in December 2025.
During FY2025, the share options of the Company had an anti-dilutive effect on the basic
earnings per share as the adjusted exercise price of the share options was above the average
market price of the ordinary shares during the outstanding period, and therefore were not
included in the calculation of diluted earnings per share.
40
Dividends
Interim ordinary dividend paid of HK$0.28
(2025: HK$0.30) per share
Final ordinary dividend proposed of HK$0.33
(2025: paid of HK$0.35) per share
2025: Special dividend paid of HK$0.30 per share
2026
HK$’m
2025
HK$’m
1,278.5
1,201.6
1,506.9
2,785.4
1,422.5
1,201.6
3,825.7
At the meeting held on 24 September 2026, the Board recommended a final ordinary
dividend of HK$0.33 per share. This proposed ordinary dividend has not been recognized as
a dividend payable in the consolidated financial statements but will be reflected as an
appropriation of the retained profits in the consolidated financial statements for FY2027.
Subject to the passing of the relevant resolution at the annual general meeting of the
Company to be held on 17 November 2026 (“AGM”), it is expected that the final ordinary
dividend will be paid on or about 15 December 2026.
Intangible concession rights
2026
Note
Cost
At beginning of year
Classified as assets held-for-sale
Translation differences
At end of year
13
Accumulated amortization and impairment
At beginning of year
Amortization
Impairment
Classified as assets held-for-sale
Translation differences
At end of year
3
4
13
Net book value
At end of year
HK$’m
2025
HK$’m
24,246.6
(5,284.4)
1,405.2
20,367.4
23,858.9
387.7
24,246.6
13,284.7
1,195.8
105.0
(1,218.1)
821.6
14,189.0
11,632.8
1,136.8
311.9
203.2
13,284.7
6,178.4
10,961.9
Intangible concession rights refer to the Group’s investment in and operations of toll roads
in the Chinese Mainland. During FY2026, the Group has conducted an impairment
assessment of the recoverability of the intangible concession rights based on value in use
approach using discounted cash flow method incorporated the assumptions developed with
reference to prevailing market conditions and historical performance. According to the
assessment, an impairment loss related to intangible concession rights of HK$105.0 million
(2025: HK$311.9 million) was recognized by the Group in FY2026 and included in “other
income and gains, net”.
41
- Trade and other receivables
Included in trade and other receivables are trade receivables which are analyzed based on
invoice date as follows:
2026
HK$’m
2025
HK$’m
1,550.3
2.8
106.5
1,659.6
1,711.3
22.9
119.0
1,853.2
Under 3 months
4 to 6 months
Over 6 months
-
Financial liabilities at fair value through profit or loss
The balance as at 30 June 2026 represented HK$2,218.0 million exchangeable bonds
issued by the Company in October 2025 at a price of 103.0% of the principal amount
bearing a coupon rate of 0.75% per annum. These bonds are unsecured and have maturity
of three years falling due October 2028. The bondholders have the rights to require the
Company to redeem all or part of the bonds on 3 October 2027 at their principal amount,
together with accrued but unpaid interest. The bondholders also have the right, at any
time on or after the issue date and up to the maturity date, to exchange the bonds into
exchange property initially consisting of the Group’s investment in the shares of
Shoucheng, which is subject to adjustments pursuant to the terms and conditions of the
exchangeable bonds. During the current year, no exchangeable bond was exchanged into
the shares of Shoucheng.
As at 30 June 2026, the aggregate fair value of the exchangeable bonds amounted to
HK$2,183.5 million and a gain of HK$70.0 million (note 4) arising from the change in fair
value during the current year is included in “other income and gains, net”.
-
Trade and other payables
Included in trade and other payables are trade payables which are analyzed based on invoice
date as follows:
Under 3 months
4 to 6 months
Over 6 months
42
2026
HK$’m
2025
HK$’m
945.2
3.0
37.6
985.8
872.1
24.0
46.9
943.0
- Assets held-for-sale/Liabilities directly associated with assets held-for-sale
In May 2026, the Group entered into an equity transfer agreement for the disposal of its entire
equity interest in Hunan CTFS, at a consideration of approximately RMB1.61 billion
(equivalent to HK$1,861.3 million). As at 30 June 2026, the assets and liabilities of Hunan
CTFS were classified as held-for-sale and were measured at the lower of carrying amount
and fair value less costs to sell. A remeasurement loss of HK$73.7 million was recognized
by the Group after taking into account of the cost to perfecting the title and included in “other
income and gains, net” in FY2026. The disposal was completed on 24 July 2026 and the
shareholder’s loan to Hunan CTFS and its accrued interest have been fully repaid as at the
date of this announcement.
The assets and liabilities classified as held-for-sale as at 30 June 2026, which have been
presented separately in the consolidated statement of financial position, are as follows:
Assets held-for-sale
Intangible concession rights
Property, plant and equipment
Trade and other receivables
Cash and bank balances
Less: remeasurement loss on assets classified as held-for-sale
Note
HK$’m
9
4,066.3
56.5
10.1
424.2
4,557.1
(73.7)
4
4,483.4
Liabilities directly associated with assets held-for-sale
Borrowings and other interest-bearing liabilities
Loan from shareholder and accrued interest
Trade and other payables
Taxation
Less: loan from shareholder and accrued interest
(2,438.9)
(245.9)
(60.3)
(0.3)
(2,745.4)
245.9
(2,499.5)
- Comparative figures
Certain comparative figures for FY2025 have been reclassified or extended to conform with
the presentation for FY2026.
43
FINAL DIVIDEND AND BONUS ISSUE OF SHARES
The Company is committed to delivering a sustainable and progressive dividend policy. The
aim of its dividend policy is to steadily increase or at least maintain the Hong Kong dollar
value of total ordinary dividend annually. The prospective total dividend growth, however,
remains dependent upon the financial performance and future funding needs of the Group.
The Board has accordingly resolved to recommend a final ordinary dividend (the “Final
Dividend”) of HK$0.33 per share for FY2026 (FY2025: HK$0.35 per share in cash with a scrip
option), payable in cash, to the Shareholders whose names appear on the register of members
of the Company on 23 November 2026. Together with the interim ordinary dividend of
HK$0.28 per share for FY2026 (FY2025: interim ordinary dividend of HK$0.30 per share and
special dividend of HK$0.30 per share) paid in April 2026, total distribution of dividend by
the Company for FY2026 will be HK$0.61 per share (FY2025: HK$0.95 per share).
Subject to the passing of the relevant resolution at the AGM, it is expected that the Final
Dividend will be paid on or about 15 December 2026.
The Board has also proposed to make a bonus issue of shares to the Shareholders on the basis
of one bonus share for every ten shares held by the Shareholders whose names appear on the
register of members of the Company on 23 November 2026 (the “Bonus Issue”). The Bonus
Issue is conditional upon the passing of the relevant resolution at the AGM and the Listing
Committee of The Stock Exchange of Hong Kong Limited granting the listing of and
permission to deal in the new shares to be issued under the Bonus Issue. The bonus shares will
be credited as fully paid and will rank pari passu in all respects with the existing Shares, save
that they will not be entitled to the Final Dividend. No fractional bonus shares will be allotted.
Fractional entitlements will be aggregated and dealt with for the benefit of the Company.
Details about the Bonus Issue will be set out in a circular to be sent to the Shareholders in
October 2026. Immediately after the Bonus Issue, it is expected that the Company will continue
to comply with the public float requirement under the Listing Rules.
CLOSURE OF REGISTER OF MEMBERS
For the purposes of determining Shareholders’ eligibility to attend and vote at the AGM and
entitlement to the Final Dividend and the Bonus Issue, the register of members of the Company
will be closed. Details of such closures are set out below:
For determining eligibility to attend and vote at the AGM:
Latest time to lodge transfer documents for registration
Closure of register of members
Record date
AGM date
4:30 pm on 11 November 2026
12 to 17 November 2026
(both days inclusive)
17 November 2026
17 November 2026
For determining entitlement to the Final Dividend and the Bonus Issue:
Latest time to lodge transfer documents for registration
4:30 pm on 20 November 2026
Closure of register of members
23 November 2026
Record date
23 November 2026
Despatch of share certificates of the bonus shares
on or about 15 December 2026
Final Dividend payment date
on or about 15 December 2026
44
During the above closure periods, no transfer of shares will be registered. To be eligible to attend
and vote at the AGM and to qualify for the Final Dividend and the Bonus Issue, all properly
completed transfer forms accompanied by the relevant share certificates must be lodged for
registration with the Company’s branch share registrar in Hong Kong, Tricor Investor Services
Limited, at 17/F., Far East Finance Centre, 16 Harcourt Road, Hong Kong no later than the
aforementioned latest time.
EMPLOYEES AND REMUNERATION POLICIES
As at 30 June 2026, approximately 10,700 staff were employed by entities under the Group’s
management of which approximately 3,800 staff were employed in Hong Kong. Total staff related
costs including provident funds, staff bonus and deemed share option benefits but excluding
directors’ remunerations and their deemed share option benefits during FY2026 were HK$3.42
billion (FY2025: HK$3.105 billion). Remuneration packages including salaries, bonuses and share
options are granted to employees according to individual performance and are reviewed according
to general market conditions every year. Structured training programmes were provided by the
Group to employees on an ongoing basis.
AUDIT COMMITTEE AND REVIEW OF ANNUAL RESULTS
The Audit Committee of the Company was set up by the Board with specific terms for the purpose
of reviewing and providing supervision over the Group’s financial reporting process, and risk
management and internal control systems. It currently comprises three independent non-executive
directors of the Company. The Audit Committee has reviewed the accounting principles and
practices adopted by the Group and the audited consolidated financial statements of the Group for
FY2026 with the management and the external auditor.
The figures in respect of the Group’s consolidated statement of financial position, consolidated
income statement, consolidated statement of comprehensive income and the related notes thereto
for FY2026 as set out in the preliminary results announcement have been agreed by the Group’s
auditor, PricewaterhouseCoopers (“PwC Hong Kong”), to the amounts set out in the Group’s
audited consolidated financial statements for FY2026. The work performed by PwC Hong Kong
in this respect did not constitute an assurance engagement in accordance with Hong Kong
Standards on Auditing, Hong Kong Standards on Review Engagements or Hong Kong Standards
on Assurance Engagements issued by the HKICPA and consequently no assurance has been
expressed by PwC Hong Kong on the preliminary results announcement.
CORPORATE GOVERNANCE PRACTICES
The Company has been striving to achieve good corporate governance which is the system of rules,
processes and practices that the Company is managed and overseen for the purpose of balancing
the interests of shareholders, the community and other stakeholders. Good corporate governance
could contribute to long-term success and sustainability of the Company.
Throughout FY2026, the Company has complied with all the applicable code provisions under the
Corporate Governance Code as contained in Appendix C1 of the Listing Rules.
45
PURCHASE, SALE OR REDEMPTION OF LISTED SECURITIES
On 18 July 2025, the Company completed the repurchase of the 4.0% Convertible Bonds at a price
equivalent to 100% of the principal amount. An aggregate outstanding principal amount of
HK$566 million of the 4.0% Convertible Bonds has been repurchased.
Save as disclosed above, neither the Company nor any of its subsidiaries has purchased, sold or
redeemed any of the Company’s listed securities (including sale of treasury shares) during FY2026.
DEALINGS IN THE COMPANY’S SECURITIES BY DIRECTORS
AND RELEVANT EMPLOYEES
The Company has adopted the Code for Dealing in Securities of the Company by Directors of the
Company and Relevant Employees of the Group (“Dealings Code”) as its own code of conduct for
governing the securities transactions by directors and specified employees (“Relevant Employees”)
who, because of their positions, are likely to come across unpublished inside information. Specific
enquiry was made with all directors of the Company and the Relevant Employees and it was
established that they had all complied with the required standard of the Dealings Code during
FY2026.
THE BOARD
As at the date of this announcement, (a) the executive directors of the Company are Dr Cheng Kar
Shun, Henry, Mr Cheng Chi Ming, Brian, Mr Ho Gilbert Chi Hang, Mr Lam Jim and Mr Cheng
Chi Leong, Christopher; (b) the non-executive directors of the Company are Mr William Junior
Guilherme Doo (alternate director to Mr William Junior Guilherme Doo: Mr Lam Wai Hon, Patrick)
and Mr Tsang On Yip, Patrick; and (c) the independent non-executive directors of the Company
are Mr Shek Lai Him, Abraham, Mr Lee Yiu Kwong, Alan, Mrs Oei Wai Chi Grace Fung, Mr
Wong Kwai Huen, Albert, Professor Chan Ka Keung, Ceajer and Ms Ng Yuen Ting, Yolanda.
By order of the Board
CTF Services Limited
Dr Cheng Kar Shun, Henry
Chairman
Hong Kong, 24 September 2026
46