|
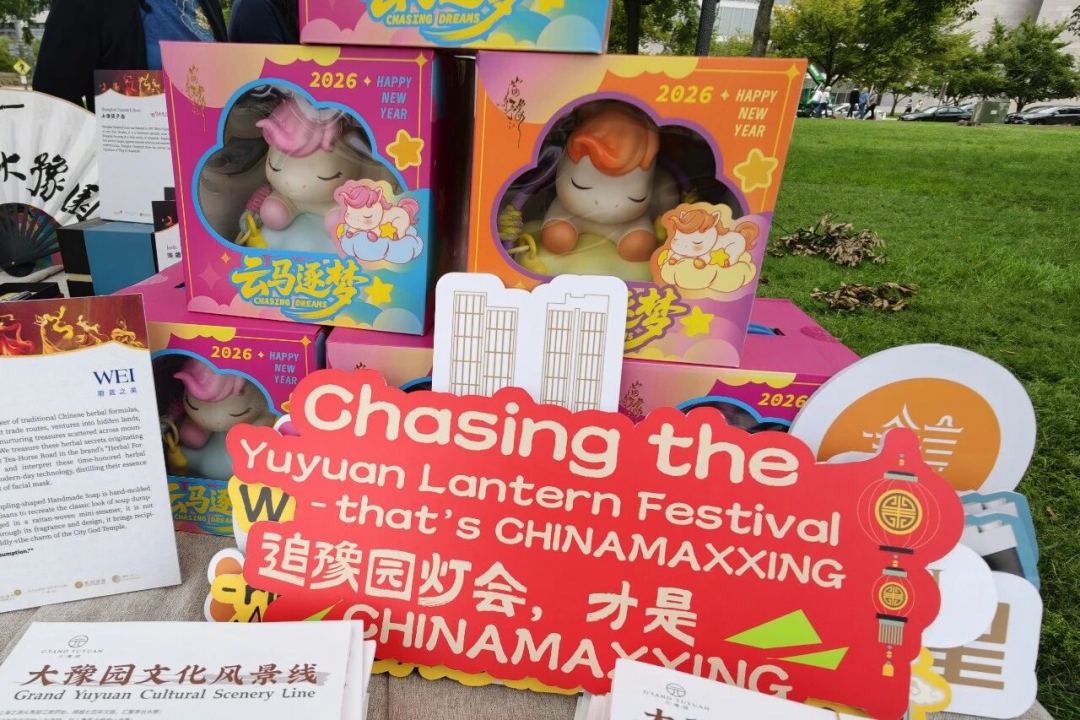
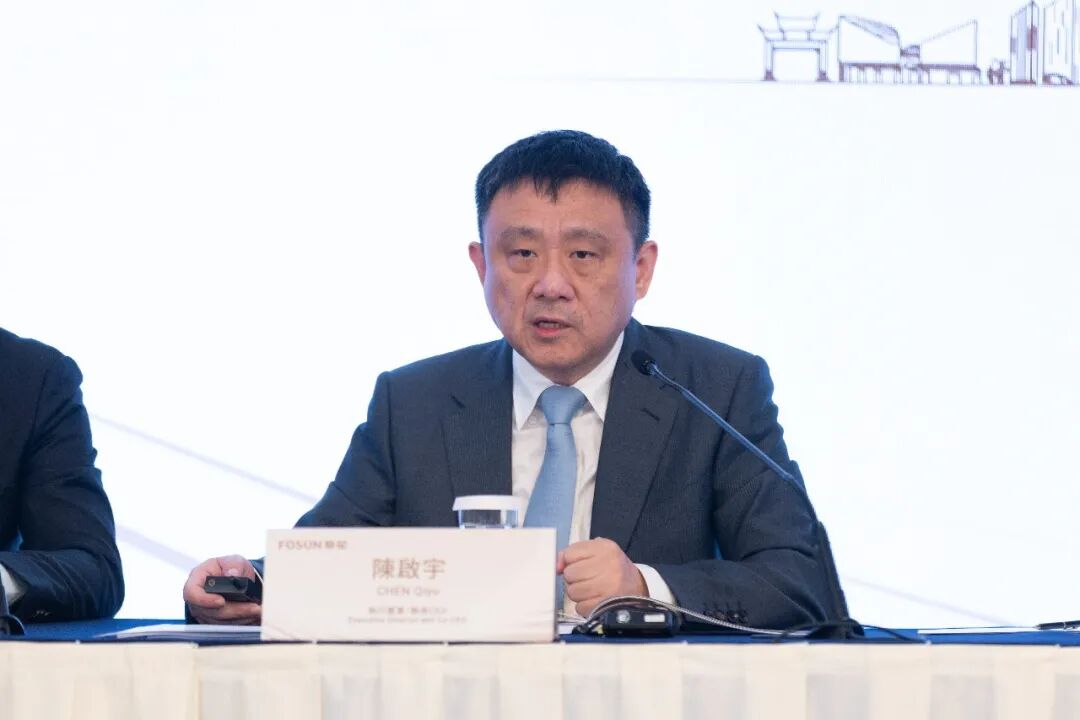
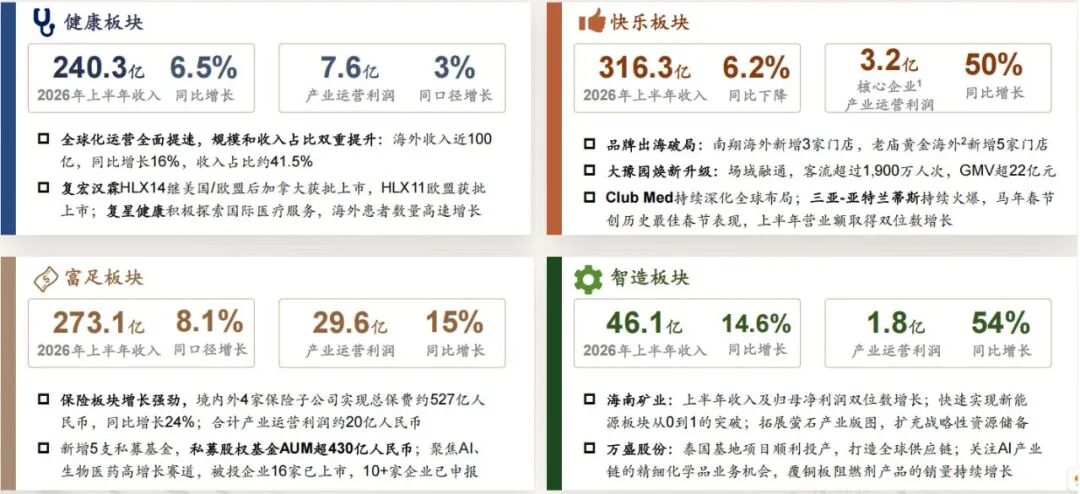
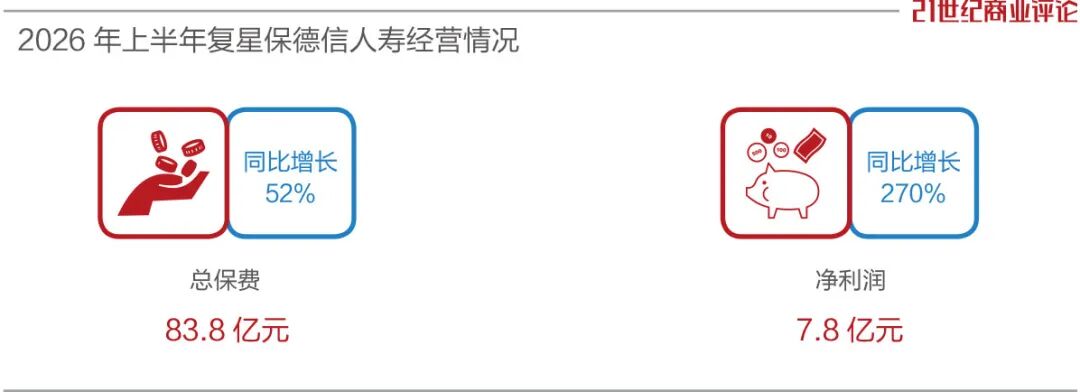
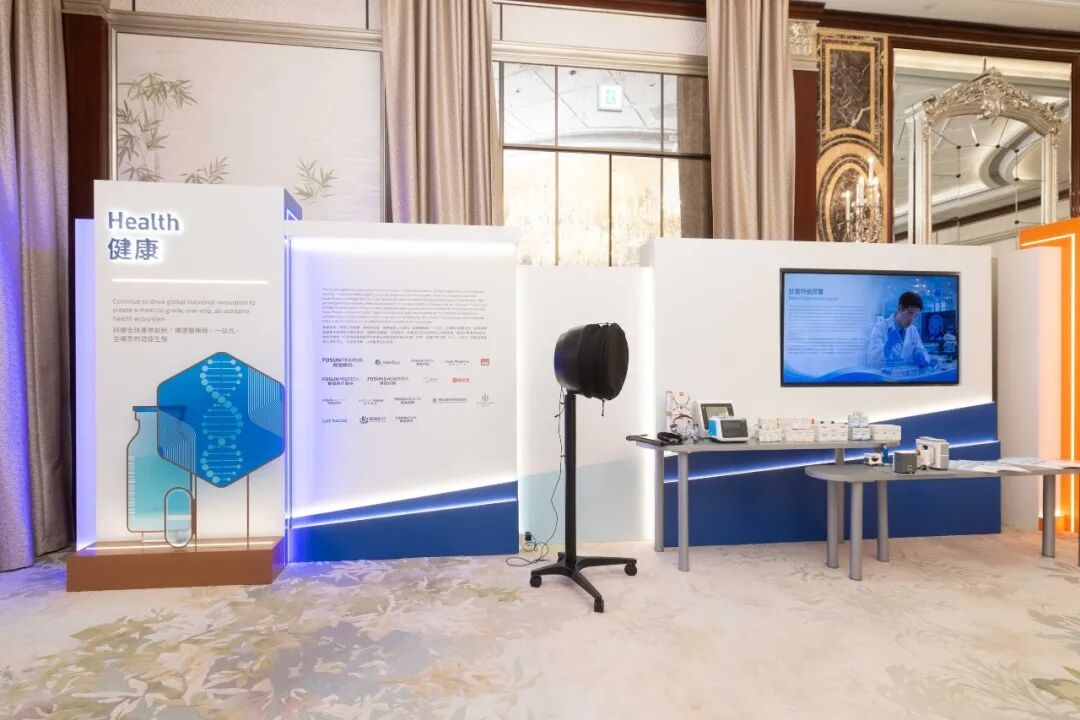
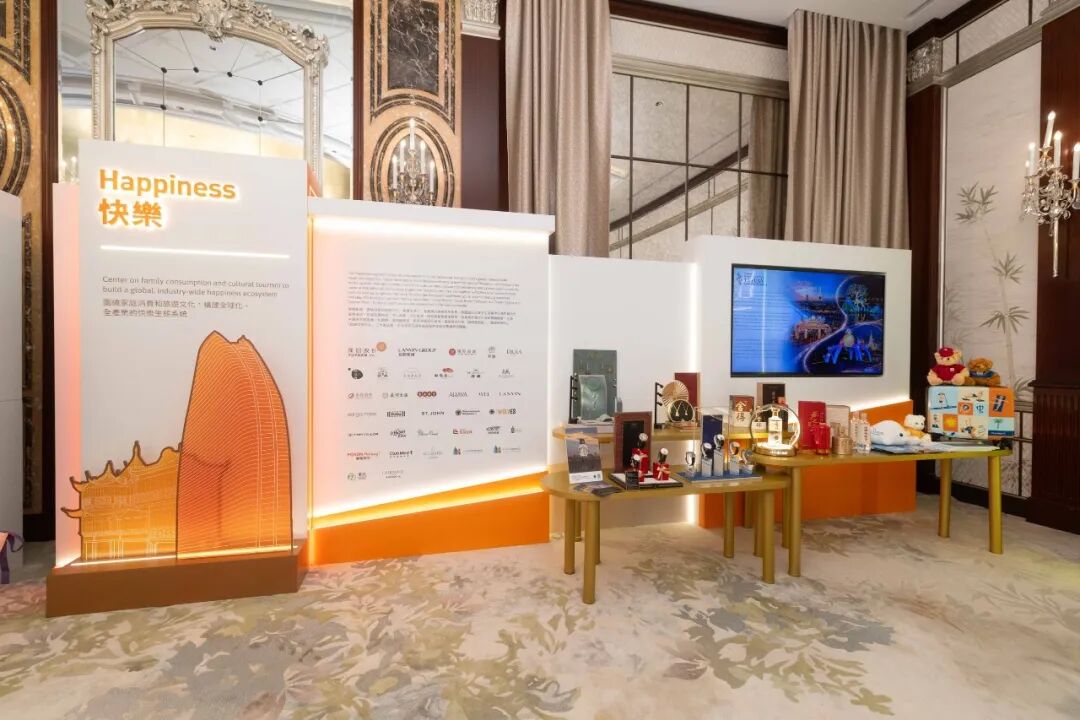
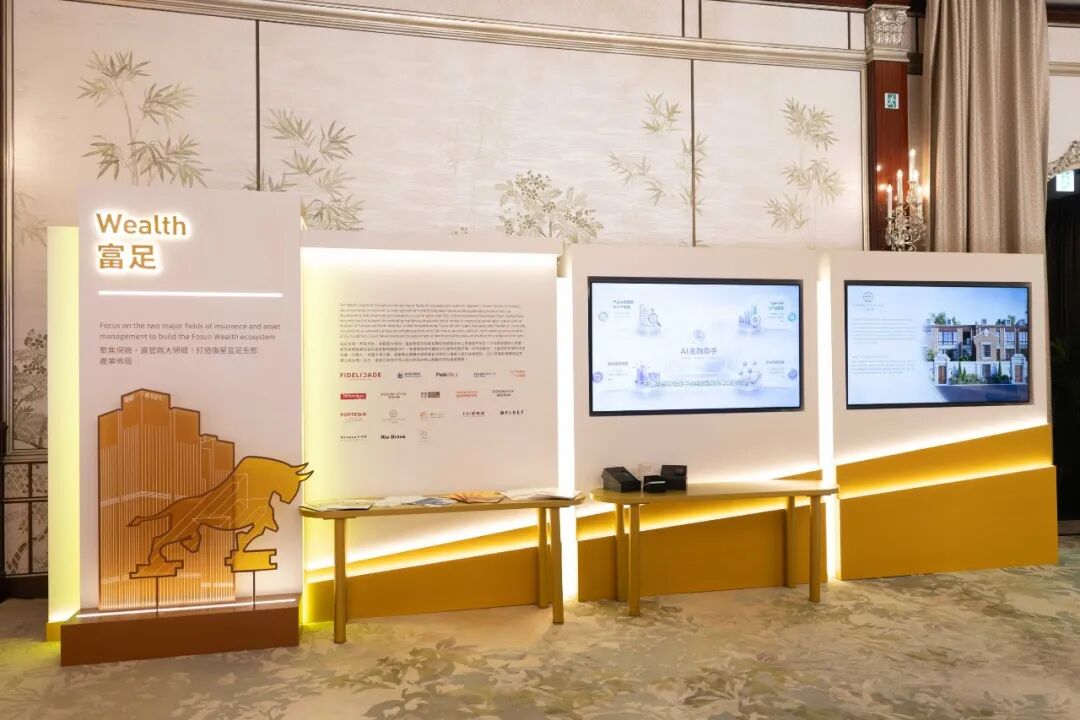
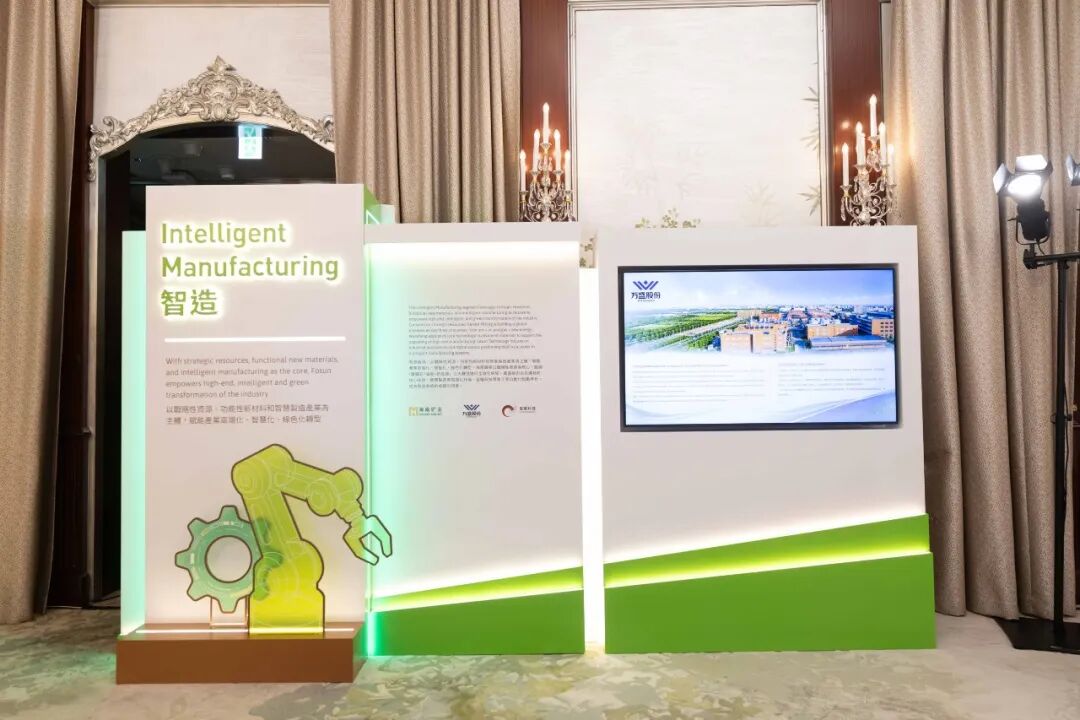
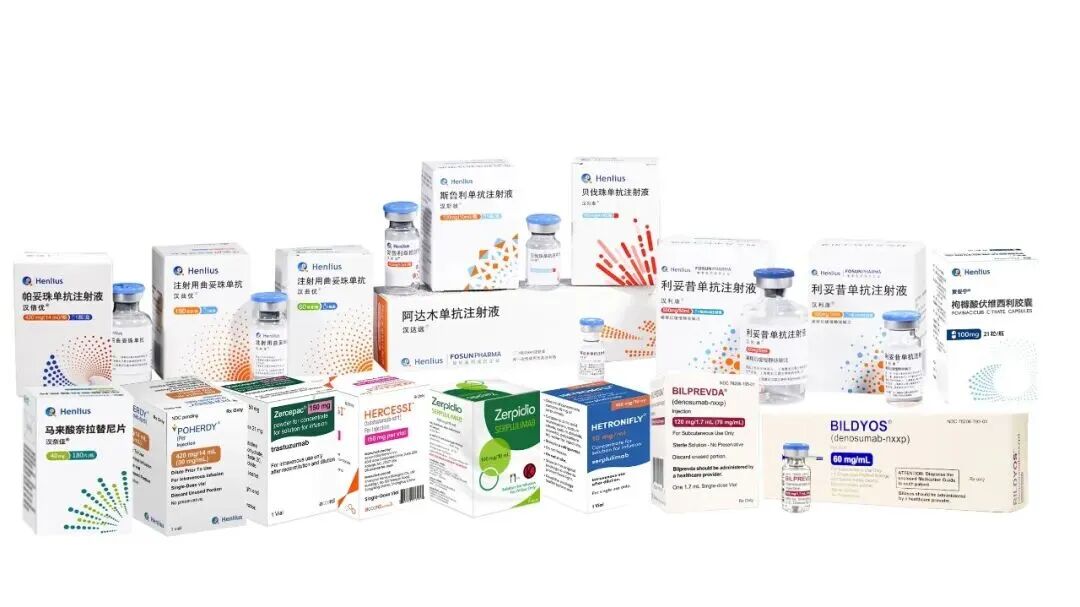
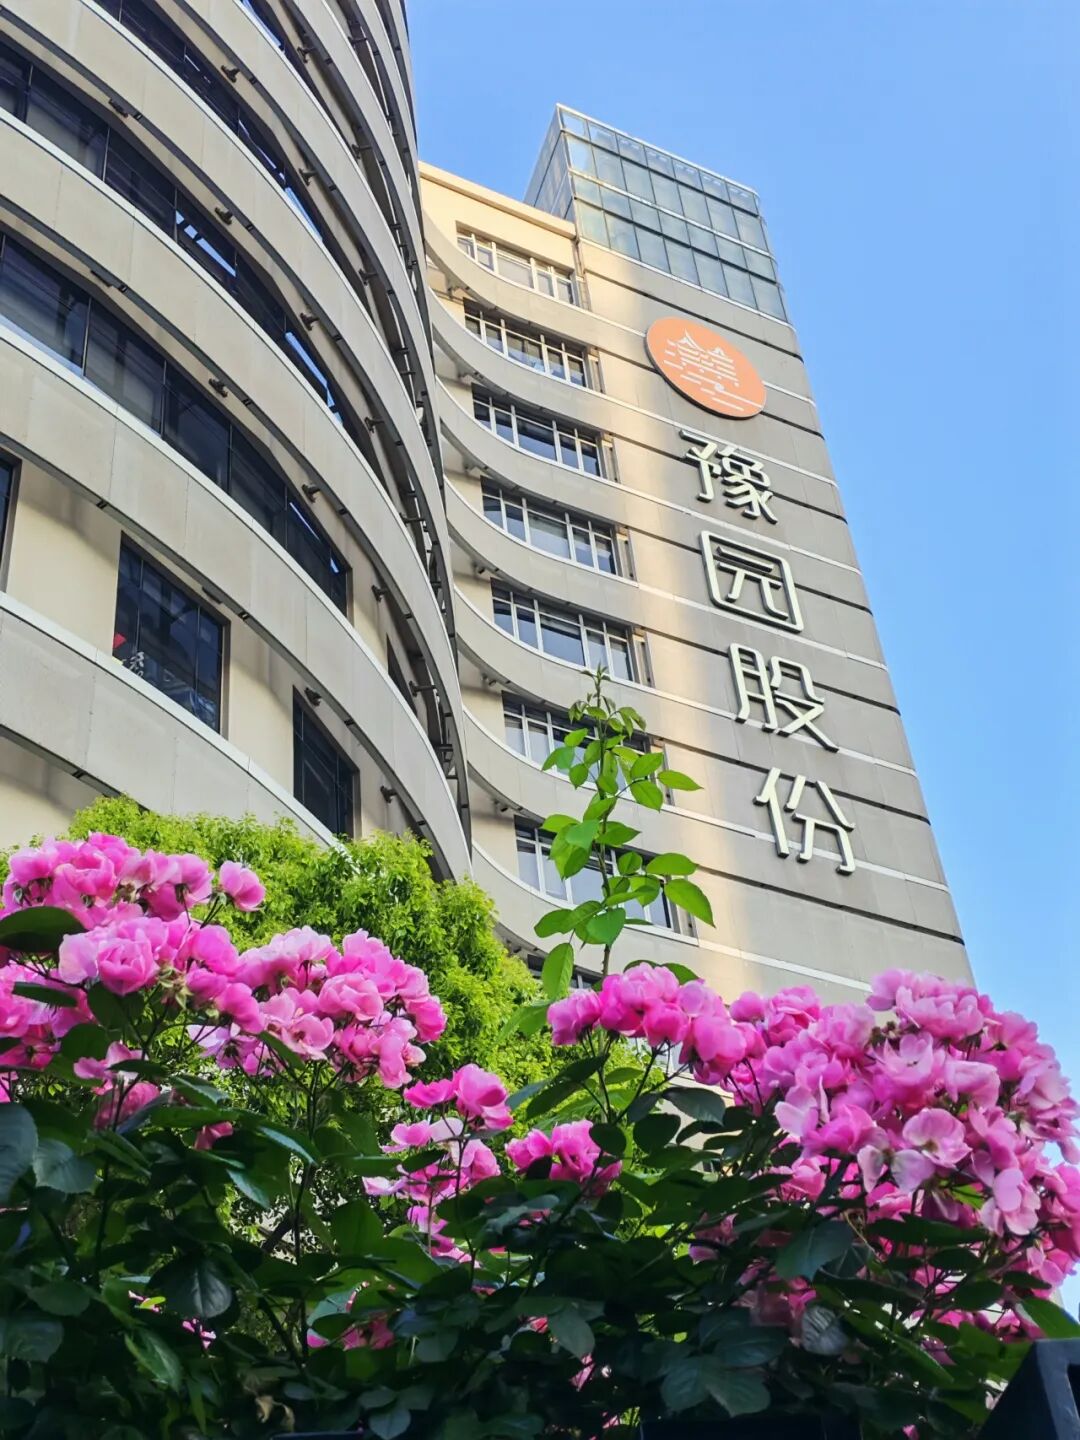
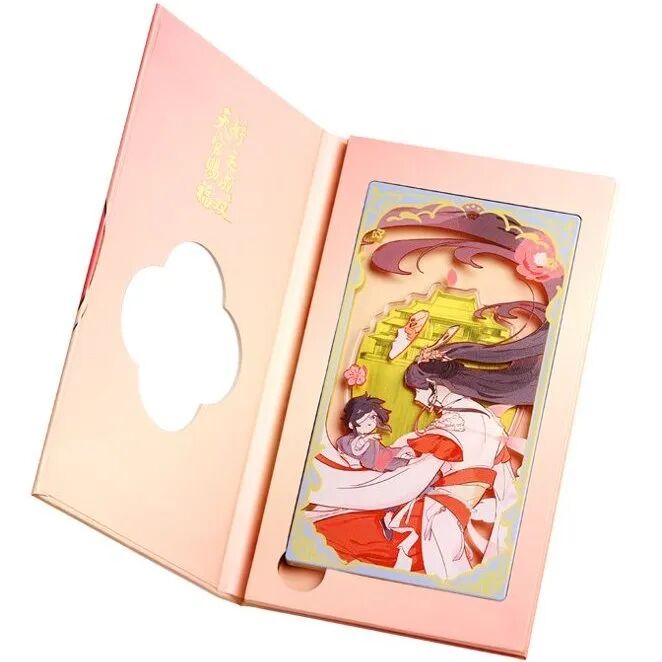
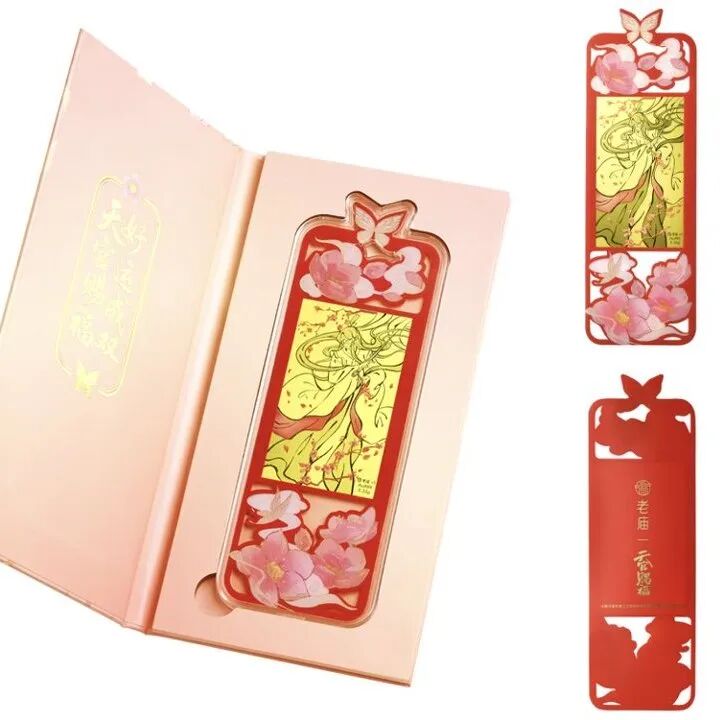
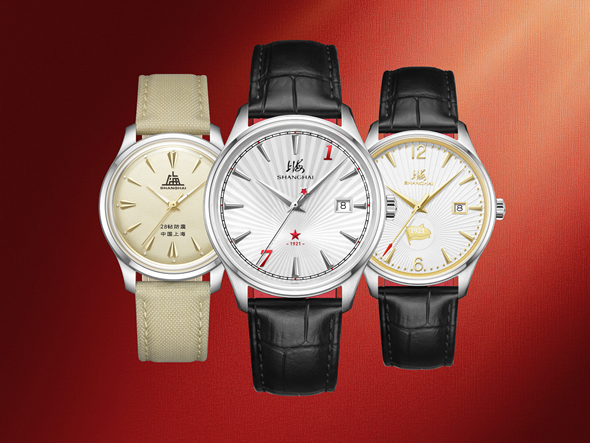
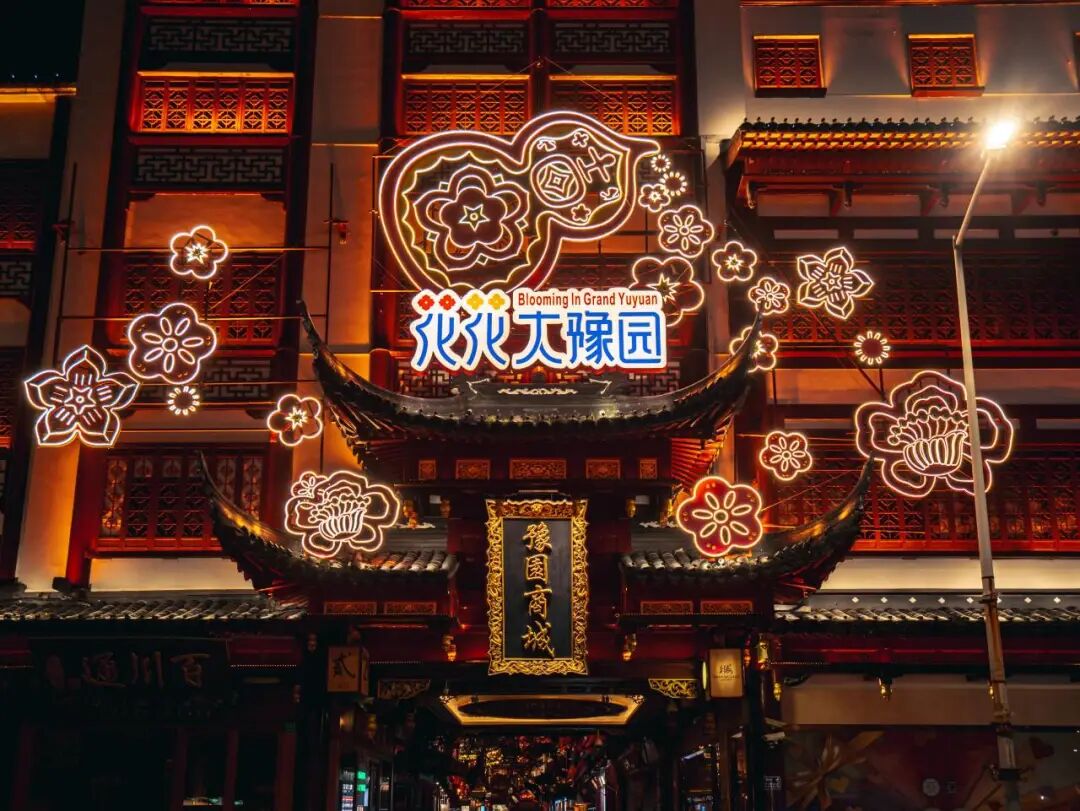
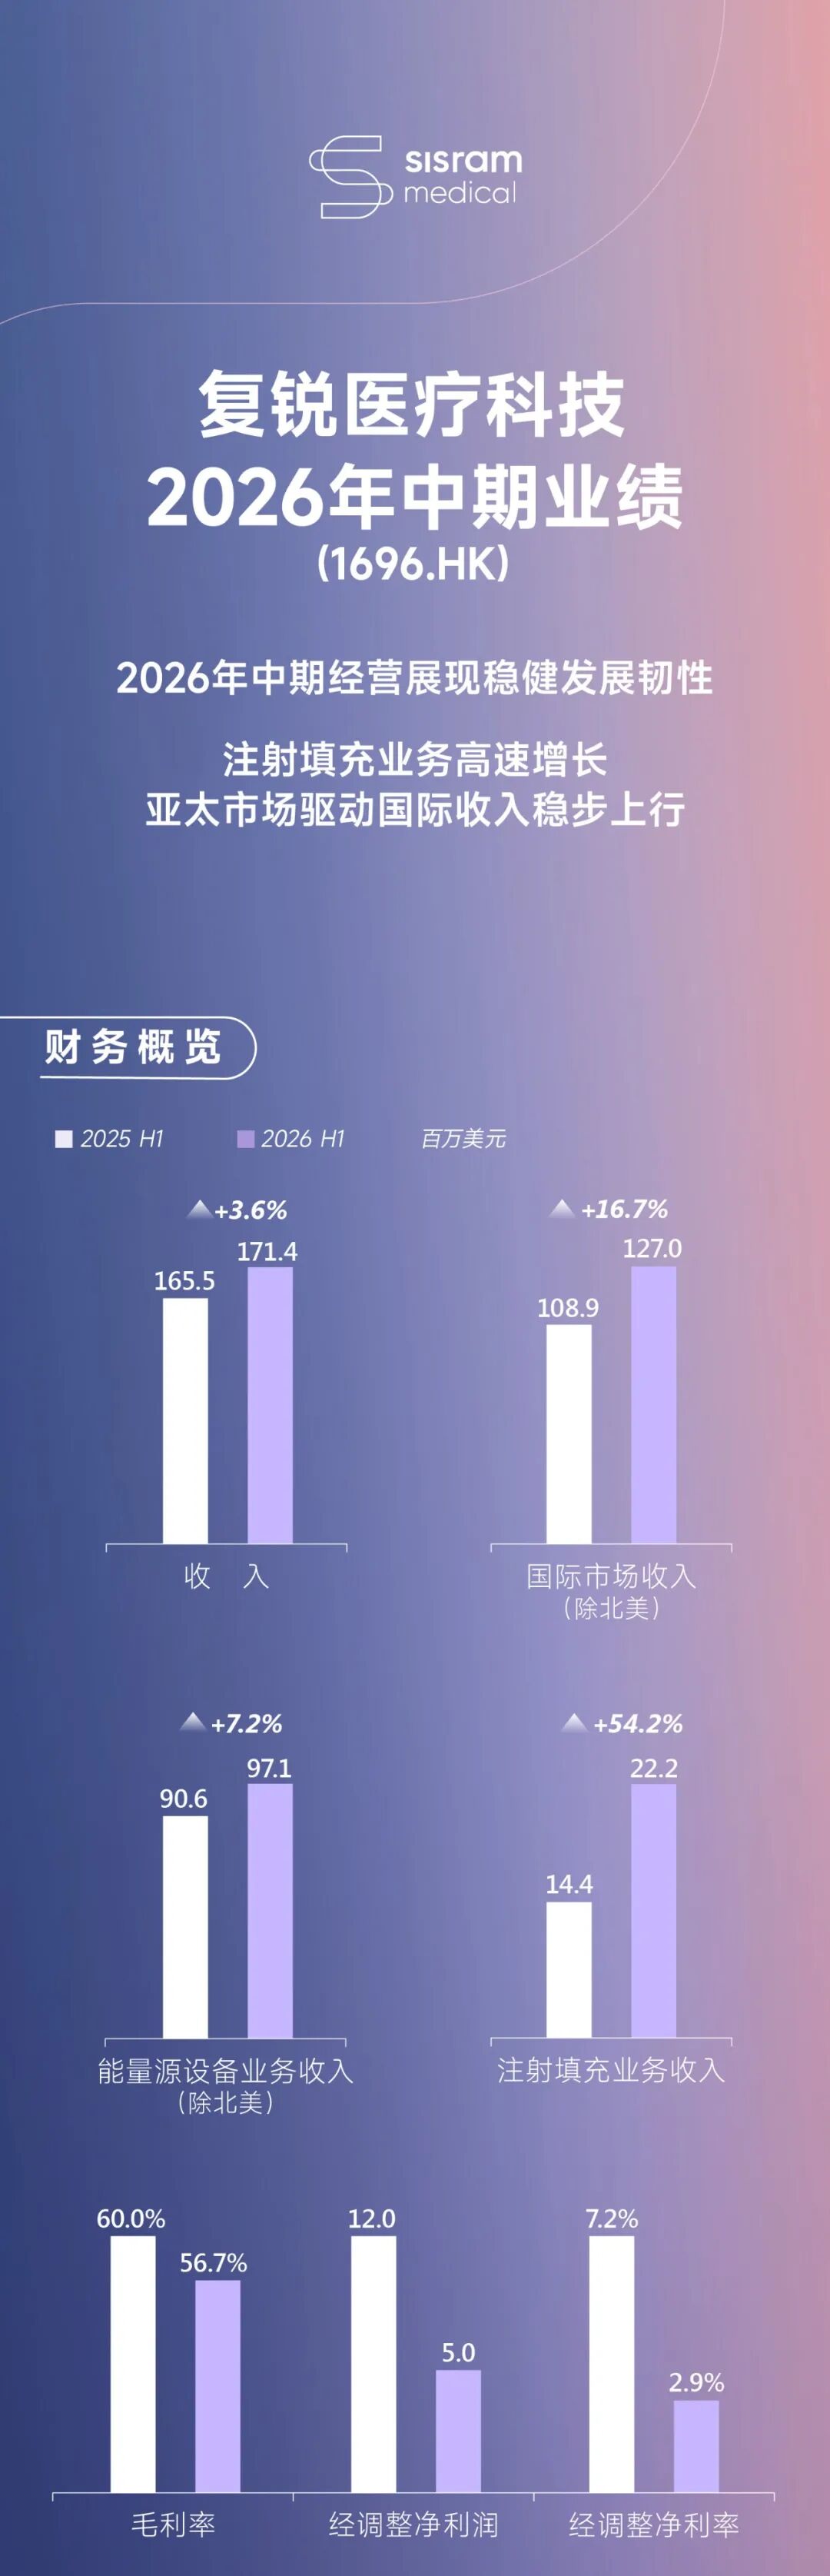
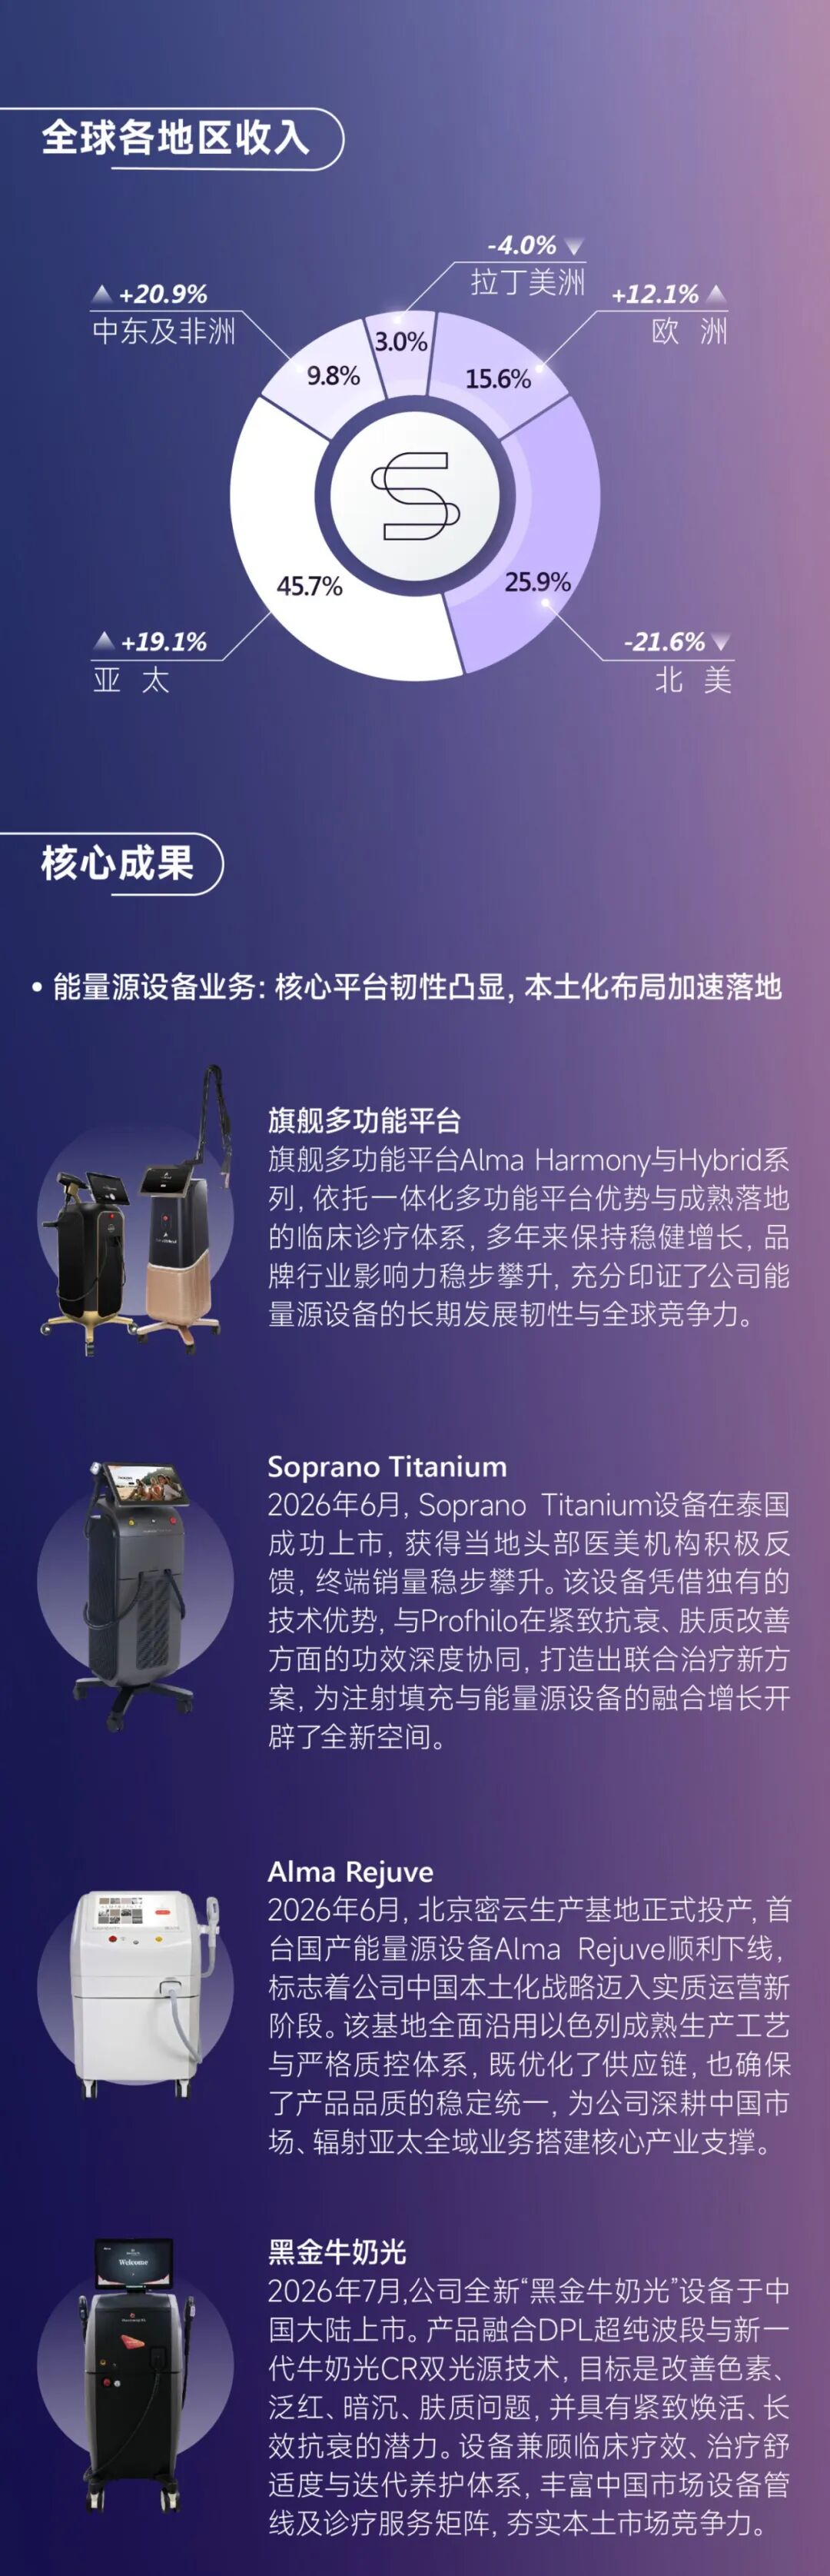
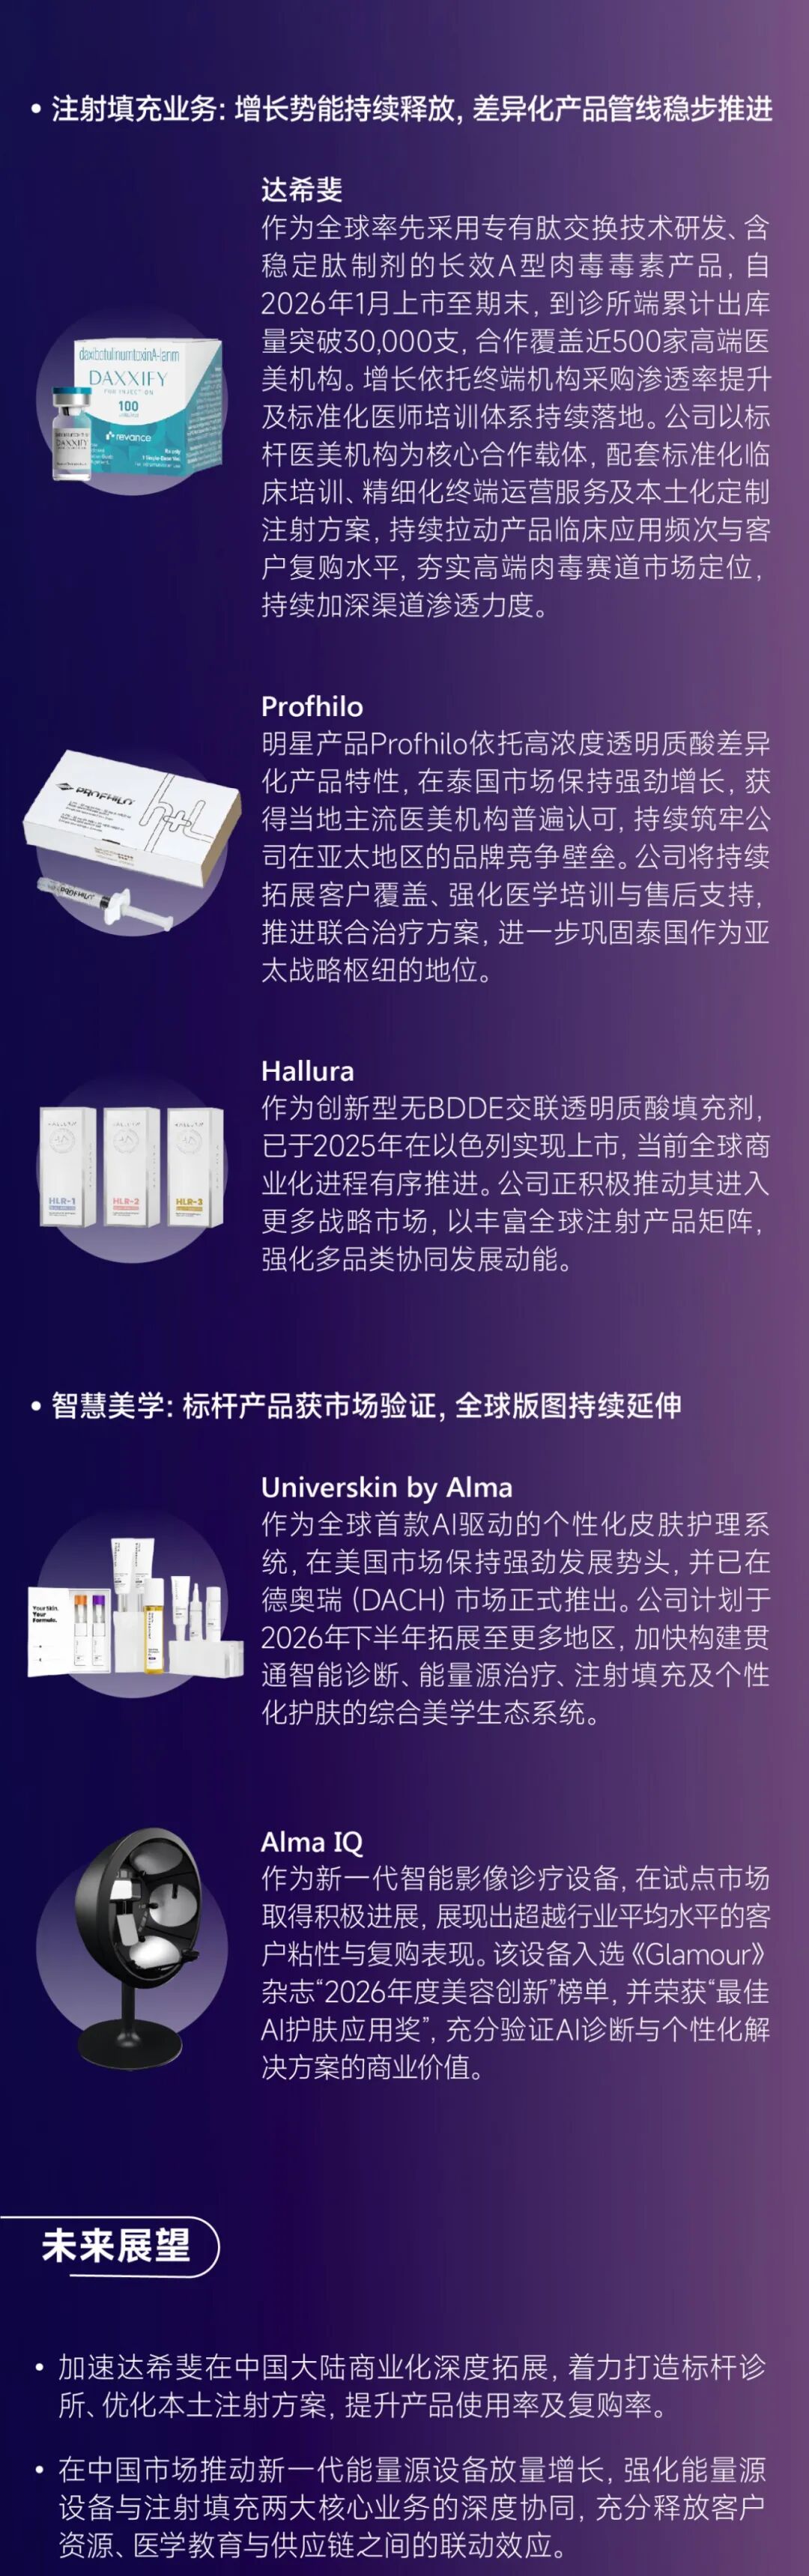
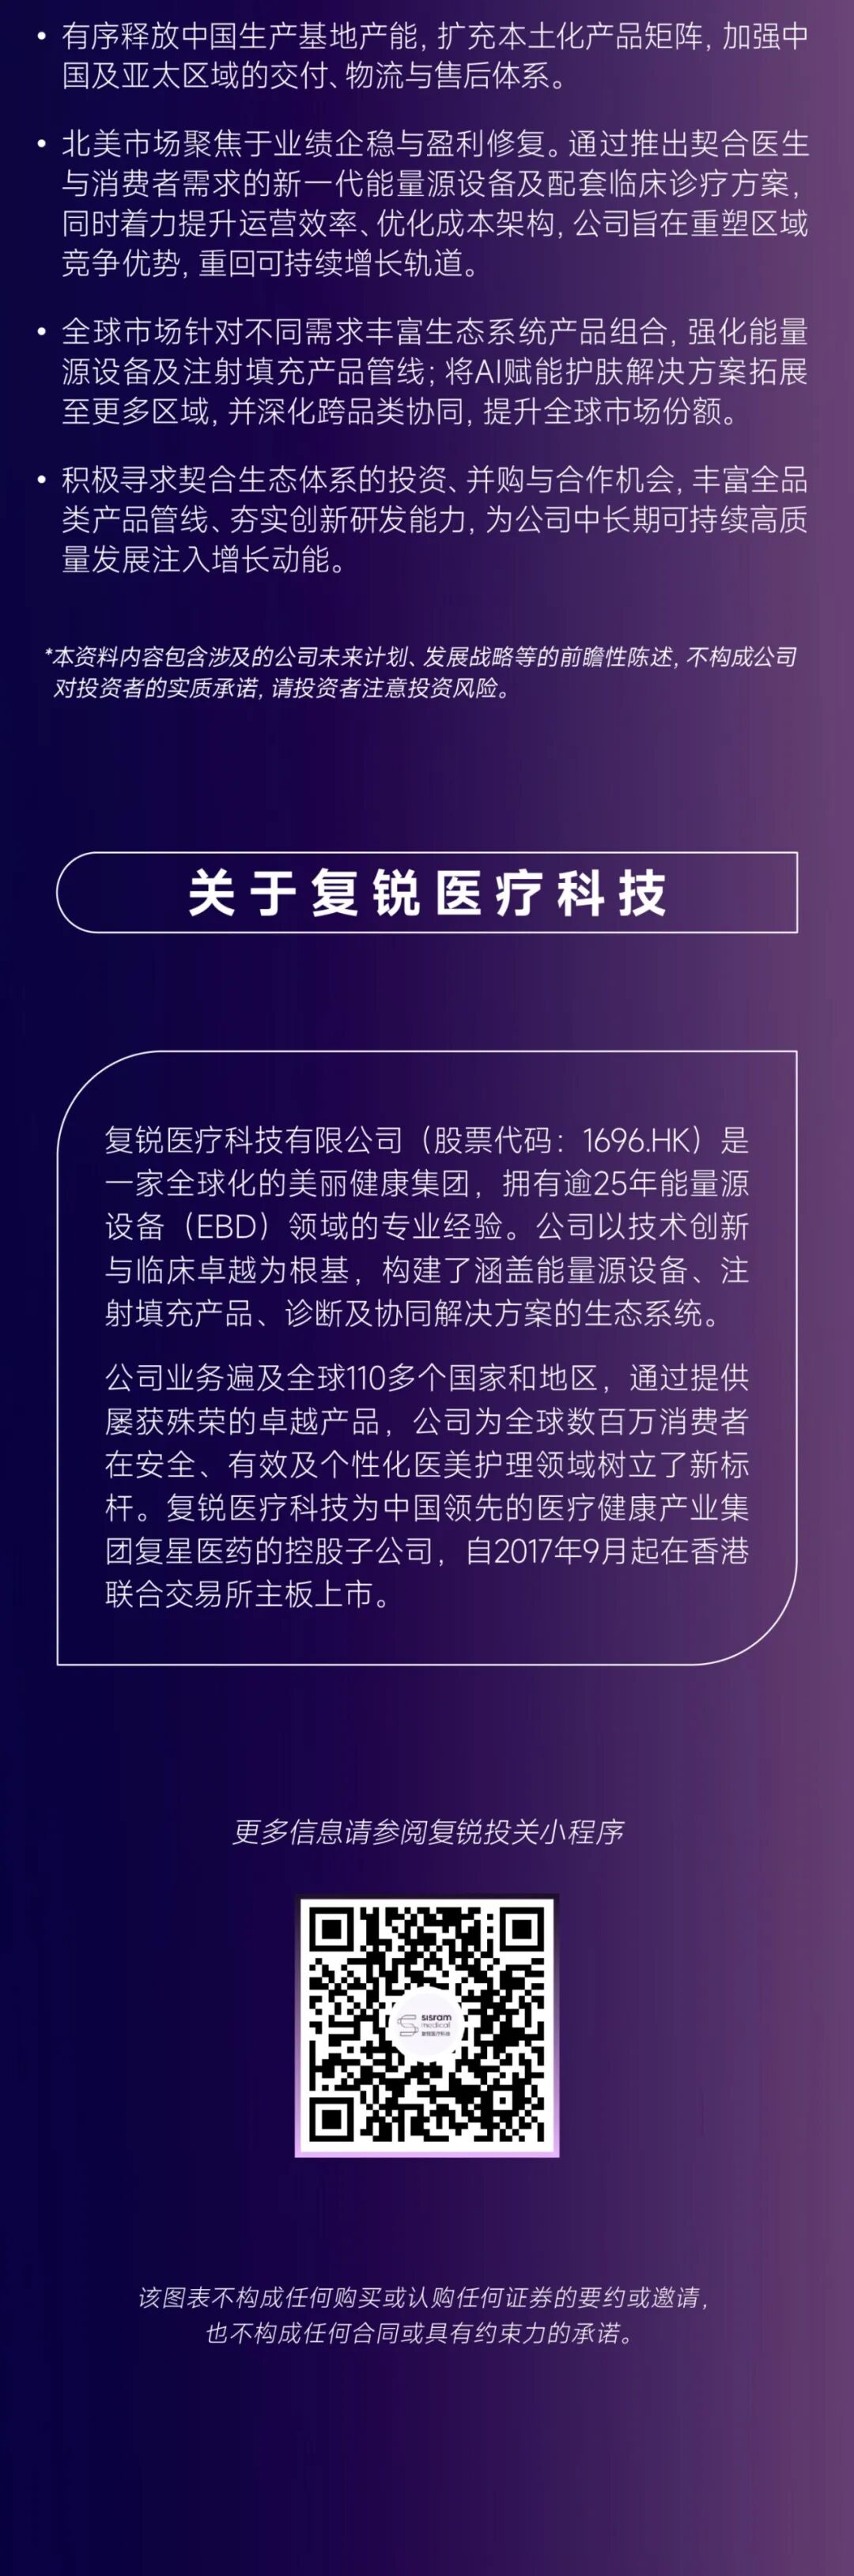
Fosun International Limited is a global consumer group operating across four main business segments: Health, Happiness, Wealth, and Intelligent Manufacturing. The Health segment includes pharmaceuticals, medical devices, and healthcare services through subsidiaries such as Fosun Pharma, Henlius, Gland Pharma, and Sisram. The Happiness segment focuses on brand consumer goods and tourism, featuring brands like Club Med, Atlantis Sanya, Lanvin, and Yuyuan. The Wealth segment provides insurance and asset management services via Fosun Insurance, Peak Reinsurance, and Fosun Capital. The Intelligent Manufacturing segment covers resources, environment, and technology through Hainan Mining and Easun Technology. The company serves customers in China and international markets, including Europe, North America, and Asia-Pacific, with a focus on global family consumption. Summarised from the company's own disclosures, fiscal year ended Apr 2026 |
Industry Conglomerates | Homepage fosun.com |
| Sector Industrials | IR page fosun.com | |
|
Tags
pharmaceuticals, biotechnology, medical devices, insurance, asset management, tourism, luxury goods, mining, intelligent manufacturing, Fosun Pharma, Henlius, Gland Pharma, Sisram, Fosun Health, Club Med, Atlantis Sanya, Lanvin, Yuyuan, Fosun Insurance, Peak Reinsurance, Fosun Capital, Hainan Mining, Easun Technology, Fosun United Health Insurance, Pramerica Fosun Life Insurance, Fosun Insurance Portugal, Luz Saúde, Shanghai Zhuli, Sanyuan Foods, Shede Spirits, Jinhui Liquor, BFC, Fosun Sports, IDERA, PAREF, St Hubert, 28 Liberty, Shanghai Insight, Fosun RZ Capital, Wansheng, Fosun Wealth, Fosun Care
|
Press page — |
Metrics
| Valuation | |
|---|---|
| Market cap | HK$ 36B |
| Market cap (USD) | $ 4.588B |
| P/E | -1.37 |
| PEG | — |
| P/BV | 0.18 |
| P/S | 0.18 |
| P/OCF | 1.01 |
| P/FCF | — |
| Dividend yield | — |
| Turnover / mcap | 0.15% |
| Returns | |
|---|---|
| ROE | -12.8% |
| ROI | -6.0% |
| ROIC | -6.0% |
| Profit margin | -13.5% |
| Growth | |
|---|---|
| Revenue growing | No |
| Profits growing | No |
| Revenue up 3y | No |
| Revenue up 5y | No |
| Earnings growth 3y (net profit CAGR) | — |
| Quality | |
|---|---|
| Profitable | No |
| Margin expanding | No |
| Buying back stock | Yes |
| Diluting (TTM) | No |
| Debt/Equity | 133.2% |
| Podcast bulls (TTM) | Sign up |
| Podcast bears (TTM) | Sign up |
| Podcast sentiment (TTM) | Sign up |
| Podcast sentiment % (TTM) | Sign up |
| News sentiment (TTM) | 0 |
| Quality score | -50.0% |
| Insiders | |
|---|---|
| Buys, 1w | Sign up |
| Buys, 1m | Sign up |
| Buys, 1y | Sign up |
| Sells, 1w | Sign up |
| Sells, 1m | Sign up |
| Sells, 1y | Sign up |
Sign up to see this company's insider trades
| Figure | FY 2025 | FY 2024 | FY 2023 | FY 2022 | FY 2021 | FY 2020 | FY 2019 | FY 2018 | FY 2017 | FY 2016 | FY 2015 | FY 2014 | FY 2013 | FY 2012 | FY 2011 | FY 2010 |
|---|---|---|---|---|---|---|---|---|---|---|---|---|---|---|---|---|
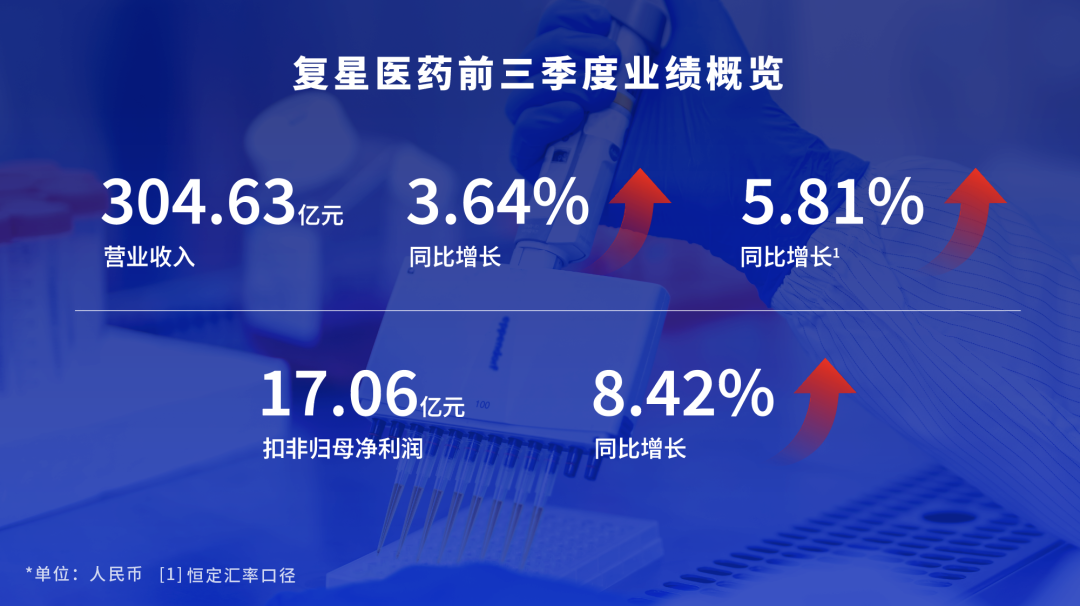
| Revenue | 173.425B | 192.142B | 198.2B | 182.426B | 161.291B | 136.629B | 142.982B | 109.352B | 88.025B | 73.967B | 78.797B | 61.738B | 51.017B | 51.765B | 56.816B | 44.644B |
| Net profit | -23.396B | -4.349B | 1.379B | -831.803M | 10.09B | 8.018B | 14.801B | 13.406B | 13.161B | 10.268B | 8.038B | 6.854B | 5.519B | 3.707B | 3.404B | 4.227B |
Sign up to see institutional holdings
Sign UpPodcast Mentions
Sign up to see podcast mentions and sentiment
Sign UpAnnouncements and reports published on HKEXnews, newest first, monthly and next-day returns, proxy forms and board-meeting notices included. The link opens the announcement on HKEXnews. Press releases from the company's own website, newest first.


































































Prompts
Click prompts to add them under the company line, click again to take one out, then copy the result into your AI chat. Shared by Asian Century Stocks and Uncovered Thai Stocks. Thank you.
ETFs Holding Fosun International Limited
Exchange-traded funds whose newest published daily portfolio holds one of the company's listings, largest weight first.
| ETF | Weight in ETF | Shares | Market value | As of |
|---|---|---|---|---|
| FEMR | 0.13% | 413,601 | $ 209.89K | Jun 30, 2026 |
| AVEE | 0.13% | 296,500 | $ 170.567K | Nov 16, 2026 |
| MEMA | 0.12% | 21,500 | $ 15.235K | Aug 31, 2026 |
| AVEM | 0.03% | 11,921,500 | $ 6.858M | Nov 16, 2026 |
| NTSE | 0.02% | 21,500 | $ 10.912K | Jun 30, 2026 |
| DFEM | 0.01% | 1,754,500 | $ 1.046M | Nov 12, 2026 |
| DFEV | 0.01% | 216,500 | $ 129.023K | Nov 12, 2026 |
| DFAX | 0.01% | 1,060,892 | $ 632.236K | Nov 12, 2026 |
| DFAE | 0.00% | 650,500 | $ 387.664K | Nov 12, 2026 |