|
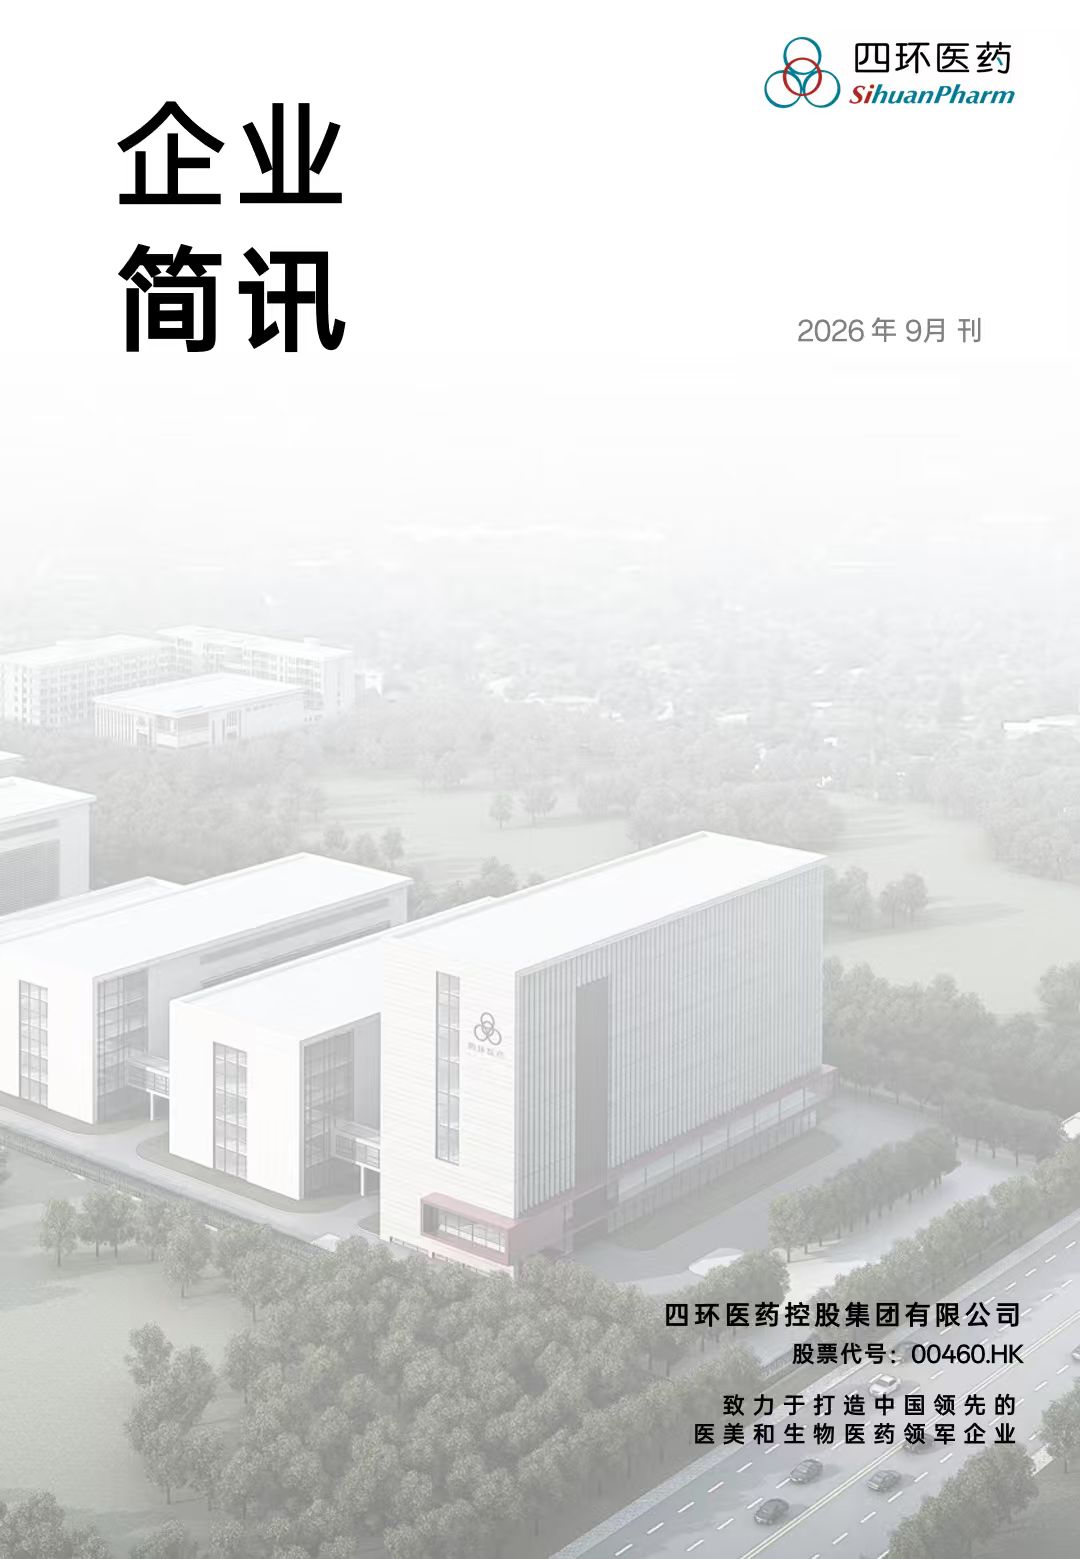
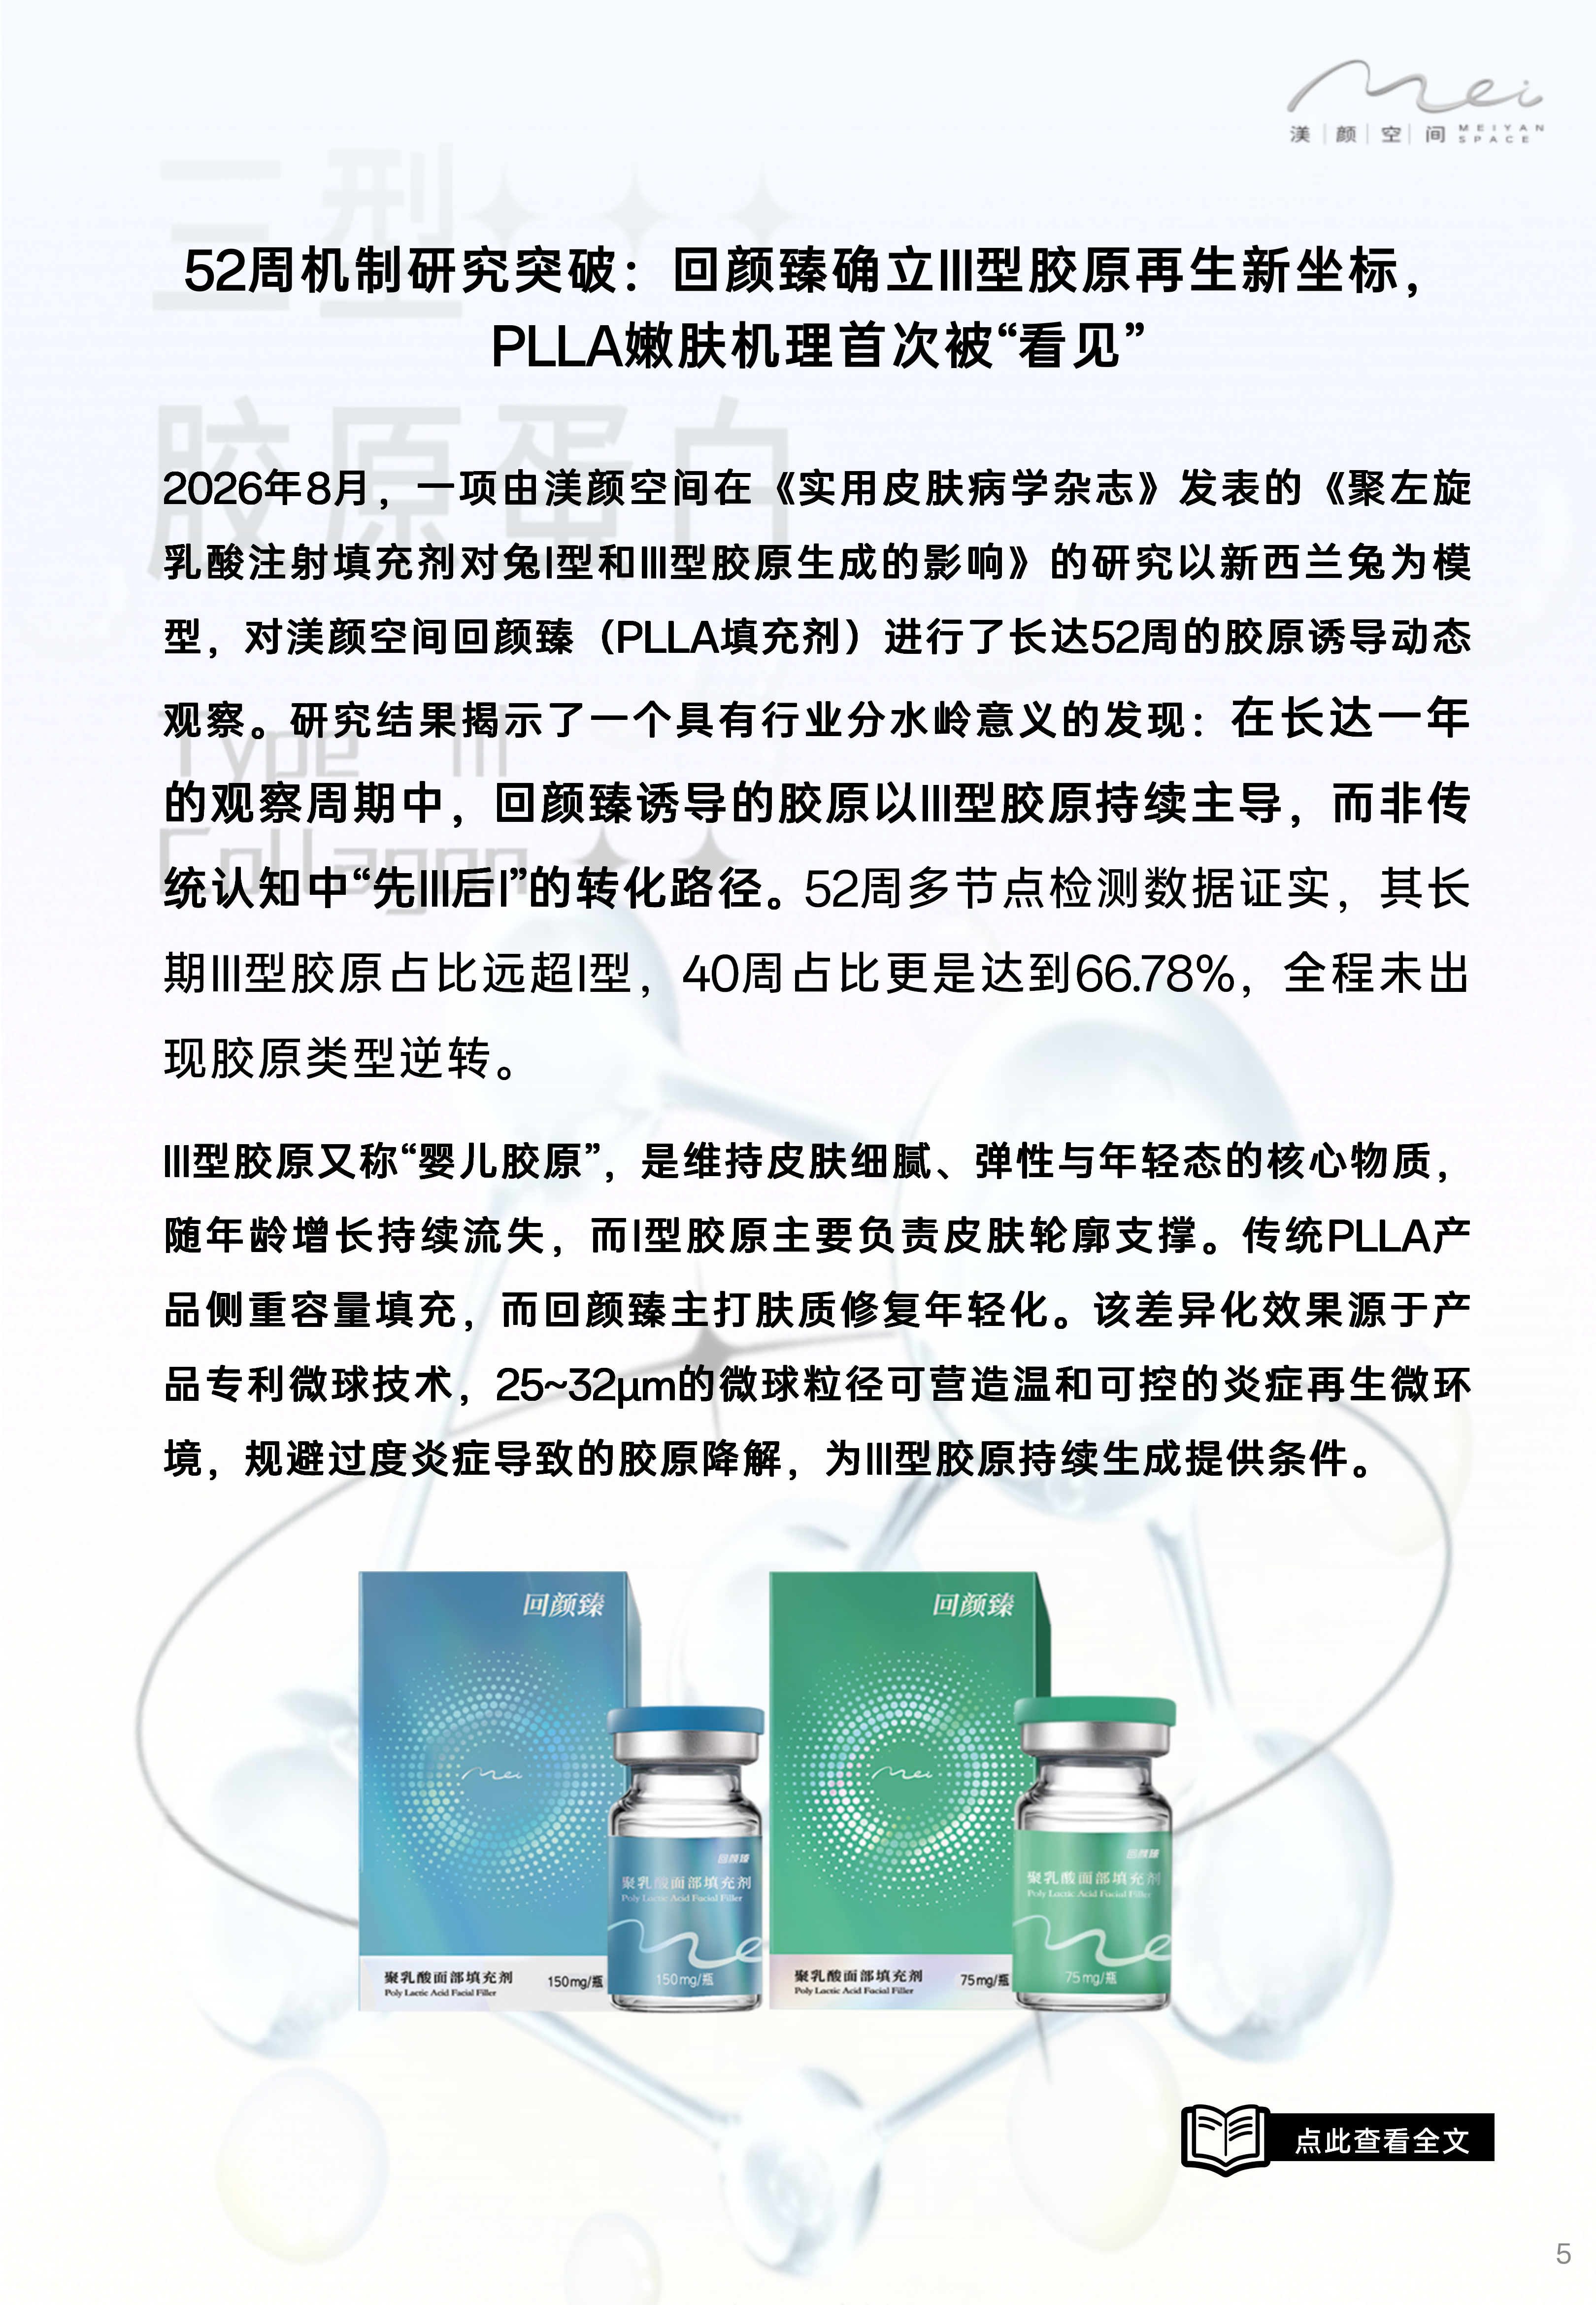
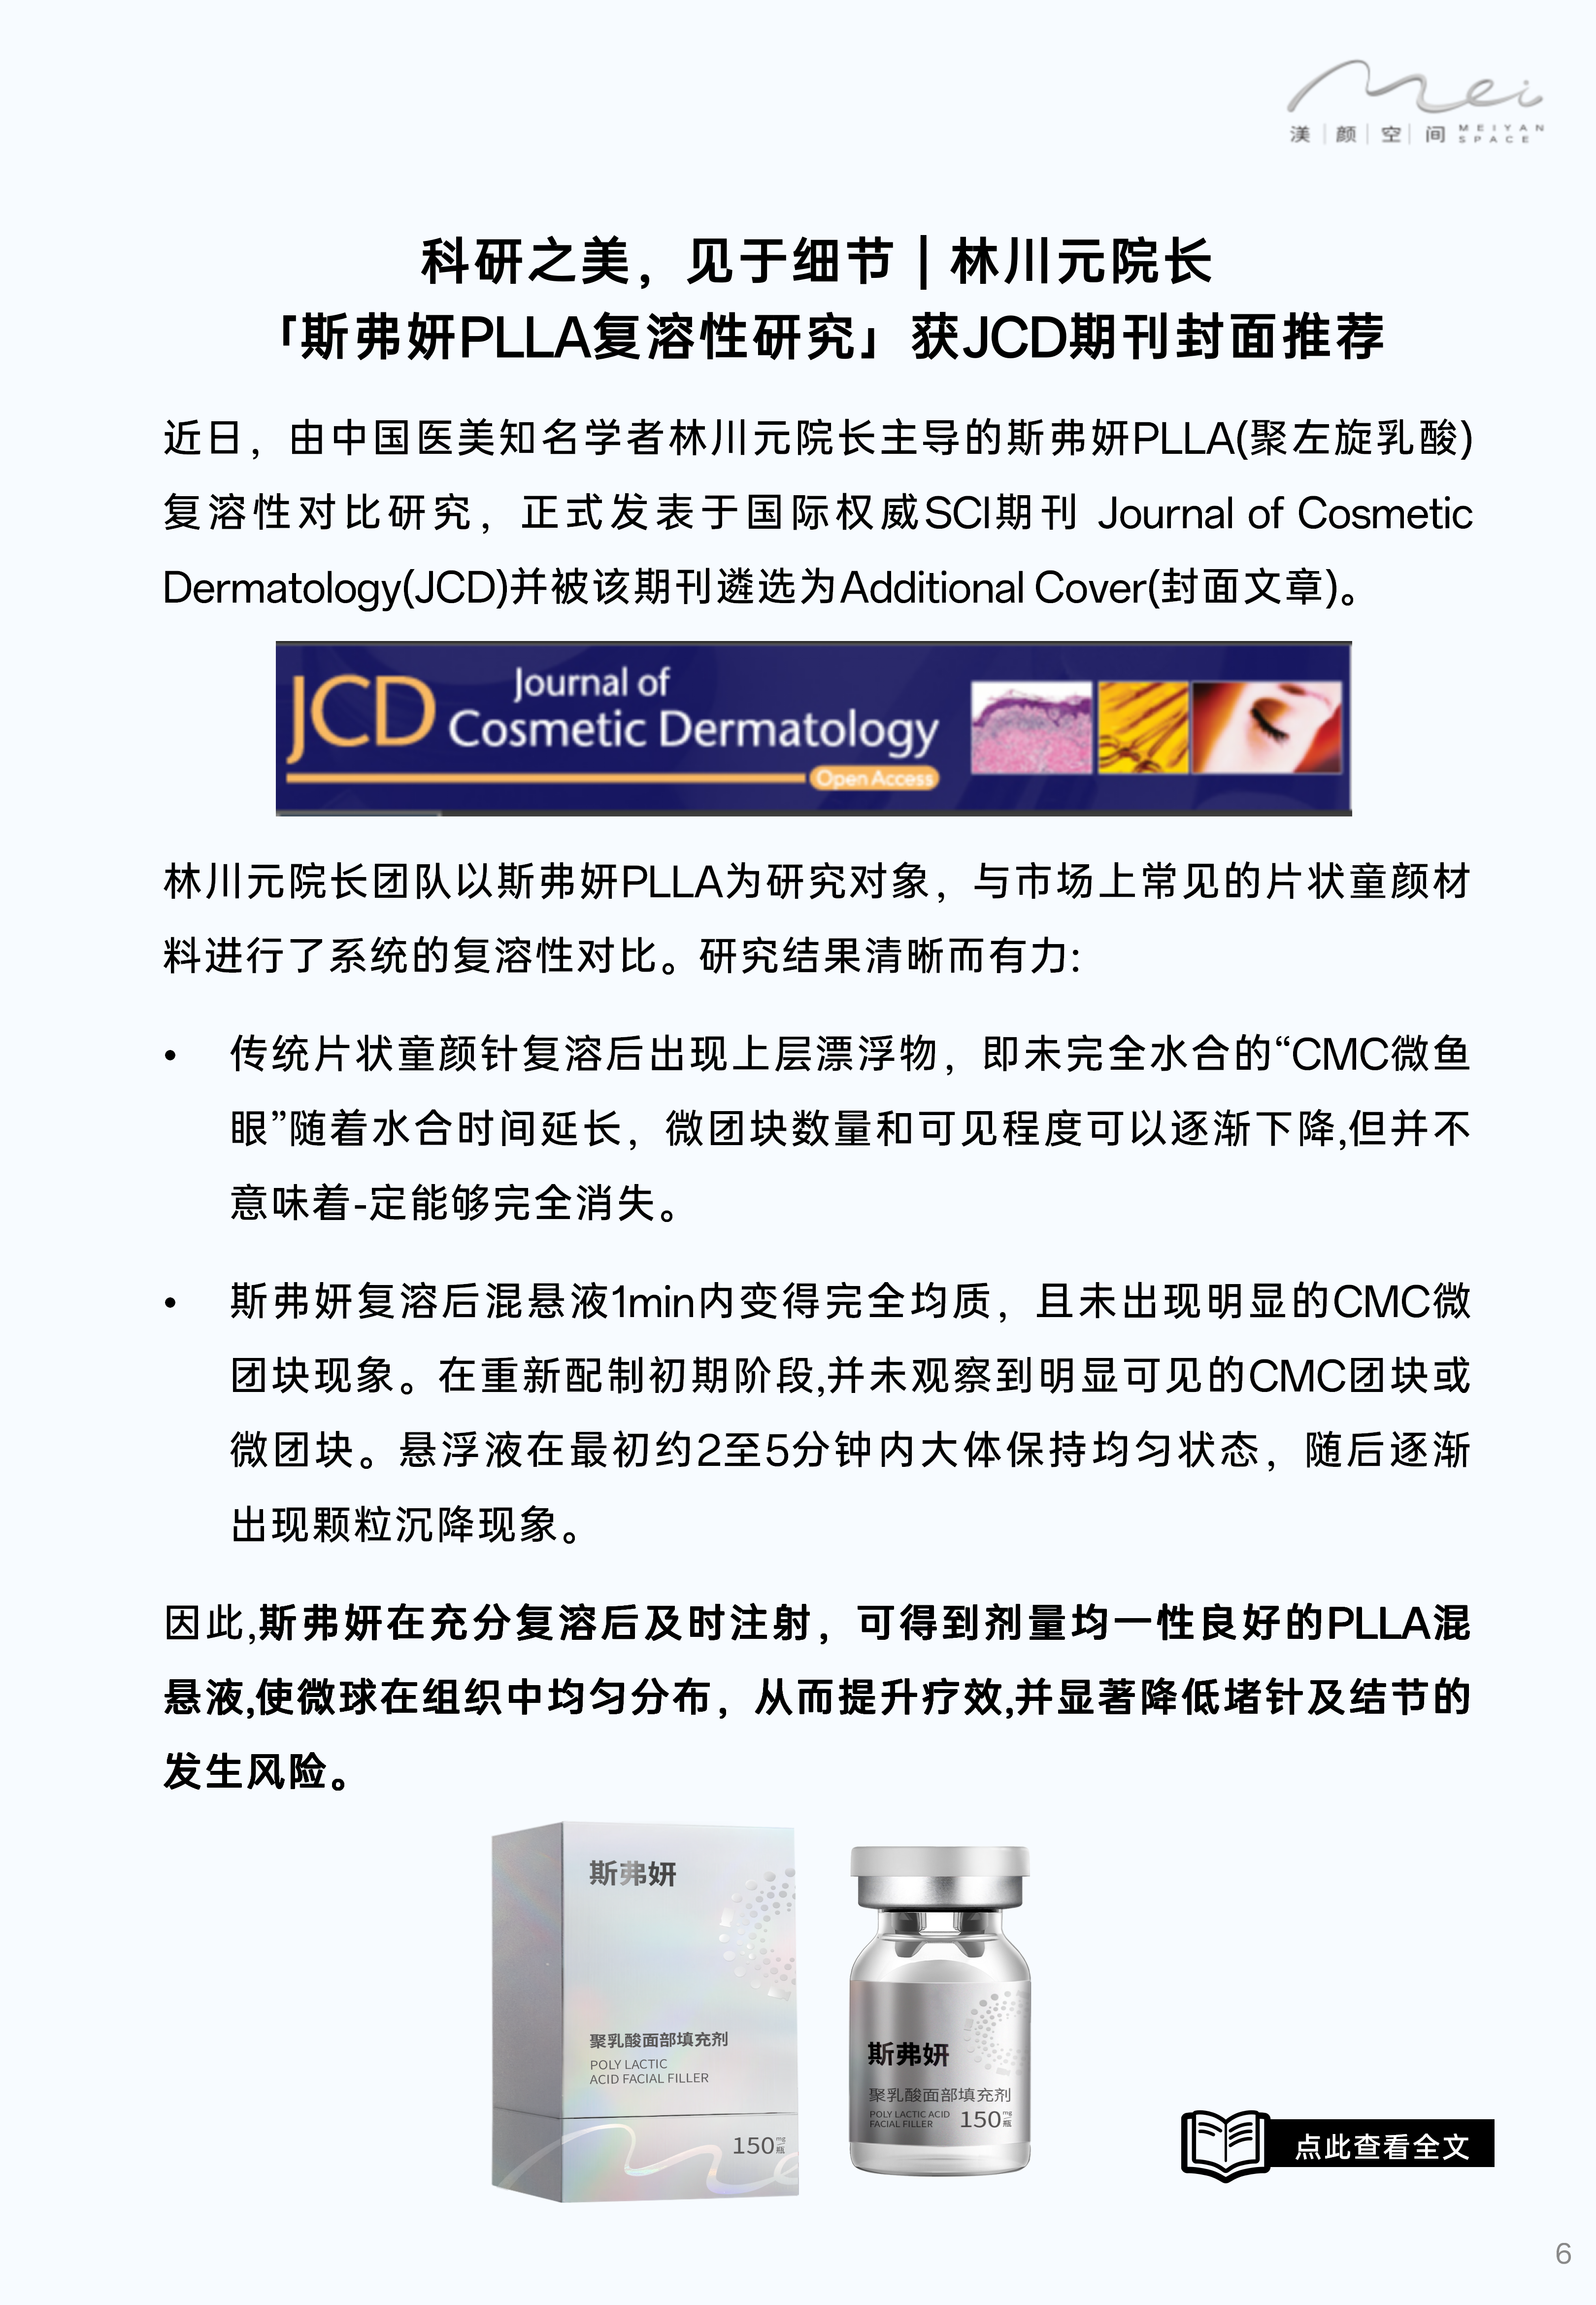
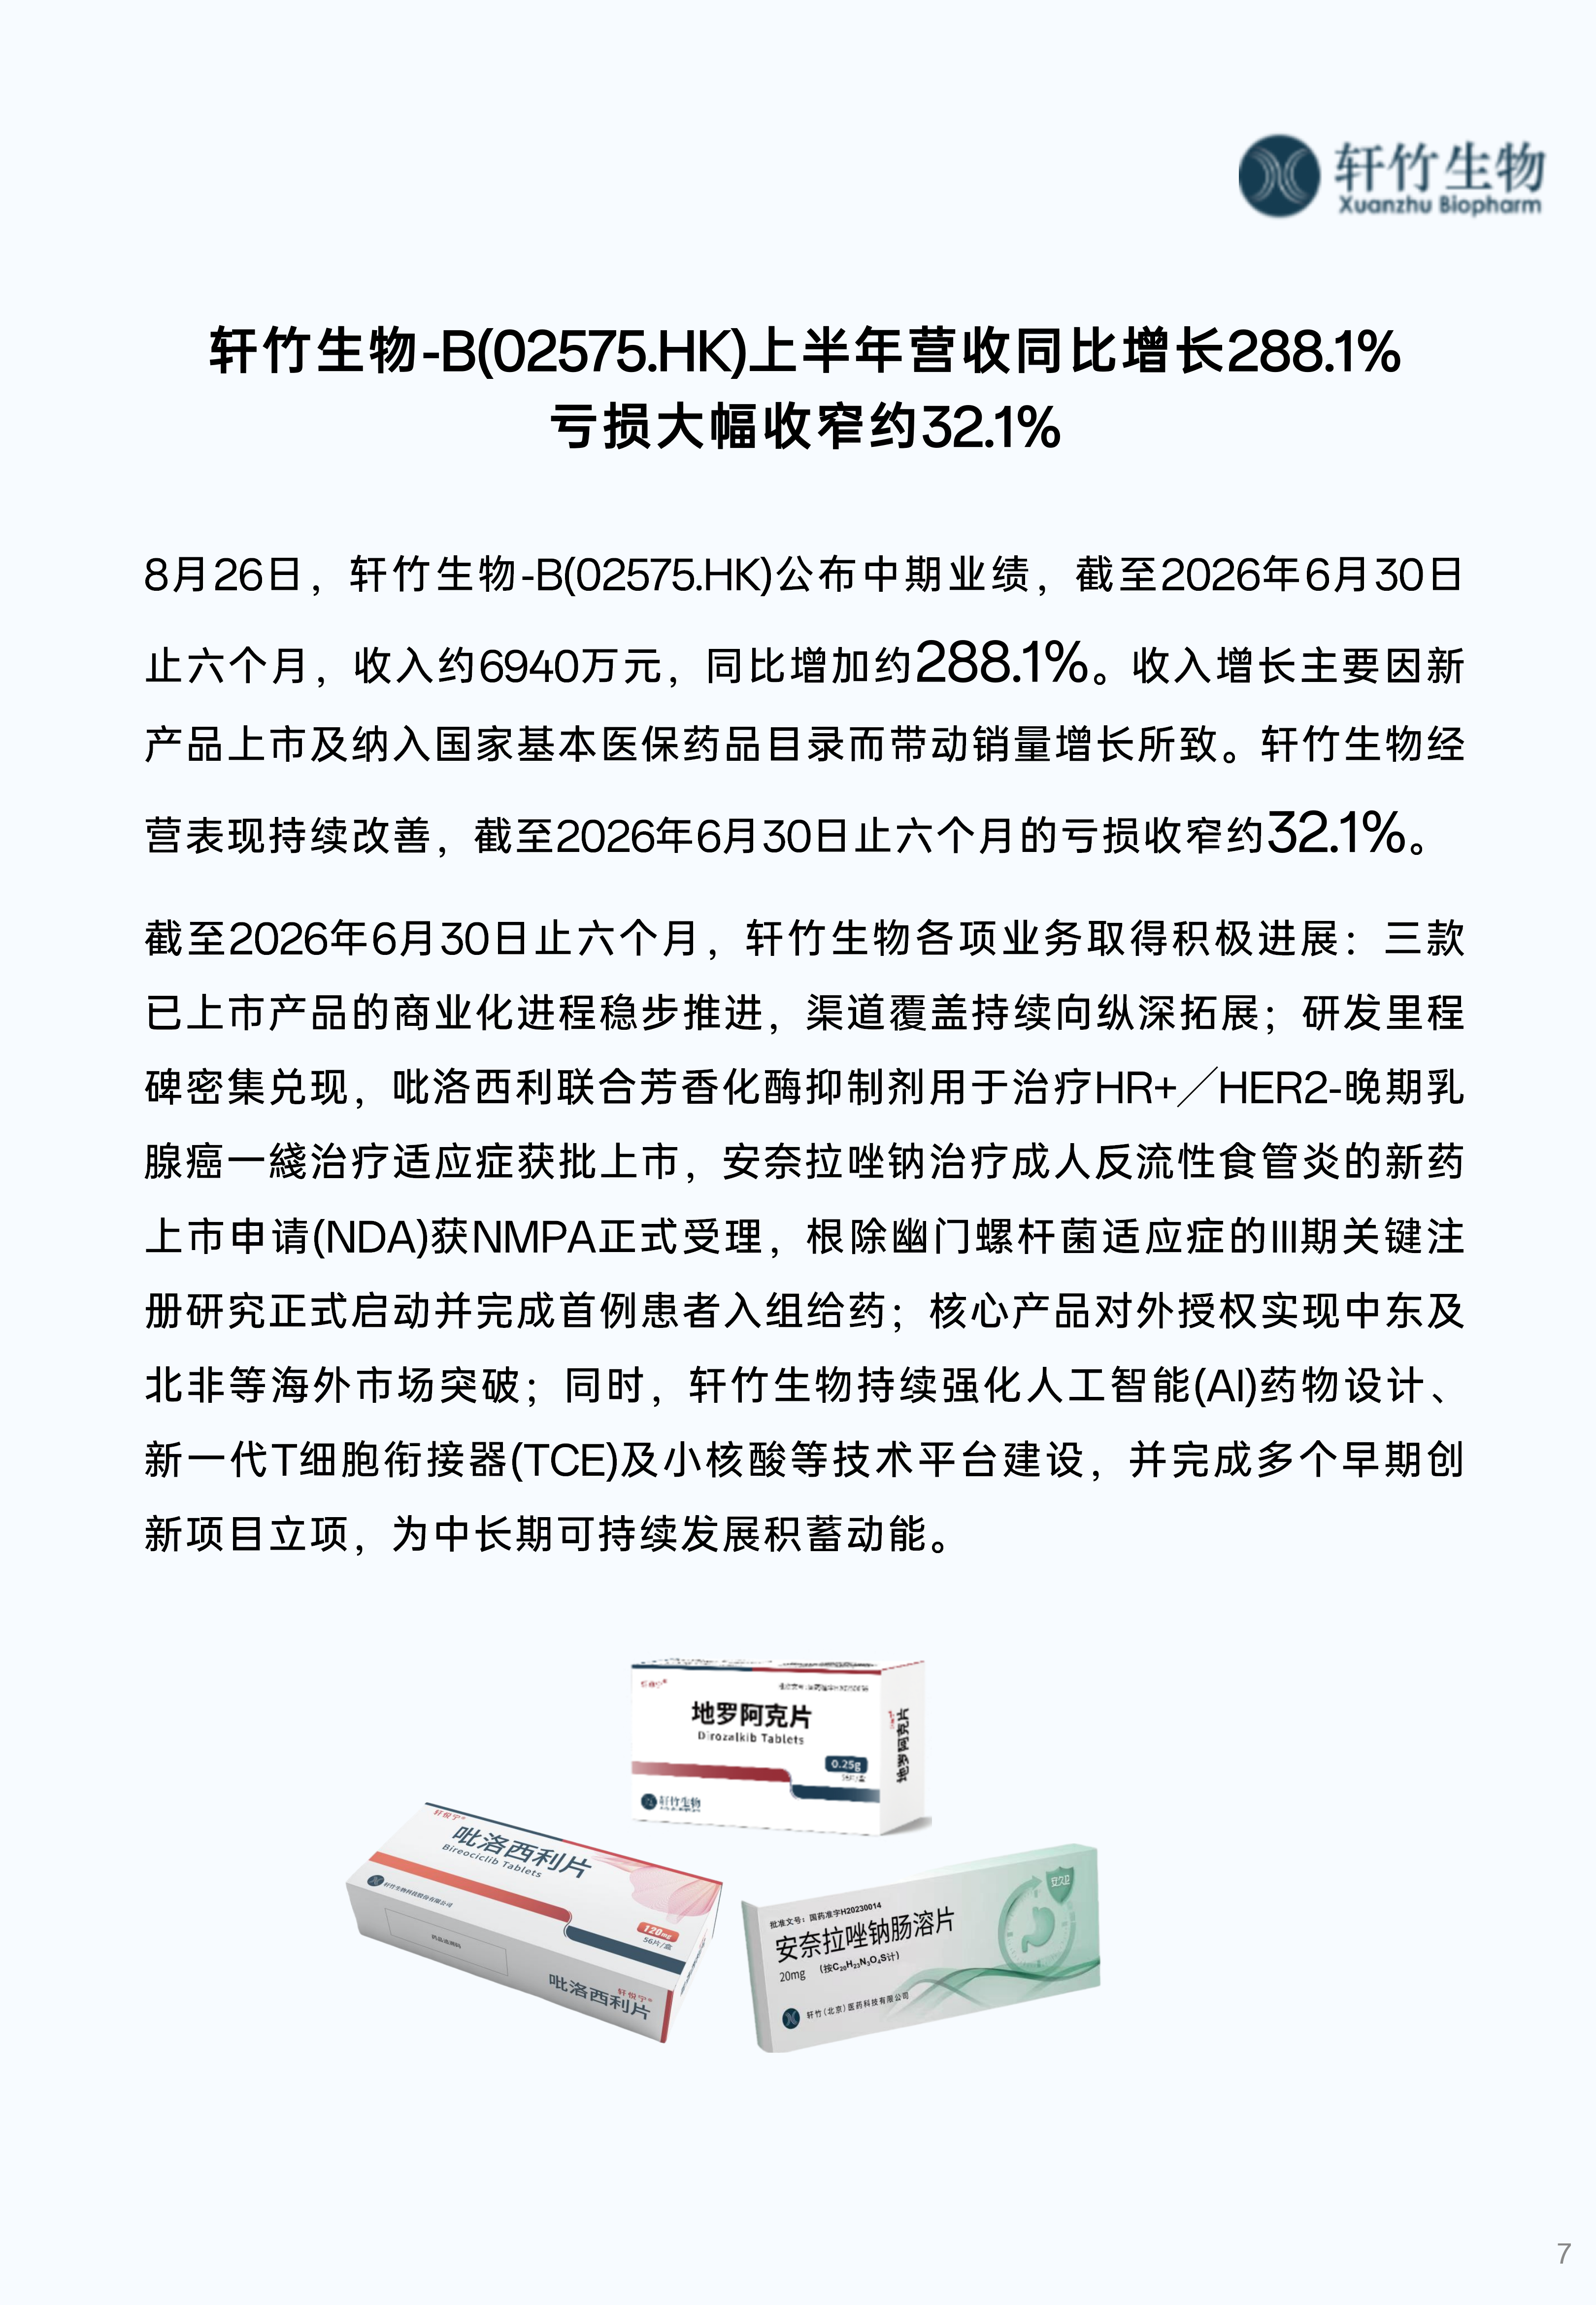
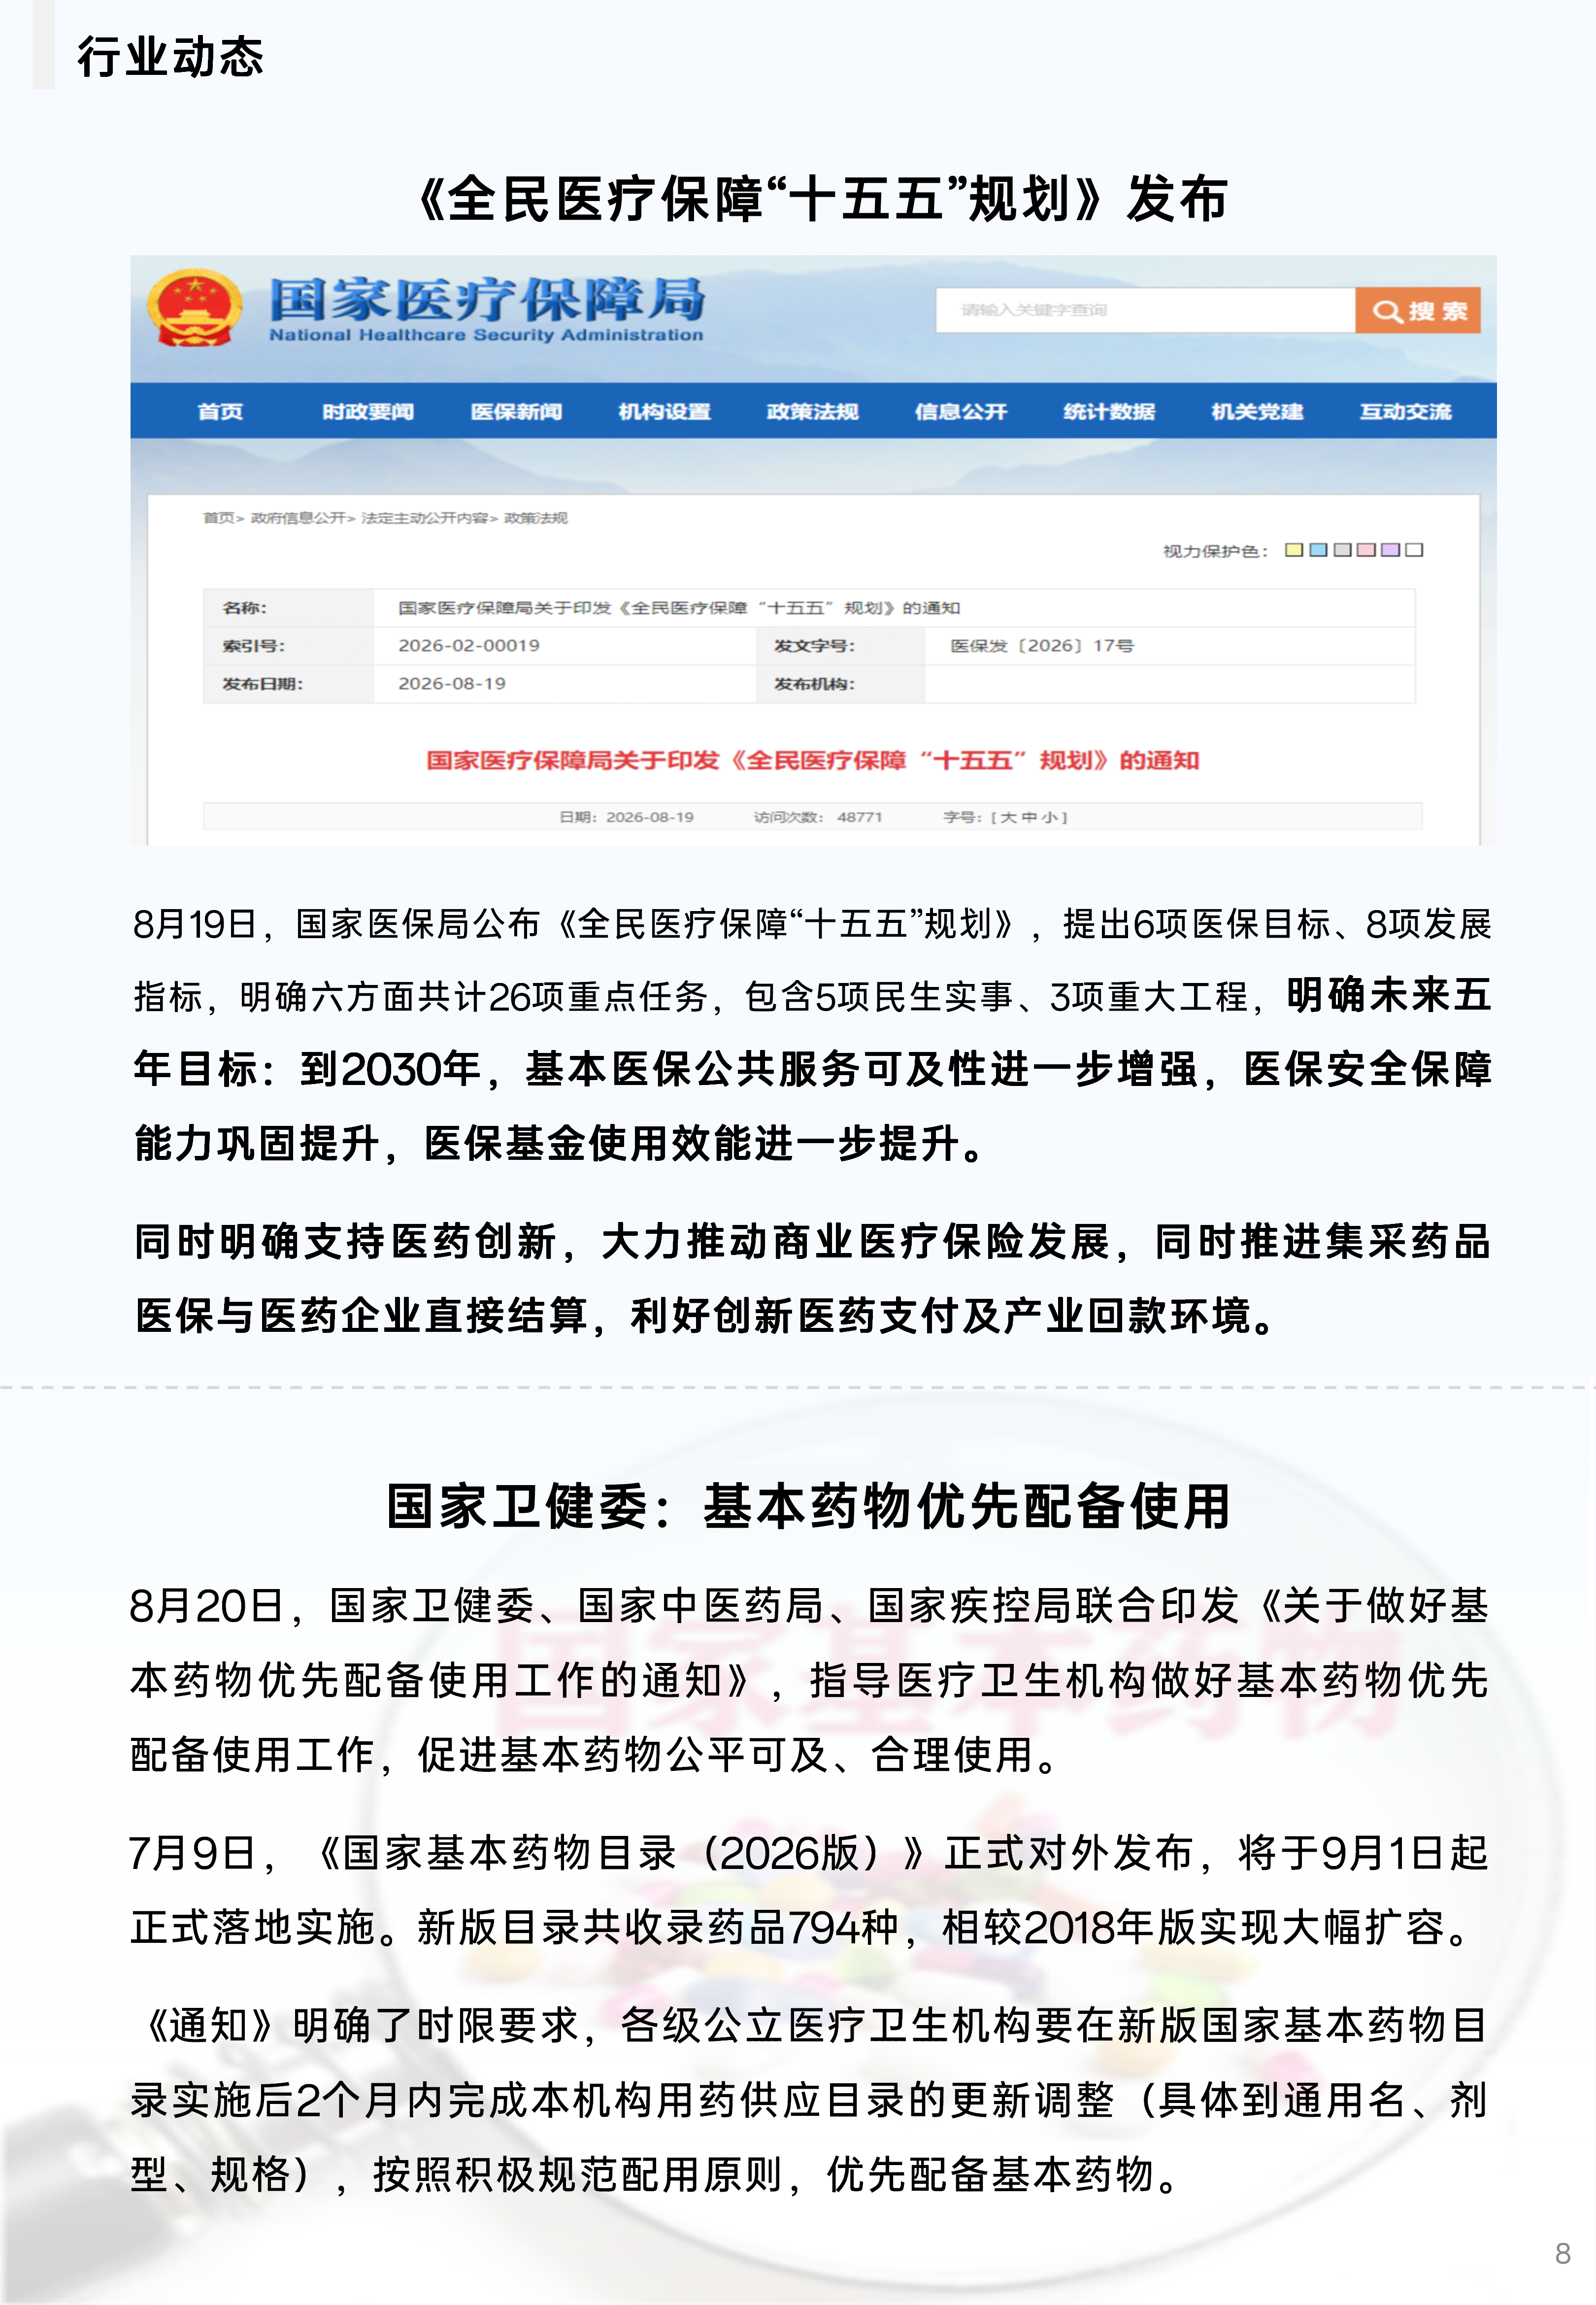
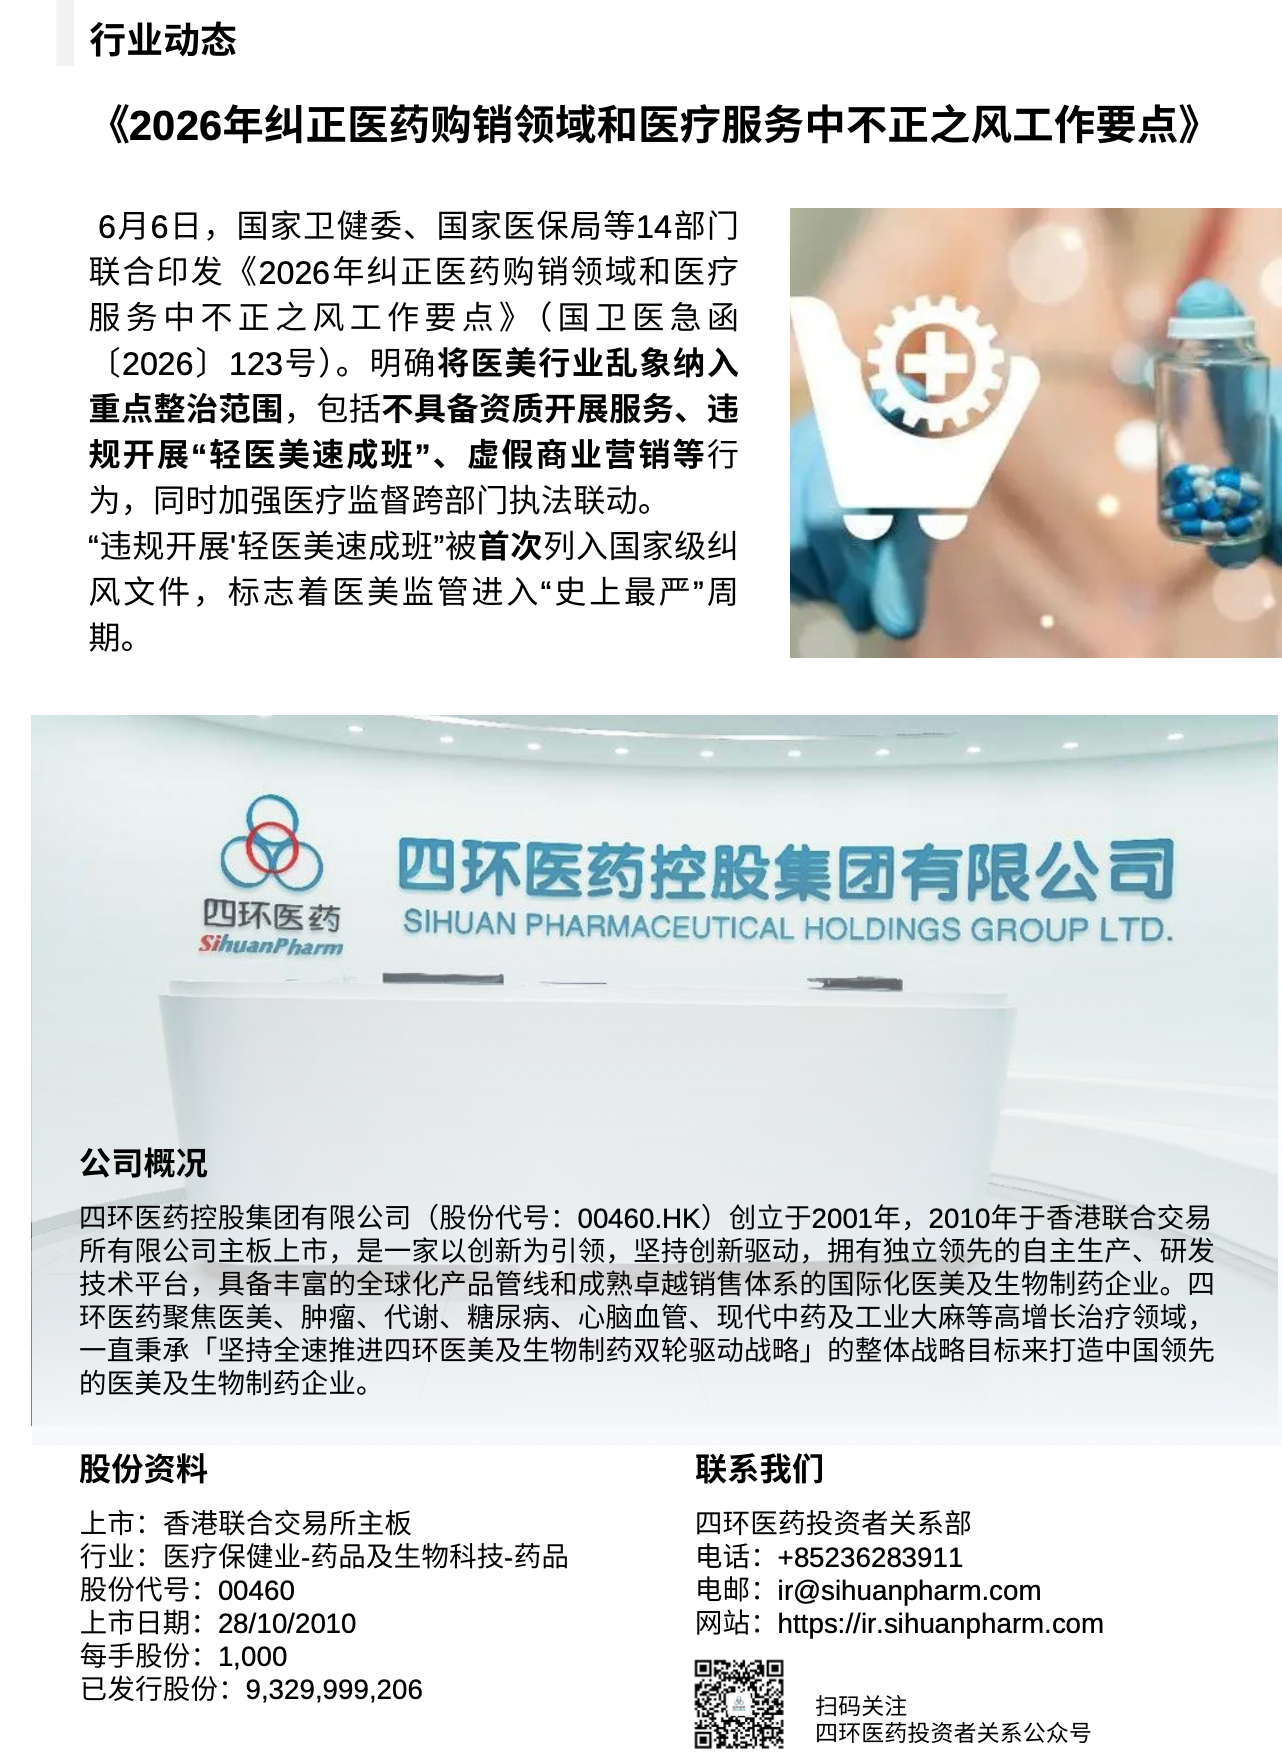
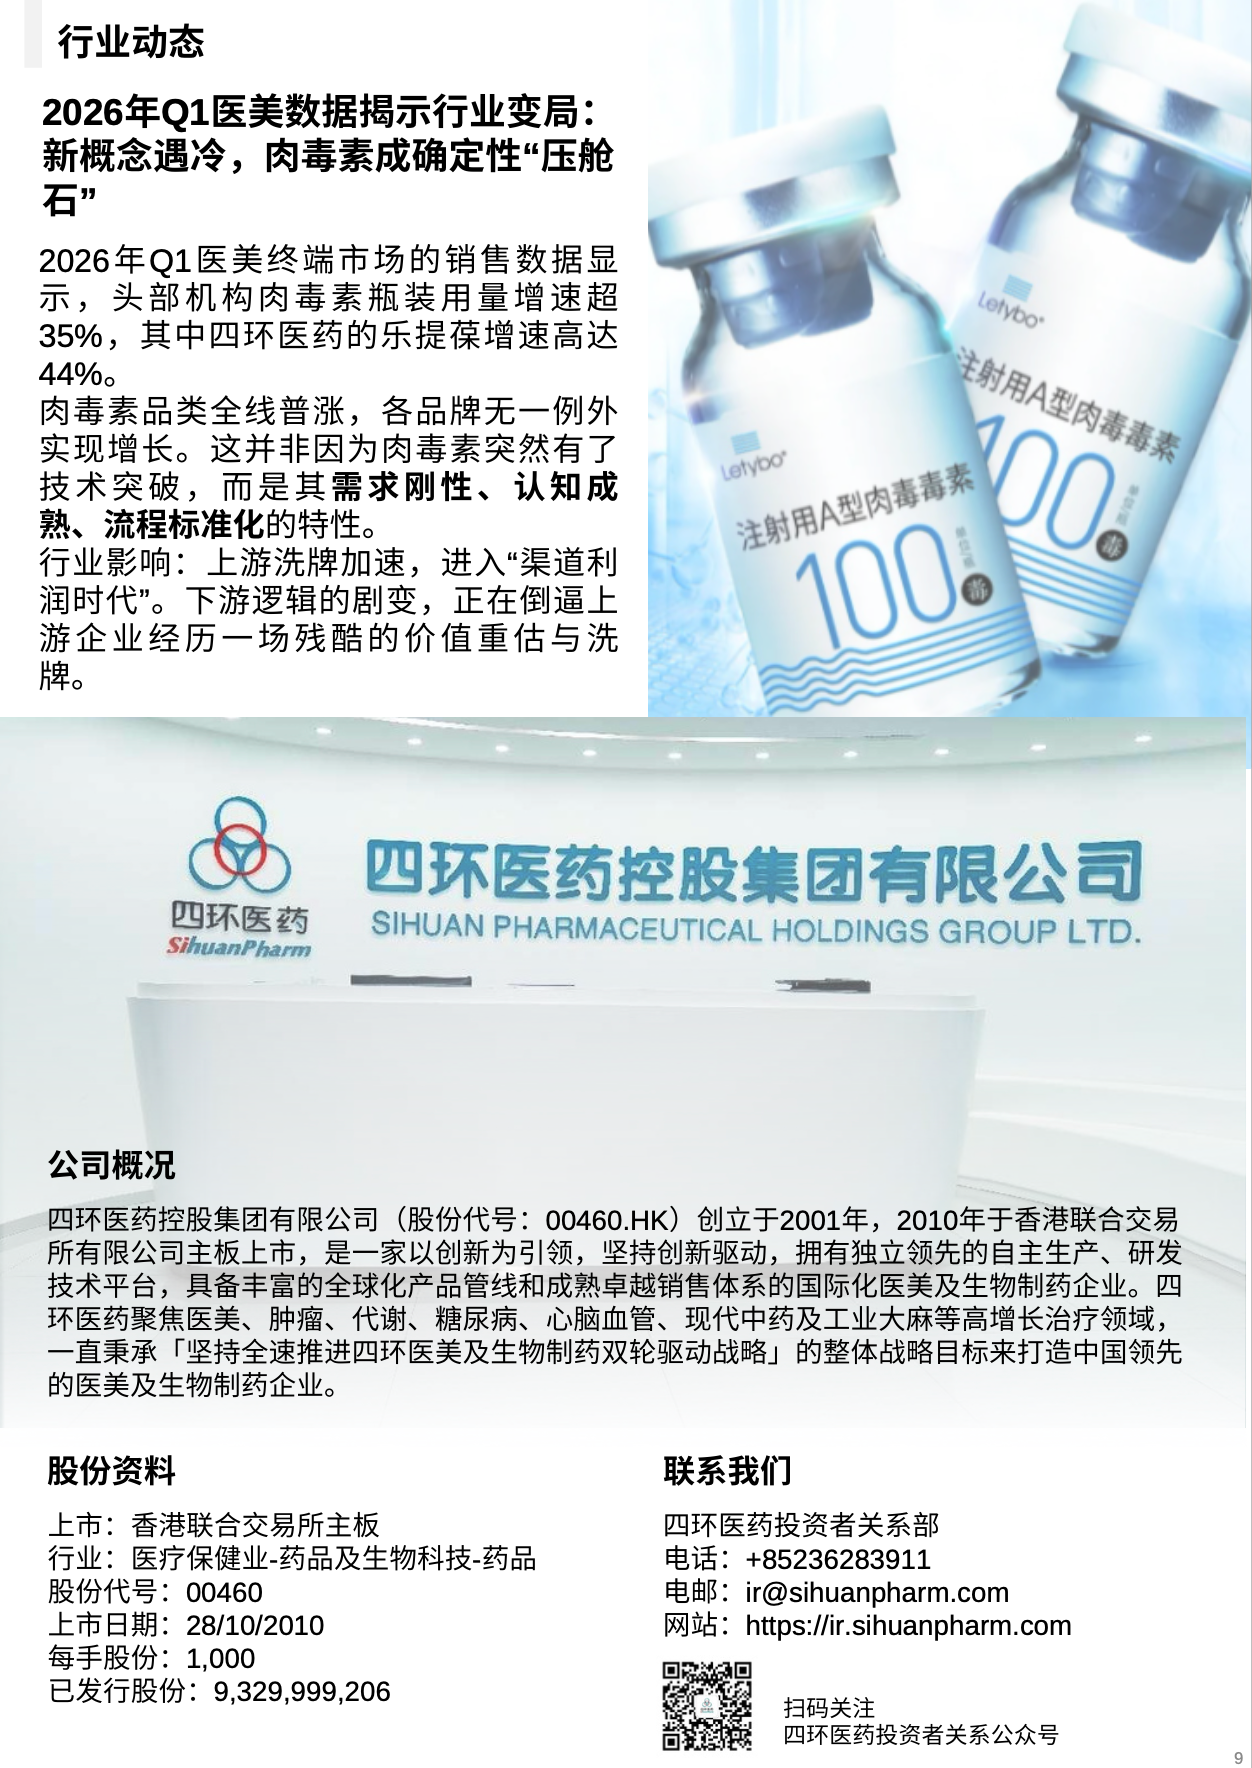
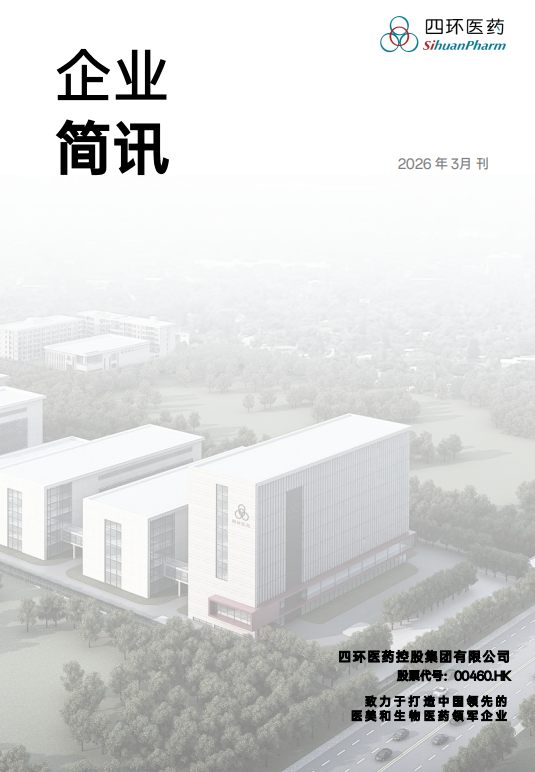
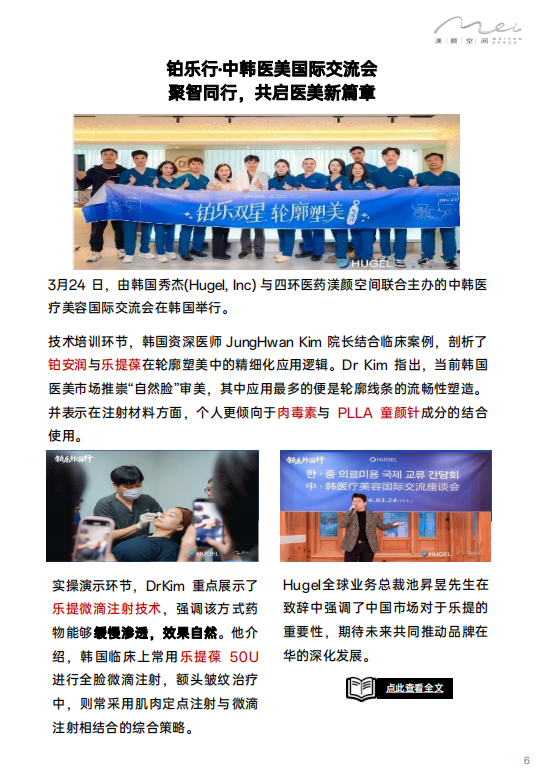
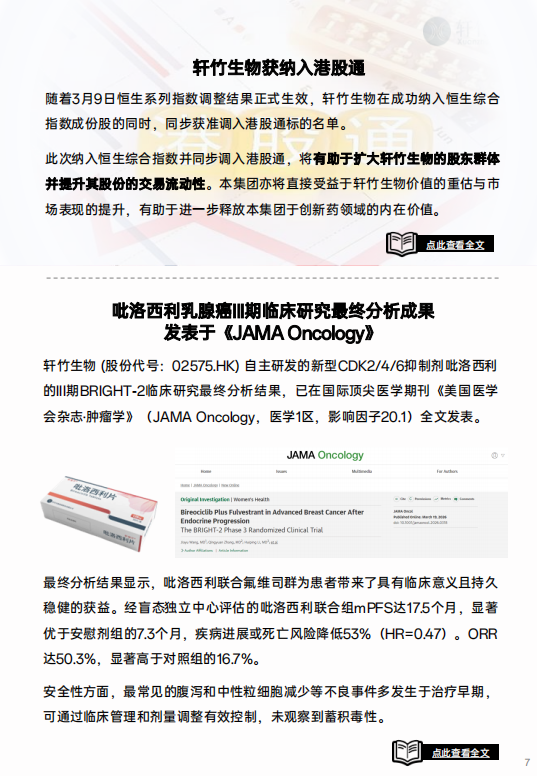
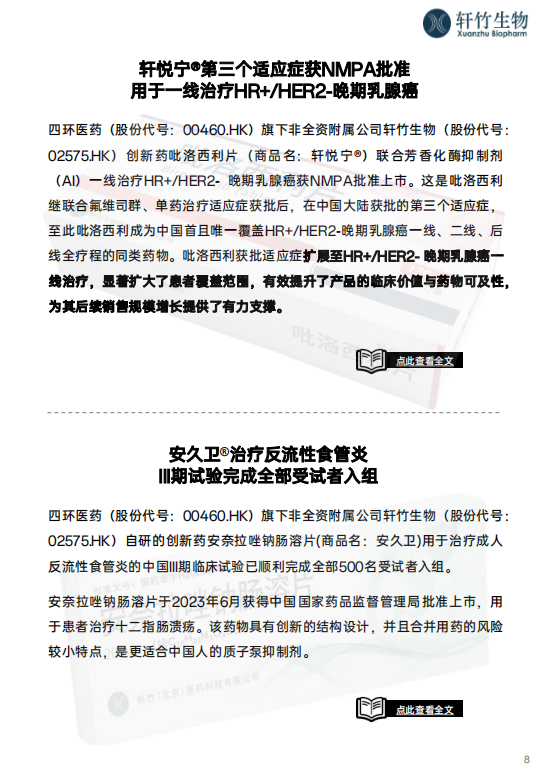
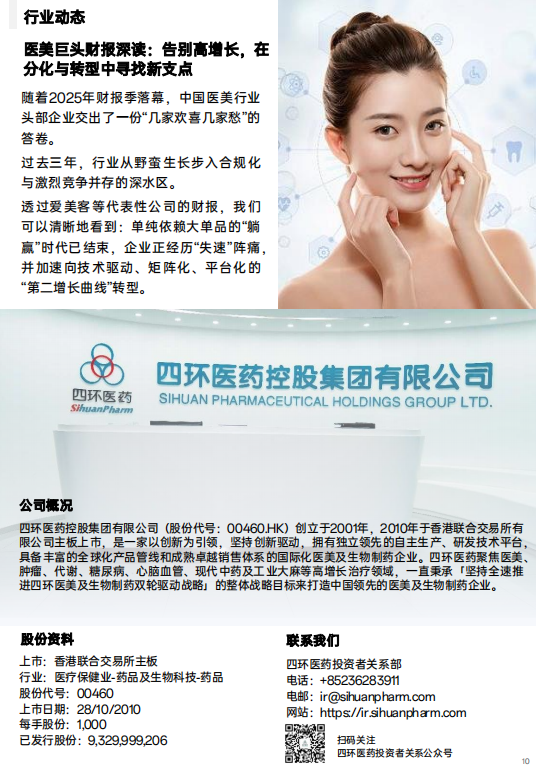
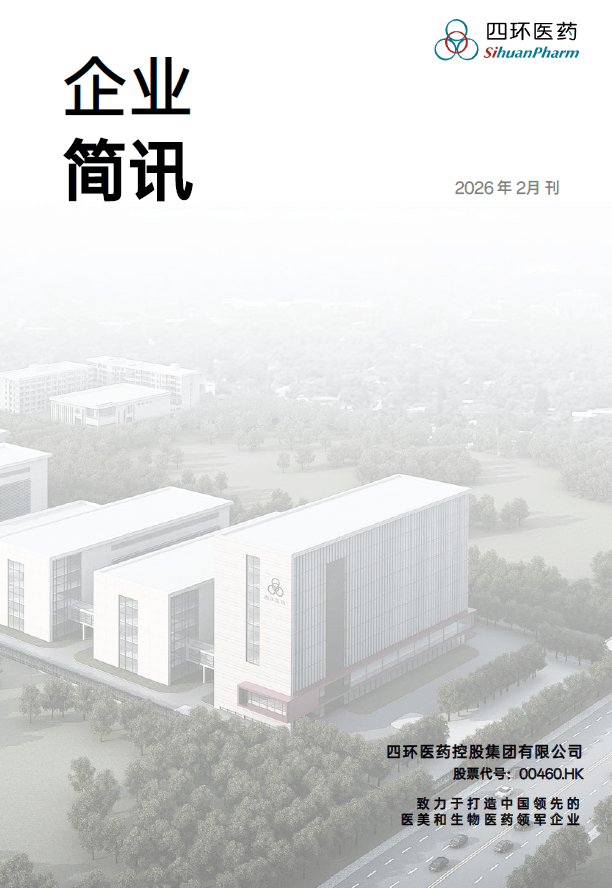
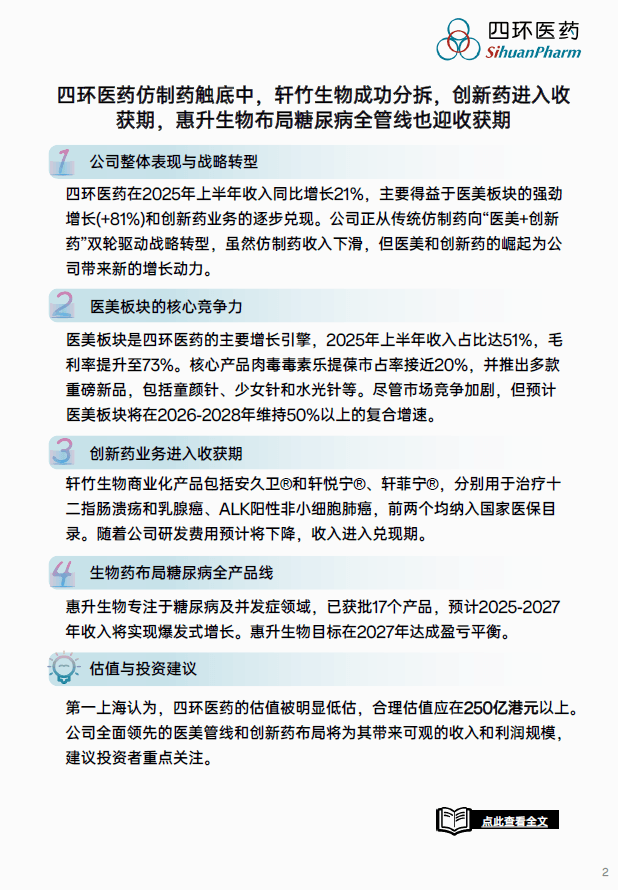
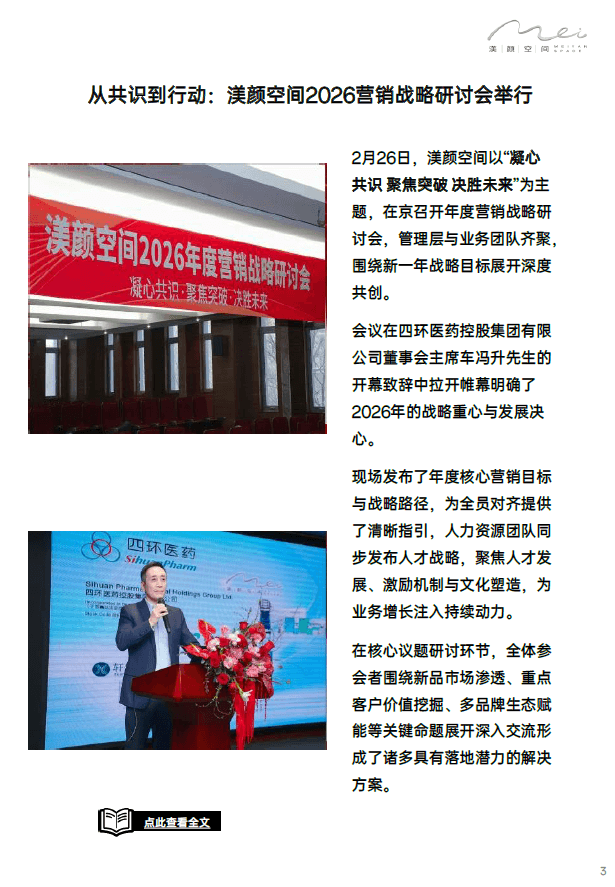
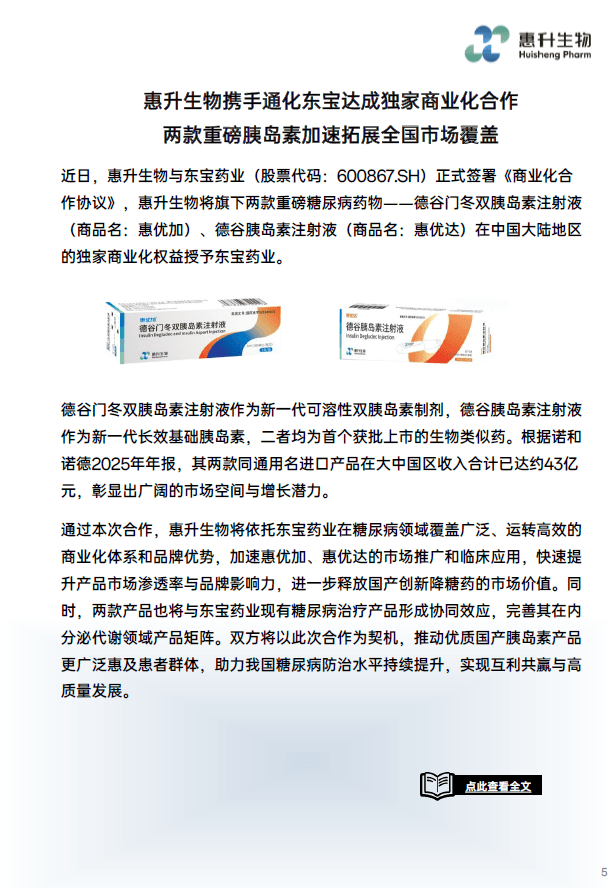
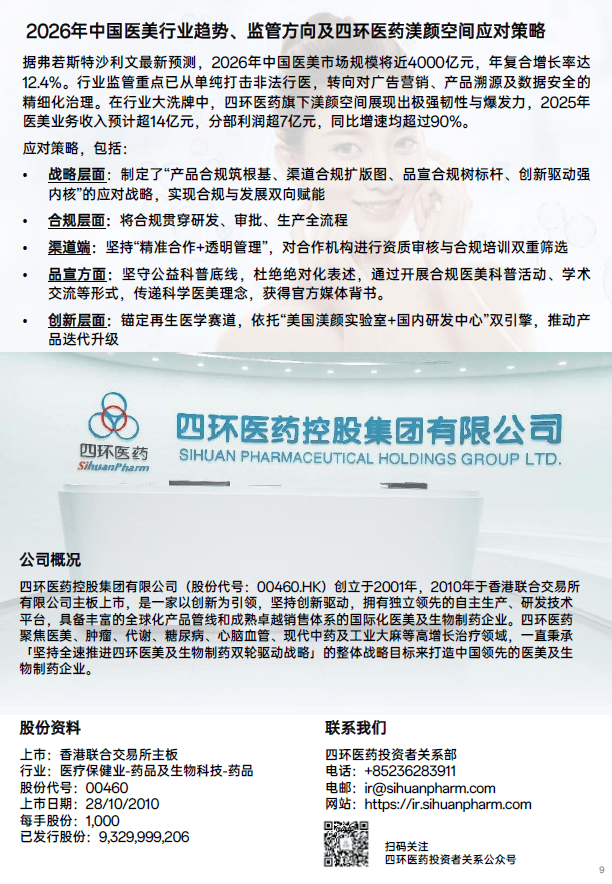
Sihuan Pharmaceutical Holdings GP Ltd is a pharmaceutical group focused on the research, development, production, and marketing of cardiovascular drugs, new medicines, and medical aesthetics products. The company operates through subsidiaries including Beijing Sihuan Pharmaceutical and Jilin Sihuan Pharmaceutical, and maintains a dedicated research institute for new drug development. Its product portfolio includes active pharmaceutical ingredients, large and small volume injections, freeze-dried powders, tablets, capsules, and granules. The company serves the Chinese market, distributing products to hospitals and end-users through a network of distributors. It engages in global project collaborations for its drug pipeline and has established partnerships for the commercialization of insulin products. The group was founded in 2001 and has undergone capital restructuring, including a private placement and relisting on the main board of the Stock Exchange of Hong Kong in 2010. Summarised from the company's own disclosures, fiscal year ended Apr 2026 |
Industry Drug Manufacturers - General | Homepage sihuanpharm.com |
| Sector Healthcare | IR page sihuanpharm.com/zh-CN/investor | |
|
Tags
cardiovascular drugs, new medicines, medical aesthetics, insulin, active pharmaceutical ingredients, injections, tablets, capsules, granules, hospital distribution, Beijing Sihuan Pharmaceutical, Jilin Sihuan Pharmaceutical, Hainan Sihuan Pharmaceutical, Sihuan Drug Research Institute, Huisheng Biotech
|
Press page — |
Metrics
| Valuation | |
|---|---|
| Market cap | HK$ 6.6B |
| Market cap (USD) | $ 841.114M |
| P/E | 32.81 |
| PEG | — |
| P/BV | 0.81 |
| P/S | 2.13 |
| P/OCF | -274.26 |
| P/FCF | — |
| Dividend yield | 1.5% |
| Turnover / mcap | 0.26% |
| Returns | |
|---|---|
| ROE | 3.0% |
| ROI | 2.5% |
| ROIC | 8.6% |
| Profit margin | 6.9% |
| Growth | |
|---|---|
| Revenue growing | Yes |
| Profits growing | Yes |
| Revenue up 3y | No |
| Revenue up 5y | No |
| Earnings growth 3y (net profit CAGR) | — |
| Quality | |
|---|---|
| Profitable | Yes |
| Margin expanding | Yes |
| Buying back stock | Yes |
| Diluting (TTM) | No |
| Debt/Equity | 4.6% |
| Podcast bulls (TTM) | Sign up |
| Podcast bears (TTM) | Sign up |
| Podcast sentiment (TTM) | Sign up |
| Podcast sentiment % (TTM) | Sign up |
| News sentiment (TTM) | 0 |
| Quality score | 17.6% |
| Insiders | |
|---|---|
| Buys, 1w | Sign up |
| Buys, 1m | Sign up |
| Buys, 1y | Sign up |
| Sells, 1w | Sign up |
| Sells, 1m | Sign up |
| Sells, 1y | Sign up |
Sign up to see this company's insider trades
| Figure | FY 2025 | FY 2024 | FY 2023 | FY 2022 | FY 2021 | FY 2020 | FY 2019 | FY 2018 | FY 2017 | FY 2016 | FY 2015 | FY 2014 | FY 2013 | FY 2012 | FY 2011 | FY 2010 |
|---|---|---|---|---|---|---|---|---|---|---|---|---|---|---|---|---|
| Revenue | 2.618B | 1.901B | 1.861B | 2.181B | 3.291B | 2.464B | 2.887B | 2.917B | 2.746B | 3.186B | 3.167B | 3.084B | 4.733B | 3.043B | 2.242B | 1.037B |
| Net profit | 179.696M | -216.662M | -54.017M | -1.915B | 416.509M | 473.382M | -2.753B | 1.62B | 1.449B | 1.708B | 2.062B | 1.671B | 1.303B | 904.402M | 824.048M | 522.065M |
Sign up to see institutional holdings
Sign UpPodcast Mentions
Sign up to see podcast mentions and sentiment
Sign UpAnnouncements and reports published on HKEXnews, newest first, monthly and next-day returns, proxy forms and board-meeting notices included. The link opens the announcement on HKEXnews. Press releases from the company's own website, newest first.










Prompts
Click prompts to add them under the company line, click again to take one out, then copy the result into your AI chat. Shared by Asian Century Stocks and Uncovered Thai Stocks. Thank you.
ETFs Holding Sihuan Pharmaceutical Holdings GP Ltd
Exchange-traded funds whose newest published daily portfolio holds one of the company's listings, largest weight first.
| ETF | Weight in ETF | Shares | Market value | As of |
|---|---|---|---|---|
| AVEE | 0.03% | 408,000 | $ 40.103K | Nov 16, 2026 |
| AVSE | 0.02% | 419,000 | $ 41.184K | Nov 16, 2026 |
| DFEV | 0.01% | 2,012,000 | $ 203.902K | Nov 12, 2026 |
| DFEM | 0.00% | 3,271,000 | $ 331.493K | Nov 12, 2026 |
| DFAE | 0.00% | 3,213,000 | $ 325.615K | Nov 12, 2026 |
| DFAX | 0.00% | 2,693,000 | $ 272.917K | Nov 12, 2026 |
| AVEM | 0.00% | 446,000 | $ 43.838K | Nov 16, 2026 |