|
Shanghai Henlius Biotech, Inc. is a biopharmaceutical company engaged in the research, development, production, and sale of monoclonal antibody drugs and the provision of related technical services. The company's portfolio includes biosimilars and biologics, with key products including serplulimab (HANSIZHUANG), trastuzumab biosimilar (HANQUYOU), rituximab biosimilar (HANLIKANG), denosumab biosimilars (BILDYOS and BILPREVDA), and pertuzumab biosimilar (POHERDY). Its pipeline features antibody-drug conjugates, multispecific antibodies, and small molecules targeting oncology, autoimmune diseases, and ophthalmology. The company operates in markets across China, the United States, Europe, Japan, Australia, and emerging regions in Latin America, Southeast Asia, and the Middle East. It maintains commercial partnerships with international pharmaceutical companies including Abbott, Sandoz, Eisai, and Dr. Reddy's Laboratories. Founded in 2010, the company utilizes a global manufacturing network with GMP-certified facilities in China, Europe, and the United States. Summarised from the company's own disclosures, fiscal year ended Apr 2026 |
Industry Biotechnology | Homepage henlius.com |
| Sector Healthcare | IR page henlius.com/Investor-Presentation.html | |
|
Tags
monoclonal antibodies, biosimilars, antibody-drug conjugates, oncology, autoimmune diseases, ophthalmology, small molecules, fusion proteins, biopharmaceuticals, HANSIZHUANG, Hetronifly, HANQUYOU, HERCESSI, Zercepac, Tuzucip, Trastucip, HANLIKANG, BILDYOS, BILPREVDA, TUZEMTY, POHERDY, HLX11, HLX13, HLX14, HLX15, HLX17, HLX18, HLX22, HLX37, HLX43, HLX55, HLX70, HLX71, HLX79, HLX87, HLX97, HLX99, HLX109, HLX04-O, HLX07, Hanjugator, HAI Club
|
Press page — |
Metrics
| Valuation | |
|---|---|
| Market cap | HK$ 15.39B |
| Market cap (USD) | $ 1.961B |
| P/E | 25.90 |
| PEG | — |
| P/BV | 4.50 |
| P/S | 1.76 |
| P/OCF | 11.95 |
| P/FCF | — |
| Dividend yield | — |
| Turnover / mcap | 0.12% |
| Returns | |
|---|---|
| ROE | 23.7% |
| ROI | 10.9% |
| ROIC | 10.9% |
| Profit margin | 12.4% |
| Growth | |
|---|---|
| Revenue growing | Yes |
| Profits growing | Yes |
| Revenue up 3y | Yes |
| Revenue up 5y | Yes |
| Earnings growth 3y (net profit CAGR) | — |
| Quality | |
|---|---|
| Profitable | Yes |
| Margin expanding | No |
| Buying back stock | No |
| Diluting (TTM) | No |
| Debt/Equity | 87.0% |
| Podcast bulls (TTM) | Sign up |
| Podcast bears (TTM) | Sign up |
| Podcast sentiment (TTM) | Sign up |
| Podcast sentiment % (TTM) | Sign up |
| News sentiment (TTM) | 0 |
| Quality score | 37.5% |
| Insiders | |
|---|---|
| Buys, 1w | Sign up |
| Buys, 1m | Sign up |
| Buys, 1y | Sign up |
| Sells, 1w | Sign up |
| Sells, 1m | Sign up |
| Sells, 1y | Sign up |
Podcast Mentions
Announcements and reports published on HKEXnews, newest first, monthly and next-day returns, proxy forms and board-meeting notices included. The link opens the announcement on HKEXnews. Press releases from the company's own website, newest first.


搜索
Oct 30, 2026|2026
Henlius Shortlisted for Four Scrip and Citeline Awards, Including Three for the ASTRUM-006 Study of Serplulimab
Henlius has been shortlisted for four awards across the Scrip Awards and Citeline Biotech Awards, two major annual awards programs in the global biopharmaceutical industry. Judged by seasoned experts in drug discovery, clinical development and the broader industry, both programs recognize outstanding achievements in drug development, clinical research and business performance. ASTRUM-006, the Phase 3 study evaluating perioperative treatment with HANSIZHUANG (serplulimab, trade name in Europe: Hetronifly®), Henlius’ independently developed innovative anti-PD-1 monoclonal antibody, in gastric cancer, has been shortlisted for Best Oncology R&D Advance at the Scrip Awards. Henlius has also been shortlisted for Clinical Trial Result of the Year and the Patient-First Award at the Citeline Biotech Awards, with the two submissions focusing on this study’s clinical results and its value to patients, respectively. In addition, Henlius is a finalist for Citeline’s Biopharma Company of the Year award. Together, these four nominations highlight international interest in Henlius’ clinical innovation, patient focus and overall corporate performance.
In June 2026, serplulimab became the world’s first* anti-PD-1 monoclonal antibody approved for the perioperative treatment of gastric cancer, offering patients with resectable gastric cancer and PD-L1 expression with a combined positive score (CPS) ≥5 a new treatment option that omits postoperative chemotherapy. To address poor tolerability of postoperative chemotherapy and the difficulty many patients face in completing treatment, ASTRUM-006 adopted an innovative strategy combining immunotherapy and chemotherapy before surgery, followed by adjuvant immunotherapy alone. Compared with the chemotherapy control group, this regimen significantly prolonged event-free survival and achieved a pathological complete response rate of 21.6%—more than three times that of the control group. Rates of Grade ≥3 treatment-related adverse events and treatment discontinuation due to treatment-related adverse events were also lower, demonstrating improved efficacy alongside better treatment tolerability.
Results from ASTRUM-006 were presented in an oral session at the 2026 American Society of Clinical Oncology (ASCO) Annual Meeting and simultaneously published in The Lancet. The regimen has also been incorporated into the 2026 Chinese Society of Clinical Oncology (CSCO) Guidelines for the Diagnosis and Treatment of Gastric Cancer. The three award nominations associated with the study bring further attention to the potential of perioperative serplulimab to improve outcomes and reduce treatment burden, while raising the international profile of Henlius’ innovation driven by clinical needs.
Henlius continues to expand its portfolio across disease areas and strengthen its capabilities from research and development through commercialization, progress also reflected in its nomination for Citeline’s Biopharma Company of the Year award. In 2026, HANBEIYOU (trade name in the U.S. and Europe: POHERDY®) received marketing approvals from the European Commission and China’s National Medical Products Administration (NMPA), becoming the first and only** Chinese-developed pertuzumab biosimilar approved in all three major markets: China, the United States and Europe.Together with HANQUYOU, it forms the first Chinese-developed trastuzumab–pertuzumab dual-targeted treatment offering approved across these markets, supporting care from neoadjuvant and adjuvant treatment through first-line treatment of advanced disease.
Meanwhile, Henlius is accelerating the development of a broad breast cancer portfolio, including the novel endocrine therapy lasofoxifene (HLX78); HLX22, a novel epitope-targeting anti-HER2 monoclonal antibody; the HER2-targeted antibody–drug conjugate (ADC) HLX87; the oral KAT6A/B inhibitor HLX97; the biparatopic HER2-targeted ADC HLX49; and HLX319, China’s first domestically developed subcutaneous fixed-dose combination of pertuzumab and trastuzumab. These efforts aim to build a comprehensive portfolio of innovative breast cancer treatments addressing multiple therapeutic approaches across the continuum of care. Serplulimab has also received European Union approval for three additional first-line indications—non-squamous non-small cell lung cancer, esophageal squamous cell carcinoma and squamous non-small cell lung cancer—further expanding its approved indications overseas.
In clinical development, Henlius continues to advance global programs for key assets, including dulpatatug (HLX22), an anti-HER2 monoclonal antibody targeting a novel epitope, and HLX43, a PD-L1-targeted ADC. The company is also efficiently progressing a new generation of innovative molecules with best-in-class or first-in-class potential, including HLX3901, HLX3902, HLX48, HLX97 and HLX316, further strengthening its pipeline for long-term growth.
Henlius’ business growth continues alongside increased investment in innovation. In the first half of 2026, the company generated revenue of RMB3,588.2 million, up 27.3% year on year, and net profit of RMB430.4 million, up 10.3%. R&D investment reached RMB1,450.7 million, an increase of 45.7%. Its differentiated innovation pipeline continues to expand, supported by technology platforms spanning next-generation immuno-oncology, Hanjugator ADCs, multispecific T-cell engagers and artificial intelligence. The company has more than 50 early-stage molecules in development across oncology, immunology and inflammation, neurology and metabolic diseases.
Guided by its twin strategic priorities of globalization and innovation, Henlius has built integrated capabilities supporting international expansion across R&D, clinical development, regulatory affairs, manufacturing and commercialization. In clinical development and regulatory affairs, the company has its own teams in Europe, the United States, Japan and Australia, and conducts clinical studies across nearly 30 countries and regions in collaboration with more than 1,000 clinical research centers. To date, Henlius has secured more than 190 clinical trial application approvals and over 90 marketing approvals worldwide. In manufacturing and supply, the company has completed more than 1,400 commercial GMP manufacturing batches and passed over 100 on-site inspections and audits by regulatory authorities worldwide and international partners, achieving a 100% pass rate.
For overseas commercialization, Henlius has established long-term relationships with international partners including Sandoz, Eisai, Abbott, Organon, Accord and Dr. Reddy’s, while building its own commercialization capabilities in the United States. In 2026, with China serving as its global headquarters, the company is accelerating the establishment of its own overseas commercial team across five core functions: commercial alliance, affiliate commercial, market access and pricing, commercial strategy and operations, and medical affairs. This approach combines in-house commercialization capability with licensing partners. As Henlius advances its own commercialization infrastructure in key markets such as the United States, it will take a more direct role in overseas commercial operations, strengthening market access and commercial execution to support the long-term development of its global business.
As its innovative pipeline advances and its own overseas commercialization capabilities take shape, Henlius will further implement its Globalization 2.0 strategy to bring more quality, innovative therapies to patients worldwide.
* In June 2026, serplulimab received NMPA approval, becoming the world’s first anti-PD-1 monoclonal antibody approved for the perioperative treatment of gastric cancer. As of October 2026, it remains the only anti-PD-1 monoclonal antibody approved for this indication.
** POHERDY received approval from the U.S. Food and Drug Administration in November 2025, the European Commission in April 2026 and China’s NMPA in May 2026. As of October 2026, it remains the first and only Chinese-developed pertuzumab biosimilar approved in all three markets.
Previous Chapter
Henlius reports positive results from ASTRIDE U.S. bridging study for serplulimab in combination with chemotherapy for first-line treatment of patients with extensive-stage small cell lung cancer (ES-SCLC)
Next Chapter
None
Back
Privacy Policy
Cookies Policy
Accessibility
Terms of Use
Privacy Policy
Introduction
Shanghai Henlius Biotech, Inc., and, where applicable, its affiliates and subsidiaries (collectively, “we” , “us” or “our”) attach great importance to the protection of your privacy and personal information. This Privacy Notice (this “Policy”) is formulated in accordance with applicable PRC laws and regulations governing the protection of personal information in the People’s Republic of China (“PRC”).
This Policy applies when: (1) you browse or use our website and other online resources (such as our WeChat official accounts); (2) subscribe to our news or announcements; or (3) contact us through the contact details or other interactive features made available on our website, or otherwise interact with us through our website.. The purpose of this Policy is to explain how and why we process your personal information, the types of personal information involved, applicable retention periods, your rights, and the measures we take to protect personal information. Please read this Policy carefully to ensure that you fully understand its content.
In certain business scenarios, we may provide additional explanations regarding the processing of your personal information through separate agreements, privacy statements, or personal information notices. In the event of any inconsistency, such documents shall prevail. For example, where a recruitment function is provided through a third-party platform or service, the relevant third party privacy policy or notice may also apply.
For the purposes of this Policy, “personal information” refers to all kinds of information related to identified or identifiable natural persons, excluding anonymized information.
We collect, use, store, transfer and otherwise process personal information in strict compliance with applicable PRC laws and regulations of the People’s Republic of China.
Our website may contain links to third party websites for your convenience. We do not control, and are not responsible for, the privacy practices of such third parties. We encourage you to review their privacy policies before using those websites.
If you have any questions or concerns regarding this Policy or our processing of personal information, please contact us using the details provided below.
This Policy will help you understand:
I. How we collect your personal information
II. How we use your personal information
III. How we entrust, share, transfer and publicly disclose your personal information
IV. Cross border transfer of personal information
V. How we store your personal information
VI. Security measures
VII. Your rights
VIII. Personal information of minors
IX. Updates to this Policy
X. How to contact us
I. How do we collect your personal information?
In addition to our employees, we may process personal information of the following persons:
• Visitors and users of our website;
• Healthcare Professionals;
• Investigators of clinical trial institutions and personnel of contract research organizations in clinical trials;
• Subjects of clinical trials and their relatives;
• Consumers/patients and their relatives using our products or services;
• Staff of business partners (including vendors, distributors, partners, etc.); and
• Our applicants.
We may process personal information of website visitors and individuals who contact or interact with us through our website or other online resources. Depending on the relevant page, function, or interaction, separate privacy notices, consents, platform privacy policies, contracts, or other notices may apply.
Based on the context in which you interact with us, we may collect personal information by the following means and on the legal bases permitted by applicable PRC laws and regulations, including your consent, the necessity for entering into or performing a contract, compliance with legal obligations, protection of life, health or property, public health needs, or other circumstances permitted by law:
• Your personal information provided to us voluntarily
When you subscribe to our news or announcements, contact us through the contact details or other interactive features made available on our website, a third-party platform or service linked or referred to on our website, or otherwise communicate with us in relation to our website, we may collect the personal information that you voluntarily provide, such as your name, contact details, organization, and the content of your inquiry or request, depending on the relevant page or function.
• Personal information collected by us independently through our website and other online channels
When you visit our website, most of our services do not require any registration, and you can visit our website without telling us who you are. However, some pages or functions may require you to provide certain personal information. If you choose not provide such information as we request, you may not be able to access certain content or functions or we may not be able to respond to your inquiry, request or subscription. Please refer to the relevant page or notice for further details about the categories of personal information collected in a specific scenario.
• Personal information we collect from vendors or business partners
In the course of our daily business operations, we may collect personal information from our vendors or business partners. We require our vendors and business partners to comply with the requirements of the personal information protection laws and regulations of the PRC and to lawfully provide us with personal information. If you are an employee or representative of one of our vendors or business partners, we may collect personal information such as your name and contact details for the purpose of establishing business contacts and cooperations.
• Personal information we collect from publicly available sources
We may collect personal information of medical and healthcare professionals from such publicy available sources, such as the official websites of medical institutions and the official websites of competent government departments, and process such information within a reasonable scope and for lawful purposes. For example, for the purpose of lawful academic or professional interaction with healthcare professionals, we may collect the name, gender, employer, position, practitioner registration information, academic title, degree, educational background, specialty expertise, and profile information, where such information has been lawfully made public.
Our website may include links, contact details, QR codes, or references to third-party platforms or services. Where you choose to interact with us through such third-party platforms or services, the relevant third party may also process your personal information in accordance with its own privacy policy and applicable law, and we encourage you to review such policy before submitting your information.
II. How do we use your personal information?
We may use your personal information for the following purposes:
• Operating, maintaining and improving our website and other online resource;
• Researching, developing, providing and continuously improving our products and services;
• Conducting and managing daily business;
• Academic interaction with healthcare professionals;
• Responding to your inquiries, requests, or communications sent through our website or the contact details made available on our website;
• Providing subscription services for our news, announcements, or investor-related updates;
• Managing and maintaining our relationship and communications with business contacts who reach us through our website;
• Recruiting and human resource management;
• Internal compliance management,audit,record-keeping; and
• Complying with applicable PRC laws and regulations, for example, monitoring and reporting adverse events for purposes of performing drug quality management responsibilities, providing medical information and dealing with product complaints, etc..
We will process personal information only to the extent necessary for the relevant purpose. Where required by applicable law, we will obtain your consent or separate consent before processing your personal information or sensitive personal information. Where a third-party platform or service is used in connection with a particular function, the relevant third party may process your personal information in accordance with its own privacy policy and applicable law.
III. How do we entrust, share, transfer and publicly disclose your personal information?
1. Entrustment
We may entrust our business partners with the processing of your personal information for the purpose(s) described in this Policy. We will enter into appropriate confidentiality, data processing and security agreements with such entrusted parties and require them to process personal information in accordance with our instructions , this Policy and applicable PRC laws and regulations.
2. Sharing and public disclosure
For the purpose(s) described in this Policy, we will share or publicly disclose your personal information only where permitted by applicable PRC laws and regulations and, where required, after obtaining your consent or separate consent. Such circumstances may include:
• Sharing your personal information among our affiliates and subsidiaries where necessary for legitimate business, management, compliance, or operational purposes;
• Sharing your personal information with vendors or business partners (such as conference service providers, travel service providers, data service providers, banking or insurance institutions, other professional service organizations, to the extent necessary for the relevant purpose); and
• Disclosing your personal information to the extent that it is permitted or required by applicable PRC laws and regulations or for the purpose of assisting with investigations by judicial, regulatory or law enforcement authorities.
• other circumstances permitted by applicable PRC laws and regulations.
If you submit your information through or in connection with a third-party platform or service referred to on our website, the relevant third party may independently process your personal information in accordance with its own privacy policy and applicable law.
3. Transfer
We will not transfer your personal information to any other company, entity or individual unless otherwise permitted by applicable law and, where required, after obtaining your consent. Further, in the event of a merger, acquisition, insolvency, reorganization, division, dissolution, bankruptcy, or similar transaction, we will require the new processor of your personal information to continue to be bound by this Policy or we will require the new processor to obtain your consent again.
IV.How do we provide your personal information across borders?
In principle, personal information that we collect and generate in the course of our operations within the territory of the PRC will be stored within the PRC. In certain circumstances, it may be necessary for us to provide your personal information to recipients outside the PRC in connection with our business operations, website functions, or communications, where permitted by applicable PRC laws and regulations. As required by applicable laws and regulations regarding the protection of personal information, we will provide you with the required notice and obtain your separate consent before providing your personal information across any border, unless otherwise permitted by law. We will use lawful cross-border transfer mechanisms to transfer your personal information oversea and will take necessary measures to ensure that the oversea recipients provide a level of protection required by applicable PRC laws and regulations.
You may obtain more information about cross-border transfers of personal information and oversea recipients through the contact methods referred to in this Policy.
V. How do we store your personal information?
We will retain your personal information for the minimum period necessary to achieve the purposes described in this Policy ,unless a longer retention period is required or permitted by applicable PRC laws and regulations. Upon expiration of the applicable retention period, we will promptly delete or anonymize your personal information in accordance with applicable PRC laws and regulations. Our criteria for determining the period for which personal information shall be retained include:
• Applicable laws, regulations and other relevant requirements;
• The period of time needed for us to provide services, maintain business relations or interact with you; and
• The period of time needed for us to perform relevant agreements or fulfil the purposes described in this Policy.
VI. What security measures do we take to protect your personal information?
In accordance with applicable PRC laws, regulations, and the requirements of relevant national standards, we take reasonable and appropriate security and precautionary measures to protect the personal information we process against unauthorized access, public disclosure, use, modification, destruction or loss of data. However, you are also responsible for taking appropriate measures to protect the security of the devices, systems, and networks you use when accessing our website or communicating with us.
VII. Your rights
In accordance with the requirements of the applicable PRC laws and regulations, you may have the following rights in respect of your personal information:
• To know about and make decisions regarding the processing of your personal information;
• To access or copy your personal information;
• To correct or supplement your personal information;
• To delete your personal information;
• To request for explanation of rules regarding processing of personal information; and
• To change the scope of your consent or revoke your consent , where processing is based on your consent.
If you wish to exercise your rights with respect to personal information, you may contact us through the contact information listed in this Policy and we will respond to any request in accordance with applicable relevant laws and regulations. When you exercise the above rights, we may verify your identity to safeguard the security of your personal information. Subject to applicable PRC laws and regulations, there may be circumstances where we are unable to respond to all or part of your request.
VIII. How do we process the personal information of minors?
For the purposes of this Policy and in accordance with applicable PRC laws and regulations, our products, websites and services are not targeted at minors under the age of 14. Minors under the age of 14 should not provide personal information to us without the consent of a parent or legal guardian.
If a minor's personal information is collected with the consent of a parent or legal guardian, we will process the information only when permitted by law, with the express consent of the parent or legal guardian, or necessary for the protection of the minor. If we discover that we have collected personal information without obtaining verifiable prior consent of a parent or legal guardian, we will seek to delete the data as soon as possible.
IX. Updates of the Policy
We may revise our Privacy Policy from time to time. We will post the updated version on our website and update the “Last Updated” date above or below this Policy.
Last updated: March 30, 2026.
X. How to contact us?
If you have any questions, comments or suggestions concerning this Policy, or any questions or concerns about our processing of your personal information, you may contact us in the following ways:
Address: 11/F, B8 Building, No.188 Yizhou Rd, Xuhui District, Shanghai
Tel.: 021- 33395800
Postal Code: 200233
Email: [email protected]
Cookies Policy
When you visit our website, we may place small data files known as “cookies” on your device. Cookies enable our website to recognize your browser and help us understand how visitors use the site.
Cookies and similar technologies used on this website may collect online identifiers, device information, browser information, IP address, and information about how you interact with the website. In certain circumstances, such information may constitute personal information or may be associated with you under applicable PRC laws and regulations. Information collected through cookies is used for purposes such as ensuring website operation, maintaining security, analyzing traffic and performance, remembering user preferences, and improving website content and user experience.
You may choose to accept or decline cookies by adjusting your browser settings or through any cookie banner or preference center made available on our website, if applicable. Please note that disabling cookies may affect the functionality of certain parts of the website.
2026-10-30
近日,复宏汉霖在国际生物医药行业重要年度评选——Scrip Awards及Citeline Biotech Awards中入围四个奖项。两项评选均面向全球生物医药行业,由药物研发、临床开发及产业领域的资深人士参与评审,旨在表彰新药研发、临床研究及企业发展中的突出成果。 此次评选中,公司自主研发的创新型抗PD-1单抗H药 汉斯状®(斯鲁利单抗,欧洲商品名:Hetronifly®)胃癌围术期Ⅲ期研究ASTRUM-006入围Scrip“最佳肿瘤研发进展奖”(Best Oncology R&D Advance)。围绕该研究,复宏汉霖还入围Citeline“年度临床试验结果奖”(Clinical Trial Result of the Year)和“患者优先奖”(Patient-First Award),两项申报分别聚焦研究的临床结果及患者价值。此外,公司还入围Citeline“年度生物制药公司奖”(Biopharma Company of the Year)。此次四项入围,体现了国际生物医药业界对复宏汉霖在临床创新、患者价值及企业综合表现等方面的关注。
今年6月,H药成为全球首个*获批胃癌围术期适应症的抗PD-1单抗,为PD-L1表达CPS≥5的可手术切除胃癌患者带来术后“去化疗”的新选择。针对胃癌患者术后化疗耐受差、难以完成治疗的临床痛点,ASTRUM-006创新性地采用术前免疫联合化疗、术后免疫单药辅助治疗的策略。与化疗对照组相比,该方案显著延长无事件生存期,病理完全缓解率达到21.6%,为对照组的3倍以上;≥3级治疗相关不良事件及因治疗相关不良事件停药的比例均更低,在改善疗效的同时兼顾患者的治疗耐受性。
ASTRUM-006研究成果已在2026年ASCO年会以口头报告形式公布,并同期发表于《柳叶刀》(The Lancet),相关方案也已纳入《CSCO胃癌诊疗指南(2026版)》。此次与该研究相关的三项国际奖项入围,使H药胃癌围术期治疗方案在改善疗效、减轻治疗负担方面的价值受到更多关注,也让复宏汉霖以临床需求驱动创新的研发成果进一步走入国际视野。
此外,复宏汉霖亦持续拓展不同疾病领域的产品布局,加强从研发到商业化的综合能力建设,并在此次评选中入围Citeline“年度生物制药公司奖”。2026年,汉倍优®接连获欧盟委员会和中国药监局批准上市,成为首个且唯一**在中、美、欧三大主流市场获批的国产帕妥珠单抗生物类似药,与汉曲优®组成首个中美欧获批的国产“曲帕双靶”方案,贯穿从新辅助、辅助到晚期一线全程治疗管理。同时,公司正加速布局包括新型内分泌疗法拉索昔芬HLX78、新表位抗HER2单抗HLX22、HER2 ADC HLX87、KAT6A/B口服抑制剂HLX97、HER2双表位ADC HLX49及首款国产帕妥珠单抗曲妥珠单抗皮下复方制剂HLX319等,致力打造全周期、多维度的完善乳腺癌治疗创新矩阵。H药在欧盟新增获批非鳞状非小细胞肺癌、食管鳞癌及鳞状非小细胞肺癌三项一线治疗适应症,进一步拓展海外获批适应症范围。
在临床开发方面,核心资产新表位抗HER2单抗dulpatatug(HLX22)、 PD-L1 ADC HLX43的全球临床开发持续推进。与此同时,公司高效推进以HLX3901、HLX3902、HLX48、HLX97及HLX316等为代表的具有BIC/FIC潜力的新一代创新分子,持续夯实长期增长储备。
公司经营增长与创新投入同步推进。2026年上半年,复宏汉霖实现营业收入35.882亿元,同比增长27.3%;净利润4.304亿元,同比增长10.3%;研发投入达14.507亿元,同比增长45.7%。公司差异化创新管线储备持续扩容,已形成下一代IO、Hanjugator ADC、多特异性TCE及AI 等技术平台,储备50余个在研早期分子,覆盖肿瘤、免疫炎症、神经和代谢等领域。
公司自身能力建设方面,正持续推进“全球化”与“创新”双轮驱动战略,已构建覆盖研发、临床、注册、生产、商业化的体系化出海能力 。在临床与注册端,公司在欧美日澳均设有自有团队,在近30个国家和地区同步开展临床研究,合作临床研究中心超1000家;累计在全球获得超190项临床试验申请批准及超90项上市注册批件。在生产与供应方面,公司累计完成GMP商业化生产批次超1400批,并顺利通过全球各国药监机构及国际合作方超百项实地核查与审计,核查通过率100%。
在海外商业化方面,复宏汉霖已与Sandoz、Eisai、Abbott、Organon、Accord、Dr. Reddy’s等国际合作伙伴建立长期合作关系,并同步推进美国自主商业化能力建设。 2026年,公司以中国为全球总部,通过构建商业合作、商业化运营、市场准入与定价、商业战略与运营、医学事务的五大核心职能,加速组建海外自有商业化团队,形成“自建团队+授权合作伙伴”双轮驱动模式。随着美国等重点市场自主商业化布局的推进,公司将更直接地参与海外商业化运营,筑牢海外市场准入与商业化执行能力的根基,推动全球业务的长期发展。
随着公司创新管线持续推进、海外自主商业化布局逐步落地,公司将进一步深化全球化2.0战略,推动更多高品质创新疗法惠及全球患者。
*2026年6月,斯鲁利单抗获得NMPA批准成为全球首个获批胃癌围术期治疗的抗PD-1单抗,截至2026年10月是唯一
** 2025年11月获美国FDA批准,2026年4月获欧盟EC批准,2026年5月获中国NMPA批准,截至2026年10月是首个且唯一
Copyright © 2019 All rights reserved 上海复宏汉霖生物技术股份有限公司
沪ICP备13029242号-1
 沪公网安备 31010402002777号
互联网药品信息服务资格证书编号:(沪)-非经营性-2024-0127


领英

微信
搜索
Oct 27, 2026|2026
Henlius reports positive results from ASTRIDE U.S. bridging study for serplulimab in combination with chemotherapy for first-line treatment of patients with extensive-stage small cell lung cancer (ES-SCLC)
-
ASTRIDE trial for first-line ES-SCLC demonstrated favorable median overall survival in serplulimab with chemotherapy versus atezolizumab plus chemotherapy
-
Study enrolled over 200 U.S. patients, including underrepresented racial and ethnic populations
-
Results support ASTRUM-005, a global, randomized, double-blind Phase 3 trial, which showed statistically significant overall survival benefit
On October 26, 2026, Shanghai Henlius Biotech, Inc (“Henlius”), a global, innovation-driven biopharmaceutical company, announced at the European Society for Medical Oncology (ESMO) Congress 2026, positive results from ASTRIDE, a randomized, descriptive, open-label, U.S. study of serplulimab (in Europe, Hetronifly®), an anti-PD-1 monoclonal antibody (mAb), in combination with carboplatin and etoposide (chemotherapy) compared to atezolizumab plus chemotherapy for first-line treatment of patients with extensive-stage small cell lung cancer (ES-SCLC). The study is led by David R. Gandara, MD, Professor Emeritus at the University of California Davis Comprehensive Cancer Center in Sacramento, California.
As of data cutoff on February 18, 2026, the median follow-up duration was 14.1 months. Despite a higher proportion of patients with liver metastasis in the serplulimab group than in the atezolizumab group (49.5% vs 40.0%), median OS was numerically longer with serplulimab than with atezolizumab (12.4 vs 10.2 months; hazard ratio [HR], 0.82; 95% confidence interval [CI], 0.56-1.20). One-year OS rates were 52.4% and 41.4%, and two-year OS rates were 32.2% and 17.6%, respectively.
David R. Gandara, MD, Professor Emeritus at the University of California Davis Comprehensive Cancer Center and the leading principal investigator in the ASTRIDE trial said, “ES-SCLC is a rapidly progressive and life-threatening disease.Overall survival is the primary endpoint. The results are remarkably consistent with those of ASTRUM-005. In particular, the two-year survival rate of 32% is identical in both studies, ASTRIDE and the previous ASTRUM-005 phase 3 trial.These results provide an important clinical assessment of serplulimab in the U.S. patient population and strongly support the benefit of serplulimab and applicability of the ASTRUM-005 findings to the U.S. patients with ES-SCLC in the first-line setting.”
Dr. Jason Zhu, Executive Director and Chief Executive Officer of Henlius, said, “Serplulimab is a current treatment option for patients in Europe and other global markets, and the results from our ASTRIDE study, combined with our ASTRUM-005 Phase 3 trial, reflect the potential benefit for U.S. patients with ES-SCLC, a rare and aggressive disease. These encouraging results further validate our strategy and commitment to finding better treatment options for patients worldwide.”
Summary of ASTRIDE Results
ASTRIDE is a randomized, open-label, descriptive, U.S. trial conducted in the United States. Between 2022 and 2025, it randomized 201 patients across 63 sites with ES-SCLC 1:1 to serplulimab 300 mg every three weeks plus carboplatin and etoposide or atezolizumab 1,200 mg every three weeks plus carboplatin and etoposide. Atezolizumab was selected as the active comparator because it is most widely used in U.S. practice. The ASTRIDE protocol was amended in June 2024 to allow newly diagnosed patients to receive one cycle of chemotherapy before randomization. The amendment allowed participation of eligible U.S. patients who needed to begin chemotherapy treatment before completing trial screening for enrolment and helped increase accrual.
The primary endpoint is OS, and the secondary endpoints included progression-free survival (PFS), objective response rate (ORR), duration of response (DOR), assessed by blinded independent central review (BICR), together with safety. Analyses were descriptive, and no formal hypothesis testing for superiority or noninferiority was planned.
CI, confidence interval; HR, hazard ratio; NE, not evaluable; No., number; OS, overall survival.
Median PFS assessed by blinded independent central review (BICR) was 5.4 months with serplulimab and 4.9 months with atezolizumab. ORR was 65.7% and 67.0%, and median DOR was 4.2 and 4.0 months, respectively. In total, 158 patients in the ITT population had no prior chemotherapy for newly diagnosed ES-SCLC (serplulimab group: 82 patients; atezolizumab group: 76 patients). Among these patients, the median OS was 13.4 and 10.8 months in the respective groups, with an HR of 0.77 (95% CI, 0.50–1.17).
Safety profiles were similar between the groups. Grade ≥3 treatment-emergent adverse events (TEAEs) occurred in 73.7% of patients in the serplulimab group and 73.0% of patients in the atezolizumab group. Grade ≥3 TEAEs related to serplulimab or atezolizumab occurred in 20.2% and 25.0% of patients, respectively. Immune-related adverse events occurred in 21.2% and 23.0% of patients, respectively.
The ASTRIDE study is conducted exclusively in the U.S. and includes underrepresented groups, including 5% of patients who are Black or African American and 4.5% of patients are Hispanic or Latino. ASTRIDE is a complementary study to the global phase 3 ASTRUM-005 study.
ASTRUM-005
ASTRUM-005, was a randomized, double-blind, international, phase 3 clinical study aimed to compare the efficacy and safety of serplulimab with placebo when combined with chemotherapy (carboplatin-etoposide) in previously untreated patients with ES-SCLC. Enrolled patients were randomized 2:1 to receive intravenous infusion of either serplulimab or placebo in combination with chemotherapy every three weeks until disease progression, death, intolerable toxicity, withdrawal of informed consent, or other reasons specified in the protocol (whichever occurred first). The primary endpoint of this study was overall survival (OS). The secondary endpoints included progression-free survival (PFS), objective response rate (ORR), duration of response (DOR), safety, pharmacokinetic characteristics, and immunogenicity. ASTRUM-005 included a total of 128 sites in countries including Türkiye, Poland, Georgia, and China, and enrolled 585 subjects from 114 sites, among whom 31.5% were White. In December 2021, ASTRUM-005 met its primary study endpoint of the overall survival (OS) in the interim analysis and demonstrated a manageable safety profile.
Serplulimab
Serplulimab, an anti-PD-1 mAb, has been approved in more than 50 countries and regions for first-line treatment of ES-SCLC, squamous non-small cell lung cancer (sqNSCLC), esophageal squamous cell carcinoma (ESCC), non-squamous non-small cell lung cancer (nsqNSCLC), and is the world’s first and only[i] anti-PD-1 monoclonal antibody approved for perioperative treatment of gastric cancer.[ii] It is included in reimbursement or public healthcare coverage systems of more than 10 countries, including the U.K., Germany, Italy, and Spain. FDA granted serplulimab orphan-drug designation for the treatment of small cell lung cancer in March 2022.
[i] In June 2026, serplulimab received NMPA approval as the world's first anti-PD-1 mAb for perioperative gastric cancer treatment. As of October 2026, it remains the only one.
[ii] Approved indications and product presentations may vary by region.
Previous Chapter
Henlius' PD-L1 ADC HLX43 Debuts Gastric Cancer Phase 2 Data at ESMO 2026, Reinforcing Pan-Tumor Potential
Next Chapter
Henlius Shortlisted for Four Scrip and Citeline Awards, Including Three for the ASTRUM-006 Study of Serplulimab
Back
Privacy Policy
Cookies Policy
Accessibility
Terms of Use
Privacy Policy
Introduction
Shanghai Henlius Biotech, Inc., and, where applicable, its affiliates and subsidiaries (collectively, “we” , “us” or “our”) attach great importance to the protection of your privacy and personal information. This Privacy Notice (this “Policy”) is formulated in accordance with applicable PRC laws and regulations governing the protection of personal information in the People’s Republic of China (“PRC”).
This Policy applies when: (1) you browse or use our website and other online resources (such as our WeChat official accounts); (2) subscribe to our news or announcements; or (3) contact us through the contact details or other interactive features made available on our website, or otherwise interact with us through our website.. The purpose of this Policy is to explain how and why we process your personal information, the types of personal information involved, applicable retention periods, your rights, and the measures we take to protect personal information. Please read this Policy carefully to ensure that you fully understand its content.
In certain business scenarios, we may provide additional explanations regarding the processing of your personal information through separate agreements, privacy statements, or personal information notices. In the event of any inconsistency, such documents shall prevail. For example, where a recruitment function is provided through a third-party platform or service, the relevant third party privacy policy or notice may also apply.
For the purposes of this Policy, “personal information” refers to all kinds of information related to identified or identifiable natural persons, excluding anonymized information.
We collect, use, store, transfer and otherwise process personal information in strict compliance with applicable PRC laws and regulations of the People’s Republic of China.
Our website may contain links to third party websites for your convenience. We do not control, and are not responsible for, the privacy practices of such third parties. We encourage you to review their privacy policies before using those websites.
If you have any questions or concerns regarding this Policy or our processing of personal information, please contact us using the details provided below.
This Policy will help you understand:
I. How we collect your personal information
II. How we use your personal information
III. How we entrust, share, transfer and publicly disclose your personal information
IV. Cross border transfer of personal information
V. How we store your personal information
VI. Security measures
VII. Your rights
VIII. Personal information of minors
IX. Updates to this Policy
X. How to contact us
I. How do we collect your personal information?
In addition to our employees, we may process personal information of the following persons:
• Visitors and users of our website;
• Healthcare Professionals;
• Investigators of clinical trial institutions and personnel of contract research organizations in clinical trials;
• Subjects of clinical trials and their relatives;
• Consumers/patients and their relatives using our products or services;
• Staff of business partners (including vendors, distributors, partners, etc.); and
• Our applicants.
We may process personal information of website visitors and individuals who contact or interact with us through our website or other online resources. Depending on the relevant page, function, or interaction, separate privacy notices, consents, platform privacy policies, contracts, or other notices may apply.
Based on the context in which you interact with us, we may collect personal information by the following means and on the legal bases permitted by applicable PRC laws and regulations, including your consent, the necessity for entering into or performing a contract, compliance with legal obligations, protection of life, health or property, public health needs, or other circumstances permitted by law:
• Your personal information provided to us voluntarily
When you subscribe to our news or announcements, contact us through the contact details or other interactive features made available on our website, a third-party platform or service linked or referred to on our website, or otherwise communicate with us in relation to our website, we may collect the personal information that you voluntarily provide, such as your name, contact details, organization, and the content of your inquiry or request, depending on the relevant page or function.
• Personal information collected by us independently through our website and other online channels
When you visit our website, most of our services do not require any registration, and you can visit our website without telling us who you are. However, some pages or functions may require you to provide certain personal information. If you choose not provide such information as we request, you may not be able to access certain content or functions or we may not be able to respond to your inquiry, request or subscription. Please refer to the relevant page or notice for further details about the categories of personal information collected in a specific scenario.
• Personal information we collect from vendors or business partners
In the course of our daily business operations, we may collect personal information from our vendors or business partners. We require our vendors and business partners to comply with the requirements of the personal information protection laws and regulations of the PRC and to lawfully provide us with personal information. If you are an employee or representative of one of our vendors or business partners, we may collect personal information such as your name and contact details for the purpose of establishing business contacts and cooperations.
• Personal information we collect from publicly available sources
We may collect personal information of medical and healthcare professionals from such publicy available sources, such as the official websites of medical institutions and the official websites of competent government departments, and process such information within a reasonable scope and for lawful purposes. For example, for the purpose of lawful academic or professional interaction with healthcare professionals, we may collect the name, gender, employer, position, practitioner registration information, academic title, degree, educational background, specialty expertise, and profile information, where such information has been lawfully made public.
Our website may include links, contact details, QR codes, or references to third-party platforms or services. Where you choose to interact with us through such third-party platforms or services, the relevant third party may also process your personal information in accordance with its own privacy policy and applicable law, and we encourage you to review such policy before submitting your information.
II. How do we use your personal information?
We may use your personal information for the following purposes:
• Operating, maintaining and improving our website and other online resource;
• Researching, developing, providing and continuously improving our products and services;
• Conducting and managing daily business;
• Academic interaction with healthcare professionals;
• Responding to your inquiries, requests, or communications sent through our website or the contact details made available on our website;
• Providing subscription services for our news, announcements, or investor-related updates;
• Managing and maintaining our relationship and communications with business contacts who reach us through our website;
• Recruiting and human resource management;
• Internal compliance management,audit,record-keeping; and
• Complying with applicable PRC laws and regulations, for example, monitoring and reporting adverse events for purposes of performing drug quality management responsibilities, providing medical information and dealing with product complaints, etc..
We will process personal information only to the extent necessary for the relevant purpose. Where required by applicable law, we will obtain your consent or separate consent before processing your personal information or sensitive personal information. Where a third-party platform or service is used in connection with a particular function, the relevant third party may process your personal information in accordance with its own privacy policy and applicable law.
III. How do we entrust, share, transfer and publicly disclose your personal information?
1. Entrustment
We may entrust our business partners with the processing of your personal information for the purpose(s) described in this Policy. We will enter into appropriate confidentiality, data processing and security agreements with such entrusted parties and require them to process personal information in accordance with our instructions , this Policy and applicable PRC laws and regulations.
2. Sharing and public disclosure
For the purpose(s) described in this Policy, we will share or publicly disclose your personal information only where permitted by applicable PRC laws and regulations and, where required, after obtaining your consent or separate consent. Such circumstances may include:
• Sharing your personal information among our affiliates and subsidiaries where necessary for legitimate business, management, compliance, or operational purposes;
• Sharing your personal information with vendors or business partners (such as conference service providers, travel service providers, data service providers, banking or insurance institutions, other professional service organizations, to the extent necessary for the relevant purpose); and
• Disclosing your personal information to the extent that it is permitted or required by applicable PRC laws and regulations or for the purpose of assisting with investigations by judicial, regulatory or law enforcement authorities.
• other circumstances permitted by applicable PRC laws and regulations.
If you submit your information through or in connection with a third-party platform or service referred to on our website, the relevant third party may independently process your personal information in accordance with its own privacy policy and applicable law.
3. Transfer
We will not transfer your personal information to any other company, entity or individual unless otherwise permitted by applicable law and, where required, after obtaining your consent. Further, in the event of a merger, acquisition, insolvency, reorganization, division, dissolution, bankruptcy, or similar transaction, we will require the new processor of your personal information to continue to be bound by this Policy or we will require the new processor to obtain your consent again.
IV.How do we provide your personal information across borders?
In principle, personal information that we collect and generate in the course of our operations within the territory of the PRC will be stored within the PRC. In certain circumstances, it may be necessary for us to provide your personal information to recipients outside the PRC in connection with our business operations, website functions, or communications, where permitted by applicable PRC laws and regulations. As required by applicable laws and regulations regarding the protection of personal information, we will provide you with the required notice and obtain your separate consent before providing your personal information across any border, unless otherwise permitted by law. We will use lawful cross-border transfer mechanisms to transfer your personal information oversea and will take necessary measures to ensure that the oversea recipients provide a level of protection required by applicable PRC laws and regulations.
You may obtain more information about cross-border transfers of personal information and oversea recipients through the contact methods referred to in this Policy.
V. How do we store your personal information?
We will retain your personal information for the minimum period necessary to achieve the purposes described in this Policy ,unless a longer retention period is required or permitted by applicable PRC laws and regulations. Upon expiration of the applicable retention period, we will promptly delete or anonymize your personal information in accordance with applicable PRC laws and regulations. Our criteria for determining the period for which personal information shall be retained include:
• Applicable laws, regulations and other relevant requirements;
• The period of time needed for us to provide services, maintain business relations or interact with you; and
• The period of time needed for us to perform relevant agreements or fulfil the purposes described in this Policy.
VI. What security measures do we take to protect your personal information?
In accordance with applicable PRC laws, regulations, and the requirements of relevant national standards, we take reasonable and appropriate security and precautionary measures to protect the personal information we process against unauthorized access, public disclosure, use, modification, destruction or loss of data. However, you are also responsible for taking appropriate measures to protect the security of the devices, systems, and networks you use when accessing our website or communicating with us.
VII. Your rights
In accordance with the requirements of the applicable PRC laws and regulations, you may have the following rights in respect of your personal information:
• To know about and make decisions regarding the processing of your personal information;
• To access or copy your personal information;
• To correct or supplement your personal information;
• To delete your personal information;
• To request for explanation of rules regarding processing of personal information; and
• To change the scope of your consent or revoke your consent , where processing is based on your consent.
If you wish to exercise your rights with respect to personal information, you may contact us through the contact information listed in this Policy and we will respond to any request in accordance with applicable relevant laws and regulations. When you exercise the above rights, we may verify your identity to safeguard the security of your personal information. Subject to applicable PRC laws and regulations, there may be circumstances where we are unable to respond to all or part of your request.
VIII. How do we process the personal information of minors?
For the purposes of this Policy and in accordance with applicable PRC laws and regulations, our products, websites and services are not targeted at minors under the age of 14. Minors under the age of 14 should not provide personal information to us without the consent of a parent or legal guardian.
If a minor's personal information is collected with the consent of a parent or legal guardian, we will process the information only when permitted by law, with the express consent of the parent or legal guardian, or necessary for the protection of the minor. If we discover that we have collected personal information without obtaining verifiable prior consent of a parent or legal guardian, we will seek to delete the data as soon as possible.
IX. Updates of the Policy
We may revise our Privacy Policy from time to time. We will post the updated version on our website and update the “Last Updated” date above or below this Policy.
Last updated: March 30, 2026.
X. How to contact us?
If you have any questions, comments or suggestions concerning this Policy, or any questions or concerns about our processing of your personal information, you may contact us in the following ways:
Address: 11/F, B8 Building, No.188 Yizhou Rd, Xuhui District, Shanghai
Tel.: 021- 33395800
Postal Code: 200233
Email: [email protected]
Cookies Policy
When you visit our website, we may place small data files known as “cookies” on your device. Cookies enable our website to recognize your browser and help us understand how visitors use the site.
Cookies and similar technologies used on this website may collect online identifiers, device information, browser information, IP address, and information about how you interact with the website. In certain circumstances, such information may constitute personal information or may be associated with you under applicable PRC laws and regulations. Information collected through cookies is used for purposes such as ensuring website operation, maintaining security, analyzing traffic and performance, remembering user preferences, and improving website content and user experience.
You may choose to accept or decline cookies by adjusting your browser settings or through any cookie banner or preference center made available on our website, if applicable. Please note that disabling cookies may affect the functionality of certain parts of the website.

2026-10-27
ASTRIDE研究显示,在一线治疗广泛期小细胞肺癌中,斯鲁利单抗联合化疗较阿替利珠单抗联合化疗呈现更长的中位总生存期结果
研究入组逾200例美国患者,涵盖种族及族裔少数群体
研究结果支持全球随机、双盲III期ASTRUM-005研究的发现;该研究已显示具有统计学显著性的总生存期获益
2026年10月26日,复宏汉霖(2696.HK)在2026年欧洲肿瘤内科学会年会(ESMO 2026)上公布ASTRIDE研究的积极结果。这是一项在美国开展的随机、描述性、开放标签研究,比较抗PD-1单抗斯鲁利单抗(欧洲商品名:Hetronifly®)联合卡铂及依托泊苷(化疗)与阿替利珠单抗联合化疗一线治疗广泛期小细胞肺癌(ES-SCLC)患者的疗效与安全性。研究由位于美国加利福尼亚州萨克拉门托的加州大学戴维斯分校综合癌症中心名誉教授David R. Gandara博士牵头开展。
截至2026年2月18日,中位随访时间为14.1个月。尽管斯鲁利单抗组肝转移患者比例高于阿替利珠单抗组(49.5% vs 40.0%),其中位总生存期(OS)仍在数值上长于阿替利珠单抗组,分别为12.4个月和10.2个月,风险比(HR)为0.82(95%置信区间[CI]:0.56–1.20)。两组1年OS率分别为52.4%和41.4%,2年OS率分别为32.2%和17.6%。
加州大学戴维斯分校综合癌症中心名誉教授、ASTRIDE研究牵头主要研究者
David R. Gandara博士
“
ES-SCLC是一种进展迅速且危及生命的疾病。总生存期是ASTRIDE研究的主要终点,研究结果延续了ASTRUM-005 III期研究所展现的积极生存信号,尤其是两年生存率达到32%,与此前ASTRUM-005趋势一致。ASTRIDE积极结果为评估斯鲁利单抗在美国患者人群中的临床表现提供了重要依据,并有力支持斯鲁利单抗的治疗获益,以及ASTRUM-005研究结果在美国ES-SCLC患者一线治疗中的适用性。
”
复宏汉霖执行董事、首席执行官
朱俊博士
“
斯鲁利单抗目前已成为欧洲及全球其他市场患者的治疗选择。ES-SCLC是一种罕见且侵袭性强的疾病,此次ASTRIDE研究与全球多中心III期ASTRUM-005研究结果吻合,展现了斯鲁利单抗为美国广泛期小细胞肺癌患者带来获益的潜力。这些令人鼓舞的结果进一步验证了我们的策略,以及为全球患者寻找更好治疗选择的承诺。
”
ASTRIDE 研究结果概要
ASTRIDE是一项在美国开展的随机、开放标签、描述性研究。2022年至2025年,研究在美国63个试验中心入组共201例ES-SCLC患者,患者按1:1比例随机分配,分别接受斯鲁利单抗300 mg、每三周一次联合卡铂及依托泊苷,或阿替利珠单抗1200 mg、每三周一次联合卡铂及依托泊苷。研究选择阿替利珠单抗作为对照药物,因其在美国临床实践中应用最为广泛。ASTRIDE研究于2024年6月修订方案,允许新诊断患者在随机分组前接受一个周期化疗。该修订使符合条件、但需要在完成入组筛选前启动化疗的美国患者能够参与研究,并有助于加快入组。
研究主要终点为OS,次要终点包括经盲态独立中心审评(BICR)的无进展生存期(PFS)、客观缓解率(ORR)、缓解持续时间(DOR),以及安全性。研究采用描述性分析,未计划进行优效性或非劣效性的正式假设检验。
CI, confidence interval; HR, hazard ratio; NE, not evaluable; No., number; OS, overall survival.
两组经盲态独立中心审评(BICR)评估的中位PFS分别为5.4个月和4.9个月,ORR分别为65.7%和67.0%,中位DOR分别为4.2个月和4.0个月。意向治疗(ITT)人群中,共158例患者既往未接受过针对ES-SCLC的化疗,其中斯鲁利单抗组82例、阿替利珠单抗组76例。在这些患者中,两组中位OS分别为13.4个月和10.8个月,HR为0.77(95% CI:0.50–1.17)。
两组安全性表现相近。斯鲁利单抗组和阿替利珠单抗组≥3级治疗期间出现的不良事件(TEAE)发生率分别为73.7%和73.0%;与斯鲁利单抗或阿替利珠单抗相关的≥3级TEAE发生率分别为20.2%和25.0%;免疫相关不良事件发生率分别为21.2%和23.0%。
ASTRIDE研究全部在美国开展,纳入了临床研究中代表性不足的人群,其中黑人或非裔美国人占5%,西班牙裔或拉丁裔占4.5%。ASTRIDE是对国际多中心III期 ASTRUM-005研究的补充研究。
ASTRUM 005研究
ASTRUM-005是一项随机、双盲、国际多中心III期临床研究,旨在比较斯鲁利单抗联合化疗与安慰剂联合化疗一线治疗广泛期小细胞肺癌(ES-SCLC)的疗效和安全性。斯鲁利单抗或安慰剂分别联合化疗(卡铂及依托泊苷)用于既往未经治疗的ES-SCLC患者的疗效与安全性。入组患者按2:1比例随机分组,每三周一次接受静脉输注斯鲁利单抗或安慰剂,直至出现疾病进展、死亡、不可耐受的毒性、撤回知情同意或方案规定的其他原因,以先发生者为准。主要终点是OS,次要终点包括PFS、ORR、DOR、安全性、药代动力学特征及免疫原性。研究在土耳其、波兰、格鲁吉亚、中国等国家共开设128家研究中心,其中114家中心共入组585例受试者,白人受试者占31.5%。2021年12月,ASTRUM-005在期中分析中达到OS主要研究终点,并显示出可管理的安全性特征。
斯鲁利单抗
斯鲁利单抗已在全球50多个国家和地区获批,获批适应症包括一线治疗ES-SCLC、鳞状非小细胞肺癌(sqNSCLC)、食管鳞癌(ESCC)、非鳞状非小细胞肺癌(nsqNSCLC)*,并且是全球首个且唯一**获批用于胃癌围术期治疗的抗PD-1单克隆抗体。斯鲁利单抗已在英国、德国、意大利、西班牙等10多个国家纳入医保或公共医疗保障体系。2022年3月,美国食品药品监督管理局(FDA)授予斯鲁利单抗治疗小细胞肺癌的孤儿药资格认定。
* 获批适应症及产品规格可能因地区而异。
** 2026年6月,斯鲁利单抗获得NMPA批准成为全球首个胃癌围术期治疗的抗PD-1单抗,截至2026年10月是唯一。
Copyright © 2019 All rights reserved 上海复宏汉霖生物技术股份有限公司
沪ICP备13029242号-1
沪公网安备 31010402002777号
互联网药品信息服务资格证书编号:(沪)-非经营性-2024-0127
领英
微信
搜索
Oct 25, 2026|2026
Henlius' PD-L1 ADC HLX43 Debuts Gastric Cancer Phase 2 Data at ESMO 2026, Reinforcing Pan-Tumor Potential
Shanghai, China, October 25, 2026—Shanghai Henlius Biotech, Inc. (2696.HK) today announced that results from HLX43-GC201, a phase 2 proof-of-concept (PoC) study of its PD-L1 antibody-drug conjugate (ADC) HLX43 in previously treated advanced gastric cancer were first presented at the 2026 European Society for Medical Oncology (ESMO) Congress, held October 23–27 in Madrid, Spain. The study is led by Professor Lin Shen, Director of the Department of Gastrointestinal Oncology at Peking University Cancer Hospital.
Following non-small cell lung cancer (NSCLC), thymic carcinoma (TC), gynecologic tumors, and esophageal squamous cell carcinoma (ESCC), HLX43 has once again demonstrated preliminary anti-tumor activity and tolerability in advanced gastric cancer—an important gastrointestinal tumor. This marks the continued validation of the molecule's early proof-of-concept across multiple solid tumors, reinforcing HLX43's druggability and therapeutic window, and laying an evidence-based foundation for its pan-tumor application.
Gastric/gastroesophageal junction (G/GEJ) adenocarcinoma remains a significant global health burden. According to GLOBOCAN estimates, approximately 1 million new cases were diagnosed worldwide in 2022.¹ Most patients present with advanced disease and have a poor prognosis, with a 5-year survival rate of only 6%.²⁻³ For patients with previously treated advanced G/GEJ adenocarcinoma, the current second-line standard of care is taxane-based chemotherapy, with or without ramucirumab; however, outcomes remain unsatisfactory, with median overall survival (OS) of only 5.2–9.5 months.⁴⁻⁵ In HER2-positive metastatic G/GEJ adenocarcinoma, trastuzumab deruxtecan significantly prolonged OS versus ramucirumab plus paclitaxel, establishing ADCs as an effective therapeutic strategy.⁶⁻⁷ There remains a significant unmet need for more effective treatment options in this setting.
HLX43 is a novel PD-L1-targeting ADC, composed of a fully humanized anti-PD-L1 IgG1 antibody, a novel tripeptide linker and topoisomerase inhibitor payload. The drug-to-antibody ratio (DAR) is around 8. Its mechanism of action integrates targeted cytotoxic delivery and immune checkpoint activation through PD-L1/PD-1 blockade. Upon binding to PD-L1-expressing tumor cells, HLX43's cytotoxic payload can be delivered into tumor cells via dual mechanisms—First, the ADC undergoes receptor-mediated endocytosis, releasing the cytotoxic payload intracellularly via linker cleavage, and the payload further diffuses into neighbouring tumor cells via bystander effect, thereby blocking DNA replication and triggering tumor cell apoptosis. Meanwhile, the anti-PD-L1 antibody of HLX43 activates immune modulation and blocks immune checkpoints, driving synergistic anti-tumor efficacy.
Early clinical data from its first-in-human (FIH) study, along with multiple proof-of-concept (POC) results across solid tumors, have been presented at several international scientific conferences, including ASCO, WCLC etc., showing a favourable efficacy and safety profile. Notably, in non-small cell lung cancer (NSCLC), HLX43 has demonstrated activity without the need for biomarker-based patient selection, suggesting potential applicability across a broad patient population. In addition to NSCLC, encouraging signals have also been observed in thymic carcinoma (TC), gynaecological tumors, esophageal squamous cell carcinoma (ESCC) and other solid tumors. Beyond monotherapy, the Company is actively exploring combination strategies of HLX43 with serplulimab (trade name: Hetronifly® in Europe) and anti-EGFR mAb pimurutamab HLX07, aiming to further expand its clinical potential.
Gastric cancer data readout represents the second pivotal milestone for HLX43 in GI tumors, underscoring its expanding therapeutic footprint in this area:
Trial Design
This data release is based on a randomized phase 2 study in patients with histologically or cytologically confirmed locally advanced or metastatic gastric/gastroesophageal junction (G/GEJ) adenocarcinoma. Patients had experienced failure or progression or developed intolerable toxicity on ≥1 prior standard systemic therapy. They were randomized 1:1:1 to intravenous HLX43 at 2.0, 2.5 or 3.0 mg/kg once every three weeks. The primary endpoint is investigator-assessed objective response rate (ORR) per RECIST v1.1. Secondary endpoints include ORR by BICR, progression-free survival (PFS), disease control rate (DCR), other efficacy measures and safety.
Baseline
-
As of data cutoff on August 31, 2026, 31 patients were randomized to the 2.0 mg/kg (n = 9), 2.5 mg/kg (n = 12), or 3.0 mg/kg group (n = 10). The median follow-up duration (95% confidence interval [CI]) was 5.2 months (4.9–not evaluable [NE]), 6.2 months (2.9–NE), and 7.1 (3.3–8.6) months in the respective groups.
-
All 31 patients had metastatic disease. The distant metastasis included liver, peritoneal and lung metastases. Most patients were male (74.2%). All patients (100%) previously received chemotherapy, and 24 patients (77.4%) previously received immunotherapy. The median line of prior systemic therapy was 2.0 (range 1–4). These characteristics reflect a heavily pretreated study population.
Efficacy
- Among the 31 efficacy-evaluable patients, confirmed objective response rate (cORR) per investigator assessment was 22.2% (95% CI 2.8–60.0) at 2.0 mg/kg, 8.3% (95% CI 0.2–38.5) at 2.5 mg/kg and 50.0% (95% CI 18.7–81.3) at 3.0 mg/kg. Disease control rate (DCR) was 66.7% (29.9–92.5), 50.0% (21.1–78.9) and 90.0% (55.5–99.8), respectively. In the 3.0 mg/kg group, 10 patients were efficacy-evaluable: 1 (10.0%) achieved complete response (CR), 4 (40.0%) achieved partial response (PR) and 4 (40.0%) had stable disease (SD).
- The median (95% CI) confirmed duration of response (cDOR) was 4.5 months (NE–NE), not reached (NE–NE), and 5.2 months (2.8 months–NE) in the 2.0 mg/kg, 2.5 mg/kg, 3.0 mg/kg groups. Median PFS (95% CI) was 5.6 months (1.3–NE), 1.6 months (1.2–2.7) and 5.6 months (1.5–NE), respectively. OS data were immature.
Safety
- In terms of safety, treatment-emergent adverse events (TEAEs) occurred in all 31 patients (100.0%). Grade ≥3 TEAEs occurred in 41.9% of patients. HLX43-related grade ≥3 TEAEs were observed in 9 patients (29.0%). HLX43-related TEAEs leading to treatment discontinuation occurred in 1 patient (3.2%; in the 3.0 mg/kg group). There was no death due to HLX43-related TEAE.
-
In total, 15 patients (48.4%) reported AESIs, most commonly neutrophil count decreased (14 patients, 45.2%).
-
l The most common TEAEs were hematological toxicities. Lymphocyte count decreased (6 patients, 19.4%) was the most common grade ≥3 TEAE in the overall population. Pulmonary-related adverse events were rare.
In conclusion, HLX43 showed promising efficacy and manageable safety inpatients with previously treated advanced G/GEJ cancer, especially in the 3.0 mg/kg dose group, warranting further evaluation.
Previous Chapter
ESMO 2026 Preview | Henlius’ Serplulimab U.S. Bridging Study Selected as Proffered Paper presentation, with Studies Exploring Efficacy and Quality of Life in Multiple Solid Tumors
Next Chapter
Henlius reports positive results from ASTRIDE U.S. bridging study for serplulimab in combination with chemotherapy for first-line treatment of patients with extensive-stage small cell lung cancer (ES-SCLC)
Back
Privacy Policy
Cookies Policy
Accessibility
Terms of Use
Privacy Policy
Introduction
Shanghai Henlius Biotech, Inc., and, where applicable, its affiliates and subsidiaries (collectively, “we” , “us” or “our”) attach great importance to the protection of your privacy and personal information. This Privacy Notice (this “Policy”) is formulated in accordance with applicable PRC laws and regulations governing the protection of personal information in the People’s Republic of China (“PRC”).
This Policy applies when: (1) you browse or use our website and other online resources (such as our WeChat official accounts); (2) subscribe to our news or announcements; or (3) contact us through the contact details or other interactive features made available on our website, or otherwise interact with us through our website.. The purpose of this Policy is to explain how and why we process your personal information, the types of personal information involved, applicable retention periods, your rights, and the measures we take to protect personal information. Please read this Policy carefully to ensure that you fully understand its content.
In certain business scenarios, we may provide additional explanations regarding the processing of your personal information through separate agreements, privacy statements, or personal information notices. In the event of any inconsistency, such documents shall prevail. For example, where a recruitment function is provided through a third-party platform or service, the relevant third party privacy policy or notice may also apply.
For the purposes of this Policy, “personal information” refers to all kinds of information related to identified or identifiable natural persons, excluding anonymized information.
We collect, use, store, transfer and otherwise process personal information in strict compliance with applicable PRC laws and regulations of the People’s Republic of China.
Our website may contain links to third party websites for your convenience. We do not control, and are not responsible for, the privacy practices of such third parties. We encourage you to review their privacy policies before using those websites.
If you have any questions or concerns regarding this Policy or our processing of personal information, please contact us using the details provided below.
This Policy will help you understand:
I. How we collect your personal information
II. How we use your personal information
III. How we entrust, share, transfer and publicly disclose your personal information
IV. Cross border transfer of personal information
V. How we store your personal information
VI. Security measures
VII. Your rights
VIII. Personal information of minors
IX. Updates to this Policy
X. How to contact us
I. How do we collect your personal information?
In addition to our employees, we may process personal information of the following persons:
• Visitors and users of our website;
• Healthcare Professionals;
• Investigators of clinical trial institutions and personnel of contract research organizations in clinical trials;
• Subjects of clinical trials and their relatives;
• Consumers/patients and their relatives using our products or services;
• Staff of business partners (including vendors, distributors, partners, etc.); and
• Our applicants.
We may process personal information of website visitors and individuals who contact or interact with us through our website or other online resources. Depending on the relevant page, function, or interaction, separate privacy notices, consents, platform privacy policies, contracts, or other notices may apply.
Based on the context in which you interact with us, we may collect personal information by the following means and on the legal bases permitted by applicable PRC laws and regulations, including your consent, the necessity for entering into or performing a contract, compliance with legal obligations, protection of life, health or property, public health needs, or other circumstances permitted by law:
• Your personal information provided to us voluntarily
When you subscribe to our news or announcements, contact us through the contact details or other interactive features made available on our website, a third-party platform or service linked or referred to on our website, or otherwise communicate with us in relation to our website, we may collect the personal information that you voluntarily provide, such as your name, contact details, organization, and the content of your inquiry or request, depending on the relevant page or function.
• Personal information collected by us independently through our website and other online channels
When you visit our website, most of our services do not require any registration, and you can visit our website without telling us who you are. However, some pages or functions may require you to provide certain personal information. If you choose not provide such information as we request, you may not be able to access certain content or functions or we may not be able to respond to your inquiry, request or subscription. Please refer to the relevant page or notice for further details about the categories of personal information collected in a specific scenario.
• Personal information we collect from vendors or business partners
In the course of our daily business operations, we may collect personal information from our vendors or business partners. We require our vendors and business partners to comply with the requirements of the personal information protection laws and regulations of the PRC and to lawfully provide us with personal information. If you are an employee or representative of one of our vendors or business partners, we may collect personal information such as your name and contact details for the purpose of establishing business contacts and cooperations.
• Personal information we collect from publicly available sources
We may collect personal information of medical and healthcare professionals from such publicy available sources, such as the official websites of medical institutions and the official websites of competent government departments, and process such information within a reasonable scope and for lawful purposes. For example, for the purpose of lawful academic or professional interaction with healthcare professionals, we may collect the name, gender, employer, position, practitioner registration information, academic title, degree, educational background, specialty expertise, and profile information, where such information has been lawfully made public.
Our website may include links, contact details, QR codes, or references to third-party platforms or services. Where you choose to interact with us through such third-party platforms or services, the relevant third party may also process your personal information in accordance with its own privacy policy and applicable law, and we encourage you to review such policy before submitting your information.
II. How do we use your personal information?
We may use your personal information for the following purposes:
• Operating, maintaining and improving our website and other online resource;
• Researching, developing, providing and continuously improving our products and services;
• Conducting and managing daily business;
• Academic interaction with healthcare professionals;
• Responding to your inquiries, requests, or communications sent through our website or the contact details made available on our website;
• Providing subscription services for our news, announcements, or investor-related updates;
• Managing and maintaining our relationship and communications with business contacts who reach us through our website;
• Recruiting and human resource management;
• Internal compliance management,audit,record-keeping; and
• Complying with applicable PRC laws and regulations, for example, monitoring and reporting adverse events for purposes of performing drug quality management responsibilities, providing medical information and dealing with product complaints, etc..
We will process personal information only to the extent necessary for the relevant purpose. Where required by applicable law, we will obtain your consent or separate consent before processing your personal information or sensitive personal information. Where a third-party platform or service is used in connection with a particular function, the relevant third party may process your personal information in accordance with its own privacy policy and applicable law.
III. How do we entrust, share, transfer and publicly disclose your personal information?
1. Entrustment
We may entrust our business partners with the processing of your personal information for the purpose(s) described in this Policy. We will enter into appropriate confidentiality, data processing and security agreements with such entrusted parties and require them to process personal information in accordance with our instructions , this Policy and applicable PRC laws and regulations.
2. Sharing and public disclosure
For the purpose(s) described in this Policy, we will share or publicly disclose your personal information only where permitted by applicable PRC laws and regulations and, where required, after obtaining your consent or separate consent. Such circumstances may include:
• Sharing your personal information among our affiliates and subsidiaries where necessary for legitimate business, management, compliance, or operational purposes;
• Sharing your personal information with vendors or business partners (such as conference service providers, travel service providers, data service providers, banking or insurance institutions, other professional service organizations, to the extent necessary for the relevant purpose); and
• Disclosing your personal information to the extent that it is permitted or required by applicable PRC laws and regulations or for the purpose of assisting with investigations by judicial, regulatory or law enforcement authorities.
• other circumstances permitted by applicable PRC laws and regulations.
If you submit your information through or in connection with a third-party platform or service referred to on our website, the relevant third party may independently process your personal information in accordance with its own privacy policy and applicable law.
3. Transfer
We will not transfer your personal information to any other company, entity or individual unless otherwise permitted by applicable law and, where required, after obtaining your consent. Further, in the event of a merger, acquisition, insolvency, reorganization, division, dissolution, bankruptcy, or similar transaction, we will require the new processor of your personal information to continue to be bound by this Policy or we will require the new processor to obtain your consent again.
IV.How do we provide your personal information across borders?
In principle, personal information that we collect and generate in the course of our operations within the territory of the PRC will be stored within the PRC. In certain circumstances, it may be necessary for us to provide your personal information to recipients outside the PRC in connection with our business operations, website functions, or communications, where permitted by applicable PRC laws and regulations. As required by applicable laws and regulations regarding the protection of personal information, we will provide you with the required notice and obtain your separate consent before providing your personal information across any border, unless otherwise permitted by law. We will use lawful cross-border transfer mechanisms to transfer your personal information oversea and will take necessary measures to ensure that the oversea recipients provide a level of protection required by applicable PRC laws and regulations.
You may obtain more information about cross-border transfers of personal information and oversea recipients through the contact methods referred to in this Policy.
V. How do we store your personal information?
We will retain your personal information for the minimum period necessary to achieve the purposes described in this Policy ,unless a longer retention period is required or permitted by applicable PRC laws and regulations. Upon expiration of the applicable retention period, we will promptly delete or anonymize your personal information in accordance with applicable PRC laws and regulations. Our criteria for determining the period for which personal information shall be retained include:
• Applicable laws, regulations and other relevant requirements;
• The period of time needed for us to provide services, maintain business relations or interact with you; and
• The period of time needed for us to perform relevant agreements or fulfil the purposes described in this Policy.
VI. What security measures do we take to protect your personal information?
In accordance with applicable PRC laws, regulations, and the requirements of relevant national standards, we take reasonable and appropriate security and precautionary measures to protect the personal information we process against unauthorized access, public disclosure, use, modification, destruction or loss of data. However, you are also responsible for taking appropriate measures to protect the security of the devices, systems, and networks you use when accessing our website or communicating with us.
VII. Your rights
In accordance with the requirements of the applicable PRC laws and regulations, you may have the following rights in respect of your personal information:
• To know about and make decisions regarding the processing of your personal information;
• To access or copy your personal information;
• To correct or supplement your personal information;
• To delete your personal information;
• To request for explanation of rules regarding processing of personal information; and
• To change the scope of your consent or revoke your consent , where processing is based on your consent.
If you wish to exercise your rights with respect to personal information, you may contact us through the contact information listed in this Policy and we will respond to any request in accordance with applicable relevant laws and regulations. When you exercise the above rights, we may verify your identity to safeguard the security of your personal information. Subject to applicable PRC laws and regulations, there may be circumstances where we are unable to respond to all or part of your request.
VIII. How do we process the personal information of minors?
For the purposes of this Policy and in accordance with applicable PRC laws and regulations, our products, websites and services are not targeted at minors under the age of 14. Minors under the age of 14 should not provide personal information to us without the consent of a parent or legal guardian.
If a minor's personal information is collected with the consent of a parent or legal guardian, we will process the information only when permitted by law, with the express consent of the parent or legal guardian, or necessary for the protection of the minor. If we discover that we have collected personal information without obtaining verifiable prior consent of a parent or legal guardian, we will seek to delete the data as soon as possible.
IX. Updates of the Policy
We may revise our Privacy Policy from time to time. We will post the updated version on our website and update the “Last Updated” date above or below this Policy.
Last updated: March 30, 2026.
X. How to contact us?
If you have any questions, comments or suggestions concerning this Policy, or any questions or concerns about our processing of your personal information, you may contact us in the following ways:
Address: 11/F, B8 Building, No.188 Yizhou Rd, Xuhui District, Shanghai
Tel.: 021- 33395800
Postal Code: 200233
Email: [email protected]
Cookies Policy
When you visit our website, we may place small data files known as “cookies” on your device. Cookies enable our website to recognize your browser and help us understand how visitors use the site.
Cookies and similar technologies used on this website may collect online identifiers, device information, browser information, IP address, and information about how you interact with the website. In certain circumstances, such information may constitute personal information or may be associated with you under applicable PRC laws and regulations. Information collected through cookies is used for purposes such as ensuring website operation, maintaining security, analyzing traffic and performance, remembering user preferences, and improving website content and user experience.
You may choose to accept or decline cookies by adjusting your browser settings or through any cookie banner or preference center made available on our website, if applicable. Please note that disabling cookies may affect the functionality of certain parts of the website.
2026-10-25
2026年10月23-27日,2026年欧洲肿瘤内科学会年会(ESMO 2026)在西班牙马德里举行。会上,复宏汉霖创新型PD-L1抗体偶联药物(ADC)HLX43治疗既往经治晚期胃癌的II期概念验证(PoC)研究HLX43-GC201首次发布。该研究由北京大学肿瘤医院消化肿瘤内科主任沈琳教授牵头。
继非小细胞肺癌、胸腺癌、妇科肿瘤及食管鳞癌后,HLX43在晚期胃癌这一重要消化道肿瘤中再次验证了其初步的抗肿瘤活性与安全耐受性。这标志着该分子在多个实体瘤中的早期概念验证得到持续印证,进一步确认了HLX43的成药潜力与治疗窗口,为其广谱抗肿瘤应用奠定了循证基础。
迄今为止,胃癌/胃食管交界部(G/GEJ)腺癌依旧构成了一大全球健康问题。据GLOBOCAN数据显示,2022年全球约有100万新发病例1。多数G/GEJ腺癌患者确诊时已处于疾病晚期,总体预后不良,5年生存率仅为6%2-3。尤其对既往接受过治疗的晚期G/GEJ腺癌患者,目前二线标准治疗以紫杉类化疗为基础,联合或不联合雷莫西尤单抗,但治疗结局仍不令人满意,中位总生存期(OS)仅为5.2—9.5个月4-5;对HER2阳性转移性G/GEJ腺癌患者,德曲妥珠单抗(trastuzumab deruxtecan)较雷莫西尤单抗联合紫杉醇显著延长了OS,提示ADC在此类患者中是一种有效的治疗策略6-7 。
HLX43是一款靶向程序性死亡-配体1(PD-L1)的新型ADC候选药物,由全人源IgG1抗PD-L1抗体与创新连接子-拓扑异构酶抑制剂荷载偶联而成,其药物抗体比(drug-to-antibody ratio, DAR)约为8。HLX43兼具毒素精准杀伤和肿瘤免疫作用的复合功能,其毒素不仅能够藉靶点内吞进入肿瘤细胞后进行释放,同时在肿瘤微环境中释放后借助旁观者效应进入肿瘤细胞,阻断DNA复制,从而导致肿瘤细胞凋亡。此外,HLX43的PD-L1靶向抗体可激活免疫调节机制,发挥协同抗肿瘤效应。
HLX43首次人体研究(FIH)结果以及多项实体瘤概念验证(POC)数据先后亮相ASCO、WCLC等多场国际学术大会,充分展现出“高效、低毒”的显著疗效和良好的安全性,尤其在NSCLC人群中不依赖生物标志物****筛选,有望覆盖所有亚型患者。除NSCLC外,HLX43在胸腺癌、妇科肿瘤、食管鳞癌等多项实体瘤中也展现了积极疗效信号。单药之外,公司积极探索其与H药 汉斯状®(斯鲁利单抗,欧洲商品名:Hetronifly®)、抗EGFR单抗pimurutamab(HLX07)等药物的联合治疗潜力,持续拓展其广谱抗肿瘤应用价值。
HLX43-GC201研究的壁报数据已于当地时间10月25日正式发布,此次数据读出是HLX43在消化道肿瘤领域第二次关键数据释放:
试验设计:
本次数据发布基于一项随机II期临床研究,纳入经组织学或细胞学确诊的局部晚期或转移性胃/胃食管结合部(G/GEJ)腺癌患者。入组患者既往接受过至少一线标准系统治疗,并出现治疗不耐受或疾病进展。患者按1:1:1随机接受HLX43 2.0mg/kg、2.5mg/kg或3.0mg/kg静脉给药,每3周一次。研究主要终点为研究者根据RECISTv1.1评估的客观缓解率(ORR),次要终点包括无进展生存期(PFS)、疾病控制率(DCR)等其他疗效指标及安全性等。
患者基线:
-
截至2026年8月31日,共31例患者被随机分配至2.0 mg/kg组(n=9)、2.5 mg/kg组(n=12)或3.0 mg/kg组(n=10)。各组的中位随访时间(95%置信区间[CI])分别为5.2个月(4.9—不可评估[NE])、6.2个月(2.9—NE)和7.1个月(3.3—8.6)。
-
所有31例患者均患有转移性疾病,远端转移部位包括肝、腹膜、肺等。患者大多数患者为男性(74.2%)。所有患者(100%)既往均接受过化疗,其中24例(77.4%)既往接受过免疫治疗。既往系统治疗中位线数为2线(范围:1–4线),体现出该研究人群较为充分的既往治疗背景。
疗效数据:
- 在31例疗效可评估的患者中,2.0mg/kg、2.5mg/kg及3.0mg/kg剂量组的经研究者评估确认ORR(cORR)分别为22.2%(95% CI 2.8%—60.0%)、8.3%(95% CI 0.2%—38.5%)和50.0%(95% CI 18.7%—81.3%);疾病控制率(DCR)分别达到66.7%(29.9%–92.5%)、50.0%(21.1%–78.9%)和90.0% (55.5%–99.8%),同时,3.0mg/kg剂量组10 例疗效可评估患者中,1例(10.0 %)达到完全缓解(CR),4例(40.0%)达到部分缓解(PR),4例(40.0 %)疾病稳定(SD)。
- 2.0 mg/kg、2.5 mg/kg和3.0 mg/kg组经确认的中位缓解持续时间(cDOR)分别为4.5个月(NE—NE)、未达到(NE—NE)和5.2个月(2.8 个月—NE)。各组的中位PFS(95% CI)分别为5.6个月(1.3—NE)、1.6个月(1.2—2.7)和5.6个月(1.5—NE)。OS数据尚未成熟。
安全性:
- 安全性方面,31例(100.0%)患者发生治疗期间不良事件(TEAE),其中≥3级TEAE发生率为41.9 %。9例患者(29.0%)观察到与HLX43相关的≥3级TEAE。1例患者发生与导致治疗终止的与HLX43相关的TEAE,未观察到HLX43相关TEAE导致的死亡事件。
-
共计15例患者(48.4%)报告了特别关注的不良事件(AESI),最常见者为中性粒细胞计数降低(14例,45.2%)。
-
最常见的TEAE为血液学毒性。在总体人群中,淋巴细胞计数降低(6例,19.4%)是最常见的≥3级TEAE。肺部相关不良事件发生率低。
整体来看,HLX43 在经治的晚期胃/胃食管交接部(G/GEJ)腺癌的治疗中展现出可控的安全性和令人鼓舞的初步疗效,尤其在3.0 mg/kg 剂量下疗效更为显著,值得进一步研究。
参考文献
1. Bray F, Laversanne M, Sung H, et al. CA Cancer J Clin. 2024: 1-35.
2. Ajani JA. et al. J Natl Compr Canc Netw 2022;20(2):167-92.
3. Alsina M. et al. Nat Rev Gastroenterol Hepatol 2023;20(3):155-70.
4. Lancet Oncol. 2014;15:1224.
5. Lancet Gastroenterol Hepatol. 2021;6:1015.
6. N Engl J Med 2020;382:2419.
7. N Engl J Med. 2025;393:336.
Copyright © 2019 All rights reserved 上海复宏汉霖生物技术股份有限公司
沪ICP备13029242号-1
沪公网安备 31010402002777号
互联网药品信息服务资格证书编号:(沪)-非经营性-2024-0127
领英
微信
2026-10-23
当地时间2026年10月19日,欧洲肿瘤内科学会(ESMO)年会官网公布了本届大会入选的研究摘要信息。复宏汉霖创新型抗PD-1单抗H药 汉斯状®(斯鲁利单抗,欧洲商品名:Hetronifly®)的10项研究入选本次大会,涵盖美国开展头对头对比标准一线治疗的桥接试验HLX10-005-SCLC301E(ASTRIDE研究),肺癌和食管鳞癌已获批适应症的生活质量研究,以及消化道肿瘤等更多实体瘤领域的多元应用探索,涉及一线治疗、新辅助治疗及放化疗后巩固治疗等多种临床场景,进一步展现了H药在实体瘤领域不同人群中的广泛应用潜力。
其中,H药ASTRIDE研究入选大会口头报告,探索一线治疗肺外神经内分泌癌的研究入选快速口头报告。ASTRIDE研究对比美国ES-SCLC一线标准治疗,是目前已完成入组的ES-SCLC临床试验中美国入组规模最大的一项,为斯鲁利单抗在美国本土人群中的关键临床评估提供了重要依据。本次大会发布的积极结果进一步印证了斯鲁利单抗的临床获益,并支持国际多中心III期临床ASTRUM-005试验结果在美国ES-SCLC患者群体中的适用性。
H 药是全球首个*获批一线治疗小细胞肺癌和胃癌围术期治疗的抗PD-1单抗。截至目前,H药已在中国、英国、欧盟、新加坡、印度、瑞士、秘鲁等50多个国家和地区获批上市,覆盖全球近半数人口,并在英国、奥地利、丹麦、德国、爱尔兰、意大利、西班牙、瑞典等10余个国家纳入医保或公共支付体系,进入当地主流医疗保障体系,全球可及性不断提升。
美国桥接研究领衔,肺癌一线获益再获印证
在肺癌领域,H药是全球首个*获批用于一线治疗广泛期小细胞肺癌(ES-SCLC)的抗PD-1单抗,目前已全面覆盖肺癌一线治疗,已获批用于一线治疗鳞状非小细胞肺癌(sqNSCLC)、ES-SCLC和非鳞状非小细胞肺癌(nsqNSCLC)三项肺癌适应症,同时正在全球范围内积极推动一项H药联合化疗同步放疗一线治疗局限期小细胞肺癌(LS-SCLC)的国际多中心III期临床试验。此外,H药也在美国和日本同步开展ES-SCLC的桥接试验,2025年10月和2026年5月分别完成美国和日本桥接试验全部受试者入组。
本次大会上,由加州大学戴维斯分校综合癌症中心David R. Gandara教授牵头开展的美国桥接ASTRIDE研究,将以口头报告形式于大会当地时间10月26日首次发布数据。ASTRIDE是一项在美国开展的随机、头对头、采用描述性统计分析的桥接研究,比较斯鲁利单抗或阿替利珠单抗联合化疗用于ES-SCLC患者的疗效与安全性。此前,基于全球多中心III期ASTRUM-005研究的积极结果,H药已在全球50多个国家获批一线治疗ES-SCLC。
摘要数据显示,截至2026年2月18日,中位随访时间为14.1个月,斯鲁利单抗组与阿替利珠单抗组的中位总生存期(OS)分别为12.4个月和10.2个月,两组24个月OS率分别为32.2%和17.6%,安全性总体可比。该研究结果印证了斯鲁利单抗的临床获益,同时支持ASTRUM-005研究结论可外推至美国患者人群。
#小细胞肺癌
斯鲁利单抗或阿替利珠单抗联合化疗治疗美国广泛期小细胞肺癌患者的随机试验(ASTRIDE)
试验设计:
经组织学或细胞学确诊为广泛期小细胞肺癌(ES-SCLC)且针对ES-SCLC既往化疗不超过1个周期的患者,按1:1随机分配接受最多4个周期的斯鲁利单抗(300 mg)联合卡铂或依托泊苷或阿替利珠单抗治疗联合卡铂和依托泊苷治疗,随后分别进入斯鲁利单抗或阿替利珠单抗维持治疗。既往接受过针对ES-SCLC的1个周期化疗的患者允许入组,以反映真实世界临床实践。所有研究治疗均为静脉给药,每3周为一个周期。主要终点为总生存期(OS)。作为桥接研究,其统计学设计仅为描述性。
结果**:**
2022年7月至2025年10月期间,在63家中心入组共201例美国患者,随机分配至斯鲁利单抗组(n=101)或阿替利珠单抗组(n=100)。截至2026年2月18日,中位随访时间为14.1个月(95%置信区间,11.4–18.5)。斯鲁利单抗组基线存在肝转移患者比例更高(49.5% vs 40.0%)。其他基线特征均衡。在意向治疗(ITT)人群中,斯鲁利单抗组中位OS为12.4个月,阿替利珠单抗组为10.2个月;24个月OS率分别为32.2%和17.6%。详细疗效结果见下文(表1)。在既往未接受1个周期化疗的患者中,斯鲁利单抗同样呈现更优的获益趋势(表 1)。两组不良事件的发生率和严重程度相当,未发现新的安全性信号。
结论**:**
在该项桥接研究中,斯鲁利单抗联合化疗对比对照组展现出良好的疗效,在美国ES-SCLC患者中,相较于阿替利珠单抗联合化疗,斯鲁利单抗联合化疗的总生存期数值更长、24个月总生存率更高。该结果印证了斯鲁利单抗的临床获益,同时支持 ASTRUM‑005研究结论可外推至美国人群。
同时,由中国医学科学院肿瘤医院石远凯教授牵头的ASTRUM-002研究(评估H药一线治疗nsqNSCLC的注册性Ⅲ期临床)生活质量分析结果,以及由上海市东方医院周彩存教授牵头的ASTRUM-004研究(评估H药一线治疗sqNSCLC的注册性Ⅲ期临床)生活质量分析结果,均入选大会壁报/电子壁报环节。此前,基于ASTRUM-002和ASTRUM-004两项注册性研究的积极结果,H药已在中国、欧盟等多个国家和地区获批用于sqNSCLC和nsqNSCLC的一线治疗。
本次大会上的ASTRUM-002研究生活质量摘要结果显示,与单纯化疗相比,斯鲁利单抗联合化疗可延长晚期nsqNSCLC患者总体健康状况/生活质量的中位至恶化时间。ASTRUM-004生活质量结果则显示,斯鲁利单抗与多种症状的改善相关,包括咳嗽、呼吸困难、咯血、手臂或肩部疼痛、胸痛及周围神经病变,并降低了呼吸困难和咯血的恶化风险。上述结果从患者生活质量角度,为斯鲁利单抗联合化疗用于nsqNSCLC和sqNSCLC的一线治疗提供了进一步支持。
#非小细胞肺癌
斯鲁利单抗联合化疗(联合或不联合HLX04)治疗非鳞状非小细胞肺癌的Ⅲ期ASTRUM-002研究中的健康相关生活质量分析
试验设计:
符合入排标符合入排标准的受试者以1∶1∶1比例随机分组,每3周接受下述方案治疗:A 组为斯鲁利单抗联合HLX04及化疗(培美曲塞 + 卡铂);B 组为斯鲁利单抗联合HLX04 安慰剂及化疗;C 组为双安慰剂联合化疗。采用欧洲癌症研究与治疗组织核心生活质量量表(EORTC QLQ-C30)、肺癌特异性量表(EORTC QLQ-LC13)及五维度五级健康效用量表(EQ-5D-5L)进行 生活质量评估。分析纳入所有接受随机分组的患者。采用约束性纵向数据分析模型,比较各组从基线至治疗结束的最小二乘均值(LSM)评分变化;采用分层Cox比例风险模型,评估总体健康状况/生活质量、躯体功能及角色功能的至恶化时间(TTD)的组间差异。
结果**:**
共636例患者被随机分配至A组(n=212)、B组(n=214)和C组(n=210)。截至2025年8月7日,中位随访时间为47.0个月。至第9个治疗周期,各组问卷完成率均超过50%,依从性均超过95%。从基线至治疗结束,B组与C组在QLQ-C30各维度、QLQ-LC13症状及EQ-5D-5L评分的纵向变化趋势总体相似。与C组相比,B组患者在躯体功能、角色功能、QLQ-LC13中的“胸痛”和“其他部位疼痛”症状,以及EQ-5D-5L视觉模拟评分(VAS)方面表现出更明显改善。B组总体健康状况/生活质量的中位TTD亦长于C组,分别为未达到和28.1个月(HR=0.65,95%置信区间:0.45~0.95;p=0.026)。A组与B组在生活质量各指标的纵向变化及至恶化时间情况相似。
结论**:**
斯鲁利单抗联合化疗可维持或改善患者的健康相关生活质量;在斯鲁利单抗联合化疗的基础上联合HLX04治疗,未对患者生活质量造成不良影响。结合疗效及安全性数据,上述结果支持斯鲁利单抗联合化疗作为非鳞状非小细胞肺癌的一线治疗方案。
斯鲁利单抗联合化疗一线治疗局部晚期或转移性鳞状非小细胞肺癌的Ⅲ期ASTRUM-004研究中的健康相关生活质量分析
试验设计:
符合入排标准的受试者按2:1比例随机分组,接受斯鲁利单抗(4.5 mg/kg)或安慰剂治疗,最长给药至2年;所有受试者同步接受4~6周期白蛋白结合型紫杉醇(100 mg/m²)联合卡铂(曲线下面积5或6)治疗。所有研究药物均以21天为一个周期静脉给药。生活质量分析在意向治疗人群中进行,即所有随机分组的患者。采用重复测量混合效应模型,比较QLQ-LC13从基线起的最小二乘均值评分变化;采用分层Cox比例风险模型,评估各组间至恶化时间的差异。至恶化时间定义为:自基线首次出现评分下降≥10分,且在下一次随访时再次确认评分较基线下降≥10分。
结果**:**
共537例患者被随机分配至斯鲁利单抗组(n=358)和安慰剂组(n=179)。截至2023年1月31日,中位随访时间为31.1个月。至第9个治疗周期,两组问卷完成率均超过50%,依从率为98.9%~100%。斯鲁利单抗与咳嗽、呼吸困难、咯血、手臂或肩部疼痛、胸痛及周围神经病变的持续改善相关,在其他症状方面, 两组纵向变化趋势相似。斯鲁利单抗组在咯血、吞咽困难和呼吸困难方面观察到显著改善。此外,斯鲁利单抗组呼吸困难(风险比0.51,95%置信区间0.36~0.72,p<0.001)和咯血(风险比0.37,95%置信区间0.15~0.96,p=0.033)的至恶化时间均显著延长。
结论**:**
作为sqNSCLC的一线治疗方案,斯鲁利单抗与多种症状的改善相关,包括咳嗽、胸痛、咯血、吞咽困难和呼吸困难,并降低了呼吸困难和咯血的恶化风险。
更多实体瘤领域:拓展免疫联合治疗的探索边界
在消化道肿瘤领域,H药已获批用于一线治疗晚期食管鳞癌(ESCC)以及胃癌围手术期治疗,是全球首个*获批胃癌围术期适应症的抗PD-1单抗。同时,H药联合贝伐珠单抗联合化疗用于一线治疗转移性结直肠癌(mCRC)患者的国际多中心III期临床研究(ASTRUM-015)已完成患者入组,有望填补一线免疫治疗MSS mCRC的临床空白。
在本次大会上,H药在消化道肿瘤领域的多项研究入选。其中,在食管鳞癌领域,由中国医学科学院肿瘤医院黄镜教授牵头的ASTRUM-007 Ⅲ期研究的生活质量分析显示,斯鲁利单抗联合化疗与单纯化疗的患者健康相关生活质量相当,为该方案用于PD-L1阳性ESCC的一线治疗提供了进一步支持。此外,本次大会上还将发布由研究者发起的临床研究(IIT)探索斯鲁利单抗用于食管癌不同治疗阶段的最新成果。由浙江省肿瘤医院季永领教授牵头的一项Ⅱ期研究,探索斯鲁利单抗联合化疗用于不可切除ESCC同步放化疗后的巩固治疗;另一项Ⅱ期研究则评估斯鲁利单抗联合抗血管生成药物和化疗用于ESCC二线及以上治疗的临床价值,为更多临床场景下的治疗策略提供了新的研究依据。
在结直肠癌领域,由华中科技大学同济医学院附属协和医院张涛教授牵头的一项针对RAS/BRAF野生型局部晚期直肠癌的研究,探索短程放疗序贯抗EGFR单抗HLX07联合斯鲁利单抗和化疗的新辅助治疗方案,前瞻性地开展了针对RAS/BRAF野生型LARC新辅助免疫联合放化疗的转化研究。另一项由浙江大学医学院附属第二医院丁克峰教授牵头的SCAR研究,聚焦局部进展期中低位直肠癌,创新性地探索了斯鲁利单抗靶免化去放疗的新辅助方案,为局晚期直肠癌的新辅助治疗开辟了新的研究方向。
#食管鳞癌
斯鲁利单抗或安慰剂联合化疗一线治疗PD-L1阳性食管鳞状细胞癌的Ⅲ期ASTRUM-007研究中的健康相关生活质量分析
试验设计:
符合入排标准的患者按2:1比例随机分组,接受斯鲁利单抗(3 mg/kg)或安慰剂治疗,最长给药至2年。所有患者同步接受顺铂(50 mg/m²)治疗,最多8个周期,以及5-氟尿嘧啶(2,400 mg/m²)治疗,最多12个周期。所有研究药物均为静脉给药,每2周1次。采用欧洲癌症研究与治疗组织核心生活质量量表(EORTC QLQ-C30)、食管癌特异性量表(EORTC QLQ-OES18)及五维度五级健康效用量表(EQ-5D-5L)进行健康相关生活质量评估。分析人群为所有随机入组患者。采用约束性纵向数据分析模型,比较三份问卷从基线(BL)至第45周的最小二乘均值评分变化;采用分层Cox比例风险模型,评估各组间总体健康状况/生活质量、躯体功能及角色功能至恶化时间的差异。
结果**:**
共551例患者随机分组至斯鲁利单抗组(368例)与安慰剂组(183例)。自基线至第45周,QLQ‑C30 总体健康状况、功能领域、症状领域,QLQ‑OES18 大部分症状子量表以及 EQ‑5D‑5L 视觉模拟评分的各访视点纵向评分变化趋势在两组间相近。两组至恶化时间的中位值相当:总体健康状况/生活质量均未达到(NR),风险比(HR)0.88,95%置信区间(CI)0.61–1.28,P=0.519;躯体功能均未达到,HR 0.93,95% CI 0.63–1.36,P=0.708;角色功能均未达到,HR 1.19,95% CI 0.80–1.78,P=0.393。
结论**:**
在化疗基础上联合斯鲁利单抗未对患者健康相关生活质量造成不良影响。结合疗效及安全性数据,上述结果支持该方案作为PD-L1阳性食管鳞状细胞癌的一线治疗选择。
同期放化疗后替吉奥联合斯鲁利单抗治疗局部晚期不可手术食管鳞状细胞癌的单臂II期临床研究
试验设计:
本研究为一项前瞻性、单中心、单臂II期临床试验。符合条件的患者年龄为18–75岁,ECOG体能状态评分为0–1分,经病理学证实为不可切除的局部晚期食管鳞癌(LA-ESCC),临床分期为cT1-4bN1-3M0-1a。患者接受同步放化疗(CCRT):放疗剂量为50.4Gy/28次,联合顺铂和替吉奥(S-1);随后接受本研究为一项前瞻性、单中心、单臂II期临床试验。符合条件的患者年龄为18–75岁,ECOG体能状态评分为0–1分,经病理学证实为不可切除的局部晚期食管鳞癌(LA-ESCC),临床分期为cT1-4bN1-3M0-1a。患者接受同步放化疗(CCRT):放疗剂量为50.4Gy/28次,联合顺铂和替吉奥(S-1);随后接受替吉奥联合斯鲁利单抗(300 mg,每3周一次)的巩固治疗,最长持续12个月,或直至疾病进展或出现不可耐受的毒性。主要研究终点为 1 年无进展生存(PFS)率;次要终点包括临床完全缓解(cCR)、总生存期(OS)和安全性。
结果**:**
共入组31例患者;其中11例仍在治疗中,尚未达到疗效评估时间点。在20例可评估疗效的患者中,14例(70.0%)达到临床完全缓解(cCR)。其中,4例(20.0%)在同步放化疗(CCRT)期间即达到CR,10例(50.0%)在CCRT后接受S-1联合斯鲁利单抗巩固治疗期间转为CR;6例(30.0%)从未达到CR。中位随访时间为17.3个月,总体1年无进展生存(PFS)率和总生存(OS)率分别为73.7%(95% CI,56.2–96.6)和94.4%(95% CI,84.4–100)。在CCRT期间或巩固治疗期间达到CR的患者中,12个月内未发生PFS事件,而从未达到CR的患者1年PFS率为16.7%(95% CI,2.8–99.7)。≥3级不良事件包括食管疼痛(55.0%)、中性粒细胞减少症(50.0%)、吞咽困难(25.0%)、白细胞减少症(15.0%)、胃出血(5.0%)、放射性肺炎(5.0%)和放射性皮炎(5.0%)。
结论**:**
替吉奥联合斯鲁利单抗在同步放化疗(CCRT)后的巩固治疗,在不可切除的局部晚期食管鳞癌中显示出令人鼓舞的早期疾病控制效果,其中50.0%的患者在巩固治疗期间转为完全缓解(CR)。这些探索性发现支持将CCRT后化学免疫巩固治疗作为一种加深应答的策略,并值得进一步评估。
斯鲁利单抗联合安罗替尼和S-1用于晚期食管鳞状细胞癌(ESCC)的二线及以上治疗临床研究
试验设计:
这项前瞻性、单臂II期研究纳入了经组织病理学确诊为ESCC、且既往接受过除斯鲁利单抗外的PD-1抑制剂治疗后出现疾病进展(PD)的患者。患者接受斯鲁利单抗(4.5 mg/kg)联合安罗替尼(10 mg,每日一次,第1-14天给药)和S-1(75 mg/m²/天,每日两次,第1-14天给药)治疗,每3周为一个周期,直至出现疾病进展或不可耐受的毒性。主要终点是无进展生存期(PFS)。次要终点包括客观缓解率(ORR)、疾病控制率(DCR)、总生存期(OS)和安全性。
结果**:**
研究共入组37例患者(中位年龄:63岁;范围:46-75岁),其中43.2%(16/37)存在远处转移。大多数患者(28/37,75.7%)接受该方案作为二线治疗,而24.3%(9/37)的患者接受的是三线及以上治疗。数据分析截止时,患者接受治疗的中位周期数为6个周期(范围:2-26),有2例患者尚未进行评估。在可评估疗效的队列中,ORR为22.9%(8/35,95% CI 10.4%–40.1%),DCR达到82.9%(29/35,95% CI 66.4%–93.4%)。在整个队列中,中位随访时间为13.17个月,中位PFS为6.77个月(95% CI 5.8–17.1)。中位OS尚未达到,估计的12个月OS率为74.98%。治疗期间70.3%的患者发生不良事件,其中10.8%为3-4级事件。最常见的3-4级不良事件是瘘(3/37,8.11%),该事件在临床上可控。未观察到新的安全性信号。
结论**:**
斯鲁利单抗联合安罗替尼和S-1方案在既往接受过PD-1抑制剂治疗的ESCC患者中显示出令人鼓舞的疗效和可控的安全性,尤其是12个月OS率非常可观。这种协同治疗方案为免疫耐药的ESCC提供了一种潜在的新型治疗选择。
#直肠癌
短程放疗序贯HLX07联合斯鲁利单抗和CAPOX新辅助治疗RAS/BRAF野生型局部晚期直肠癌的多中心、单臂、开放性临床研究
试验设计:
符合条件的RAS/BRAF野生型局晚期直肠癌患者(pts)接受短程放疗(25 Gy/5次),随后接受6个3周周期的HLX07(RP2D),斯鲁利单抗(300 mg iv D1)和CAPOX(奥沙利铂130 mg/m² iv D1和卡培他滨1000 mg/m² bid D1 - 14)。手术于新辅助治疗结束一周后进行。主要终点为完全缓解(CR),定义为病理完全缓解(pCR)和临床完全缓解(cCR)总和。
结果**:**
在纳入的24例患者中,10例(41.7%)环周切缘(CRM)阳性,14例(58.3%)存在壁外血管侵犯(EMVI)。中位随访12(7-16)个月,12名患者(50.0%,12/24)达到CR。17例患者接受手术,9例(52.9%,9/17)达到TRG0 (pCR),2例(11.8%,2/17)达到TRG1。7名患者未接受手术,3名(42.9%,3/7)患者达到cCR。不良事件可控,血液学毒性是最常见的。
结论**:**
这项生物标志物驱动的创新TNT方案打破了RAS/BRAF野生型LARC的疗效上限。通过SCRT、靶向免疫共同阻断和化疗的机制协同作用,该模式在基线特征不利的患者中获得了50.0%的优异CR率和可控的安全性,代表了一种有非常有潜力的、可以最大限度地降低肿瘤分期并促进器官保存的治疗策略。
斯鲁利单抗联合CAPOX+塞来昔布新辅助治疗pMMR型局部进展期中低位直肠癌(SCAR)
试验设计:
SCAR是一项单臂II期临床试验(NCT05731726)。符合条件的患者年龄为18-75岁,ECOG 0-1,病理证实中低位直肠腺癌(距肛缘≤10 cm), pMMR型,临床分期cT2-4N0-2M0 (cT2N0M0除外)。患者接受4-8个周期的斯鲁利单抗 (300 mg, IV, q3w) + CAPOX(奥沙利铂130 mg/m²,IV, d1, q3w;卡培他滨1000 mg/m²,PO, BID,d1 - 14, q3w)和塞来昔布(200 mg, PO, BID,d1 - 21)。主要终点为pCR(ypT0N0)。次要终点包括R0切除率、ORR、DFS和安全性。通过单细胞RNA测序(scRNA-seq)探索免疫相关因素。
结果**:**
截至2026年3月,纳入50例患者(中位年龄60岁,84.8%为男性)。43例患者完成新辅助治疗。PR或CR 38例(ORR为88.4%)。40例患者行根治性手术;R0切除率100%。11/40的切除患者(27.5%)获得pCR。通过肿瘤消退分级(TRG)评价,TRG0(11)、TRG1(4)、TRG2(20)、TRG3(5)。10/50(20%)患者发生≥3级治疗相关不良事件。未观察到意外的围手术期安全信号。ScRNA-seq分析显示,治疗后样本中CD8+ T细胞丰度增加,活化/细胞毒性特征增强,应答者(PR/CR)中CD8+ T细胞和髓细胞之间抗原呈递相关信号传导增加。
结论**:**
斯鲁利单抗、CAPOX和塞来昔布联合作为pMMR中低LARC的新辅助治疗显示了初步的有效性和安全性。免疫分析观察到应答者中治疗相关的CD8+ T细胞活化。
在本次大会上,斯鲁利单抗在肺外神经内分泌癌和非透明细胞肾癌领域的IIT研究也成功入选,进一步拓展其在更多实体瘤领域的临床探索。由华中科技大学同济医学院附属协和医院张涛发起的一项研究,探索斯鲁利单抗联合靶向药和化疗作为一线治疗肺外神经内分泌癌方案,将于大会当地时间10月23日以快速口头报告的形式发布研究结果。另一项由上海交通大学医学院附属仁济医院薛蔚发起的II期研究,探索斯鲁利单抗联合抗血管生成药物一线治疗转移性非透明细胞肾细胞癌,为尚未有标准疗法的实体瘤领域提供了新的临床证据。
#神经内分泌癌
斯鲁利单抗联合索凡替尼、EP方案一线治疗肺外神经内分泌癌的最新疗效与安全性分析
试验设计:
本研究纳入未接受过全身系统治疗的晚期/转移性肺外神经内分泌癌(EP-NEC)患者。所有患者接受索凡替尼(250 mg,每日1次,口服,每3周为1周期)联合 EP 化疗方案(依托泊苷 100 mg/m²、顺铂25 mg/m²,均于第 1–3 天静脉输注,每3周1周期)及斯鲁利单抗(300 mg,第1天静脉输注,每3 周1周期)治疗,最多完成6个诱导周期;诱导治疗结束后采用斯鲁利单抗联合索凡替尼维持治疗。本研究主要终点为无进展生存期(PFS),次要终点包含客观缓解率(ORR)、疾病控制率(DCR)、总生存期(OS)及安全性。
结果**:**
截至2026年4月29日,入组的43例患者基线后均可进行疗效评估。患者中位年龄59岁(范围32–77岁),男性占65.1%,65.1%的患者存在肝转移。患者中位 Ki‑67指数70%(范围30%–90%),79.1%患者Ki‑67≥55%。中位无进展生存期(PFS)为9.4个月(95% CI 6.5–13.9个月)。值得关注的是,1例患者经3.6个月联合治疗后肿瘤显著缩小,实现R0根治性切除。客观缓解率(ORR)为69.8%,疾病控制率(DCR)95.3%。达到完全缓解/部分缓解(CR/PR)患者的无进展生存期显著长于治疗无应答患者(11.5个月 vs 6.6个月,P=0.0041)。最常见的治疗期间出现的不良事件(TEAE)为贫血(62.8%)、高甘油三酯血症(32.6%)、恶心(32.6%)及中性粒细胞减少症(30.2%)。
结论**:**
斯鲁利单抗联合索凡替尼、EP方案用于肺外神经内分泌癌一线治疗展现出可观的疗效,且不良反应可控;该方案缓解率高,可显著延长患者无进展生存期,另有1例初始不可切除患者经治疗后实现根治性 R0 转化切除。
#肾癌
斯鲁利单抗联合呋喹替尼一线治疗转移性非透明细胞肾细胞癌:II 期 FRONTIER 研究更新结果
试验设计:
入组标准:18–80岁初治转移性或不可切除非透明细胞肾细胞癌(nccRCC)、ECOG 体能状态评分0–1分患者,接受呋喹替尼5 mg 口服、每日1次(给药2周,停药1周)联合斯鲁利单抗4.5 mg/kg 静脉输注,每3周一次。主要研究终点为研究者依据实体瘤疗效评价标准1.1版(RECIST v1.1)评估的无进展生存期(PFS);次要研究终点包括客观缓解率(ORR)、疾病控制率(DCR)及安全性。
结果**:**
本研究共入组39例患者。中位年龄54岁(范围19–78岁);43.6%患者 ECOG 体能状态评分为1分。组织学类型包括乳头状肾细胞癌(51.3%)、未分类肾细胞癌(17.9%)及其他亚型;5例患者伴有肉瘤样分化。常见转移部位为淋巴结(53.8%)、肺(33.3%)、腹膜(33.3%)及骨(30.8%)。中位随访时间16.0个月(95% CI 15.2–21.8),中位无进展生存期(PFS)为19.0个月(95% CI 13.9–未达到),12个月无进展生存率81.3%。39例可评估疗效患者中,3例达完全缓解,20例达部分缓解,15例疾病稳定;ORR为59.0%(95%CI 43.5–74.4),DCR为97.4%(95% CI 86.5–99.9)。各组织学亚型均可观察到临床抗肿瘤活性,其中延胡索酸水合酶缺陷型肾细胞癌疗效最优(客观缓解率80.0%,4/5)。4例患者发生≥3 级治疗相关不良事件,无治疗相关不良事件导致永久停药或死亡。
结论**:**
呋喹替尼联合斯鲁利单抗在异质性非透明细胞肾细胞癌患者中可实现持久疾病控制,获得具备临床价值的无进展生存期,不良反应可控。目前正在开展转化生物标志物研究,探索治疗获益相关预测因子。
*2026年6月,斯鲁利单抗获得NMPA批准成为全球首个获批胃癌围术期治疗的抗PD-1单抗,截至2026年10月是唯一。
2023年1月,斯鲁利单抗获得NMPA批准成为全球首个获批一线治疗ES-SCLC的抗PD-1单抗。
**截至2026年10月。
参考文献
1. Issafras H, et al. Structural basis of HLX10 PD-1 receptor recognition, a promising anti-PD-1 antibody clinical candidate for cancer immunotherapy. PLoS One. 2021;16(12):e0257972.
2. Shan Y, Zhang Y, Wei R, et al. Insights into the mechanisms of serplulimab: a distinctive anti-PD-1 monoclonal antibody, in combination with a TIGIT or LAG3 inhibitor in preclinical tumor immunotherapy studies. mAbs. 2024;16(1):2419838.
Copyright © 2019 All rights reserved 上海复宏汉霖生物技术股份有限公司
沪ICP备13029242号-1
沪公网安备 31010402002777号
互联网药品信息服务资格证书编号:(沪)-非经营性-2024-0127
搜索
Oct 19, 2026|2026
ESMO 2026 Preview | Henlius’ Serplulimab U.S. Bridging Study Selected as Proffered Paper presentation, with Studies Exploring Efficacy and Quality of Life in Multiple Solid Tumors
On October 19, 2026, local time, the European Society for Medical Oncology (ESMO) Annual Congress website released the abstracts selected for presentation at this year’s meeting. Ten studies of Henlius’ innovative anti-PD-1 monoclonal antibody(mAb) serplulimab (trade name in Europe: Hetronifly®), have been selected for ESMO 2026. The studies included the U.S. bridging trial HLX10-005-SCLC301E (ASTRIDE), quality-of-life (QoL) analyses in approved indications for lung cancer and esophageal squamous cell carcinoma (ESCC), and investigations across a broader range of solid tumors, including gastrointestinal cancers. They cover diverse clinical settings, from first-line and neoadjuvant treatment to consolidation therapy following chemoradiotherapy, further highlighting the potential of serplulimab across solid tumors.
Notably, the ASTRIDE study has been selected for an oral presentation, while a study exploring first-line treatment for extrapulmonary neuroendocrine carcinoma has been selected for a Rapid Oral presentation. Comparing serplulimab against the current U.S. standard of care for first-line extensive-stage small cell lung cancer (ES-SCLC), the ASTRIDE trial represents the largest U.S. enrollment to date among completed clinical trials for ES-SCLC. It provides further evidence for evaluating serplulimab in U.S. patients. The positive results presented at ESMO further corroborate the clinical benefits of serplulimab and support the applicability of the international multi-center Phase 3 ASTRUM-005 trial results to ES-SCLC patients in the U.S.
Serplulimab is the world’s first* anti-PD-1 monoclonal antibody approved for first-line treatment of small cell lung cancer (SCLC) and perioperative treatment of gastric cancer. It has been approved in more than 50 countries and regions, including China, the United Kingdom, the European Union, Singapore, India, Switzerland, and Peru, covering nearly half of the world’s population. It has also been included in reimbursement or public healthcare coverage systems in more than 10 countries, including the United Kingdom, Austria, Denmark, Germany, Ireland, Italy, Spain, and Sweden, demonstrating broad potential for global clinical use.
U.S. ASTRIDE Trial Selected for Proffered Paper Session, Reinforcing 1L LC Advantage
In lung cancer, serplulimab is the world’s first* anti-PD-1 mAb approved for first-line treatment of extensive-stage small cell lung cancer (ES-SCLC). Its approved lung cancer indications now span three major settings: first-line treatment of squamous non-small cell lung cancer (sqNSCLC), ES-SCLC, and non-squamous non-small cell lung cancer (nsqNSCLC). Henlius is also advancing a global, multicenter Phase 3 trial evaluating serplulimab in combination with chemotherapy and concurrent radiotherapy as first-line treatment for limited-stage small cell lung cancer (LS-SCLC). In parallel, bridging studies of serplulimab in ES-SCLC are underway in both the United States and Japan, with enrollment completed in October 2025 in the U.S. study and in May 2026 with the Japan study.
At ESMO 2026, the U.S. bridging study ASTRIDE, led by Professor David R. Gandara of the UC Davis Comprehensive Cancer Center, will be presented for the first time in a Proffered Paper session on October 26, local time. ASTRIDE is a randomized, head-to-head bridging study evaluating the efficacy and safety of serplulimab versus atezolizumab, each in combination with carboplatin and etoposide, in U.S. patients with ES-SCLC. As a bridging study, the statistical design was descriptive. Based on the positive results of the global, multicenter Phase 3 ASTRUM-005 trial, serplulimab has been approved for first-line treatment of ES-SCLC in more than 50 countries and regions worldwide.
According to the abstract, as of February 18, 2026, the median follow-up was 14.1 months. Median overall survival (OS) was 12.4 months in the serplulimab group versus 10.2 months in the atezolizumab group while the 24-month OS rates were 32.2% and 17.6%, respectively. The overall safety profiles were comparable between the two groups. These findings support the clinical benefit of serplulimab and the applicability of the findings from ASTRUM-005 trial to the U.S. patient population.
SCLC
Randomized trial of serplulimab or atezolizumab plus chemotherapy in USA patients with extensive-stage small cell lung cancer (ASTRIDE)
Study Design:
Patients (Pts) with histologically or cytologically confirmed extensive-stage small cell lung cancer (ES-SCLC) and ≤1 prior cycle of chemotherapy (chemo) for ESSCLC were randomized 1:1 to receive up to 4 cycles of serplulimab (serplu; 300 mg) or atezolizumab (atezo), each in combination with carboplatin and etoposide, followed by maintenance serplu or atezo, respectively. Allowing 1 prior cycle of chemotherapy (chemo) reflected real-world practice. Treatments were administered intravenously every 3 weeks. The primary endpoint was overall survival (OS). As a bridging study, the statistical design was descriptive only.
Results**:**
From July 2022 to October 2025, 201 USA pts were enrolled at 63 centers and randomized to the serplu (n=101) or atezo (n=100) group. As of February 18, 2026, median follow-up was 14.1 months (mo, 95% confidence interval [CI], 11.4–18.5). The proportion of pts with liver metastasis was higher in the serplu group (49.5% vs 40.0%). Other baseline characteristics were balanced. In the ITT, median OS was 12.4 mo with serplu and 10.2 mo with atezo; 24-mo OS rates were 32.2% and 17.6%, respectively. Detailed efficacy results are shown below. Outcomes also appeared more favorable with serplu in pts without prior 1-cycle chemo. The incidence and severity of adverse events were comparable between groups, with no new safety signals identified.
Conclusion**:**
Serplu plus chemo compared favorably with the comparator in this bridging trial, showing numerically longer OS and higher 24-mo OS rates vs atezo plus chemo in USA pts with ES-SCLC. These results support the benefit of serplu and the applicability of ASTRUM-005 findings to the USA population.
In addition, quality-of-life analyses from two pivotal Phase 3 trials evaluating serplulimab in lung cancer have been respectively selected for the Poster and ePoster session at ESMO 2026. The ASTRUM-002 study, led by Professor Yuankai Shi from Cancer Hospital, Chinese Academy of Medical Sciences, evaluated serplulimab as first-line treatment for nsqNSCLC. The ASTRUM-004 study, led by Professor Caicun Zhou from Shanghai East Hospital, evaluated serplulimab as first-line treatment for sqNSCLC. Based on the positive results of these two pivotal trials, serplulimab has been approved for first-line treatment of sqNSCLC and nsqNSCLC in China, the European Union, and other countries and regions.
The quality-of-life analysis from ASTRUM-002 showed that, compared with chemotherapy, serplulimab plus chemotherapy prolonged the median time to deterioration in global health status/quality of life among patients with advanced nsqNSCLC. The ASTRUM-004 quality-of-life analysis showed that serplulimab was associated with consistent improvement in coughing, dyspnea, hemoptysis, pain in arm or shoulder, pain in chest, and peripheral neuropathy, and reduced the risk of deterioration in dyspnea and hemoptysis. Together, these findings provide further patient-centered evidence supporting serplulimab plus chemotherapy as first-line treatment for nsqNSCLC and sqNSCLC, respectively.
SCLC
Health-related quality of life in the phase 3 trial ASTRUM-002 of serplulimab plus chemotherapy with or without HLX04 for nonsquamous non-small cell lung cancer
Study Design:
Eligible patients (pts) were randomised 1:1:1 to receive intravenous serplulimab plus HLX04 and chemo (pemetrexed and carboplatin, group A), serplulimab plus HLX04 placebo and chemo (group B), or double placebo and chemo (group C), once every 3 weeks. Quality of life (QoL) was assessed using the EORTC QLQ-C30, EORTC QLQ-LC13, and EQ-5D-5L questionnaires. Analyses included all pts randomised into the study. A constrained longitudinal analysis model compared least squares mean (LSM) score changes from baseline (BL) to end-of-treatment (EoT) and a stratified Cox proportional hazards model assessed between-group differences in time to deterioration (TTD) of global health status (GHS)/QoL, physical functioning (PF) and role functioning (RF).
Results**:**
A total of 636 pts were randomised to groups A (n = 212), B (n = 214) and C (n = 210). Median follow-up duration was 47.0 months as of August 07, 2025. Completion rates exceeded 50% through cycle 9 with >95% compliance for all 3 groups. Longitudinal profiles of QLQ-C30 domains, QLQ-LC13 symptoms and EQ-5D-5L from BL up to EoT were similar between groups B and C. A more pronounced amelioration in PF, RF, QLQ-LC13“chest pain”and“pain in other parts”symptoms and EQ-5D-5L visual analogue scale were reported for pts in group B compared to group C. Median TTD was also longer in group B than C: not reached (NR) vs 28.1 months (HR 0.65, 95% CI 0.45-0.95; p = 0.026) for GHS/QoL. Longitudinal profiles and TTD were similar between groups A and B.
Conclusion**:**
QoL were maintained or improved with the addition of serplulimab to chemo. Adding HLX04 to serplulimab and chemo did not adversely affect QoL. Together with the efficacy and safety data, these findings support serplulimab and chemo as a first-line treatment option for nsq-NSCLC.
Health-related quality of life in the phase 3 trial ASTRUM-004 of first-line serplulimab plus chemotherapy for locally advanced or metastatic squamous non-small cell lung cancer
Study Design:
Eligible patients (pts) were randomized in a 2:1 ratio to receive serplulimab (4.5 mg/kg) or placebo for up to 2 years. All pts also received 4–6 cycles of nab-paclitaxel (100 mg/m2 ) plus carboplatin (area under curve 5 or 6). All study drugs were administered intravenously in 21-day cycles. QoL analysis was conducted in the intent-to-treat population, defined as all randomized pts. A mixed-effect model with repeated measures model was used to compare least squares mean (LSM) score changes from baseline (BL) in QLQ-LC13. A stratified Cox proportional hazards model was used to assess the between-group differences in time to deterioration (TTD), defined as time to first onset of a ≥10-point deterioration from BL confirmed by ≥10-point deterioration from BL at the next visit.
Results**:**
In total, 537 pts were randomized to the serplulimab (n = 358) and placebo groups (n = 179). The median follow-up duration was 31.1 months as of January 31, 2023. The completion rates were above 50% in both groups up to cycle 9, with compliance rates of 98.9%–100%. Serplulimab was associated with consistent improvement in coughing, dyspnea, hemoptysis, pain in arm or shoulder, pain in chest, and peripheral neuropathy, while the two groups showed similar longitudinal profiles in other symptoms. Significant improvements in hemoptysis, dysphagia, and dyspnea were observed in the serplulimab group. Moreover, the serplulimab group had significantly prolonged TTD for dyspnea (HR 0.51, 95% CI 0.36–0.72, p < 0.001) and hemoptysis (HR 0.37, 95% CI 0.15–0.96, p = 0.033).
Conclusion**:**
As first-line treatment in pts with sqNSCLC, serplulimab was associated with improvement in several symptoms, including coughing, pain in chest, hemoptysis, dysphagia, dyspnea, and a reduced risk of deterioration in dyspnea and hemoptysis.
Exploring New Frontiers in Immunotherapy Combinations Across Solid Tumors
In gastrointestinal cancers, serplulimab has been approved for first-line treatment of advanced esophageal squamous cell carcinoma (ESCC) and perioperative treatment of gastric cancer, making it the world’s first* anti-PD-1 mAb approved for a perioperative gastric cancer indication. Meanwhile, the global, multicenter Phase 3 ASTRUM-015 trial evaluating serplulimab in combination with bevacizumab and chemotherapy as first-line treatment for metastatic colorectal cancer (mCRC) has completed patient enrollment. The study has the potential to address an unmet clinical need for first-line immunotherapy in patients with microsatellite-stable (MSS) mCRC.
Several studies of serplulimab in gastrointestinal cancers have also been selected for presentation at ESMO 2026. In ESCC, a quality-of-life analysis from the Phase 3 ASTRUM-007 trial, led by Professor Jing Huang of the Cancer Hospital, Chinese Academy of Medical Sciences, showed comparable health-related quality of life between patients receiving serplulimab plus chemotherapy and those receiving chemotherapy. These findings provide further support for the use of serplulimab plus chemotherapy in the first-line treatment of PD-L1-positive ESCC.
Several investigator-initiated trials (IITs) exploring serplulimab across different treatment settings for ESCC have also been selected for presentation at ESMO 2026. One Phase 2 study, led by Professor Yongling Ji of Zhejiang Cancer Hospital, evaluated serplulimab in combination with chemotherapy as consolidation therapy following concurrent chemoradiotherapy in patients with unresectable ESCC. Another Phase 2 study evaluated serplulimab in combination with an anti-angiogenic agent and chemotherapy in patients with ESCC receiving second-line or later treatment. Together, these studies expand the clinical evidence for serplulimab-based combination regimens across different treatment settings for ESCC.
In colorectal cancer, one study led by Professor Tao Zhang of Union Hospital, Tongji Medical College, Huazhong University of Science and Technology, investigated a neoadjuvant regimen for patients with RAS/BRAF wild-type locally advanced rectal cancer (LARC). The regimen combines short-course radiotherapy followed by the anti-EGFR mAb HLX07, serplulimab, and chemotherapy. This prospective translational study explores a neoadjuvant immunotherapy-based regimen incorporating radiotherapy and chemotherapy in patients with RAS/BRAF wild-type LARC. Another study, the SCAR trial, led by Professor Kefeng Ding of the Second Affiliated Hospital of Zhejiang University School of Medicine, investigated a novel neoadjuvant regimen for patients with locally advanced mid-to-low rectal cancer. The regimen combines serplulimab with targeted therapy and chemotherapy, with radiotherapy omitted from the treatment protocol. This study explores a radiotherapy-free, immunotherapy-based neoadjuvant strategy for locally advanced rectal cancer.
ESCC
Health-related quality of life in the phase 3 ASTRUM-007 study of serplulimab or placebo plus chemotherapy for PD-L1-positive esophageal squamous cell carcinoma
Study Design:
Eligible patients were randomised 2:1 to receive serplulimab (3 mg/kg) or placebo for up to 2 years. All patients also received cisplatin (50 mg/m2) for up to 8 cycles and 5-FU (2,400 mg/m2) for up to 12 cycles. All study drugs were administered intravenously every 2 weeks. HRQoL was assessed using the EORTC QLQ-C30, EORTC QLQ-OES18, and EQ-5D-5L questionnaires. The analysis population included all patients randomised into the study. A constrained longitudinal analysis model was used to compare least squares mean (LSM) score changes from baseline (BL) to Week 45 in the three questionnaires. A stratified Cox proportional hazards model was used to assess the between-group differences in time to deterioration (TTD) in global health status (GHS)/QoL, physical functioning (PF) and role functioning (RF)
Results**:**
Overall, 551 patients were randomised to the serplulimab (n = 368) and placebo (n = 183) groups. By-visit longitudinal changes in scores of QLQ-C30 global health status, functioning domains and symptom domains, most of the symptom subscales of QLQ-OES18, and EQ-5D-5L visual analogue scale from baseline to Week 45 were similar between the two groups. Median TTD was comparable between groups: not reached (NR) vs NR months for GHS/QoL (hazard ratio [HR] 0.88, 95% confidence interval [CI] 0.61-1.28; p-value = 0.519), NR vs NR for PF (HR 0.93, 95% CI 0.63-1.36; p-value = 0.708), and NR vs NR for RF (HR 1.19, 95% CI 0.80-1.78; p-value = 0.393).
Conclusion**:**
HRQoL was not adversely impacted when serplulimab was added to chemotherapy. Together with the efficacy and safety data, these findings support this regimen as a first-line treatment option for PD-L1-positive ESCC.
S-1 plus serplulimab consolidation after concurrent chemoradiotherapy in unresectable locally advanced esophageal squamous cell carcinoma: a phase II trial
Study Design:
This was a prospective, single center, single arm phase II trial. Eligible patients were aged 18-75 years, had an ECOG performance status of 0–1, and had pathologically confirmed unresectable LA-ESCC staged as cT1-4bN1-3M0-1a. Patients received CCRT with radiotherapy 50.4 Gy in 28 fractions plus cisplatin and S-1, followed by consolidation with S-1 plus serplulimab 300 mg every 3 weeks for up to 12 months or until progression or unacceptable toxicity. The primary endpoint was the 1 year progression free survival (PFS) rate. Secondary endpoints included clinical complete response (cCR), overall survival (OS), and safety
Results**:**
A total of 31 patients were enrolled; 11 remain on treatment and have not yet reached the efficacy evaluation timepoint. Among the 20 efficacy-evaluable patients, 14 patients (70.0%) achieved cCR. Of these, 4 patients (20.0%) achieved CR during CCRT, while 10 patients (50.0%) converted to CR during S-1 plus serplulimab consolidation after CCRT; 6 patients (30.0%) never achieved CR. With a median follow-up of 17.3 months, the overall 1-year PFS and OS rates were 73.7% (95% CI, 56.2–96.6) and 94.4% (95% CI, 84.4–100), respectively. No PFS events occurred within 12 months among patients achieving CR either during CCRT or during consolidation, compared with a 1-year PFS rate of 16.7% (95% CI, 2.8–99.7) in patients who never achieved CR. Grade ≥3
adverse events included esophageal pain (55.0%), neutropenia (50.0%), dysphagia (25.0%), leukopenia (15.0%), and gastric hemorrhage (5.0%), radiation pneumonitis(5.0%) and radiation dermatitis (5.0%).
Conclusion**:**
S-1 plus serplulimab consolidation after CCRT showed encouraging early disease control in unresectable LA-ESCC, with 50.0% of patients converting to CR during consolidation. These exploratory findings support further evaluation of post-CCRT chemoimmunotherapy consolidation as a response-deepening strategy.
Serplulimab Plus Anlotinib and S-1 in Second-Line or Later-Line Advanced Esophageal Squamous Cell Carcinoma (ESCC): A Phase II Study
Study Design:
This prospective single-arm phase II study enrolled patients with pathologically confirmed ESCC who had disease progression (PD) following PD-1 inhibitor therapy excluding serplulimab. Patients received serplulimab (4.5 mg/kg) plus anlotinib (10 mg, QD, D1–14) and S-1 (75 mg/m²/d, BID, D1–14) in 3-week cycles until PD or unacceptable toxicity. The primary endpoint was progression-free survival (PFS). The secondary endpoints included objective response rate (ORR), disease control rate (DCR), overall survival (OS), and safety.
Results**:**
Thirty-seven patients (median age: 63; range: 46–75) were enrolled, with 43.2% (16/37) presenting distant metastases. Most patients (28/37, 75.7%) received the regimen in the second-line setting, whereas 24.3% (9/37) were treated in the third-line or beyond. At analysis cutoff, patients received a median of 6 cycles (range: 2–26), and 2 had not yet undergone assessment. In the efficacy-evaluable cohort, the ORR was 22.9% (8/35, 95% CI 10.4%–40.1%), consisting entirely of partial responses, and the DCR reached 82.9% (29/35, 95% CI 66.4%–93.4%). With a median follow-up of 13.17 months in the overall cohort, the median PFS was 6.77 months (95% CI 5.8–17.1). While the median OS was not reached, the estimated 12-month OS rate was 74.98%. Treatment-emergent adverse events occurred in 70.3% of patients, with grade 3–4 events in 10.8%. The most common grade 3–4 adverse event was fistula (8.11%), which was clinically manageable. No new safety signals were observed
Conclusion**:**
Serplulimab plus anlotinib and S-1 showed promising efficacy and manageable safety in PD-1-inhibitor pretreated ESCC, with a particularly encouraging 12-month OS rate. This synergistic regimen offers a potential novel option for immune-resistant ESCC
Rectal Cancer
Neoadjuvant short-course radiotherapy followed by HLX07, serplulimab, and CAPOX in RAS/BRAF wild-type locally advanced rectal cancer (LARC): A multicenter, single-arm, phase II trial
Study Design:
Eligible patients(pts) with RAS/BRAF wild-type LARC received SCRT (25 Gy/5 fractions) followed by six 3-week cycles of HLX07 (at the RP2D), serplulimab (300 mg iv on D1), and CAPOX (oxaliplatin 130 mg/m² iv on D1 and capecitabine 1000 mg/m² bid on D1–14). Surgery was performed one week after neoadjuvant therapy. The primary endpoint was complete response (CR), defined as the composite of pathological complete response (pCR) and clinical complete response (cCR).
Results**:**
Among the 24 included pts, circumferential resection margin (CRM) was involved in 10 (41.7%) and extramural venous invasion (EMVI) was present in 14 (58.3%). With a median follow-up of 12(7-16) months,12 pts (50.0%, 12/24) achieved CR. Seventeen pts underwent surgery, with 9 (52.9%, 9/17) achieving TRG0 (pCR) and 2 (11.8%, 2/17) achieving TRG1. Seven pts did not undergo surgery, with 3 (42.9%, 3/7) achieving cCR. Adverse events were generally manageable, with hematologic toxicity being the most common.
Conclusion**:**
This biomarker-driven innovative TNT regimen has broken the efficacy ceiling in RAS/BRAF wild-type LARC. Through the mechanistic synergy of SCRT, dual targeted-immune blockade, and chemotherapy, this approach achieved an exceptional 50.0% CR rate with manageable safety in patients with unfavorable baseline characteristics, representing a promising strategy to maximize tumor downstaging and promote organ preservation.
Serplulimab Combined with CAPOX and Celecoxib as Neoadjuvant Therapy for Proficient Mismatch Repair Locally Advanced Mid-to-Low Rectal Cancer (SCAR)
Study Design:
SCAR is a single-arm, phase II trial (NCT05731726). Eligible patients were aged 18–75 years, ECOG 0–1, with pathologically confirmed mid-to-low rectal adenocarcinoma (≤10 cm from anal verge), pMMR status, and clinical stage cT2-4N0-2M0 (except cT2N0M0). Patients received 4–8 cycles of Serplulimab (300 mg, IV, q3w) plus CAPOX (oxaliplatin 130 mg/m², IV, d1, q3w;capecitabine 1000 mg/m², PO, BID, d1–14, q3w) and Celecoxib (200 mg, PO, BID,d1–21). Primary endpoint was pCR(ypT0N0). Secondary endpoints included R0 resection rate, ORR, DFS, and safety. Immune correlates were explored by single-cell RNA sequencing (scRNA-seq).
Results**:**
As of March 2026, 50 patients were enrolled (median age 60 years; 84.8% male). 43 patients had finished the neoadjuvant treatment. 38 patients achieved PR or CR (ORR 88.4%). 40 patients underwent radical surgery; R0 resection rate was 100%. pCR was achieved in 11/40 resected patients (27.5%). By tumor regression grade (TRG) evaluation, TRG0 (11), TRG1 (4), TRG2 (20), TRG3 (5). Grade ≥3 treatment-related adverse events occurred in 10/50 patients (20%). No unexpected perioperative safety signals were observed. ScRNA-seq analysis revealed increased CD8+ T-cell abundance with enhanced activation/cytotoxicity signatures in post-treatment samples, alongside increased antigen presentation–related signaling between CD8+ T cells and myeloid cells in responders (PR/CR).
Conclusion**:**
The combination of serplulimab, CAPOX, and celecoxib as neoadjuvant therapy for pMMR mid to-low LARC demonstrated primary efficacy and safety. Immune profiling suggests treatment associated CD8+ T-cell activation in responders.
Several IITs of serplulimab in extrapulmonary neuroendocrine carcinoma and non-clear cell renal cell carcinoma have also been selected for presentation at ESMO 2026, further expanding its clinical investigation across a broader range of solid tumors. One study initiated by Professor Tao Zhang of Union Hospital, Tongji Medical College, Huazhong University of Science and Technology, evaluated serplulimab in combination with targeted therapy and chemotherapy as first-line treatment for extrapulmonary neuroendocrine carcinoma. The findings will be presented in a Rapid Oral Presentation session on October 23, local time. Another Phase 2 study, led by Professor Wei Xue of Renji Hospital, Shanghai Jiao Tong University School of Medicine, investigated serplulimab in combination with an anti-angiogenic agent as first-line treatment for metastatic non-clear cell renal cell carcinoma. The study aims to generate further clinical evidence in this rare and heterogeneous disease setting, where treatment options remain limited.
NEC
Latest efficacy and safety analysis of surufatinib combined with EP regimen and serplulimab as first-line treatment for extrapulmonary neuroendocrine carcinoma
Study Design:
This phase Ib/II study enrolled systemic treatment-naïve patients with advanced/metastatic extrapulmonary NEC. Patients received SUR (250 mg, QD, PO, Q3W) plus EP regimen (etoposide 100 mg/m², cisplatin 25mg/m², both d1-3 IV, Q3W) and SER (300mg, d1, IV, Q3W) for up to 6 cycles, followed by SUR + SER maintenance. Primary endpoint was PFS, with secondary endpoints of ORR, DCR, OS and safety.
Results**:**
As of 29 Apr 2026, 43 enrolled patients were efficacy-evaluable post-baseline. Median age was 59 years (range32–77), 65.1% were male, 65.1% had liver metastases. Median Ki‑67 index was 70% (range 30–90%), 79.1% hadki‑67 ≥55%. Median PFS was 9.4 months (95% CI 6.5–13.9). Notably, 1 patient achieved significant tumorresponse after 3.6 months of combination therapy, enabling successful R0 resection. ORR was 69.8%, DCR95.3%. Patients achieving CR/PR had significantly longer PFS than non-responders (11.5 vs 6.6 months,p=0.0041). Commonest treatment-emergent adverse events (TEAEs) were anemia (62.8%), hypertriglyceridemia(32.6%), nausea (32.6%) and neutropenia (30.2%).
Conclusion**:**
Surufatinib plus serplulimab and EP regimen demonstrates encouraging efficacy and manageable safety as first-line therapy for extrapulmonary NEC, delivering a high response rate, meaningful PFS benefit and curativeR0 conversion in one patient with initially unresectable disease.
RCC
First-Line Fruquintinib Plus Serplulimab for Metastatic Non-Clear Cell Renal Cell Carcinoma: Updated Results from the Phase II FRONTIER Study
Study Design:
Treatment-naive patients aged 18-80 years with metastatic or unresectable nccRCC and ECOG PS 0-1 received fruquintinib 5 mg orally once daily (2 weeks on/1 week off) plus serplulimab 4.5 mg/kg IV every 3 weeks. Primary endpoint was investigator-assessed progression-free survival (PFS) per RECIST v1.1. Secondary endpoints included objective response rate (ORR), disease control rate (DCR), and safety.
Results**:**
Thirty-nine patients were enrolled. Median age was 54 years (range 19-78); 43.6% had ECOG PS 1. Histologies included papillary (51.3%), unclassified (17.9%), and other subtypes; 5 patients had sarcomatoid features. Common metastatic sites were lymph nodes (53.8%), lung (33.3%), peritoneum (33.3%), and bone (30.8%). At a median follow-up of 16.0 months (95% CI 15.2-21.8), median PFS was 19.0 months (95% CI 13.9-NR), with a 12-month PFS rate of 81.3%. Among 39 evaluable patients, 3 achieved complete response, 20 partial response, and 15 stable disease, yielding an ORR of 59.0% (95% CI 43.5-74.4) and DCR of 97.4% (95% CI 86.5-99.9). Clinical activity was observed across histologic subtypes, with highest activity in FH-deficient RCC (ORR 80.0%, 4/5). Grade >=3 treatment-related adverse events occurred in 4 patients. No treatment-related adverse events led to permanent discontinuation or death.
Conclusion**:**
Fruquintinib plus serplulimab demonstrated durable disease control, clinically meaningful PFS, and manageable toxicity in a heterogeneous nccRCC population. Translational biomarker analyses are ongoing to identify predictors of benefit.
* In June 2026, serplulimab received NMPA approval as the world's first anti-PD-1 mAb for perioperative gastric cancer treatment. As of October 2026, it remains the only one. In January 2023, serplulimab received NMPA approval as the world's first anti-PD-1 mAb for the first line treatment of ES-SCLC.
**As of October 2026
Reference
1. Issafras H, et al. Structural basis of HLX10 PD-1 receptor recognition, a promising anti-PD-1 antibody clinical candidate for cancer immunotherapy. PLoS One. 2021;16(12):e0257972.
2. Shan Y, Zhang Y, Wei R, et al. Insights into the mechanisms of serplulimab: a distinctive anti-PD-1 monoclonal antibody, in combination with a TIGIT or LAG3 inhibitor in preclinical tumor immunotherapy studies. mAbs. 2024;16(1):2419838.
Previous Chapter
POHERDY Head-to-Head Phase 3 Trial Published in Clinical Cancer Research, Adding Robust Evidence for HER2-Positive/HR-Negative Breast Cancer Treatment
Next Chapter
Henlius' PD-L1 ADC HLX43 Debuts Gastric Cancer Phase 2 Data at ESMO 2026, Reinforcing Pan-Tumor Potential
Back
Privacy Policy
Cookies Policy
Accessibility
Terms of Use
Privacy Policy
Introduction
Shanghai Henlius Biotech, Inc., and, where applicable, its affiliates and subsidiaries (collectively, “we” , “us” or “our”) attach great importance to the protection of your privacy and personal information. This Privacy Notice (this “Policy”) is formulated in accordance with applicable PRC laws and regulations governing the protection of personal information in the People’s Republic of China (“PRC”).
This Policy applies when: (1) you browse or use our website and other online resources (such as our WeChat official accounts); (2) subscribe to our news or announcements; or (3) contact us through the contact details or other interactive features made available on our website, or otherwise interact with us through our website.. The purpose of this Policy is to explain how and why we process your personal information, the types of personal information involved, applicable retention periods, your rights, and the measures we take to protect personal information. Please read this Policy carefully to ensure that you fully understand its content.
In certain business scenarios, we may provide additional explanations regarding the processing of your personal information through separate agreements, privacy statements, or personal information notices. In the event of any inconsistency, such documents shall prevail. For example, where a recruitment function is provided through a third-party platform or service, the relevant third party privacy policy or notice may also apply.
For the purposes of this Policy, “personal information” refers to all kinds of information related to identified or identifiable natural persons, excluding anonymized information.
We collect, use, store, transfer and otherwise process personal information in strict compliance with applicable PRC laws and regulations of the People’s Republic of China.
Our website may contain links to third party websites for your convenience. We do not control, and are not responsible for, the privacy practices of such third parties. We encourage you to review their privacy policies before using those websites.
If you have any questions or concerns regarding this Policy or our processing of personal information, please contact us using the details provided below.
This Policy will help you understand:
I. How we collect your personal information
II. How we use your personal information
III. How we entrust, share, transfer and publicly disclose your personal information
IV. Cross border transfer of personal information
V. How we store your personal information
VI. Security measures
VII. Your rights
VIII. Personal information of minors
IX. Updates to this Policy
X. How to contact us
I. How do we collect your personal information?
In addition to our employees, we may process personal information of the following persons:
• Visitors and users of our website;
• Healthcare Professionals;
• Investigators of clinical trial institutions and personnel of contract research organizations in clinical trials;
• Subjects of clinical trials and their relatives;
• Consumers/patients and their relatives using our products or services;
• Staff of business partners (including vendors, distributors, partners, etc.); and
• Our applicants.
We may process personal information of website visitors and individuals who contact or interact with us through our website or other online resources. Depending on the relevant page, function, or interaction, separate privacy notices, consents, platform privacy policies, contracts, or other notices may apply.
Based on the context in which you interact with us, we may collect personal information by the following means and on the legal bases permitted by applicable PRC laws and regulations, including your consent, the necessity for entering into or performing a contract, compliance with legal obligations, protection of life, health or property, public health needs, or other circumstances permitted by law:
• Your personal information provided to us voluntarily
When you subscribe to our news or announcements, contact us through the contact details or other interactive features made available on our website, a third-party platform or service linked or referred to on our website, or otherwise communicate with us in relation to our website, we may collect the personal information that you voluntarily provide, such as your name, contact details, organization, and the content of your inquiry or request, depending on the relevant page or function.
• Personal information collected by us independently through our website and other online channels
When you visit our website, most of our services do not require any registration, and you can visit our website without telling us who you are. However, some pages or functions may require you to provide certain personal information. If you choose not provide such information as we request, you may not be able to access certain content or functions or we may not be able to respond to your inquiry, request or subscription. Please refer to the relevant page or notice for further details about the categories of personal information collected in a specific scenario.
• Personal information we collect from vendors or business partners
In the course of our daily business operations, we may collect personal information from our vendors or business partners. We require our vendors and business partners to comply with the requirements of the personal information protection laws and regulations of the PRC and to lawfully provide us with personal information. If you are an employee or representative of one of our vendors or business partners, we may collect personal information such as your name and contact details for the purpose of establishing business contacts and cooperations.
• Personal information we collect from publicly available sources
We may collect personal information of medical and healthcare professionals from such publicy available sources, such as the official websites of medical institutions and the official websites of competent government departments, and process such information within a reasonable scope and for lawful purposes. For example, for the purpose of lawful academic or professional interaction with healthcare professionals, we may collect the name, gender, employer, position, practitioner registration information, academic title, degree, educational background, specialty expertise, and profile information, where such information has been lawfully made public.
Our website may include links, contact details, QR codes, or references to third-party platforms or services. Where you choose to interact with us through such third-party platforms or services, the relevant third party may also process your personal information in accordance with its own privacy policy and applicable law, and we encourage you to review such policy before submitting your information.
II. How do we use your personal information?
We may use your personal information for the following purposes:
• Operating, maintaining and improving our website and other online resource;
• Researching, developing, providing and continuously improving our products and services;
• Conducting and managing daily business;
• Academic interaction with healthcare professionals;
• Responding to your inquiries, requests, or communications sent through our website or the contact details made available on our website;
• Providing subscription services for our news, announcements, or investor-related updates;
• Managing and maintaining our relationship and communications with business contacts who reach us through our website;
• Recruiting and human resource management;
• Internal compliance management,audit,record-keeping; and
• Complying with applicable PRC laws and regulations, for example, monitoring and reporting adverse events for purposes of performing drug quality management responsibilities, providing medical information and dealing with product complaints, etc..
We will process personal information only to the extent necessary for the relevant purpose. Where required by applicable law, we will obtain your consent or separate consent before processing your personal information or sensitive personal information. Where a third-party platform or service is used in connection with a particular function, the relevant third party may process your personal information in accordance with its own privacy policy and applicable law.
III. How do we entrust, share, transfer and publicly disclose your personal information?
1. Entrustment
We may entrust our business partners with the processing of your personal information for the purpose(s) described in this Policy. We will enter into appropriate confidentiality, data processing and security agreements with such entrusted parties and require them to process personal information in accordance with our instructions , this Policy and applicable PRC laws and regulations.
2. Sharing and public disclosure
For the purpose(s) described in this Policy, we will share or publicly disclose your personal information only where permitted by applicable PRC laws and regulations and, where required, after obtaining your consent or separate consent. Such circumstances may include:
• Sharing your personal information among our affiliates and subsidiaries where necessary for legitimate business, management, compliance, or operational purposes;
• Sharing your personal information with vendors or business partners (such as conference service providers, travel service providers, data service providers, banking or insurance institutions, other professional service organizations, to the extent necessary for the relevant purpose); and
• Disclosing your personal information to the extent that it is permitted or required by applicable PRC laws and regulations or for the purpose of assisting with investigations by judicial, regulatory or law enforcement authorities.
• other circumstances permitted by applicable PRC laws and regulations.
If you submit your information through or in connection with a third-party platform or service referred to on our website, the relevant third party may independently process your personal information in accordance with its own privacy policy and applicable law.
3. Transfer
We will not transfer your personal information to any other company, entity or individual unless otherwise permitted by applicable law and, where required, after obtaining your consent. Further, in the event of a merger, acquisition, insolvency, reorganization, division, dissolution, bankruptcy, or similar transaction, we will require the new processor of your personal information to continue to be bound by this Policy or we will require the new processor to obtain your consent again.
IV.How do we provide your personal information across borders?
In principle, personal information that we collect and generate in the course of our operations within the territory of the PRC will be stored within the PRC. In certain circumstances, it may be necessary for us to provide your personal information to recipients outside the PRC in connection with our business operations, website functions, or communications, where permitted by applicable PRC laws and regulations. As required by applicable laws and regulations regarding the protection of personal information, we will provide you with the required notice and obtain your separate consent before providing your personal information across any border, unless otherwise permitted by law. We will use lawful cross-border transfer mechanisms to transfer your personal information oversea and will take necessary measures to ensure that the oversea recipients provide a level of protection required by applicable PRC laws and regulations.
You may obtain more information about cross-border transfers of personal information and oversea recipients through the contact methods referred to in this Policy.
V. How do we store your personal information?
We will retain your personal information for the minimum period necessary to achieve the purposes described in this Policy ,unless a longer retention period is required or permitted by applicable PRC laws and regulations. Upon expiration of the applicable retention period, we will promptly delete or anonymize your personal information in accordance with applicable PRC laws and regulations. Our criteria for determining the period for which personal information shall be retained include:
• Applicable laws, regulations and other relevant requirements;
• The period of time needed for us to provide services, maintain business relations or interact with you; and
• The period of time needed for us to perform relevant agreements or fulfil the purposes described in this Policy.
VI. What security measures do we take to protect your personal information?
In accordance with applicable PRC laws, regulations, and the requirements of relevant national standards, we take reasonable and appropriate security and precautionary measures to protect the personal information we process against unauthorized access, public disclosure, use, modification, destruction or loss of data. However, you are also responsible for taking appropriate measures to protect the security of the devices, systems, and networks you use when accessing our website or communicating with us.
VII. Your rights
In accordance with the requirements of the applicable PRC laws and regulations, you may have the following rights in respect of your personal information:
• To know about and make decisions regarding the processing of your personal information;
• To access or copy your personal information;
• To correct or supplement your personal information;
• To delete your personal information;
• To request for explanation of rules regarding processing of personal information; and
• To change the scope of your consent or revoke your consent , where processing is based on your consent.
If you wish to exercise your rights with respect to personal information, you may contact us through the contact information listed in this Policy and we will respond to any request in accordance with applicable relevant laws and regulations. When you exercise the above rights, we may verify your identity to safeguard the security of your personal information. Subject to applicable PRC laws and regulations, there may be circumstances where we are unable to respond to all or part of your request.
VIII. How do we process the personal information of minors?
For the purposes of this Policy and in accordance with applicable PRC laws and regulations, our products, websites and services are not targeted at minors under the age of 14. Minors under the age of 14 should not provide personal information to us without the consent of a parent or legal guardian.
If a minor's personal information is collected with the consent of a parent or legal guardian, we will process the information only when permitted by law, with the express consent of the parent or legal guardian, or necessary for the protection of the minor. If we discover that we have collected personal information without obtaining verifiable prior consent of a parent or legal guardian, we will seek to delete the data as soon as possible.
IX. Updates of the Policy
We may revise our Privacy Policy from time to time. We will post the updated version on our website and update the “Last Updated” date above or below this Policy.
Last updated: March 30, 2026.
X. How to contact us?
If you have any questions, comments or suggestions concerning this Policy, or any questions or concerns about our processing of your personal information, you may contact us in the following ways:
Address: 11/F, B8 Building, No.188 Yizhou Rd, Xuhui District, Shanghai
Tel.: 021- 33395800
Postal Code: 200233
Email: [email protected]
Cookies Policy
When you visit our website, we may place small data files known as “cookies” on your device. Cookies enable our website to recognize your browser and help us understand how visitors use the site.
Cookies and similar technologies used on this website may collect online identifiers, device information, browser information, IP address, and information about how you interact with the website. In certain circumstances, such information may constitute personal information or may be associated with you under applicable PRC laws and regulations. Information collected through cookies is used for purposes such as ensuring website operation, maintaining security, analyzing traffic and performance, remembering user preferences, and improving website content and user experience.
You may choose to accept or decline cookies by adjusting your browser settings or through any cookie banner or preference center made available on our website, if applicable. Please note that disabling cookies may affect the functionality of certain parts of the website.
搜索
Oct 14, 2026|2026
POHERDY Head-to-Head Phase 3 Trial Published in Clinical Cancer Research, Adding Robust Evidence for HER2-Positive/HR-Negative Breast Cancer Treatment
Henlius' independently developed pertuzumab injection POHERDY® (trade name in China: HANBEIYOU) has had the results of its head-to-head international multicenter Phase 3 trial (NCT05346224) published in Clinical Cancer Research, a leading journal in oncology (2025 impact factor: 10.9). Led by Professor Qiang Liu of Sun Yat-sen Memorial Hospital, Sun Yat-sen University, the trial was first presented as an oral report at the 2025 European Society for Medical Oncology Asia Congress (ESMO Asia 2025). This journal article further strengthens the clinical evidence supporting the use of POHERDY and lays a solid scientific foundation for its clinical use in global markets and its interchangeability with the reference pertuzumab.
Phase 3 Trial Results Supported Interchangeability between POHERDY and Reference Pertuzumab
Breast cancer remains the most commonly diagnosed cancer among women worldwide. According to GLOBOCAN data, there were 2.3 million new breast cancer cases globally in 2022[1], including approximately 357,200 new cases in China[2]. Human epidermal growth factor receptor 2 (HER2)-positive breast cancer accounts for approximately 20%–25% of all breast cancer cases[3] and is characterized by high invasiveness, aggressive biology, and rapid progression. For patients with early-stage or locally advanced HER2-positive breast cancer, a “dual-target” regimen consisting of pertuzumab and trastuzumab has become the cornerstone of standard care, significantly improving pathological complete response rates and giving patients better surgical options and long-term outcomes. Against this backdrop, biosimilars expand treatment options and are important for improving access to treatment and meeting global clinical needs.
The Phase 3 trial for POHERDY is a multicenter, randomized, double-blind equivalence trial evaluating the efficacy and safety of POHERDY versus pertuzumab sourced from the European Union in patients with HER2-positive and hormone receptor (HR)-negative early or locally advanced breast cancer. A total of 908 patients were enrolled and randomized 1:1 to receive four cycles of neoadjuvant therapy with POHERDY plus trastuzumab and docetaxel or reference pertuzumab plus trastuzumab and docetaxel. Following neoadjuvant therapy, surgery and adjuvant chemotherapy, patients continued into an adjuvant anti-HER2 treatment phase designed to further assess the clinical similarity: 192 patients in the POHERDY group received adjuvant POHERDY plus trastuzumab, while 200 patients in the reference pertuzumab group were re-randomized 1:1 to receive adjuvant POHERDY (n=100) or reference pertuzumab (n=100).
The primary endpoint was the total pathological complete response (tpCR) rate assessed by blinded independent central review (BICR). Results showed tpCR rates of 46.3% (95% CI: 41.6%–51.0%) in the POHERDY group and 45.8% (95% CI: 41.2%–50.5%) in the reference pertuzumab group; the relative risk for tpCR between groups was 1.01 (90% CI: 0.90–1.14), and the risk difference was 0.47% (95% CI: −5.99%–6.92%), both falling within the pre-specified equivalence margins. No clinically meaningful differences were observed between the two groups in other efficacy endpoints, safety, pharmacokinetics, or immunogenicity. In the adjuvant anti-HER2 treatment phase, switching from EU-pertuzumab to POHERDY led to no notable differences in safety, pharmacokinetics, or immunogenicity. Taken together, these results supported the clinical similarity between POHERDY and reference pertuzumab.
POHERDY Approved in China, the U.S., and the EU, Strengthening the Breast Cancer Treatment Ecosystem
To date, POHERDY has been approved in all three major global markets: it was approved by the U.S. FDA in November 2025, with interchangeability designation relative to the reference product PERJETA (pertuzumab); by the European Commission in April 2026, becoming the first and only* PERJETA biosimilar approved in both the U.S. and the European Union (EU); and in China on May 29, 2026, with an indication scope matching that already approved for the reference product domestically. With these approvals, POHERDY has become the first and only* “China-developed” pertuzumab approved in China, the EU, and the U.S.
Notably, POHERDY, together with Henlius’ independently developed trastuzumab HANQUYOU (trade name HERCESSI™ in the U.S., Zercepac® in Europe), forms the first domestically developed trastuzumab-pertuzumab “dual-target” combination approved across China, the U.S., and the EU, covering the neoadjuvant, adjuvant, and metastatic treatment needs of HER2-positive breast cancer. In the enhanced adjuvant setting, this dual-target regimen can also be sequenced with HANNAIJIA (neratinib) to help reduce the risk of recurrence in early-stage patients, further completing the treatment loop across the full course of HER2-positive breast cancer. In addition, FOVINACICLIB, an independently developed, domestically originated CDK4/6 inhibitor, provides a standard treatment option for patients with HR-positive/HER2-negative advanced breast cancer, further extending the coverage of Henlius’ domestic portfolio across different breast cancer subtypes.
Guided by its mission of “leaving no breast cancer patient behind,” Henlius continues to advance the development of innovative molecules, progressively building a comprehensive treatment ecosystem that covers all breast cancer subtypes and stages of disease. At the same time, the company will continue to deepen its global footprint in breast cancer, accelerate the commercialization of products, and leverage its diversified pipeline to bring more accessible, higher-quality treatment options to breast cancer patients worldwide.
*As of October 14, 2026, based on the latest publicly available information from the NMPA, FDA, and EMA.
PERJETA is a trademark registered in the European Union by F. Hoffmann-La Roche AG and in the United States by Genentech, Inc.; Henlius is not associated with either trademark owner.
References:
1.https://www.who.int/news/item/01-02-2024-global-cancer-burden-growing--amidst-mounting-need-for-services
2. Bingfeng Han, Rongshou Zheng, Hongmei Zeng, et al. Cancer incidence and mortality in China, 2022. Journal of the National Cancer Center, 2024.
3. Kang S, Lee SH, Lee HJ, et al. Pathological complete response, long-term outcomes, and recurrence patterns in HER2-low versus HER2-zero breast cancer after neoadjuvant chemotherapy. Eur J Cancer. 2022 Sep 29;176:30-40.
Previous Chapter
ASTRO 2026 | Henlius’ Serplulimab Featured in Two Poster Presentations, Exploring New Treatment Pathways for Gastrointestinal Cancers
Next Chapter
ESMO 2026 Preview | Henlius’ Serplulimab U.S. Bridging Study Selected as Proffered Paper presentation, with Studies Exploring Efficacy and Quality of Life in Multiple Solid Tumors
Back
Privacy Policy
Cookies Policy
Accessibility
Terms of Use
Privacy Policy
Introduction
Shanghai Henlius Biotech, Inc., and, where applicable, its affiliates and subsidiaries (collectively, “we” , “us” or “our”) attach great importance to the protection of your privacy and personal information. This Privacy Notice (this “Policy”) is formulated in accordance with applicable PRC laws and regulations governing the protection of personal information in the People’s Republic of China (“PRC”).
This Policy applies when: (1) you browse or use our website and other online resources (such as our WeChat official accounts); (2) subscribe to our news or announcements; or (3) contact us through the contact details or other interactive features made available on our website, or otherwise interact with us through our website.. The purpose of this Policy is to explain how and why we process your personal information, the types of personal information involved, applicable retention periods, your rights, and the measures we take to protect personal information. Please read this Policy carefully to ensure that you fully understand its content.
In certain business scenarios, we may provide additional explanations regarding the processing of your personal information through separate agreements, privacy statements, or personal information notices. In the event of any inconsistency, such documents shall prevail. For example, where a recruitment function is provided through a third-party platform or service, the relevant third party privacy policy or notice may also apply.
For the purposes of this Policy, “personal information” refers to all kinds of information related to identified or identifiable natural persons, excluding anonymized information.
We collect, use, store, transfer and otherwise process personal information in strict compliance with applicable PRC laws and regulations of the People’s Republic of China.
Our website may contain links to third party websites for your convenience. We do not control, and are not responsible for, the privacy practices of such third parties. We encourage you to review their privacy policies before using those websites.
If you have any questions or concerns regarding this Policy or our processing of personal information, please contact us using the details provided below.
This Policy will help you understand:
I. How we collect your personal information
II. How we use your personal information
III. How we entrust, share, transfer and publicly disclose your personal information
IV. Cross border transfer of personal information
V. How we store your personal information
VI. Security measures
VII. Your rights
VIII. Personal information of minors
IX. Updates to this Policy
X. How to contact us
I. How do we collect your personal information?
In addition to our employees, we may process personal information of the following persons:
• Visitors and users of our website;
• Healthcare Professionals;
• Investigators of clinical trial institutions and personnel of contract research organizations in clinical trials;
• Subjects of clinical trials and their relatives;
• Consumers/patients and their relatives using our products or services;
• Staff of business partners (including vendors, distributors, partners, etc.); and
• Our applicants.
We may process personal information of website visitors and individuals who contact or interact with us through our website or other online resources. Depending on the relevant page, function, or interaction, separate privacy notices, consents, platform privacy policies, contracts, or other notices may apply.
Based on the context in which you interact with us, we may collect personal information by the following means and on the legal bases permitted by applicable PRC laws and regulations, including your consent, the necessity for entering into or performing a contract, compliance with legal obligations, protection of life, health or property, public health needs, or other circumstances permitted by law:
• Your personal information provided to us voluntarily
When you subscribe to our news or announcements, contact us through the contact details or other interactive features made available on our website, a third-party platform or service linked or referred to on our website, or otherwise communicate with us in relation to our website, we may collect the personal information that you voluntarily provide, such as your name, contact details, organization, and the content of your inquiry or request, depending on the relevant page or function.
• Personal information collected by us independently through our website and other online channels
When you visit our website, most of our services do not require any registration, and you can visit our website without telling us who you are. However, some pages or functions may require you to provide certain personal information. If you choose not provide such information as we request, you may not be able to access certain content or functions or we may not be able to respond to your inquiry, request or subscription. Please refer to the relevant page or notice for further details about the categories of personal information collected in a specific scenario.
• Personal information we collect from vendors or business partners
In the course of our daily business operations, we may collect personal information from our vendors or business partners. We require our vendors and business partners to comply with the requirements of the personal information protection laws and regulations of the PRC and to lawfully provide us with personal information. If you are an employee or representative of one of our vendors or business partners, we may collect personal information such as your name and contact details for the purpose of establishing business contacts and cooperations.
• Personal information we collect from publicly available sources
We may collect personal information of medical and healthcare professionals from such publicy available sources, such as the official websites of medical institutions and the official websites of competent government departments, and process such information within a reasonable scope and for lawful purposes. For example, for the purpose of lawful academic or professional interaction with healthcare professionals, we may collect the name, gender, employer, position, practitioner registration information, academic title, degree, educational background, specialty expertise, and profile information, where such information has been lawfully made public.
Our website may include links, contact details, QR codes, or references to third-party platforms or services. Where you choose to interact with us through such third-party platforms or services, the relevant third party may also process your personal information in accordance with its own privacy policy and applicable law, and we encourage you to review such policy before submitting your information.
II. How do we use your personal information?
We may use your personal information for the following purposes:
• Operating, maintaining and improving our website and other online resource;
• Researching, developing, providing and continuously improving our products and services;
• Conducting and managing daily business;
• Academic interaction with healthcare professionals;
• Responding to your inquiries, requests, or communications sent through our website or the contact details made available on our website;
• Providing subscription services for our news, announcements, or investor-related updates;
• Managing and maintaining our relationship and communications with business contacts who reach us through our website;
• Recruiting and human resource management;
• Internal compliance management,audit,record-keeping; and
• Complying with applicable PRC laws and regulations, for example, monitoring and reporting adverse events for purposes of performing drug quality management responsibilities, providing medical information and dealing with product complaints, etc..
We will process personal information only to the extent necessary for the relevant purpose. Where required by applicable law, we will obtain your consent or separate consent before processing your personal information or sensitive personal information. Where a third-party platform or service is used in connection with a particular function, the relevant third party may process your personal information in accordance with its own privacy policy and applicable law.
III. How do we entrust, share, transfer and publicly disclose your personal information?
1. Entrustment
We may entrust our business partners with the processing of your personal information for the purpose(s) described in this Policy. We will enter into appropriate confidentiality, data processing and security agreements with such entrusted parties and require them to process personal information in accordance with our instructions , this Policy and applicable PRC laws and regulations.
2. Sharing and public disclosure
For the purpose(s) described in this Policy, we will share or publicly disclose your personal information only where permitted by applicable PRC laws and regulations and, where required, after obtaining your consent or separate consent. Such circumstances may include:
• Sharing your personal information among our affiliates and subsidiaries where necessary for legitimate business, management, compliance, or operational purposes;
• Sharing your personal information with vendors or business partners (such as conference service providers, travel service providers, data service providers, banking or insurance institutions, other professional service organizations, to the extent necessary for the relevant purpose); and
• Disclosing your personal information to the extent that it is permitted or required by applicable PRC laws and regulations or for the purpose of assisting with investigations by judicial, regulatory or law enforcement authorities.
• other circumstances permitted by applicable PRC laws and regulations.
If you submit your information through or in connection with a third-party platform or service referred to on our website, the relevant third party may independently process your personal information in accordance with its own privacy policy and applicable law.
3. Transfer
We will not transfer your personal information to any other company, entity or individual unless otherwise permitted by applicable law and, where required, after obtaining your consent. Further, in the event of a merger, acquisition, insolvency, reorganization, division, dissolution, bankruptcy, or similar transaction, we will require the new processor of your personal information to continue to be bound by this Policy or we will require the new processor to obtain your consent again.
IV.How do we provide your personal information across borders?
In principle, personal information that we collect and generate in the course of our operations within the territory of the PRC will be stored within the PRC. In certain circumstances, it may be necessary for us to provide your personal information to recipients outside the PRC in connection with our business operations, website functions, or communications, where permitted by applicable PRC laws and regulations. As required by applicable laws and regulations regarding the protection of personal information, we will provide you with the required notice and obtain your separate consent before providing your personal information across any border, unless otherwise permitted by law. We will use lawful cross-border transfer mechanisms to transfer your personal information oversea and will take necessary measures to ensure that the oversea recipients provide a level of protection required by applicable PRC laws and regulations.
You may obtain more information about cross-border transfers of personal information and oversea recipients through the contact methods referred to in this Policy.
V. How do we store your personal information?
We will retain your personal information for the minimum period necessary to achieve the purposes described in this Policy ,unless a longer retention period is required or permitted by applicable PRC laws and regulations. Upon expiration of the applicable retention period, we will promptly delete or anonymize your personal information in accordance with applicable PRC laws and regulations. Our criteria for determining the period for which personal information shall be retained include:
• Applicable laws, regulations and other relevant requirements;
• The period of time needed for us to provide services, maintain business relations or interact with you; and
• The period of time needed for us to perform relevant agreements or fulfil the purposes described in this Policy.
VI. What security measures do we take to protect your personal information?
In accordance with applicable PRC laws, regulations, and the requirements of relevant national standards, we take reasonable and appropriate security and precautionary measures to protect the personal information we process against unauthorized access, public disclosure, use, modification, destruction or loss of data. However, you are also responsible for taking appropriate measures to protect the security of the devices, systems, and networks you use when accessing our website or communicating with us.
VII. Your rights
In accordance with the requirements of the applicable PRC laws and regulations, you may have the following rights in respect of your personal information:
• To know about and make decisions regarding the processing of your personal information;
• To access or copy your personal information;
• To correct or supplement your personal information;
• To delete your personal information;
• To request for explanation of rules regarding processing of personal information; and
• To change the scope of your consent or revoke your consent , where processing is based on your consent.
If you wish to exercise your rights with respect to personal information, you may contact us through the contact information listed in this Policy and we will respond to any request in accordance with applicable relevant laws and regulations. When you exercise the above rights, we may verify your identity to safeguard the security of your personal information. Subject to applicable PRC laws and regulations, there may be circumstances where we are unable to respond to all or part of your request.
VIII. How do we process the personal information of minors?
For the purposes of this Policy and in accordance with applicable PRC laws and regulations, our products, websites and services are not targeted at minors under the age of 14. Minors under the age of 14 should not provide personal information to us without the consent of a parent or legal guardian.
If a minor's personal information is collected with the consent of a parent or legal guardian, we will process the information only when permitted by law, with the express consent of the parent or legal guardian, or necessary for the protection of the minor. If we discover that we have collected personal information without obtaining verifiable prior consent of a parent or legal guardian, we will seek to delete the data as soon as possible.
IX. Updates of the Policy
We may revise our Privacy Policy from time to time. We will post the updated version on our website and update the “Last Updated” date above or below this Policy.
Last updated: March 30, 2026.
X. How to contact us?
If you have any questions, comments or suggestions concerning this Policy, or any questions or concerns about our processing of your personal information, you may contact us in the following ways:
Address: 11/F, B8 Building, No.188 Yizhou Rd, Xuhui District, Shanghai
Tel.: 021- 33395800
Postal Code: 200233
Email: [email protected]
Cookies Policy
When you visit our website, we may place small data files known as “cookies” on your device. Cookies enable our website to recognize your browser and help us understand how visitors use the site.
Cookies and similar technologies used on this website may collect online identifiers, device information, browser information, IP address, and information about how you interact with the website. In certain circumstances, such information may constitute personal information or may be associated with you under applicable PRC laws and regulations. Information collected through cookies is used for purposes such as ensuring website operation, maintaining security, analyzing traffic and performance, remembering user preferences, and improving website content and user experience.
You may choose to accept or decline cookies by adjusting your browser settings or through any cookie banner or preference center made available on our website, if applicable. Please note that disabling cookies may affect the functionality of certain parts of the website.
2026-10-14
近日,复宏汉霖自主研发的帕妥珠单抗注射液汉倍优®(美国及欧洲商品名:POHERDY®)的头对头国际多中心III期临床研究(NCT05346224)正式发表于国际肿瘤学权威期刊_Clinical Cancer Research_(最新影响因子:10.9)。该试验由中山大学孙逸仙纪念医院刘强教授牵头开展,此前已于2025年欧洲肿瘤内科学会亚洲年会(ESMO Asia 2025)上以口头报告形式亮相。此次期刊发表进一步夯实了汉倍优®的临床证据体系,也为汉倍优®在全球市场的临床实践及与原研帕妥珠单抗的可互换应用奠定了坚实的科学基础。
III期研究结果支持与原研帕妥珠单抗互换
乳腺癌是全球发病率最高的女性恶性肿瘤,根据GLOBOCAN数据,2022年全球乳腺癌新发病例达230万例[1],中国新发病例约35.72万例[2]。其中,人表皮生长因子受体2(HER2)阳性乳腺癌约占全部乳腺癌的20%–25%[3],具有侵袭性强、恶性程度高、进展快的特点。对于早期或局部晚期HER2阳性乳腺癌患者,以帕妥珠单抗联合曲妥珠单抗为核心的“双靶”治疗方案,能够显著提高病理完全缓解率、为患者争取更优的手术条件和长期预后,已成为该领域的标准治疗基石。在此背景下,生物类似药能够丰富临床选择,对提升患者治疗可及性、满足全球临床需求具有重要意义。
汉倍优®III期临床研究是一项多中心、随机、双盲的等效性研究,评估了汉倍优®对比欧盟市售原研帕妥珠单抗用于HER2阳性且激素受体(HR)阴性的早期或局部晚期乳腺癌新辅助治疗的疗效和安全性。研究共入组908例患者,按1:1随机分配至汉倍优®组与欧盟市售原研帕妥珠单抗组,分别接受4个周期的汉倍优®联合曲妥珠单抗和多西他赛或原研帕妥珠单抗联合曲妥珠单抗和多西他赛新辅助治疗。完成新辅助治疗、手术和辅助化疗后,研究设置了抗HER2辅助治疗阶段,以进一步考察等效性:汉倍优®组有192例患者接受辅助汉倍优®联合曲妥珠单抗治疗;原研帕妥珠单抗组有200例患者再次1:1随机分配,分别接受汉倍优®联合曲妥珠单抗(100例)或原研帕妥珠单抗联合曲妥珠单抗(100例)抗HER2辅助治疗。
研究的主要终点为经盲态独立评审委员会(BICR)评估的总病理完全缓解(tpCR)率。结果显示,汉倍优®组与原研帕妥珠单抗组的tpCR率分别为46.3%(95% 置信区间[CI]:41.6%–51.0%)和45.8%(95% CI:41.2%–50.5%)。两组间tpCR率相对风险为1.01(90% CI:0.90–1.14),风险差为0.47%(95% CI:−5.99%–6.92%),均落于预设等效区间内。两组在其他疗效终点、安全性、药代动力学及免疫原性方面均未观察到具有临床意义的差异。在抗HER2辅助治疗阶段,由原研帕妥珠单抗转换为汉倍优®治疗后,在安全性、药代动力学及免疫原性方面也未见明显变化。综上所述,以上结果支持了汉倍优®和原研帕妥珠单抗的临床相似性。
汉倍优®中美欧获批 完善乳腺癌治疗生态
截至目前,汉倍优®已获得三大国际主流市场批准:2025年11月获美国FDA批准,并可与原研产品PERJETA(pertuzumab)互换使用;2026年4月获欧盟委员会批准,成为美国和欧盟首款且唯一*的PERJETA生物类似药;2026年5月29日,汉倍优®在中国获批上市,覆盖原研产品在国内已获批的全部适应症。至此,汉倍优®成为首个且唯一*在中国、欧盟、美国三地全部获批上市的“中国籍”帕妥珠单抗。
值得一提的是,汉倍优®与复宏汉霖自主研发的曲妥珠单抗汉曲优®(美国商品名HERCESSI™,欧洲商品名Zercepac®)联合,形成首个在中美欧三地均获批的国产“曲帕双靶”方案,可覆盖HER2阳性乳腺癌新辅助、辅助及转移性治疗的需求。在强化辅助治疗阶段,该双靶方案还可与强化辅助治疗药物汉奈佳®(奈拉替尼)形成序贯治疗,有助于降低早期患者复发风险,进一步完善HER2阳性乳腺癌的全病程治疗闭环。此外,复妥宁®(伏维西利)作为创新型CDK4/6抑制剂,为HR阳性/HER2阴性晚期乳腺癌患者提供了标准治疗选择,也拓展了国产方案在乳腺癌不同亚型中的覆盖。
秉持“不让一个乳腺癌患者落下”的使命,复宏汉霖正积极推进更多创新分子的研发,逐步构建覆盖乳腺癌全亚型、全分期的完整治疗生态。同时,公司将继续深化乳腺癌领域的全球化布局,通过多元管线协同推进,为全球更多乳腺癌患者带来更可及、更优质的治疗选择。
*截至2026年10月14日,在NMPA、FDA及EMA最新查询结果
参考文献
1.https://www.who.int/news/item/01-02-2024-global-cancer-burden-growing--amidst-mounting-need-for-services
2. Bingfeng Han, Rongshou Zheng, Hongmei Zeng, et al. Cancer incidence and mortality in China, 2022. Journal of the National Cancer Center, 2024.
3. Kang S, Lee SH, Lee HJ, et al. Pathological complete response, long-term outcomes, and recurrence patterns in HER2-low versus HER2-zero breast cancer after neoadjuvant chemotherapy. Eur J Cancer. 2022 Sep 29;176:30-40.
Copyright © 2019 All rights reserved 上海复宏汉霖生物技术股份有限公司
沪ICP备13029242号-1
沪公网安备 31010402002777号
互联网药品信息服务资格证书编号:(沪)-非经营性-2024-0127
领英
微信
2026-09-30
近日,复宏汉霖(2696.HK)与浙江省肿瘤医院达成战略合作,双方充分发挥各自在临床资源和生物医药研发产业化方面的优势,将围绕临床科研协同与创新成果转化等重点领域深化合作,携手推动我国肿瘤诊疗事业高质量发展,助力科技强国建设。浙江省肿瘤医院党委书记程向东教授,复宏汉霖党委书记兼董事会秘书王燕女士,首席商务官余诚先生,首席科学官袁纪军博士以及肿瘤事业部总经理孙光日先生等出席了战略合作签约仪式。
浙江省肿瘤医院党委书记
程向东教授表示
“
建设高水平研究型医院,离不开医企协同创新。复宏汉霖具备药物早期研发、临床开发到生产和市场化的全链条能力,双方过往合作基础扎实。希望以本次战略签约为新起点,依托医院平台优势,结合企业技术产业化实力,协力攻克临床关键问题,以高质量临床研究助力肿瘤诊疗水平提升。
”
复宏汉霖党委书记兼董事会秘书
王燕女士表示
“
浙江省肿瘤医院具备雄厚的临床实力、高标准的药物临床试验管理体系,与复宏汉霖立足中国、面向全球开发高品质生物药的发展使命高度同频。期待依托本次战略合作,双方强强联合,加速创新管线的临床开发进程,推动更多优质抗肿瘤创新药早日走向市场,造福广大肿瘤患者。
”
浙江省肿瘤医院始建于1963年,是集肿瘤预防、医疗、科研、教学、康复于一体的三级甲等肿瘤专科医院,也是新中国成立最早的四所肿瘤专科医院之一,现牵头建设国家癌症区域医疗中心,全国三级公立医院绩效考核连续7年获最优等级。学科建设领先,科研实力雄厚,与中国科学院杭州医学研究所深度融合,拥有省级科创平台21个,生物样本库自动化储存能力1000万份。秉承“仁爱、和谐、创新、奉献”院训,朝着“国内标杆、国际知名、患者首选的研究型肿瘤中心”迈进。
复宏汉霖是一家国际化创新生物制药企业,致力于为全球患者提供高品质、可负担的生物药,产品覆盖肿瘤、自身免疫疾病、眼科疾病等领域。自2010年成立以来,公司已构建涵盖全球研发、临床、注册、生产及商业化的全产业链平台。截至目前,共有10款产品在全球60余个国家和地区获批上市,其中8款产品已在中国获批。在创新研发方面,复宏汉霖构建了多元化、平台化的创新技术矩阵,拥有50余项早创新资产,其中约70%具备同类最佳(Best-in-Class)潜力,并在全球同步推进50余项临床研究。
未来,复宏汉霖将持续深化医企协同,联动国内顶尖医疗机构,聚焦临床未被满足的治疗需求,加速推动本土抗肿瘤创新成果转化落地,为提升国内肿瘤诊疗水平、守护人民生命健康贡献产业力量。
Copyright © 2019 All rights reserved 上海复宏汉霖生物技术股份有限公司
沪ICP备13029242号-1
沪公网安备 31010402002777号
互联网药品信息服务资格证书编号:(沪)-非经营性-2024-0127
领英
微信
搜索
Sep 29, 2026|2026
ASTRO 2026 | Henlius’ Serplulimab Featured in Two Poster Presentations, Exploring New Treatment Pathways for Gastrointestinal Cancers
The American Society for Radiation Oncology (ASTRO) Annual Meeting was held in Boston, Massachusetts, USA, from September 26 to 30, 2026. At the meeting, Henlius presented two poster studies of serplulimab, its innovative anti-PD-1 monoclonal antibody(mAb), in gastrointestinal cancers. The TORCH-C study, led by Professor Sanjun Cai and Professor Zhen Zhang of Fudan University Shanghai Cancer Center, evaluated neoadjuvant serplulimab plus chemoradiotherapy for pMMR, high-risk locally advanced colon cancer, exploring a potential new neoadjuvant treatment strategy. The second study, led by Professor Xiaolong Fu and Professor Wen Yu of Shanghai Chest Hospital, assessed serplulimab plus chemoradiotherapy for unresectable locally advanced esophageal squamous cell carcinoma (ESCC), providing an immunization-based stratified radiochemotherapy treatment option for this field. These studies further validate the therapeutic efficacy of serplulimab in the domain of gastrointestinal cancers.
Serplulimab is the world’s first* anti-PD-1 mAb approved for first-line treatment of SCLC, and also the first and only** anti-PD-1 mAb approved for the perioperative treatment of gastric cancer. To date, serplulimab has been approved globally*** for first-line treatment of squamous non-small cell lung cancer (sqNSCLC), extensive-stage small cell lung cancer (ES-SCLC), ESCC, and non-squamous non-small cell lung cancer (nsqNSCLC), as well as perioperative treatment of gastric cancer. In the field of gastrointestinal cancers, in addition to the already approved first-line treatment for advanced ESCC and the perioperative indication for gastric cancer, Henlius is actively promoting a global multicenter Phase 3 clinical study (ASTRUM-015) of serplulimab combined with bevacizumab and chemotherapy as first-line treatment for metastatic colorectal cancer (mCRC). Patient enrollment has been completed globally, aiming to fill the clinical gap in immunotherapy for non-MSI-H mCRC.
The TORCH-C study presented at this year's ASTRO conference is a randomized phase 2 clinical trial for MSS/pMMR high-risk locally advanced colon cancer. It evaluated the efficacy and safety of neoadjuvant immunotherapy combined with radiochemotherapy vs chemotherapy. The findings showed that as of September 2025, the pCR rate in the immunotherapy combined with radiotherapy group reached 45.3%, more than four times higher than the chemotherapy group (10%), providing a new treatment option for high-risk LACC patients. Previously, the study data had been presented at the 2026 Annual Meeting of the American Society of Clinical Oncology (ASCO).
Neoadjuvant short-course radiotherapy combined with immunochemotherapy vs chemotherapy alone in pMMR colon cancers: The TORCH-C Randomized phase 2 Clinical Trial
Study Design:
TORCH-C is a prospective, multicenter, randomized phase 2 study enrolled patients from April 3, 2023, through September 9, 2025. A total of 120 high-risk LACC (T4/bulky N+M0,pMMR/MSS) patients were 1:1 randomized to either a SCRT combined with immunotherapy and CAPOX chemotherapy group (group A) or a chemotherapy alone group (group B). Patients in the group B received 4 cycles of CAPOX (oxaliplatin 130 mg/m2intravenously day 1 and capecitabine 1000 mg/m2orally days 1-14). Patients in the group A received SCRT(25Gy in 5 fraction)and 4 cycles of the PD-1 inhibitor (serplulimab, 300mg intravenously day 1) combined with CAPOX. The radiotherapy target volume includes only the primary colon tumor and enlarged lymph nodes, without elective nodal irradiation. Radiotherapy was delivered on a CT-linac using an online adaptive radiotherapy (ART) guided by daily diagnostic CT imaging. After neoadjuvant therapy, patients will be evaluated for radical colon resection. All patients will receive adjuvant chemotherapy of four cycles of CAPOX. The primary outcome was pathological complete response (pCR) rate. The secondary outcomes included tumor downstaging, R0 resection, 3-year disease free survival (DFS), 3-year overall survival (OS), 3-year local recurrence-free survival and treatment-related toxicity.
Results**:**
120 patients have been enrolled and randomized. 107 patients were included in the mITT analysis (54 in group A and 53 in group B). 103 have received surgery (50 in the chemotherapy group, 53 in the radiotherapy group). The pCR rate was 10% (5/50) in chemotherapy group (group B) and 45.3% (24/53) in the radiotherapy group (group A) (P<0.05). The most common grade 3-4 adverse event (AE) among patients was thrombocytopenia, (22.2%, 12/54) in the group A and (18.9%, 10/53) in the group B. Radiotherapy was safely delivered, the most common AE was grade 1-2 diarrhea and Abdominal pain.
Conclusion**:**
The combination of SCRT, PD-1 inhibitor, and chemotherapy shows promising efficacy and significantly improve pCR rates in patients with MSS/pMMR high-risk LACC. SCRT could be safely delivered by high-resolution CT image-guided ART.
Another selected study evaluated the efficacy and safety of serplulimab in combination with chemoradiotherapy for unresectable, locally advanced ESCC. This was a single-arm, multicenter Phase 2/3 clinical trial in which radiotherapy strategies were tailored according to patients’ responses to induction therapy. As of December 2025, the major pathological response (MPR) rate following induction therapy was 49%. After immunotherapy combined with concurrent chemoradiotherapy, the objective response rate (ORR) reached 85%, while the disease control rate (DCR) was 97%. The overall safety profile was manageable. These findings offer a novel treatment approach integrating immunotherapy with response-adapted, stratified chemoradiotherapy for locally advanced ESCC.
Serplulimab plus Chemoradiotherapy for Unresectable Locally Advanced Esophageal Squamous Cell Carcinoma: A Single-Arm, Multicenter, Phase I/II Trial (SCR-ESCC-02)
Study Design:
This study is a single-arm, Phase I/II trial for patients(pts) with unresectable locally advanced (ESCC), including a safety run-in (Phase I, n=15) followed by a Simon's two-stage expansion (Phase II, n=35). All pts received 2 cycles of induction Serplulimab (4.5 mg/kg, D1, Q3W) c, nab-paclitaxel (125 mg/m², D1,8, Q3W) and carboplatin (AUC=5, D1, Q3W). Three weeks post-induction, pts were stratified by predicted major pathological response (MPR) using a CT and biopsy-based model. MPR pts received reduced-dose radiotherapy (PTV-C 45Gy/25Fx; PTV-G 50 Gy/25Fx); non-MPR pts received standard-dose radiotherapy (PTV-C 50 Gy/25Fx). During radiotherapy, all pts received concurrent Serplulimab (4.5 mg/kg, Q3W), weekly nab-paclitaxel (80 mg/m², QW),and carboplatin (AUC=2, QW) for up to 5 weeks, followed by Serplulimab maintenance until progression, unacceptable toxicity, or 1 year. The primary endpoint is progression-free survival (PFS), and secondary endpoints are overall survival (OS) and safety.
Results**:**
As of December 2025, 39 pts were enrolled with median age of 68 years [IQR 60–70]. The majority were male (36/39, 92%), and most with T3–4 (33/39, 85%) and N0–1 (26/39, 67%). All pts completed induction therapy, MPR rate among pts completing induction was 49% (19/39). During induction therapy, the overall AEs incidence rate was 62% (24/39); the most common grade 3-4 AE was neutropenia (18%, 7/39). 39 pts received concurrent immunotherapy with chemoradiotherapy(ICRT). Observed response per RECIST1.1 was 16 complete response (CR) and 17 partial response (PR), objective response rate (ORR) was 85% and disease control rate (DCR) was 97%. During ICRT, the overall AEs incidence rate was 100% (39/39). No AE was fatal. This study is still ongoing, and longer follow-up will provide more solid evidence.
Conclusion**:**
This combination therapy showed manageable toxicity that could provide a new strategy for locally advanced ESCC.
Preclinical studies have demonstrated that serplulimab has high affinity for the PD-1 receptor and achieves steric blockade through a differentiated binding conformation. Unlike other PD-1 inhibitors, serplulimab can induce stronger PD-1 internalization, reducing PD-1 receptor presence on T cells and thereby more thoroughly alleviating immunosuppressive signaling.1 In terms of its blocking mechanism, serplulimab not only disrupts trans PD-1/PD-L1 binding, but also interferes with the cis interaction between PD-1 and CD28. These dual mechanisms reduce PD-1 recruitment to the costimulatory molecule CD28, thereby preserving CD28 signaling, enhancing downstream AKT activity,2 and promoting sustained T-cell activation.
Supported by this differentiated mechanism and robust clinical evidence, serplulimab continues to make significant strides internationally, with its global commercialization footprint expanding rapidly. To date, it has been approved in more than 50 countries and regions, including China, the United Kingdom, the European Union, Singapore, India, Switzerland, and Peru, covering nearly half of the world’s population. In collaboration with global partners including Accord, Abbott, and Eisai, Henlius is steadily advancing the overseas commercialization of serplulimab. Since receiving its first approval in the European Union in February 2025, to date, serplulimab has been commercially launched in 16 European countries and has been included in reimbursement or public healthcare coverage systems in more than 10 countries, including the United Kingdom, Austria, Denmark, Germany, Ireland, Italy, Spain, and Sweden, demonstrating broad potential for global clinical use.
* In June 2026, serplulimab received NMPA approval as the world's first anti-PD-1 mAb for perioperative gastric cancer treatment. As of September 2026, it remains the only one.
** In January 2023, serplulimab received NMPA approval as the world's first anti-PD-1 mAb for the first line treatment of ES-SCLC.
***Approved indications may vary by countryor region. Please refer to announcements issued by local regulatory authoritiesfor approved indications in each market.
References:
1. Issafras H, et al. Structural basis of HLX10 PD-1 receptor recognition, a promising anti-PD-1 antibody clinical candidate for cancer immunotherapy. PLoS One. 2021;16(12):e0257972.
2. Shan Y, Zhang Y, Wei R, et al. Insights into the mechanisms of serplulimab: a distinctive anti-PD-1 monoclonal antibody, in combination with a TIGIT or LAG3 inhibitor in preclinical tumor immunotherapy studies. mAbs. 2024;16(1):2419838.
Previous Chapter
ESMO 2026 | Henlius’ U.S. ASTRIDE Study of Serplulimab Selected for Proffered Paper Presentation
Next Chapter
POHERDY Head-to-Head Phase 3 Trial Published in Clinical Cancer Research, Adding Robust Evidence for HER2-Positive/HR-Negative Breast Cancer Treatment
Back
Privacy Policy
Cookies Policy
Accessibility
Terms of Use
Privacy Policy
Introduction
Shanghai Henlius Biotech, Inc., and, where applicable, its affiliates and subsidiaries (collectively, “we” , “us” or “our”) attach great importance to the protection of your privacy and personal information. This Privacy Notice (this “Policy”) is formulated in accordance with applicable PRC laws and regulations governing the protection of personal information in the People’s Republic of China (“PRC”).
This Policy applies when: (1) you browse or use our website and other online resources (such as our WeChat official accounts); (2) subscribe to our news or announcements; or (3) contact us through the contact details or other interactive features made available on our website, or otherwise interact with us through our website.. The purpose of this Policy is to explain how and why we process your personal information, the types of personal information involved, applicable retention periods, your rights, and the measures we take to protect personal information. Please read this Policy carefully to ensure that you fully understand its content.
In certain business scenarios, we may provide additional explanations regarding the processing of your personal information through separate agreements, privacy statements, or personal information notices. In the event of any inconsistency, such documents shall prevail. For example, where a recruitment function is provided through a third-party platform or service, the relevant third party privacy policy or notice may also apply.
For the purposes of this Policy, “personal information” refers to all kinds of information related to identified or identifiable natural persons, excluding anonymized information.
We collect, use, store, transfer and otherwise process personal information in strict compliance with applicable PRC laws and regulations of the People’s Republic of China.
Our website may contain links to third party websites for your convenience. We do not control, and are not responsible for, the privacy practices of such third parties. We encourage you to review their privacy policies before using those websites.
If you have any questions or concerns regarding this Policy or our processing of personal information, please contact us using the details provided below.
This Policy will help you understand:
I. How we collect your personal information
II. How we use your personal information
III. How we entrust, share, transfer and publicly disclose your personal information
IV. Cross border transfer of personal information
V. How we store your personal information
VI. Security measures
VII. Your rights
VIII. Personal information of minors
IX. Updates to this Policy
X. How to contact us
I. How do we collect your personal information?
In addition to our employees, we may process personal information of the following persons:
• Visitors and users of our website;
• Healthcare Professionals;
• Investigators of clinical trial institutions and personnel of contract research organizations in clinical trials;
• Subjects of clinical trials and their relatives;
• Consumers/patients and their relatives using our products or services;
• Staff of business partners (including vendors, distributors, partners, etc.); and
• Our applicants.
We may process personal information of website visitors and individuals who contact or interact with us through our website or other online resources. Depending on the relevant page, function, or interaction, separate privacy notices, consents, platform privacy policies, contracts, or other notices may apply.
Based on the context in which you interact with us, we may collect personal information by the following means and on the legal bases permitted by applicable PRC laws and regulations, including your consent, the necessity for entering into or performing a contract, compliance with legal obligations, protection of life, health or property, public health needs, or other circumstances permitted by law:
• Your personal information provided to us voluntarily
When you subscribe to our news or announcements, contact us through the contact details or other interactive features made available on our website, a third-party platform or service linked or referred to on our website, or otherwise communicate with us in relation to our website, we may collect the personal information that you voluntarily provide, such as your name, contact details, organization, and the content of your inquiry or request, depending on the relevant page or function.
• Personal information collected by us independently through our website and other online channels
When you visit our website, most of our services do not require any registration, and you can visit our website without telling us who you are. However, some pages or functions may require you to provide certain personal information. If you choose not provide such information as we request, you may not be able to access certain content or functions or we may not be able to respond to your inquiry, request or subscription. Please refer to the relevant page or notice for further details about the categories of personal information collected in a specific scenario.
• Personal information we collect from vendors or business partners
In the course of our daily business operations, we may collect personal information from our vendors or business partners. We require our vendors and business partners to comply with the requirements of the personal information protection laws and regulations of the PRC and to lawfully provide us with personal information. If you are an employee or representative of one of our vendors or business partners, we may collect personal information such as your name and contact details for the purpose of establishing business contacts and cooperations.
• Personal information we collect from publicly available sources
We may collect personal information of medical and healthcare professionals from such publicy available sources, such as the official websites of medical institutions and the official websites of competent government departments, and process such information within a reasonable scope and for lawful purposes. For example, for the purpose of lawful academic or professional interaction with healthcare professionals, we may collect the name, gender, employer, position, practitioner registration information, academic title, degree, educational background, specialty expertise, and profile information, where such information has been lawfully made public.
Our website may include links, contact details, QR codes, or references to third-party platforms or services. Where you choose to interact with us through such third-party platforms or services, the relevant third party may also process your personal information in accordance with its own privacy policy and applicable law, and we encourage you to review such policy before submitting your information.
II. How do we use your personal information?
We may use your personal information for the following purposes:
• Operating, maintaining and improving our website and other online resource;
• Researching, developing, providing and continuously improving our products and services;
• Conducting and managing daily business;
• Academic interaction with healthcare professionals;
• Responding to your inquiries, requests, or communications sent through our website or the contact details made available on our website;
• Providing subscription services for our news, announcements, or investor-related updates;
• Managing and maintaining our relationship and communications with business contacts who reach us through our website;
• Recruiting and human resource management;
• Internal compliance management,audit,record-keeping; and
• Complying with applicable PRC laws and regulations, for example, monitoring and reporting adverse events for purposes of performing drug quality management responsibilities, providing medical information and dealing with product complaints, etc..
We will process personal information only to the extent necessary for the relevant purpose. Where required by applicable law, we will obtain your consent or separate consent before processing your personal information or sensitive personal information. Where a third-party platform or service is used in connection with a particular function, the relevant third party may process your personal information in accordance with its own privacy policy and applicable law.
III. How do we entrust, share, transfer and publicly disclose your personal information?
1. Entrustment
We may entrust our business partners with the processing of your personal information for the purpose(s) described in this Policy. We will enter into appropriate confidentiality, data processing and security agreements with such entrusted parties and require them to process personal information in accordance with our instructions , this Policy and applicable PRC laws and regulations.
2. Sharing and public disclosure
For the purpose(s) described in this Policy, we will share or publicly disclose your personal information only where permitted by applicable PRC laws and regulations and, where required, after obtaining your consent or separate consent. Such circumstances may include:
• Sharing your personal information among our affiliates and subsidiaries where necessary for legitimate business, management, compliance, or operational purposes;
• Sharing your personal information with vendors or business partners (such as conference service providers, travel service providers, data service providers, banking or insurance institutions, other professional service organizations, to the extent necessary for the relevant purpose); and
• Disclosing your personal information to the extent that it is permitted or required by applicable PRC laws and regulations or for the purpose of assisting with investigations by judicial, regulatory or law enforcement authorities.
• other circumstances permitted by applicable PRC laws and regulations.
If you submit your information through or in connection with a third-party platform or service referred to on our website, the relevant third party may independently process your personal information in accordance with its own privacy policy and applicable law.
3. Transfer
We will not transfer your personal information to any other company, entity or individual unless otherwise permitted by applicable law and, where required, after obtaining your consent. Further, in the event of a merger, acquisition, insolvency, reorganization, division, dissolution, bankruptcy, or similar transaction, we will require the new processor of your personal information to continue to be bound by this Policy or we will require the new processor to obtain your consent again.
IV.How do we provide your personal information across borders?
In principle, personal information that we collect and generate in the course of our operations within the territory of the PRC will be stored within the PRC. In certain circumstances, it may be necessary for us to provide your personal information to recipients outside the PRC in connection with our business operations, website functions, or communications, where permitted by applicable PRC laws and regulations. As required by applicable laws and regulations regarding the protection of personal information, we will provide you with the required notice and obtain your separate consent before providing your personal information across any border, unless otherwise permitted by law. We will use lawful cross-border transfer mechanisms to transfer your personal information oversea and will take necessary measures to ensure that the oversea recipients provide a level of protection required by applicable PRC laws and regulations.
You may obtain more information about cross-border transfers of personal information and oversea recipients through the contact methods referred to in this Policy.
V. How do we store your personal information?
We will retain your personal information for the minimum period necessary to achieve the purposes described in this Policy ,unless a longer retention period is required or permitted by applicable PRC laws and regulations. Upon expiration of the applicable retention period, we will promptly delete or anonymize your personal information in accordance with applicable PRC laws and regulations. Our criteria for determining the period for which personal information shall be retained include:
• Applicable laws, regulations and other relevant requirements;
• The period of time needed for us to provide services, maintain business relations or interact with you; and
• The period of time needed for us to perform relevant agreements or fulfil the purposes described in this Policy.
VI. What security measures do we take to protect your personal information?
In accordance with applicable PRC laws, regulations, and the requirements of relevant national standards, we take reasonable and appropriate security and precautionary measures to protect the personal information we process against unauthorized access, public disclosure, use, modification, destruction or loss of data. However, you are also responsible for taking appropriate measures to protect the security of the devices, systems, and networks you use when accessing our website or communicating with us.
VII. Your rights
In accordance with the requirements of the applicable PRC laws and regulations, you may have the following rights in respect of your personal information:
• To know about and make decisions regarding the processing of your personal information;
• To access or copy your personal information;
• To correct or supplement your personal information;
• To delete your personal information;
• To request for explanation of rules regarding processing of personal information; and
• To change the scope of your consent or revoke your consent , where processing is based on your consent.
If you wish to exercise your rights with respect to personal information, you may contact us through the contact information listed in this Policy and we will respond to any request in accordance with applicable relevant laws and regulations. When you exercise the above rights, we may verify your identity to safeguard the security of your personal information. Subject to applicable PRC laws and regulations, there may be circumstances where we are unable to respond to all or part of your request.
VIII. How do we process the personal information of minors?
For the purposes of this Policy and in accordance with applicable PRC laws and regulations, our products, websites and services are not targeted at minors under the age of 14. Minors under the age of 14 should not provide personal information to us without the consent of a parent or legal guardian.
If a minor's personal information is collected with the consent of a parent or legal guardian, we will process the information only when permitted by law, with the express consent of the parent or legal guardian, or necessary for the protection of the minor. If we discover that we have collected personal information without obtaining verifiable prior consent of a parent or legal guardian, we will seek to delete the data as soon as possible.
IX. Updates of the Policy
We may revise our Privacy Policy from time to time. We will post the updated version on our website and update the “Last Updated” date above or below this Policy.
Last updated: March 30, 2026.
X. How to contact us?
If you have any questions, comments or suggestions concerning this Policy, or any questions or concerns about our processing of your personal information, you may contact us in the following ways:
Address: 11/F, B8 Building, No.188 Yizhou Rd, Xuhui District, Shanghai
Tel.: 021- 33395800
Postal Code: 200233
Email: [email protected]
Cookies Policy
When you visit our website, we may place small data files known as “cookies” on your device. Cookies enable our website to recognize your browser and help us understand how visitors use the site.
Cookies and similar technologies used on this website may collect online identifiers, device information, browser information, IP address, and information about how you interact with the website. In certain circumstances, such information may constitute personal information or may be associated with you under applicable PRC laws and regulations. Information collected through cookies is used for purposes such as ensuring website operation, maintaining security, analyzing traffic and performance, remembering user preferences, and improving website content and user experience.
You may choose to accept or decline cookies by adjusting your browser settings or through any cookie banner or preference center made available on our website, if applicable. Please note that disabling cookies may affect the functionality of certain parts of the website.
2026-09-29
美国放射肿瘤学会(American Society for Radiation Oncology,ASTRO)年会于当地时间2026年9月26日至30日在美国波士顿举办。在本次大会上,复宏汉霖自主研发的创新型抗PD-1单抗H药 汉斯状®两项消化道肿瘤领域研究以壁报形式发布结果。两项研究分别是由复旦大学附属肿瘤医院蔡三军教授和章真教授共同发起的斯鲁利单抗联合放化疗用于新辅助治疗pMMR型高风险的局部晚期结肠癌(LACC)研究(TORCH-C),探索了创新的新辅助治疗模式;以及由上海市胸科医院傅小龙教授和余雯教授共同发起的斯鲁利单抗联合放化疗用于不可切除局晚期食管鳞癌(ESCC)的研究,为消化道肿瘤领域增添了免疫联合分层放化疗的治疗选择,进一步展现了H药在该领域的临床价值和治疗潜力。
H药是全球首个且目前唯一*获批胃癌围手术期适应症的抗PD-1单抗,也是全球首个一线治疗小细胞肺癌的抗PD-1单抗**。截至目前,H药已在全球范围内***获批鳞状非小细胞肺癌(sqNSCLC)、广泛期小细胞肺癌(ES-SCLC)、食管鳞癌(ESCC)和非鳞状非小细胞肺癌(nsqNSCLC)的一线治疗以及胃癌围术期治疗。在消化道肿瘤领域,除已获批的一线治疗晚期ESCC和胃癌围术期适应症,H药联合贝伐珠单抗联合化疗用于一线治疗转移性结直肠癌(mCRC)患者的国际多中心III期临床研究(ASTRUM-015)也于全球多个国家同步推进中,目前已完成全部临床入组,有望填补免疫治疗在MSS mCRC领域的治疗空白。
在本次ASTRO大会上发布的TORCH-C研究是一项随机II期临床试验,针对MSS/pMMR型高危局部晚期结肠癌,评估了新辅助短程放疗联合CAPOX方案及斯鲁利单抗的疗效和安全性。结果显示,免疫联合短程放疗+化疗组的pCR率达45.3%,较单纯化疗组(10%)提升超过4倍,为高危LACC患者提供了新的治疗选择。此前该研究数据已于2026年美国临床肿瘤学会(ASCO)年会上发布。
新辅助短程放疗联合免疫化疗对比单独化疗治疗pMMR型结肠癌:TORCH-C随机II期临床试验
试验设计:
TORCH-C是一项前瞻性、多中心、随机II期研究,患者入组时间为2023年4月3日至2025年9月9日。高风险LACC(T4/大体积N+M0,pMMR/MSS)120例患者按1:1随机分配到短程放疗(SCRT)联合免疫治疗和CAPOX化疗组(A组)或单独化疗组(B组)。B组患者接受4个周期的CAPOX(奥沙利铂130 mg/m2,第1天静脉注射,卡培他滨1000 mg/m2口服,第1-14天)。A组患者接受SCRT(25Gy/5Fx)和4个周期的PD-1抑制剂(斯鲁利单抗,300mg静脉注射,第1天)联合CAPOX。放疗靶区仅包括原发结肠肿瘤和肿大淋巴结,没有选择性淋巴结照射。放疗在CT直线加速器上进行,基于每日诊断级 CT 影像引导行在线自适应放疗(ART)。在新辅助治疗后,患者将进行根治性结肠切除术评估。所有患者均接受4个周期的CAPOX辅助化疗。主要终点为病理完全缓解(pCR)率。次要结果包括肿瘤降期、R0切除、3年无病生存期(DFS)、3年总生存期(OS)、3年局部无复发生存期和治疗相关毒性。
结果**:**
120名患者被纳入并随机分组。107例患者纳入mITT分析(A组54例,B组53例)。103例患者接受手术治疗(化疗组50例,放疗组53例)。化疗组(B组)的pCR率为10%(5/50),放疗组(A组)的pCR率为45.3% (24/53)(P<0.05)。患者中最常见的3-4级不良事件(AE)为血小板减少症,A组为22.2% (12/54),B组为18.9%(10/53)。放疗安全进行,最常见的AE是1-2级腹泻和腹痛。
结论**:**
SCRT联合PD-1抑制剂联合化疗在MSS/pMMR型高危LACC患者中疗效良好,可显著提高pCR率。高分辨率CT影像引导下的ART可安全实施SCRT。
另一项入选研究则针对不可切除局部晚期ESCC,评估了斯鲁利单抗联合放化疗治疗的疗效与安全性。该研究是一项单臂、多中心的Ⅰ/Ⅱ期临床试验,根据诱导治疗反应制定放疗策略。结果显示,截至2025年12月,诱导治疗后主要病理缓解(MPR)率达49%;经免疫联合同步放化疗治疗后,客观缓解率(ORR)达85%,疾病控制率(DCR)达到97%,整体治疗安全性可控,为局部晚期食管鳞癌开辟了免疫联合分层放化疗的全新治疗思路。
斯鲁利单抗联合放化疗治疗不可切除局部晚期食管鳞癌:一项单臂、多中心Ⅰ/Ⅱ期临床试验(SCR-ESCC-02)
试验设计:
本研究为一项针对不可切除局部晚期食管鳞癌(ESCC)患者的单臂Ⅰ/Ⅱ期临床试验,研究包含安全性预试验阶段(Ⅰ期,15例),之后采用 Simon 两阶段设计进行扩展研究(Ⅱ期,35例)。所有患者先接受2周期诱导治疗,方案为斯鲁利单抗(4.5 mg/kg,第1天给药,每3周1次)联合白蛋白结合型紫杉醇(125 mg/m²,第1、8天给药,每3周1次)+ 卡铂(曲线下面积AUC=5,第1天给药,每3周1次)。诱导治疗结束3周后,基于 CT 影像学及穿刺活检构建的预测模型,将患者按是否达到主要病理缓解(MPR)进行分层:达到MPR患者接受减量放疗(PTV-C 45 Gy /25次分割;PTV-G 50 Gy /25次分割);未达到MPR患者接受标准剂量放疗(PTV-C 50 Gy /25次分割)。放疗同步阶段,所有患者联合用药:斯鲁利单抗(4.5 mg/kg,每3周1次)、每周白蛋白紫杉醇(80 mg/m²,每周1次)、卡铂(AUC=2,每周1次),同步治疗最长持续5周;放疗结束后斯鲁利单抗维持治疗,直至疾病进展、出现不可耐受毒性或满1年治疗期限。本研究主要终点为无进展生存期(PFS),次要终点为总生存期(OS)及安全性。
结果**:**
截至2025年12月,本研究共入组39例患者,中位年龄68岁(四分位距:6070岁)。患者以男性为主(36/39,92%),大部分患者肿瘤分期为T34期(33/39,85%)、N01期(26/39,67%)。所有患者均完成诱导治疗,完成诱导治疗的患者主要病理缓解率为49%(19/39)。诱导治疗期间,总体不良反应发生率为62%(24/39),最常见的34级不良反应为中性粒细胞减少(18%,7/39)。39例患者在诱导治疗后,均接受同步免疫放化疗(ICRT)。基于实体瘤疗效评价标准1.1版(RECIST1.1)评估,完全缓解16例、部分缓解17例,客观缓解率为85%,疾病控制率为97%。免疫联合同步放化疗治疗期间,所有患者均发生不良反应,总体不良反应发生率为100%(39/39)。本研究未发生致死性不良反应。目前研究仍在持续开展,更长时间的随访将为本方案疗效与安全性提供更可靠的循证依据。
结论**:**
该联合疗法不良反应可控,有望为局晚期ESCC提供全新治疗方案。
临床前研究表明,斯鲁利单抗对PD-1受体具有较高亲和力,并以差异化的结合构象实现空间占位阻断。区别于同类PD-1抑制剂,斯鲁利单抗能够诱导强效的PD-1受体内吞作用,降低T细胞表面PD-1表达水平,从而更彻底地解除免疫抑制信号1。在阻断模式上,斯鲁利单抗不仅阻断反式PD-1/PD-L1结合,还能够干预PD-1与CD28的顺式相互作用,双重机制共同减少PD-1对共刺激分子CD28的募集,从而更大程度保留CD28信号通路活性,增强下游AKT蛋白活性2,促进T细胞持续活化。
基于这一差异化机制与扎实的临床医学证据,H药的国际化征途正持续破局,全球商业化版图加速扩容。目前,该产品已在中国、英国、欧盟、新加坡、印度、瑞士、秘鲁等50多个国家和地区获批上市,覆盖全球近半数人口。复宏汉霖携手Accord、Abbott、Eisai等全球合作伙伴,持续推进H药的海外商业化进程。自2025年2月首次在欧盟获批以来,H药已在16个欧盟国家上市,并在奥地利、丹麦、德国、爱尔兰、意大利、西班牙、瑞典等10余个国家纳入医保或公共支付体系,进入当地主流医疗保障体系,全球可及性不断提升。
*2026年6月,斯鲁利单抗获得NMPA批准成为全球首个获批胃癌围术期治疗的抗PD-1单抗,截至2026年9月是唯一。
**2023年1月,斯鲁利单抗获得NMPA批准成为全球首个获批一线治疗ES-SCLC的抗PD-1单抗。
***不同国家或地区的获批适应症请以当地药品监管部门发布的公告为准。
参考文献
1. Issafras H, et al. Structural basis of HLX10 PD-1 receptor recognition, a promising anti-PD-1 antibody clinical candidate for cancer immunotherapy. PLoS One. 2021;16(12):e0257972.
2. Shan Y, Zhang Y, Wei R, et al. Insights into the mechanisms of serplulimab: a distinctive anti-PD-1 monoclonal antibody, in combination with a TIGIT or LAG3 inhibitor in preclinical tumor immunotherapy studies. mAbs. 2024;16(1):2419838.
Copyright © 2019 All rights reserved 上海复宏汉霖生物技术股份有限公司
沪ICP备13029242号-1
沪公网安备 31010402002777号
互联网药品信息服务资格证书编号:(沪)-非经营性-2024-0127
2026-09-28
2026年欧洲肿瘤内科学会年会(ESMO 2026)将于10月23日至27日在西班牙马德里举行。本届大会期间,复宏汉霖将公布12项研究数据,覆盖抗PD-1单抗H药 汉斯状®、PD-L1 ADC HLX43及创新小分子CDK4/6抑制剂复妥宁®等核心肿瘤管线产品,聚焦肺癌、消化道肿瘤及乳腺癌等高发癌种的最新进展与概念验证成果。其中,复宏汉霖自主研发的H药 汉斯状®(斯鲁利单抗,欧洲商品名:Hetronifly®)在美国开展的桥接试验HLX10-005-SCLC301E(ASTRIDE研究)数据将以Proffered Paper口头报告形式首次读出,该研究是H药在美国本地人群中的临床表现与安全性特征的一次关键验证,由加州大学戴维斯分校综合癌症中心David Gandara教授牵头开展。
头对头SoC,H药首次公布美国患者数据
ASTRIDE研究旨在头对头比较斯鲁利单抗联合化疗与阿替利珠单抗联合化疗在美国ES-SCLC患者中的疗效与安全性,是*唯一在美国开展桥接临床试验的抗PD-1单抗。该研究由复宏汉霖美国临床及注册团队自主管理、独立执行,在超过100家美国肿瘤中心开展,并于2025年10月宣布完成全部200例受试者入组。
H药是全球首个获批用于小细胞肺癌一线治疗的抗PD-1单抗。此前,全球多中心III期ASTRUM-005研究已为其治疗ES-SCLC提供关键临床证据。ASTRIDE进一步聚焦美国本地患者,并以美国ES-SCLC一线标准疗法作为对照。此次研究数据的首次发布,不仅为评估H药在美国患者中的临床表现提供关键的循证证据,也充分体现了复宏汉霖在海外成熟监管市场独立管理和执行高质量、大规模多中心临床研究的运营能力。
截至目前,H药已获批一线治疗鳞状非小细胞肺癌(sqNSCLC)、广泛期小细胞肺癌(ES-SCLC)、食管鳞癌(ESCC)和非鳞状非小细胞肺癌(nsqNSCLC)以及胃癌围术期治疗,也是全球首个且唯一**获批用于胃癌围术期适应症的抗PD-1单抗,并持续在局限期小细胞肺癌、结直肠癌等多个癌种中探索抗肿瘤潜力。基于持续拓展的循证基础,公司正在日本及更多国际市场同步推进H药的开发与注册计划。H药已在全球50多个国家和地区获批上市,并在英国、德国、意大利、西班牙等10多个国家纳入医保或公共支付体系,逐步进入当地临床应用。

创新管线更多看点:持续拓展实体瘤管线价值
除H药外,本届ESMO大会上,PD-L1 ADC HLX43在胃癌中的II期概念验证(PoC)研究HLX43-GC201也将迎来首次数据披露——这是HLX43在消化道肿瘤领域的第二次关键数据释放,标志着其在该领域适应症版图的持续拓宽。
HLX43是一款靶向程序性死亡-配体1(PD-L1)的新型ADC候选药物,由全人源IgG1抗PD-L1抗体与创新连接子-拓扑异构酶抑制剂荷载偶联而成,药物抗体比(DAR)约为8,兼具毒素精准杀伤与肿瘤免疫作用的复合功能。其首次人体研究结果及多项实体瘤概念验证数据先后亮相ASCO、WCLC等国际学术大会,尤其在非小细胞肺癌(NSCLC)人群中不依赖生物标志物筛选,有望覆盖所有亚型患者;在妇科肿瘤、食管鳞癌等多个实体瘤中亦展现出积极疗效信号。单药之外,公司也在探索HLX43与抗EGFR单抗pimurutamab、H药等药物的联合治疗潜力。
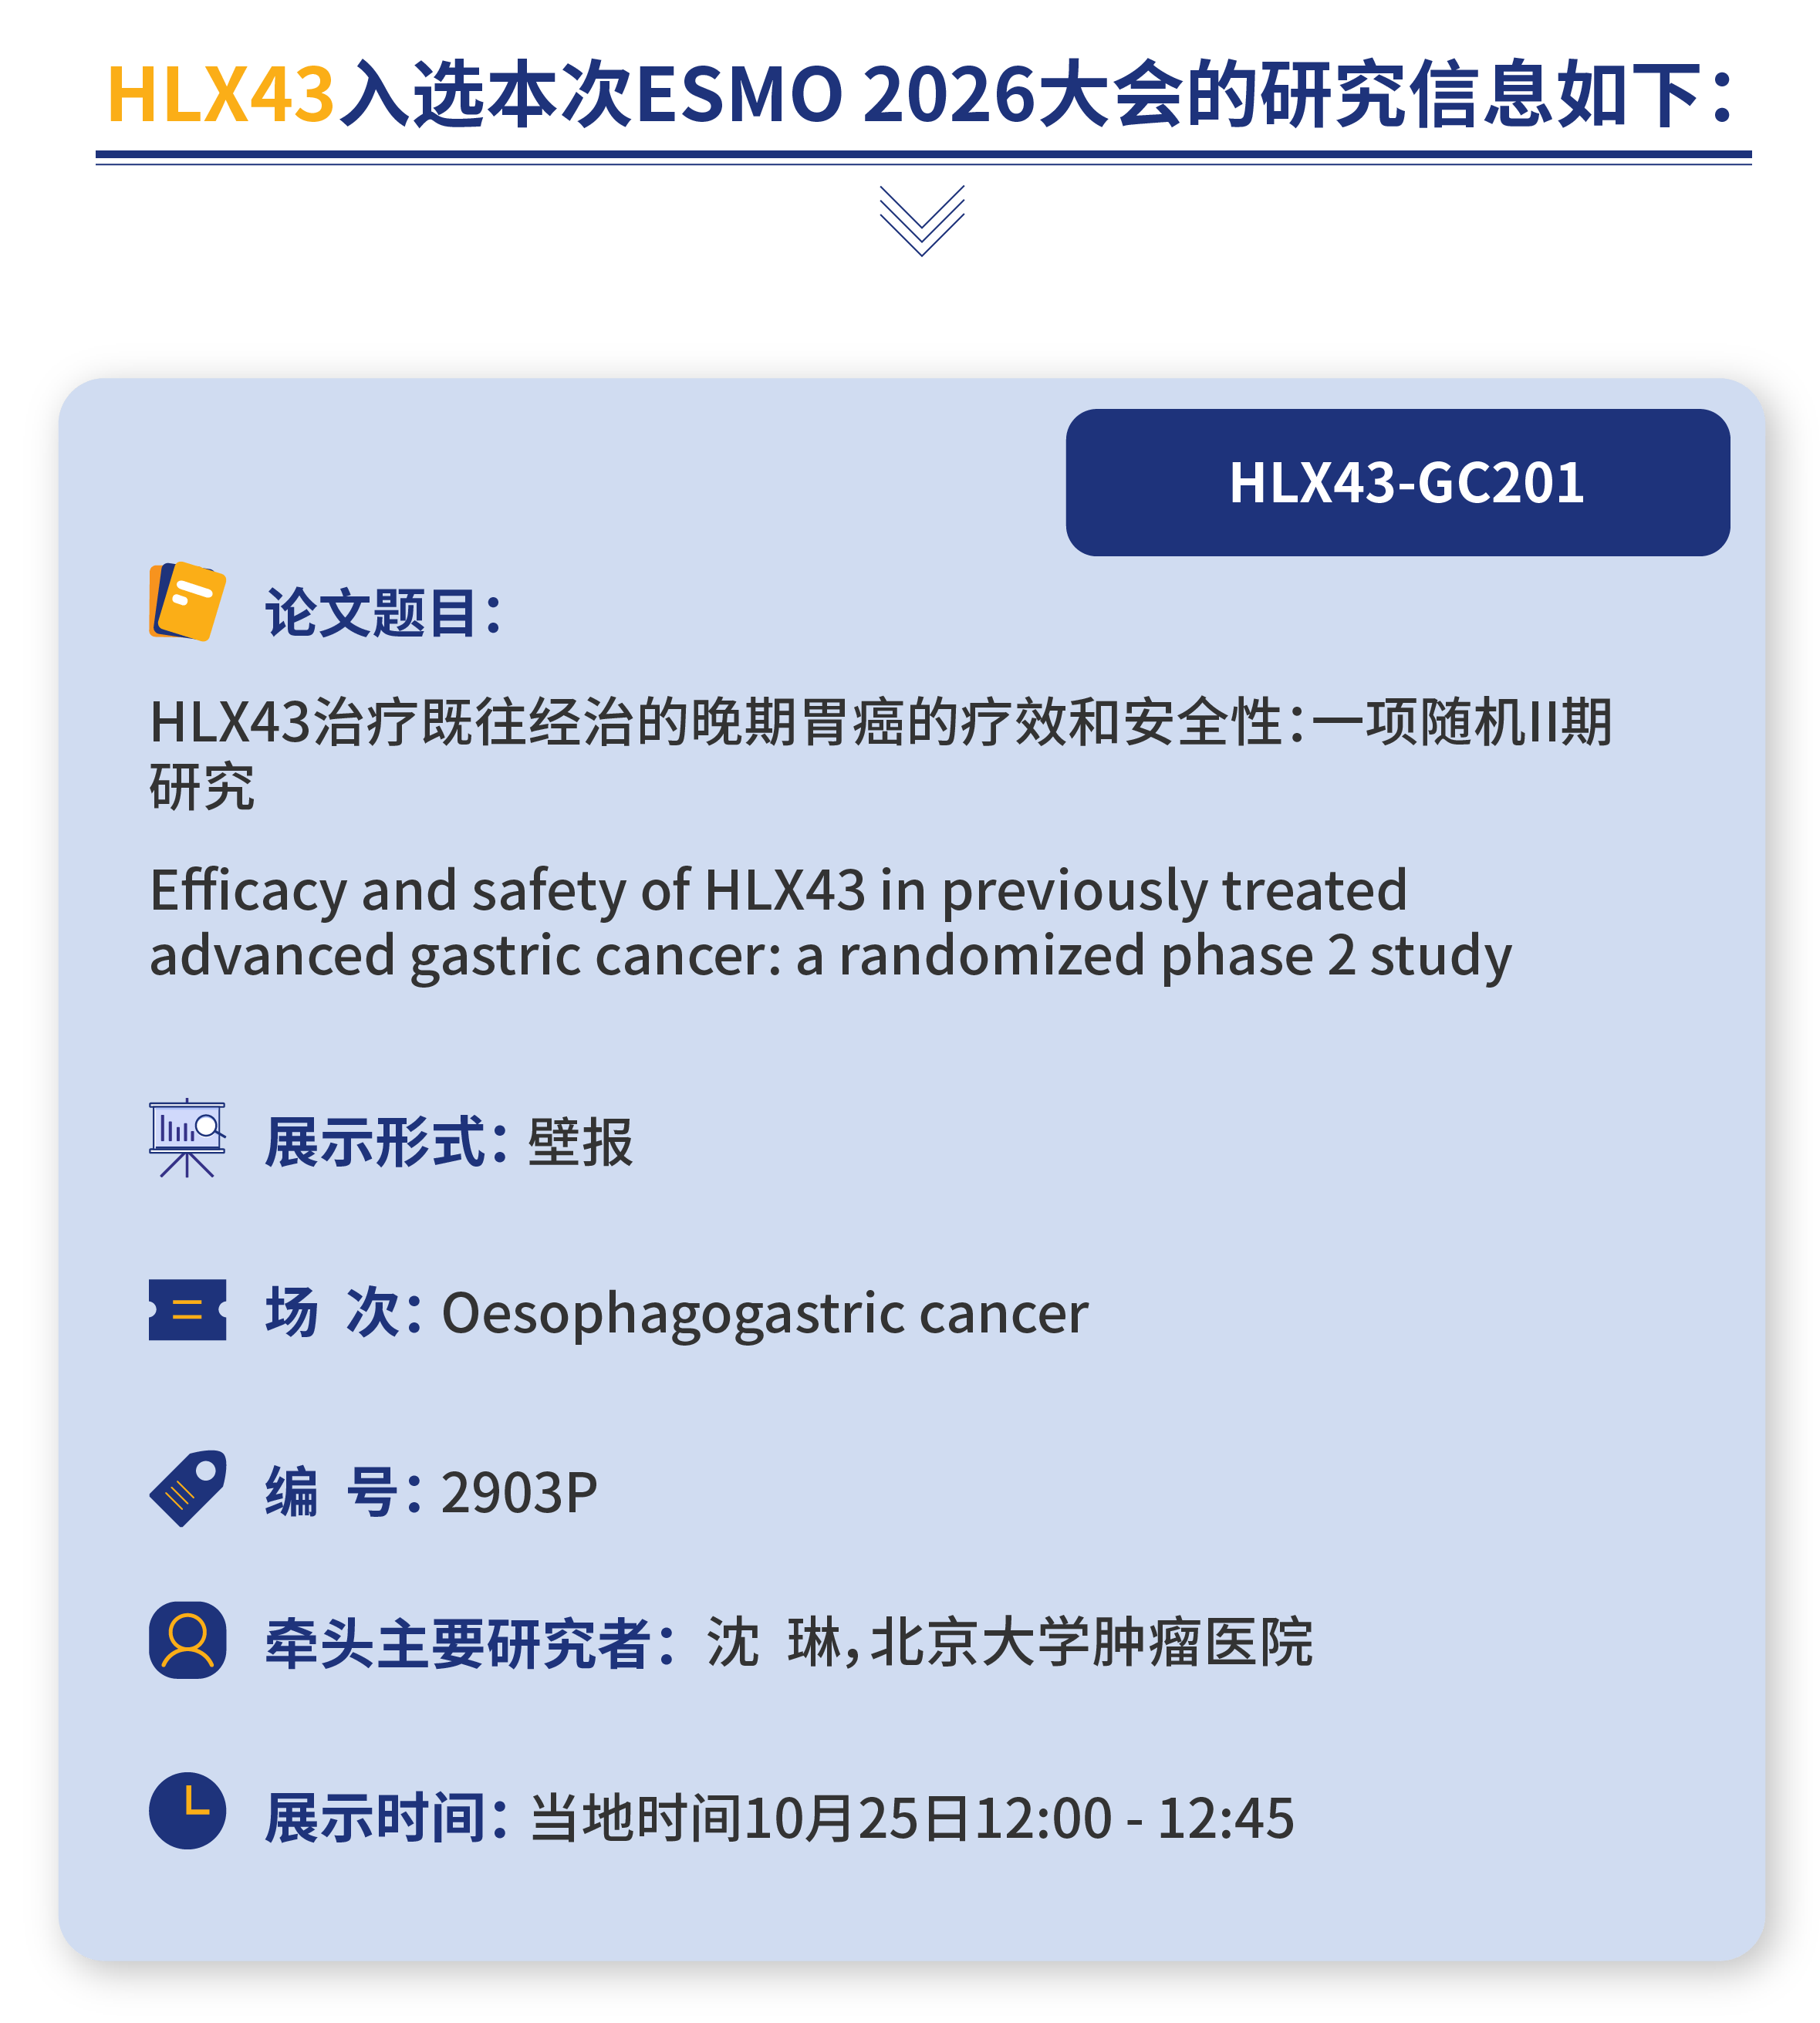
复妥宁®(枸橼酸伏维西利胶囊)是一种口服、强效、高选择性、全新结构的创新小分子CDK4/6抑制剂,复宏汉霖拥有其在中国的商业化独占许可和权利。该产品于2025年首次进入国家医保目录;其适应症全面覆盖HR+/HER2-局部晚期或转移性乳腺癌的一线及二线治疗。2026年ASCO大会上,复妥宁®两项关键性III期临床研究数据首次以壁报形式公布。
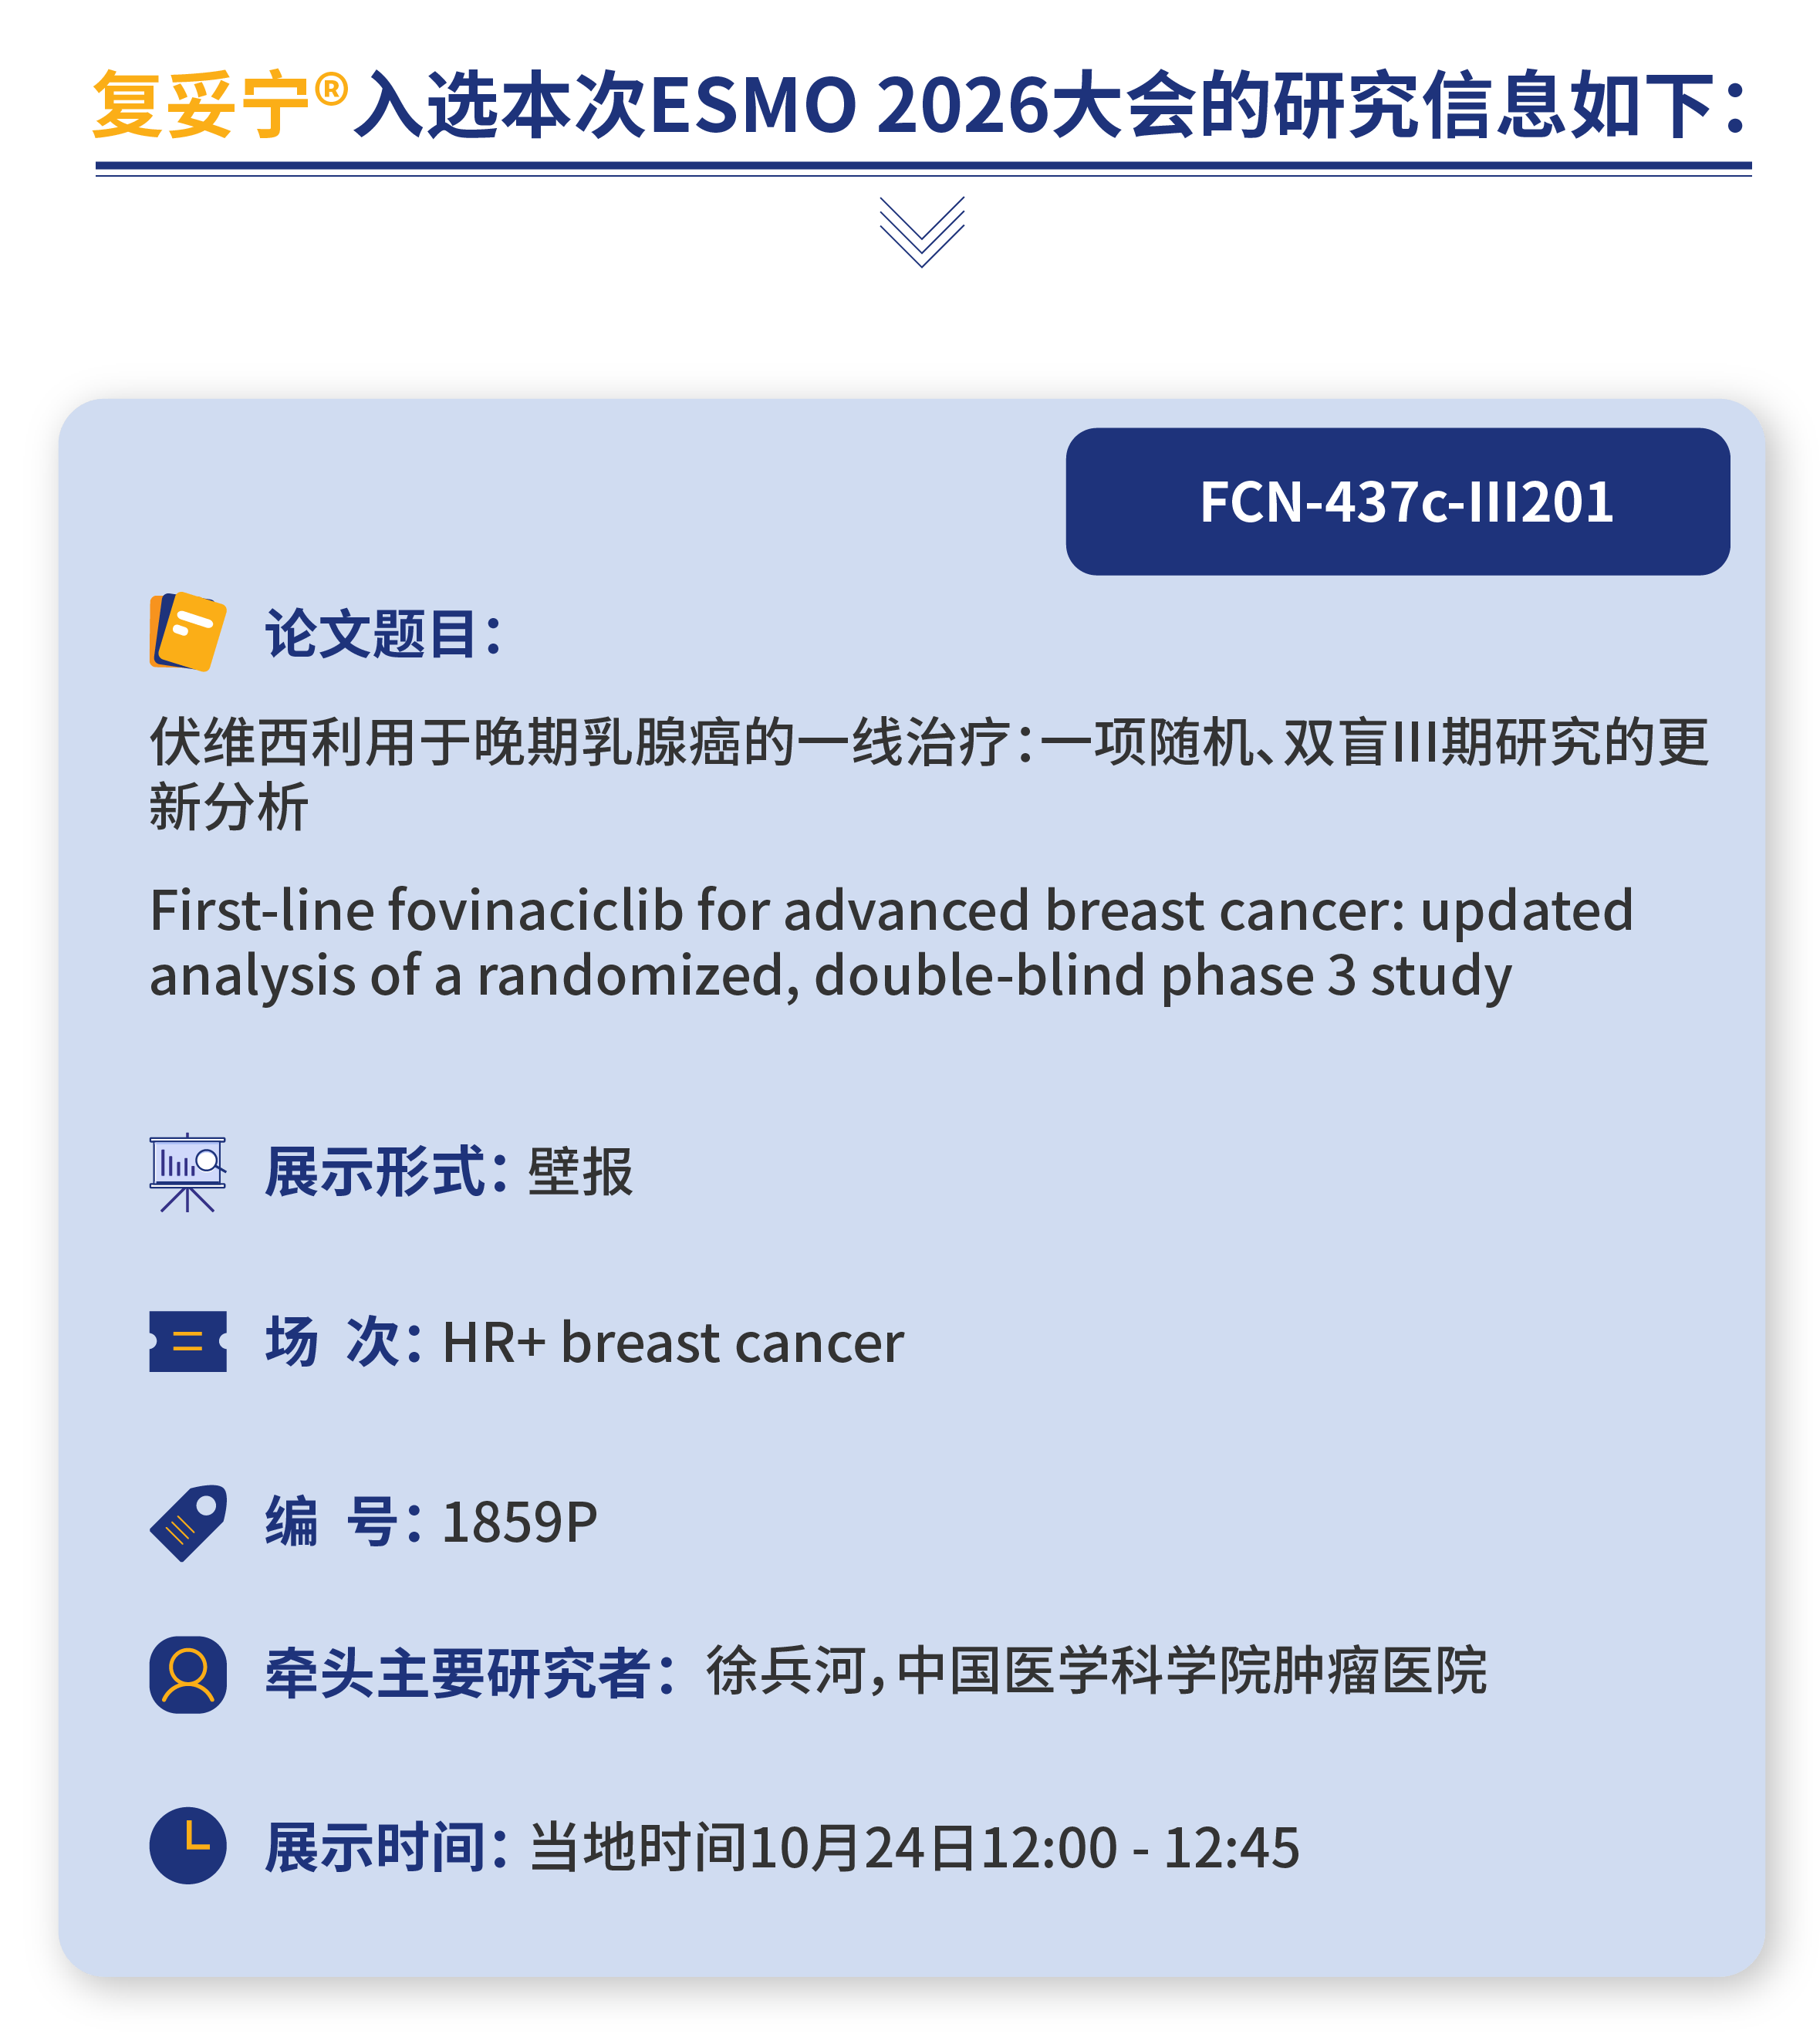
* 截至2026年9月。
** 2026年6月,斯鲁利单抗获得NMPA批准成为全球首个获批胃癌围术期治疗的抗PD-1单抗,截至2026年9月是唯一。
Copyright © 2019 All rights reserved 上海复宏汉霖生物技术股份有限公司
沪ICP备13029242号-1
沪公网安备 31010402002777号
互联网药品信息服务资格证书编号:(沪)-非经营性-2024-0127
领英
微信
Prompts
Click prompts to add them under the company line, click again to take one out, then copy the result into your AI chat. Shared by Asian Century Stocks and Uncovered Thai Stocks. Thank you.
ETFs Holding Shanghai Henlius Biotech, Inc.
Exchange-traded funds whose newest published daily portfolio holds one of the company's listings, largest weight first.