VOLUNTARY ANNOUNCEMENT
Bull 4
Bear 0
Results
|
China Hongqiao Group Limited is a vertically integrated aluminum producer covering the full value chain from bauxite mining and alumina refining to primary aluminum smelting and deep processing. The company manufactures liquid aluminum, aluminum ingots, cast-rolled products, aluminum busbars, and high-precision aluminum sheets, strips, and foils, including can bodies, can lids, and CTP/PS board substrates. It operates alumina production facilities in Indonesia and mines bauxite in Guinea. Key subsidiaries include Shandong Hongqiao New Materials, Shandong Weiqiao Aluminum Electric, Shandong Hongtuo Industrial, Yunnan Hongqiao New Energy, Shandong Hongchuang Aluminum, and Indonesia Hongfa Weili Alumina. The group was founded in 1994 and listed on the Hong Kong Stock Exchange in 2011. Summarised from the company's own disclosures, fiscal year ended Oct 2026 |
Industry Aluminum | Homepage hongqiaochina.com |
| Sector Basic Materials | IR page — | |
|
Tags
bauxite mining, alumina refining, aluminum smelting, aluminum foil, aluminum ingots, aluminum busbars, can bodies, can lids, ctp/ps board substrates, thermoelectric power, Shandong Hongqiao New Materials, Shandong Weiqiao Aluminum Electric, Shandong Hongtuo Industrial, Yunnan Hongqiao New Energy, Shandong Hongchuang Aluminum, Indonesia Hongfa Weili Alumina
|
Press page — |
Metrics
| Valuation | |
|---|---|
| Market cap | HK$ 170.43B |
| Market cap (USD) | $ 21.72B |
| P/E | 6.56 |
| PEG | 0.17 |
| P/BV | 1.02 |
| P/S | 0.86 |
| P/OCF | 4.26 |
| P/FCF | — |
| Dividend yield | 9.4% |
| Turnover / mcap | 0.41% |
| Returns | |
|---|---|
| ROE | 17.4% |
| ROI | 14.1% |
| ROIC | 14.1% |
| Profit margin | 13.9% |
| Growth | |
|---|---|
| Revenue growing | Yes |
| Profits growing | Yes |
| Revenue up 3y | Yes |
| Revenue up 5y | Yes |
| Earnings growth 3y (net profit CAGR) | 37.5% |
| Quality | |
|---|---|
| Profitable | Yes |
| Margin expanding | No |
| Buying back stock | No |
| Diluting (TTM) | Yes |
| Debt/Equity | 10.0% |
| Podcast bulls (TTM) | Sign up |
| Podcast bears (TTM) | Sign up |
| Podcast sentiment (TTM) | Sign up |
| Podcast sentiment % (TTM) | Sign up |
| News sentiment (TTM) | 0 |
| Quality score | 52.9% |
| Insiders | |
|---|---|
| Buys, 1w | Sign up |
| Buys, 1m | Sign up |
| Buys, 1y | Sign up |
| Sells, 1w | Sign up |
| Sells, 1m | Sign up |
| Sells, 1y | Sign up |
Sign up to see this company's insider trades
| Figure | FY 2025 | FY 2024 | FY 2023 | FY 2022 | FY 2021 | FY 2020 | FY 2019 | FY 2018 | FY 2017 | FY 2016 | FY 2015 | FY 2014 | FY 2013 | FY 2012 | FY 2011 | FY 2010 |
|---|---|---|---|---|---|---|---|---|---|---|---|---|---|---|---|---|
| Revenue | 162.354B | 156.169B | 133.624B | 131.699B | 114.491B | 86.145B | 84.179B | 90.195B | 93.313B | 61.396B | 44.11B | 36.086B | 29.404B | 24.805B | 23.626B | 15.132B |
| Net profit | 22.636B | 22.372B | 11.461B | 8.702B | 16.073B | 10.496B | 6.095B | 5.407B | 5.119B | 6.85B | 3.649B | 5.314B | 5.593B | 5.453B | 5.875B | 4.196B |
Sign up to see institutional holdings
Sign UpPodcast Mentions
Sign up to see podcast mentions and sentiment
Sign UpAnnouncements and reports published on HKEXnews, newest first, monthly and next-day returns, proxy forms and board-meeting notices included. The link opens the announcement on HKEXnews. Press releases from the company's own website, newest first.


 2026-08-13
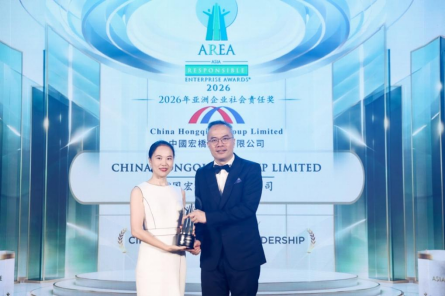



 2026-07-24
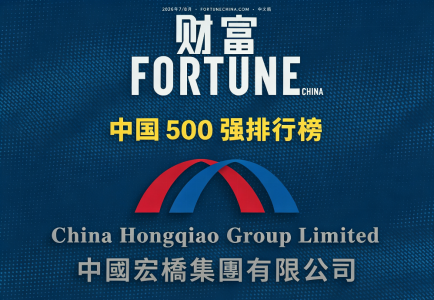
Prompts
Click prompts to add them under the company line, click again to take one out, then copy the result into your AI chat. Shared by Asian Century Stocks and Uncovered Thai Stocks. Thank you.
China Hongqiao Group Limited (ticker 1378), listed in Hong Kong.
Copied
ETFs Holding China Hongqiao Group Limited
Exchange-traded funds whose newest published daily portfolio holds one of the company's listings, largest weight first.
| ETF | Weight in ETF | Shares | Market value | As of |
|---|---|---|---|---|
| VEM | 1.27% | 27,500 | $ 86.051K | Jul 31, 2026 |
| NBCE | 0.56% | 35,500 | $ 103.351K | Aug 31, 2026 |
| CCNR | 0.37% | 508,163 | $ 1.59M | Jul 31, 2026 |
| AVES | 0.36% | 2,171,500 | $ 5.233M | Nov 16, 2026 |
| DEHP | 0.35% | 565,500 | $ 1.436M | Nov 12, 2026 |
| TDI | 0.28% | 394,000 | $ 1.008M | Jun 30, 2026 |
| AVEM | 0.18% | 19,952,500 | $ 48.087M | Nov 16, 2026 |
| MEMA | 0.13% | 5,500 | $ 16.01K | Aug 31, 2026 |
| DFEM | 0.10% | 3,612,000 | $ 9.172M | Nov 12, 2026 |
| DFEV | 0.09% | 770,000 | $ 1.955M | Nov 12, 2026 |
| SEEM | 0.08% | 198,595 | $ 508.007K | Jun 30, 2026 |
| DFAE | 0.08% | 2,976,193 | $ 7.557M | Nov 12, 2026 |
| DFAX | 0.05% | 2,405,500 | $ 6.108M | Nov 12, 2026 |
| REMG | 0.03% | 14,000 | $ 35.808K | Jun 30, 2026 |