Nomination Committee Terms of Reference
Bull 0
Bear 0
Routine
|
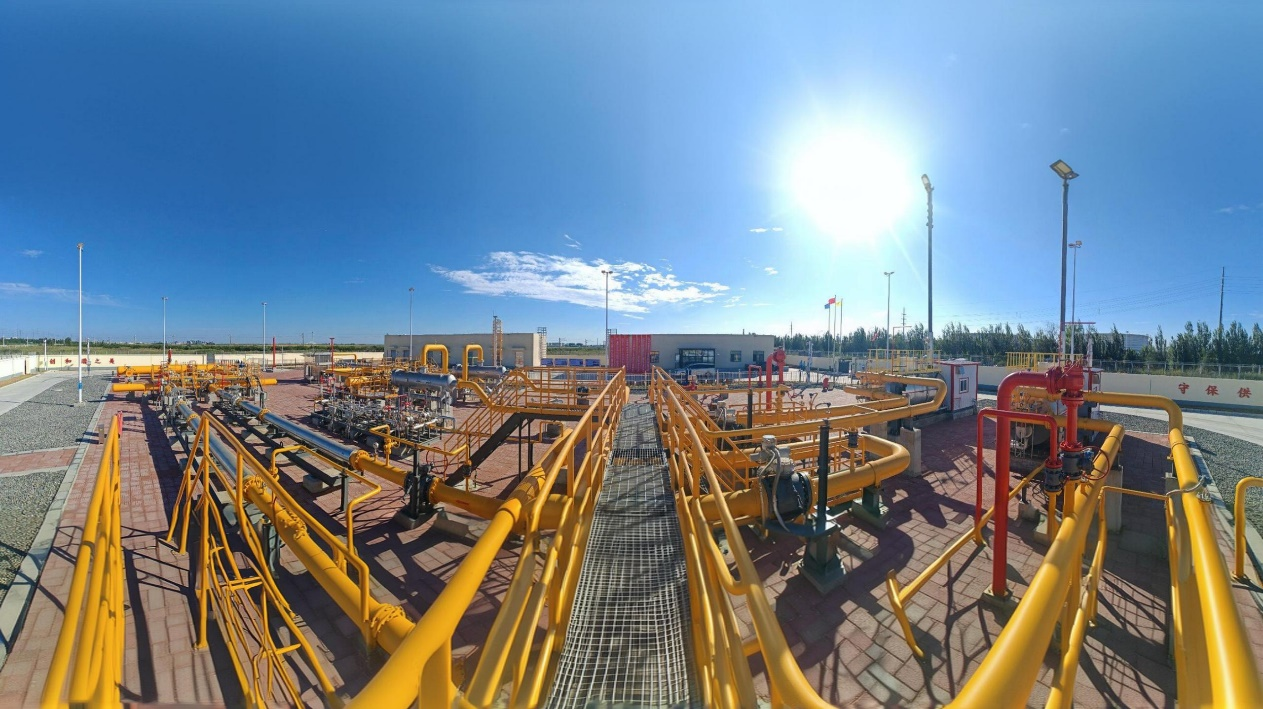
Kunlun Energy Company Limited is a Chinese energy company operating in the natural gas, liquefied natural gas (LNG), and liquefied petroleum gas (LPG) sectors. The company’s core businesses include the full LNG value chain, covering production, processing, receiving, storage, transportation, and vehicle and ship refueling, as well as LPG distribution and sales. It also operates urban gas distribution networks, investing in, constructing, and operating pipelines and gas supply services. In 2023, the company established a dedicated division for gas power and new energy businesses, focusing on gas-fired power generation, renewable energy, and integrated energy solutions. Kunlun Energy serves customers across 31 provinces, autonomous regions, and municipalities in China. The company was established in the early 1990s as a red-chip listed entity to support overseas oil and gas exploration and development, later transitioning its focus to terminal natural gas utilization and green energy supply. Summarised from the company's own disclosures, fiscal year ended Apr 2026 |
Industry Oil & Gas Midstream | Homepage kunlun.com.hk |
| Sector Energy | IR page — | |
|
Tags
natural gas distribution, lng supply chain, lpg distribution, urban gas networks, gas power generation, renewable energy, vehicle refueling, ship refueling, energy storage, integrated energy services, LNG, LPG, Gas Power and New Energy Division
|
Press page — |
Metrics
| Valuation | |
|---|---|
| Market cap | HK$ 67.14B |
| Market cap (USD) | $ 8.556B |
| P/E | 11.21 |
| PEG | 11.69 |
| P/BV | — |
| P/S | 0.29 |
| P/OCF | 4.00 |
| P/FCF | — |
| Dividend yield | 5.0% |
| Turnover / mcap | 0.12% |
| Returns | |
|---|---|
| ROE | 5.9% |
| ROI | 4.7% |
| ROIC | 4.7% |
| Profit margin | 2.8% |
| Growth | |
|---|---|
| Revenue growing | Yes |
| Profits growing | No |
| Revenue up 3y | Yes |
| Revenue up 5y | Yes |
| Earnings growth 3y (net profit CAGR) | 0.96% |
| Quality | |
|---|---|
| Profitable | Yes |
| Margin expanding | No |
| Buying back stock | No |
| Diluting (TTM) | No |
| Debt/Equity | 22.1% |
| Podcast bulls (TTM) | Sign up |
| Podcast bears (TTM) | Sign up |
| Podcast sentiment (TTM) | Sign up |
| Podcast sentiment % (TTM) | Sign up |
| News sentiment (TTM) | 0 |
| Quality score | 18.8% |
| Insiders | |
|---|---|
| Buys, 1w | Sign up |
| Buys, 1m | Sign up |
| Buys, 1y | Sign up |
| Sells, 1w | Sign up |
| Sells, 1m | Sign up |
| Sells, 1y | Sign up |
Sign up to see this company's insider trades
| Figure | FY 2025 CNY | FY 2024 CNY | FY 2023 CNY | FY 2022 CNY | FY 2021 CNY | FY 2020 CNY | FY 2019 CNY | FY 2018 CNY | FY 2017 CNY | FY 2016 HKD | FY 2015 HKD | FY 2014 HKD | FY 2013 HKD | FY 2012 HKD | FY 2011 HKD | FY 2010 HKD | FY 2009 HKD |
|---|---|---|---|---|---|---|---|---|---|---|---|---|---|---|---|---|---|
| Revenue | 193.979B | 187.046B | 177.354B | 171.944B | 138.547B | 109.251B | 113.313B | 105.47B | 88.706B | 81.882B | 41.641B | 48.044B | 43.43B | 32.953B | 25.398B | 9.068B | 6.164B |
| Net profit | 5.351B | 5.933B | 5.675B | 5.2B | 7.878B | 5.794B | 5.779B | 4.654B | 4.601B | -1.621B | -2.153B | 4.307B | 7.842B | 7.017B | 6.798B | 2.662B | 735M |
| Figure | FY 2025 CNY | FY 2024 CNY | FY 2023 CNY | FY 2022 CNY | FY 2021 CNY | FY 2020 CNY | FY 2019 CNY | FY 2018 CNY | FY 2017 CNY | FY 2016 HKD | FY 2015 HKD | FY 2014 HKD | FY 2013 HKD | FY 2012 HKD | FY 2011 HKD | FY 2010 HKD | FY 2009 HKD |
|---|---|---|---|---|---|---|---|---|---|---|---|---|---|---|---|---|---|
| Share price | 7.45 | — | — | 6.19 | 5.9 | — | — | 5.79 | — | — | — | — | — | — | — | — | — |
| P/E 5y avg | — | — | — | 5.41 | — | — | — | — | — | — | — | — | — | — | — | — | — |
Sign up to see institutional holdings
Sign UpPodcast Mentions
Sign up to see podcast mentions and sentiment
Sign UpAnnouncements and reports published on HKEXnews, newest first, monthly and next-day returns, proxy forms and board-meeting notices included. The link opens the announcement on HKEXnews. Press releases from the company's own website, newest first.


Prompts
Click prompts to add them under the company line, click again to take one out, then copy the result into your AI chat. Shared by Asian Century Stocks and Uncovered Thai Stocks. Thank you.
Kunlun Energy Company Limited (ticker 135), listed in Hong Kong.
Copied
ETFs Holding Kunlun Energy Company Limited
Exchange-traded funds whose newest published daily portfolio holds one of the company's listings, largest weight first.
| ETF | Weight in ETF | Shares | Market value | As of |
|---|---|---|---|---|
| MEMA | 0.16% | 20,000 | $ 19.721K | Aug 31, 2026 |
| DFEV | 0.12% | 2,662,000 | $ 2.613M | Nov 12, 2026 |
| DFEM | 0.08% | 7,152,000 | $ 7.02M | Nov 12, 2026 |
| AVEM | 0.05% | 14,544,000 | $ 14.334M | Nov 16, 2026 |
| DFAE | 0.05% | 4,476,000 | $ 4.393M | Nov 12, 2026 |
| DFAX | 0.03% | 3,742,000 | $ 3.673M | Nov 12, 2026 |