ANNOUNCEMENT IN RELATION TO SHARE OPTIONS AND SHARE AWARDS
Bull 0
Bear 0
Routine
|
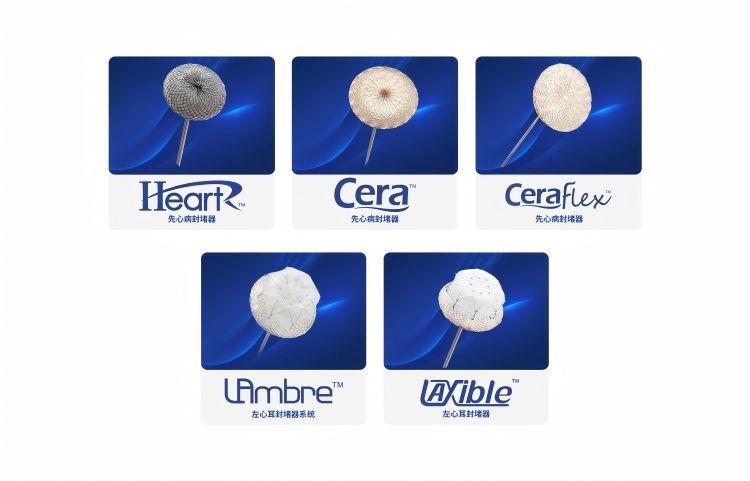
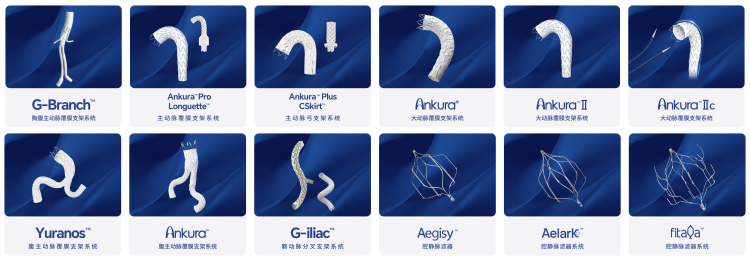
Lifetech Scientific Corporation is a developer, manufacturer, and marketer of advanced minimally invasive interventional medical devices for cardiovascular and peripheral vascular diseases. The company operates three main business segments: structural heart diseases, which includes congenital heart disease occluders and left atrial appendage occluders; peripheral vascular diseases, featuring vena cava filters and stent grafts; and cardiac pacing and electrophysiology, primarily involving pacemakers. The group serves a global market with distributors in Asia, Europe, North America, South America, and Africa, with mainland China remaining its largest revenue source. It maintains an academic exchange platform known as the Lifetech Knowledge Exchange Program, initiated in 2012, to connect cardiovascular experts worldwide. The company holds redeemable shares in Biotyx Medical, a subsidiary referenced in its financial performance discussions. Summarised from the company's own disclosures, fiscal year ended Apr 2025 |
Industry Medical Devices | Homepage lifetechmed.com |
| Sector Healthcare | IR page lifetechmed.com/investor | |
|
Tags
cardiovascular devices, peripheral vascular devices, structural heart, left atrial appendage occlusion, vena cava filters, stent grafts, pacemakers, electrophysiology, minimally invasive surgery, Biotyx Medical, Lifetech Knowledge Exchange Program
|
Press page — |
Metrics
| Valuation | |
|---|---|
| Market cap | HK$ 6.5B |
| Market cap (USD) | $ 828.37M |
| P/E | 37.07 |
| PEG | — |
| P/BV | 1.69 |
| P/S | 4.27 |
| P/OCF | 10.76 |
| P/FCF | — |
| Dividend yield | — |
| Turnover / mcap | 0.32% |
| Returns | |
|---|---|
| ROE | 4.3% |
| ROI | 4.3% |
| ROIC | 5.3% |
| Profit margin | 10.8% |
| Growth | |
|---|---|
| Revenue growing | Yes |
| Profits growing | No |
| Revenue up 3y | Yes |
| Revenue up 5y | Yes |
| Earnings growth 3y (net profit CAGR) | -23.1% |
| Quality | |
|---|---|
| Profitable | Yes |
| Margin expanding | No |
| Buying back stock | No |
| Diluting (TTM) | Yes |
| Debt/Equity | 0.15% |
| Podcast bulls (TTM) | Sign up |
| Podcast bears (TTM) | Sign up |
| Podcast sentiment (TTM) | Sign up |
| Podcast sentiment % (TTM) | Sign up |
| News sentiment (TTM) | 0 |
| Quality score | 0% |
| Insiders | |
|---|---|
| Buys, 1w | Sign up |
| Buys, 1m | Sign up |
| Buys, 1y | Sign up |
| Sells, 1w | Sign up |
| Sells, 1m | Sign up |
| Sells, 1y | Sign up |
Sign up to see this company's insider trades
| Figure | FY 2025 | FY 2024 | FY 2023 | FY 2022 | FY 2021 | FY 2020 | FY 2019 | FY 2018 | FY 2017 | FY 2016 | FY 2015 | FY 2014 | FY 2013 | FY 2012 |
|---|---|---|---|---|---|---|---|---|---|---|---|---|---|---|
| Revenue | 1.37B | 1.304B | 1.267B | 1.097B | 925.334M | 642.299M | 668.879M | 556.698M | 409.125M | 352.849M | 311.606M | 282.679M | 231.035M | 181.475M |
| Net profit | 147.827M | 222.388M | 263.242M | 325.337M | 292.472M | 216.085M | 129.2M | 121.082M | 163.472M | 145.652M | 2.359M | -81.244M | -65.666M | 32.352M |
Sign up to see institutional holdings
Sign UpPodcast Mentions
Sign up to see podcast mentions and sentiment
Sign UpAnnouncements and reports published on HKEXnews, newest first, monthly and next-day returns, proxy forms and board-meeting notices included. The link opens the announcement on HKEXnews. Press releases from the company's own website, newest first.


































Prompts
Click prompts to add them under the company line, click again to take one out, then copy the result into your AI chat. Shared by Asian Century Stocks and Uncovered Thai Stocks. Thank you.
Lifetech Scientific Corporation (ticker 1302), listed in Hong Kong.
Copied
ETFs Holding Lifetech Scientific Corporation
Exchange-traded funds whose newest published daily portfolio holds one of the company's listings, largest weight first.
| ETF | Weight in ETF | Shares | Market value | As of |
|---|---|---|---|---|
| AVEE | 0.09% | 640,000 | $ 116.526K | Nov 16, 2026 |
| AVES | 0.05% | 4,306,000 | $ 784.002K | Nov 16, 2026 |
| DFSE | 0.01% | 328,000 | $ 63.554K | Nov 12, 2026 |
| AVEM | 0.01% | 12,008,000 | $ 2.186M | Nov 16, 2026 |
| DFEM | 0.01% | 3,692,000 | $ 715.372K | Nov 12, 2026 |
| DFAE | 0.01% | 2,616,000 | $ 506.883K | Nov 12, 2026 |
| DFEV | 0.00% | 348,000 | $ 67.429K | Nov 12, 2026 |
| DFAX | 0.00% | 1,534,000 | $ 297.232K | Nov 12, 2026 |