The Group’s (unaudited) underlying profit attributable to equity shareholders for the six months ended 30 June 2026 amounted to HK$5,071 million, representing an increase of HK$2,023 million or 66% from HK$3,048 million for the same period last year.…
The Group’s (unaudited) underlying profit attributable to equity shareholders for the six months
ended 30 June 2026 amounted to HK$5,071 million, representing an increase of HK$2,023 million
or 66% from HK$3,048 million for the same period last year. The underlying earnings per share was
HK$1.05 (2025: HK$0.63). The increase in underlying profit was mainly attributable to a substantial
increase in profit contribution from local property sales during the period, together with the
attributable gain from the Government’s resumption of certain land lots in the New Territories.
During the first half of 2026, the Group recorded a fair value loss of HK$981 million (2025: HK$140
million) after revaluation of the Group’s completed investment properties and investment properties
under development. This included the adjustments of cumulative changes in the fair value of
disposed investment properties. After taking into account the fair value loss, the reported profit
attributable to equity shareholders for the six months ended 30 June 2026 was HK$4,090 million,
representing an increase of HK$1,182 million or 41% from HK$2,908 million for the same period last
year. The reported earnings per share was HK$0.84 (2025: HK$0.60).
The Board has declared an interim dividend of HK$0.5 per share (2025: HK$0.5 per share) to
shareholders whose names appear on the Register of Members of the Company on the record
date, being Tuesday, 8 September 2026, and such interim dividend will not be subject to any
withholding tax in Hong Kong.
1
CLOSURE OF REGISTER OF MEMBERS
The Register of Members of the Company will be closed on Monday, 7 September 2026 and
Tuesday, 8 September 2026, during which period no transfer of shares will be registered. In order
to qualify for the interim dividend, all transfer documents accompanied by the relevant share
certificates must be lodged for registration with the Company’s share registrar, Computershare
Hong Kong Investor Services Limited, at Rooms 1712-1716, 17th Floor, Hopewell Centre, 183
Queen’s Road East, Wanchai, Hong Kong no later than 4:30 p.m. on Friday, 4 September 2026.
The interim dividend will be distributed to shareholders on Thursday, 17 September 2026.
2
BUSINESS REVIEW
Hong Kong
Property Sales
Despite the outbreak of war in the Middle East in the first quarter of 2026, which added uncertainties
to the global economy, Hong Kong continued to attract a substantial number of enterprises for initial
public offerings and capital raising, reinforcing its status as an international financial centre. In
addition, under the policy initiatives of the HKSAR Government, the increase in incoming talents and
international students further boosted housing demand, thereby sustaining the positive momentum
in the local property market. However, the Central Government subsequently tightened capital
outflow controls, resulting in a slowdown in the real estate sector toward the end of the period.
During the first half of 2026, the Group’s attributable revenue from property development in Hong
Kong amounted to approximately HK$11,878 million, representing a substantial increase of 212%
compared with the same period last year. The Group’s attributable reported profit before taxation
from property development in Hong Kong amounted to approximately HK$3,300 million (2025:
HK$310 million), which included a pre-tax gain of approximately HK$1,568 million (2025: HK$240
million) from the Government’s resumption of certain land lots in the New Territories during the period.
During the first half of 2026, the Group successfully capitalised on favourable market conditions to
launch a number of urban projects for sales, including Chester and One Victoria Cove (Phases 1, 3
and 4) in Hung Hom, Highwood (Phase 2) in Ma Tau Kok and Victoria Voyage (Phase 2B) in Kai
Tak. Among these, over 90% of the residential units at Chester in Hung Hom had been sold by the
end of the reporting period. One Victoria Cove in Hung Hom was also well received, with all 468
residential units available in the first three rounds of sale fully sold on the first day of launch. Together
with the sales of previously launched projects, including The Legacy in Mid-Levels West, as well as
some other properties (including car parking spaces), the Group’s attributable contracted sales in
Hong Kong for the six months ended 30 June 2026 amounted to approximately HK$18,118 million,
representing a substantial increase of 188% compared with the same period last year.
At the end of June 2026, attributable contracted sales of approximately HK$17,061 million had yet
to be recognised as revenue in the accounts. Of this amount, approximately HK$6,365 million is
expected to be recognised in the second half of 2026 upon completion of the relevant developments
and handover of the completed units to buyers.
3
Property Development
As regards the Group’s urban redevelopment projects, a total gross floor area of approximately 0.3
million square feet attributable to the Group has been earmarked for sales launch in the second half
of 2026. In addition, urban redevelopment projects for which the Group has acquired 100%
ownership interest or which have met the relevant compulsory sale application threshold are
expected to provide an additional attributable gross floor area of approximately 1.5 million square
feet, to be launched for sale or lease in 2027 or beyond.
The Group will continue to replenish its land bank in Hong Kong through a variety of channels.
Excluding sites earmarked for rental purposes, the Group’s land bank will be sufficient to meet its
development needs in the next few years. Details of the Group’s projects are set out in the tables
below:
4
Below is a summary of projects pending/under development and major completed projects:
Saleable/gross
floor area
attributable to
the Group
(million sq. ft.)
(Note 1) Remarks
(A)
Projects available for sale in the second half of 2026
Unsold units of major development
projects offered for sale
(Table 1)
1.3
Projects to be launched for sale in
the second half of 2026
(Table 2)
0.6
Sub-total:
(B)
Projects in Urban Areas
Urban Redevelopment Projects
3.1 with 100% ownership interest
acquired or the relevant
compulsory sale application
threshold has been met
3.2 with more than 20% ownership
interest acquired, but the
relevant compulsory sale
application threshold has not
been met
1.9
(Table 3)
1.5
(Table 4)
0.7 Redevelopment is
subject to the
successful
acquisition of
100% ownership
interest
Central Yards
Site 3 of New Central Harbourfront
1.6 To be held for
rental purposes
upon completion
Yau Tong Bay project
0.9 (Note 2)
Others
0.1
Sub-total:
4.8
(C)
Projects in the New Territories
Area 34B, Hung Shui Kiu/Ha Tsuen
New Development Area
0.6
Hung Shui Kiu projects
1.4 (Note 2)
Others
Sub-total:
Total:
0.4 (Note 2)
2.4
9.1
Note 1:
Gross floor area is calculated based on the general building plans approved by the Buildings Department or the
Government’s current town planning parameters, as well as the Company’s development plans and is subject
to change.
Note 2:
Developable area will be confirmed after reaching an agreement with the Government on the amount of land
premium payable. The Yau Tong Bay project changed to a phased development approach and the Government
has issued the provisional basic terms offer for Phase 1.
5
(Table 1) Unsold units of major development projects offered for sale
There are 26 major development projects with unsold units:
As at 30 June 2026
Project name and location
Gross
floor
area
(sq. ft.)
No. of
unsold
Type of residential
development
units
Saleable
area of
unsold
units
(sq. ft.)
Interest
of the
Group
(%)
Saleable
area of
unsold units
attributable
to the Group
(sq. ft.)
The Legacy
8 Castle Road
Mid-Levels
472,067
Residential
130
303,070
65.00
196,996
Victoria Voyage
(Phases 1A, 1B and 2B)
18 Shing Fung Road
Kai Tak
995,138
Commercial/
Residential/
Government
facilities
1,298
553,387
30.00
166,016
The Henley
7 Muk Tai Street
Kai Tak
654,602
Commercial/
Residential
229
137,116
100.00
137,116
Henley Park
8 Muk Tai Street
Kai Tak
397,967
Residential
239
126,688
100.00
126,688
Miami Quay
23 Shing Fung Road
Kai Tak
574,614
Residential
696
276,879
29.30
81,126
Eden Manor
88 Castle Peak Road
Kwu Tung
555,399
Residential
50
60,781
100.00
60,781
One Victoria Cove
(Phases 1, 3 and 4)
1 Bailey Street
Hung Hom
536,882
Commercial/
Residential
258
106,566
50.00
53,283
Highwood
70 To Kwa Wan Road
Ma Tau Kok
382,182
Commercial/
Residential
136
52,136
100.00
52,136
Double Coast
(Phases 1 and 3)
19 Shing Fung Road
Kai Tak
432,458
Residential
323
140,200
30.00
42,060
- The Knightsbridge
22 Shing Fung Road
Kai Tak
641,165
Commercial/
Residential
259
176,014
18.00
31,683
- One Innovale
8 Ma Sik Road, Fanling
612,685
Residential
57
30,658
100.00
30,658
6
- woodis
15 Wood Road
Wan Chai
86,557
Commercial/
Residential
62
25,485
100.00
25,485
- The Harmonie
233 Castle Peak Road
Cheung Sha Wan
159,748
Commercial/
Residential
54
(Note 1)
18,888
(Note 1)
100.00
18,888
(Note 1)
- Wellesley
23 Robinson Road
Mid-Levels West
156,900
(Note 2)
Residential
20
35,459
50.00
(Note 2)
17,730
- Baker Circle One
339,993
(Phases 1-3)
38 Gillies Avenue South,
33 Whampoa Street and
18 Bulkeley Street
Hung Hom
Commercial/
Residential
59
14,889
100.00
14,889
- Chester
8 Whampoa Street
Hung Hom
134,874
Commercial/
Residential
24
11,331
100.00
11,331
- The Upper South
71 Main Street
Ap Lei Chau
40,318
Commercial/
Residential
47
9,509
100.00
9,509
- The Hampstead Reach
8 Ping Kin Lane
Yuen Long
27,868
Residential
3
5,427
100.00
5,427
- The Royale
8 Castle Peak Road Castle Peak Bay
Tuen Mun
663,062
Residential
33
23,275
16.95
3,946
- South Walk•Aura
12 Tin Wan Street
Aberdeen
37,550
Commercial/
Residential
14
3,443
100.00
3,443
- The Haddon
1 Whampoa Street
Hung Hom
186,539
Commercial/
Residential
7
2,676
100.00
2,676
- Eight Southpark
8 Nam Kok Road
Ma Tau Kok
117,994
Commercial/
Residential
13
3,495
76.468
2,673
- The Addition
350 Un Chau Street
Cheung Sha Wan
79,903
Commercial/
Residential
7
2,536
100.00
2,536
- Global Gateway Tower
61A-61E and
63 Wing Hong Street
Cheung Sha Wan
336,052
Industrial
Not
applicable
75,693
(Note 3)
100.00
75,693
(Note 3)
- E-Trade Plaza
24 Lee Chung Street
Chai Wan
173,850
Office
Not
applicable
57,400
(Note 3)
100.00
57,400
(Note 3)
7
- Mega Cube
8 Wang Kwong Road
Kowloon Bay
171,194
Office
Not
applicable
48,622
(Note 3)
Total:
4,018
2,301,623
100.00
48,622
(Note 3)
1,278,791
Note 1:
Representing the Group’s entitlement for this Urban Renewal Authority project.
Note 2:
The Group has a 25.07% interest in the development project. Some of the residential units were allocated to
and held by the Group and another developer on a 50:50 basis.
Note 3:
Representing the saleable area of the office, industrial or shop area.
8
(Table 2) Projects to be launched for sale in the second half of 2026
The following projects will be launched for sale in the second half of 2026, unless the launch is
delayed due to unforeseen circumstances:
Project name and location
Gross
floor area
(sq. ft.)
No. of
Type of residential
development
units
Gross
floor area
of
residential
units
(sq. ft.)
Interest
of the
Group
(%)
Gross
floor area of
residential
units
attributable
to the Group
(sq. ft.)
Parkwood
3 Mei Sun Lane
Tai Po
49,077
Commercial/
Residential
122
36,097
(Note)
100.00
36,097
(Note)
North Innovale
25 Heung Tsz Road
Kwu Tung North
(formerly known as project
at Fanling Sheung Shui
Town Lot No. 263
Kwu Tung)
339,066
Commercial/
Residential
682
282,555
90.10
254,582
Chester II
28 Whampoa Street
Hung Hom
124,526
Commercial/
Residential
263
104,760
100.00
104,760
One Victoria Cove
(Phase 2)
1 Bailey Street
Hung Hom
180,582
Commercial/
Residential
384
172,044
50.00
86,022
18 Man On Street
Mong Kok
57,763
Commercial/
Residential
126
52,343
100.00
52,343
33 Elgin Street
Central
42,571
Commercial/
Residential
92
40,991
100.00
40,991
16-20 Temple Street
Yau Ma Tei
22,346
Commercial/
Residential
48
21,230
100.00
21,230
29A Lugard Road
The Peak
11,703
Residential
1
11,703
100.00
11,703
Total:
Note : Representing the saleable area of the residential units.
9
1,718
721,723
607,728
(Table 3) Urban Redevelopment Projects – with 100% ownership interest acquired or the
relevant compulsory sale application threshold has been met
As regards urban redevelopment projects, there are a number of projects with 100% ownership
acquired or which have met the relevant compulsory sale application threshold. Based on the general
building plans approved by the Buildings Department or the Government’s current town planning
parameters, the expected gross floor area attributable to the Group of those projects is as follows:
By District
With 100% ownership interest
acquired
Expected
gross floor
area
attributable to
the Group
upon
completion of
Site area
the
attributable redevelopment
project
to the Group
(sq. ft.)
(sq. ft.)
Hong Kong
1.
Mid-Levels
2.
Causeway Bay
3.
Aberdeen
4.
Quarry Bay
Sub-total:
Kowloon
5.
Tsim Sha Tsui
6.
Hung Hom
64,294
4,497
4,950
21,941
95,682
346,060
46,931
42,075
227,651
662,717
12,283
31,443
147,394
286,734
Tai Kok Tsui
18,545
166,696
Ho Man Tin
Cheung Sha Wan
4,882
6,510
39,595
58,590
Kowloon City
Sub-total:
Total:
10,954
84,617
180,299
97,231
796,240
1,458,957
With less than 100%
ownership interest but the
relevant compulsory sale
application threshold has
been met*
Expected
gross floor
area
attributable to
the Group
upon
completion of
Site area
the
attributable redevelopment
to the Group
project
(sq. ft.)
(sq. ft.)
Total
expected
gross
floor area
attributable
to the Group
(sq. ft.)
6,212
2,019
2,868
31,060
18,171
25,506
11,099
74,737
377,120
65,102
67,581
227,651
737,454
0
74,737
147,394
286,734
(Note 1)
166,696
(Note 2)
39,595
58,590
(Note 3)
97,231
796,240
1,533,694
0
11,099
- To acquire all the undivided shares in the lots, the majority owner will make an application to the Lands Tribunal for an
order for sale of the lots by way of public auction under the Land (Compulsory Sale for Redevelopment) Ordinance. If
the Lands Tribunal refuses to make an order for sale, the majority owner may not be able to acquire the remaining
undivided shares and proceed with the redevelopment projects.
Note 1: Part of an urban renewal plan with a total gross floor area of more than 1 million square feet, of which approximately
800,000 square feet is attributable to projects (namely, Baker Circle•Dover, Baker Circle•Euston, Baker
Circle•Greenwich, The Haddon, Chester and Chester II) which have been launched for sale or are proposed to be
launched for sale in the second half of 2026.
Note 2: Part of an urban renewal plan with a total gross floor area of more than 1 million square feet, of which approximately
920,000 square feet is attributable to projects (namely, Eltanin•Square Mile, Cetus•Square Mile, Aquila•Square
Mile, The Quinn•Square Mile, Gateway•Square Mile and the project at Man On Street) which have been launched
for sale or are proposed to be launched for sale in the second half of 2026.
Note 3: The developable area may be subject to the Group reaching an agreement with the Government on the amount of
land premium payable.
10
(Table 4) Urban Redevelopment Projects – with more than 20% ownership interest acquired,
but the relevant compulsory sale application threshold has not been met
There are other redevelopment projects in various urban districts where acquisition of units in
existing buildings is ongoing. At present, more than 20% ownership interest of each project has been
acquired, but the relevant compulsory sale application threshold has not yet been met. If the
remaining interests are acquired, the sites will be redeveloped and upon completion, based on the
Government’s current town planning parameters, the total gross floor area attributable to the Group
will be approximately 1,770,000 square feet. Based on the Group’s undivided shares in the lots, the
total gross floor area attributable to the Group is approximately 650,000 square feet. However, these
redevelopment projects are subject to the successful acquisition of the remaining interests in the
relevant lots, which remains uncertain.
11
Land Bank
As at 30 June 2026, the Group’s land bank in Hong Kong amounted to approximately 20.3 million
square feet of gross floor area attributable to the Group, which comprised the following:
Projects pending sale or pending/under development (Note)
Unsold units of major development projects offered for sale
Completed investment properties (including hotels)
Gross floor area
attributable to the
Group
(million sq. ft.)
7.8
1.3
Sub-total:
9.1
11.2
Total:
20.3
Note: The above includes plots in Hung Shui Kiu and other project sites with a total developable area of approximately 1.8
million square feet attributable to the Group which will be confirmed after reaching an agreement with the Government
on the amount of land premium payable.
Urban Areas Land Bank
In addition to projects scheduled for sales launch as described above, urban redevelopment projects
for which the Group has acquired 100% ownership interest or which have met the relevant
compulsory sale application threshold are expected to provide a total gross floor area of
approximately 1.5 million square feet attributable to the Group, to be launched for sale or lease in
2027 and beyond.
For the urban redevelopment project in Hung Hom, the Group has completed the acquisition of all
remaining ownership interests of the projects spanning Whampoa Street and Baker Street. As for
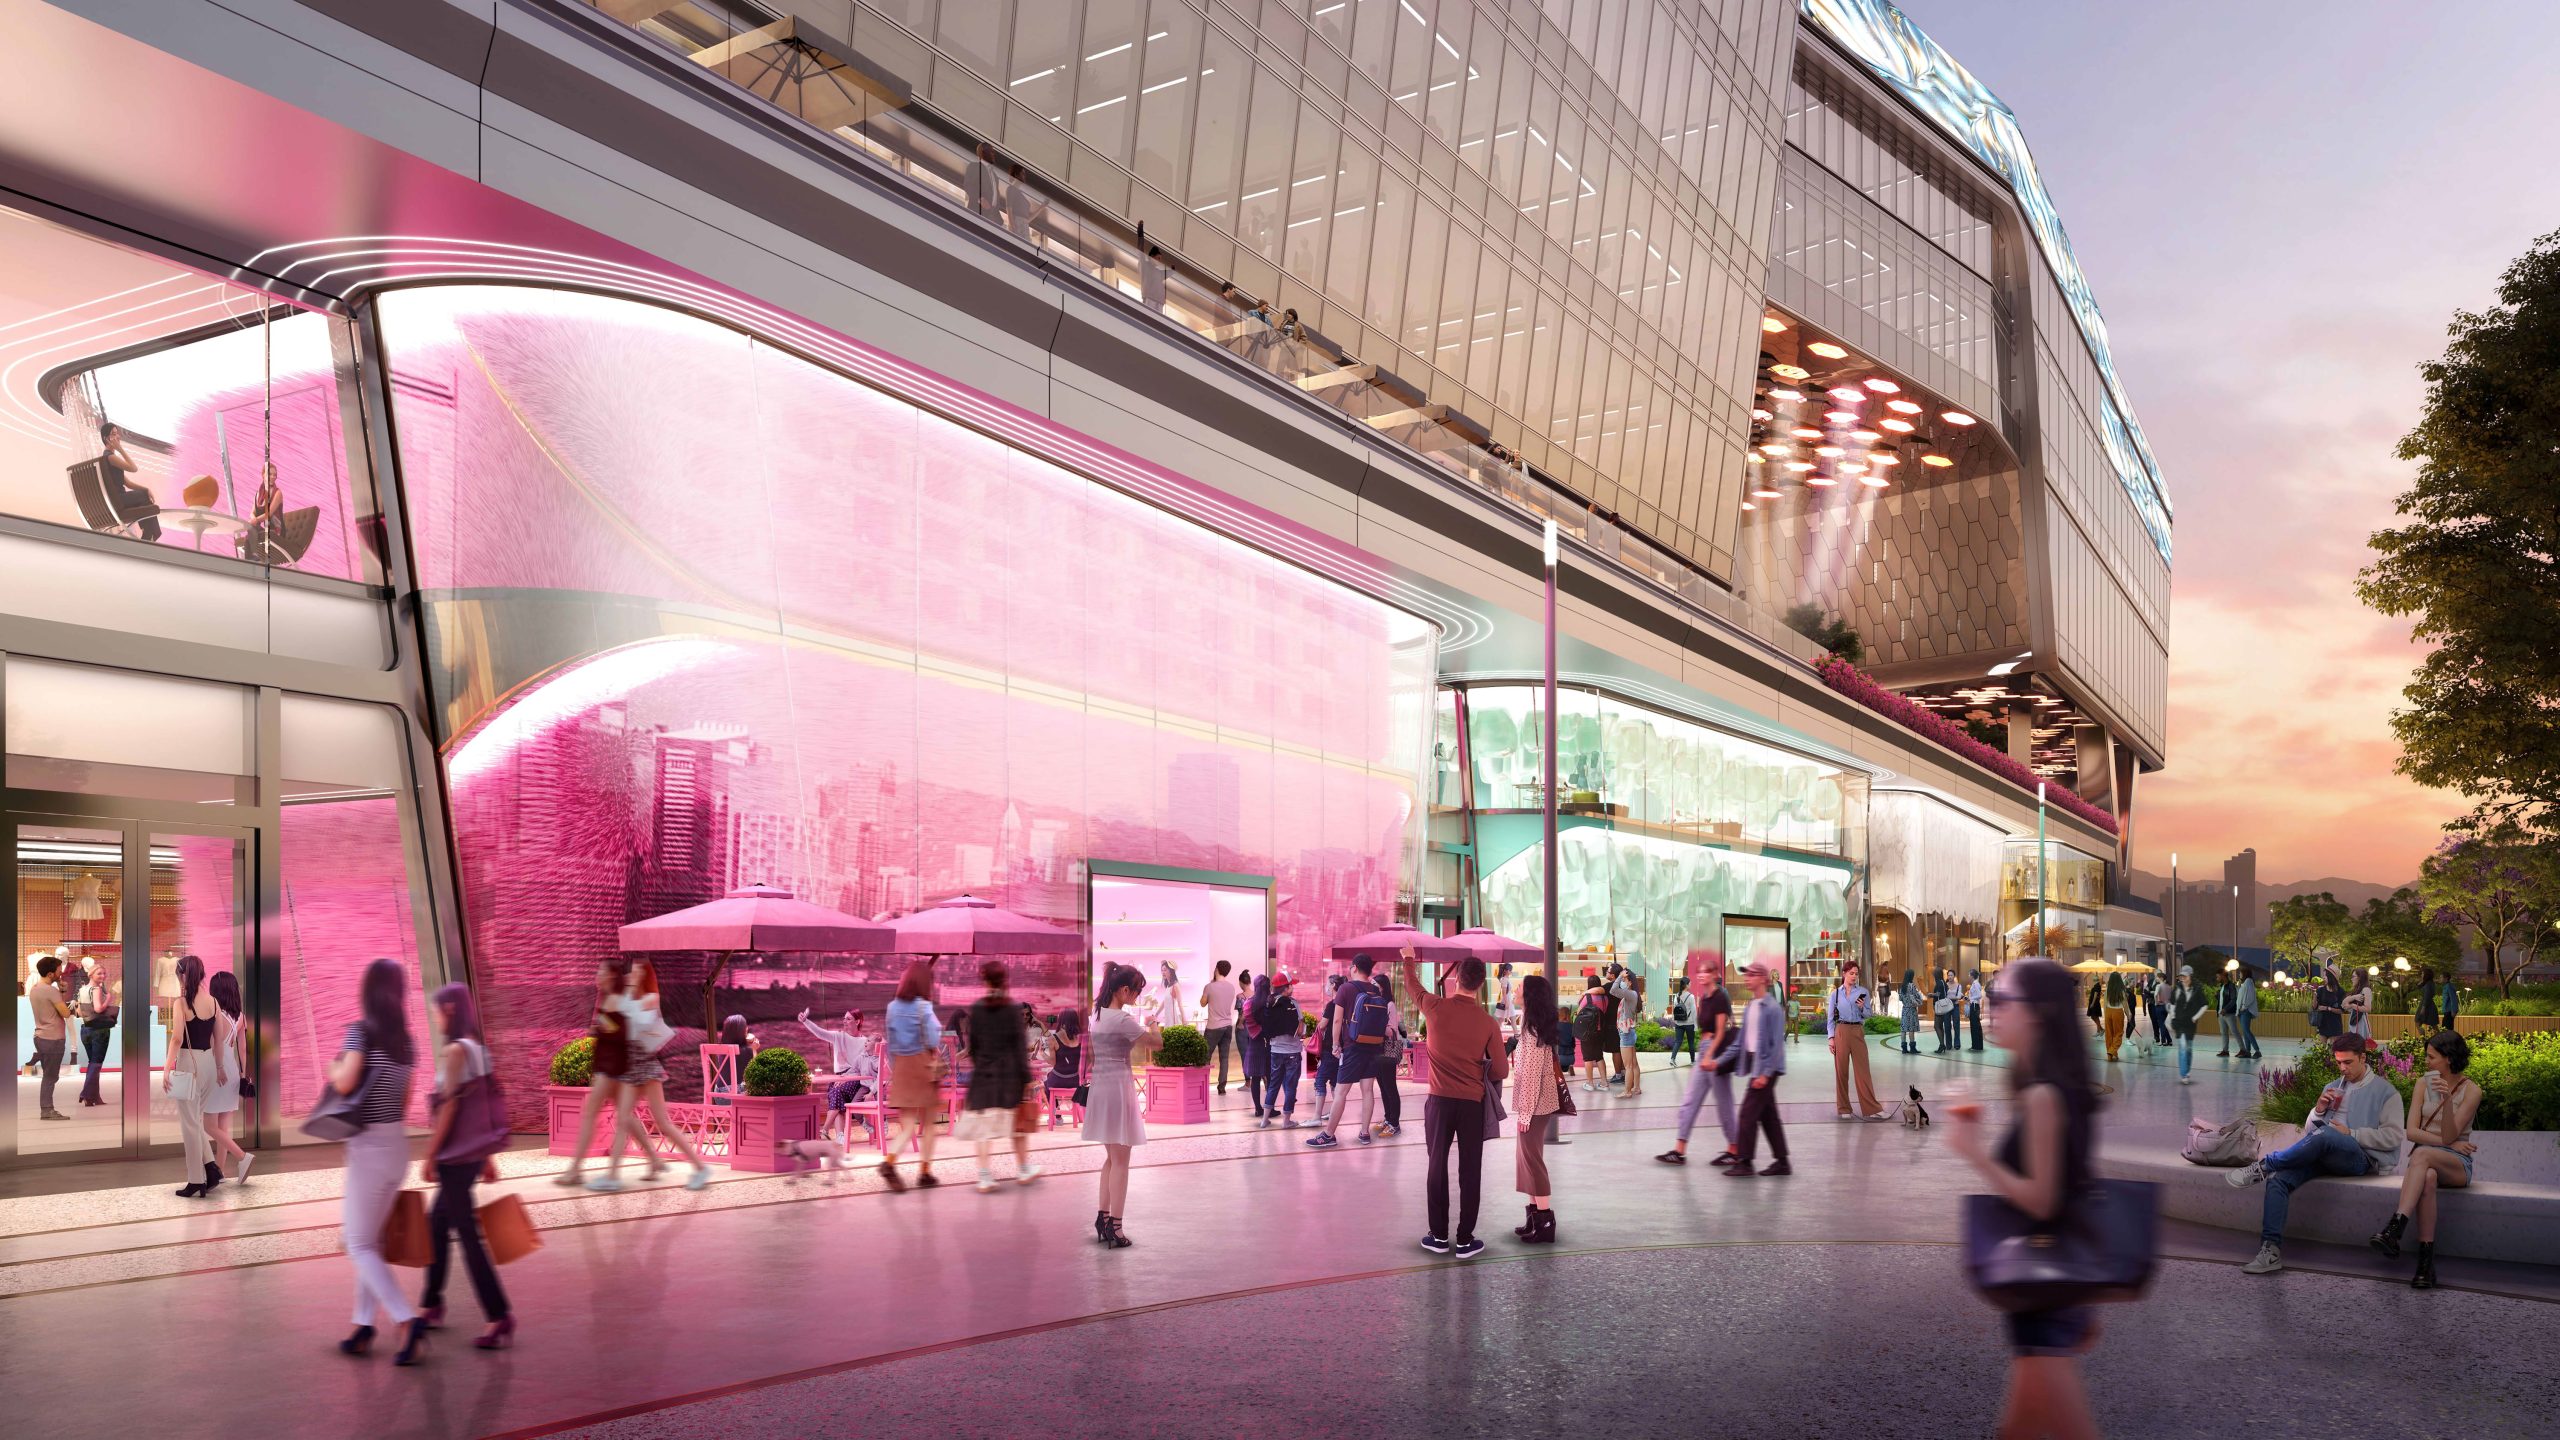
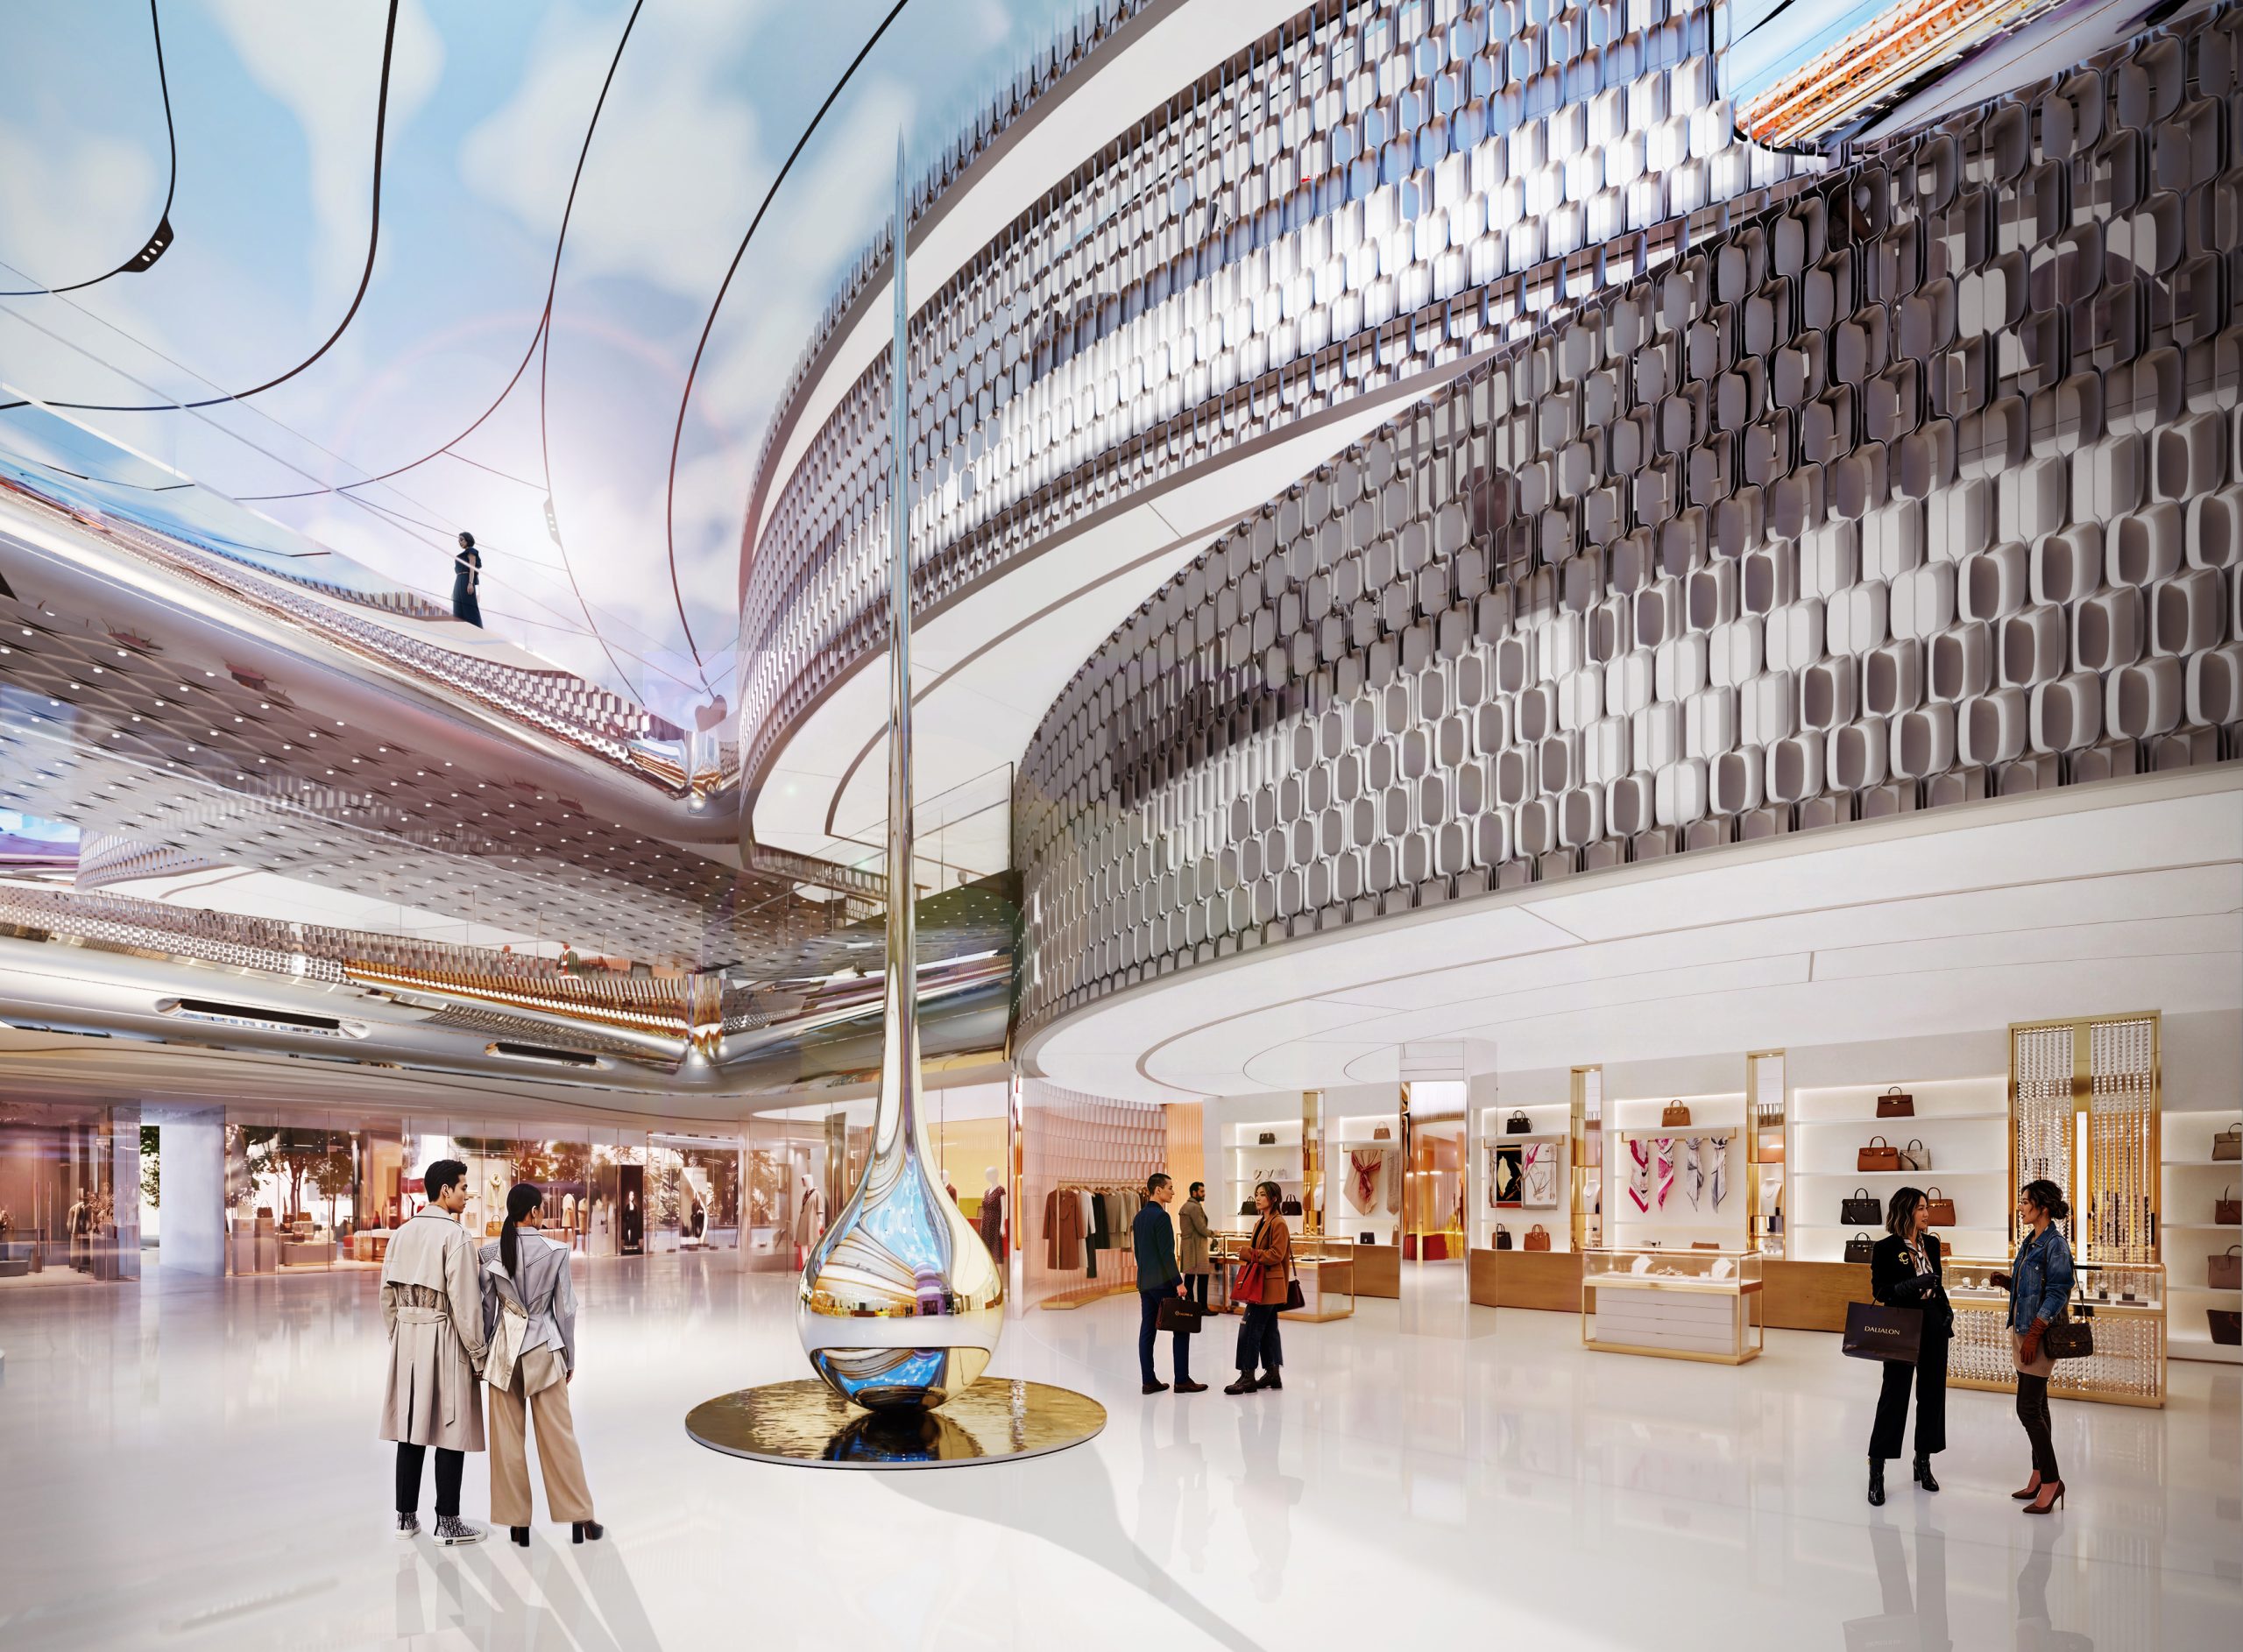
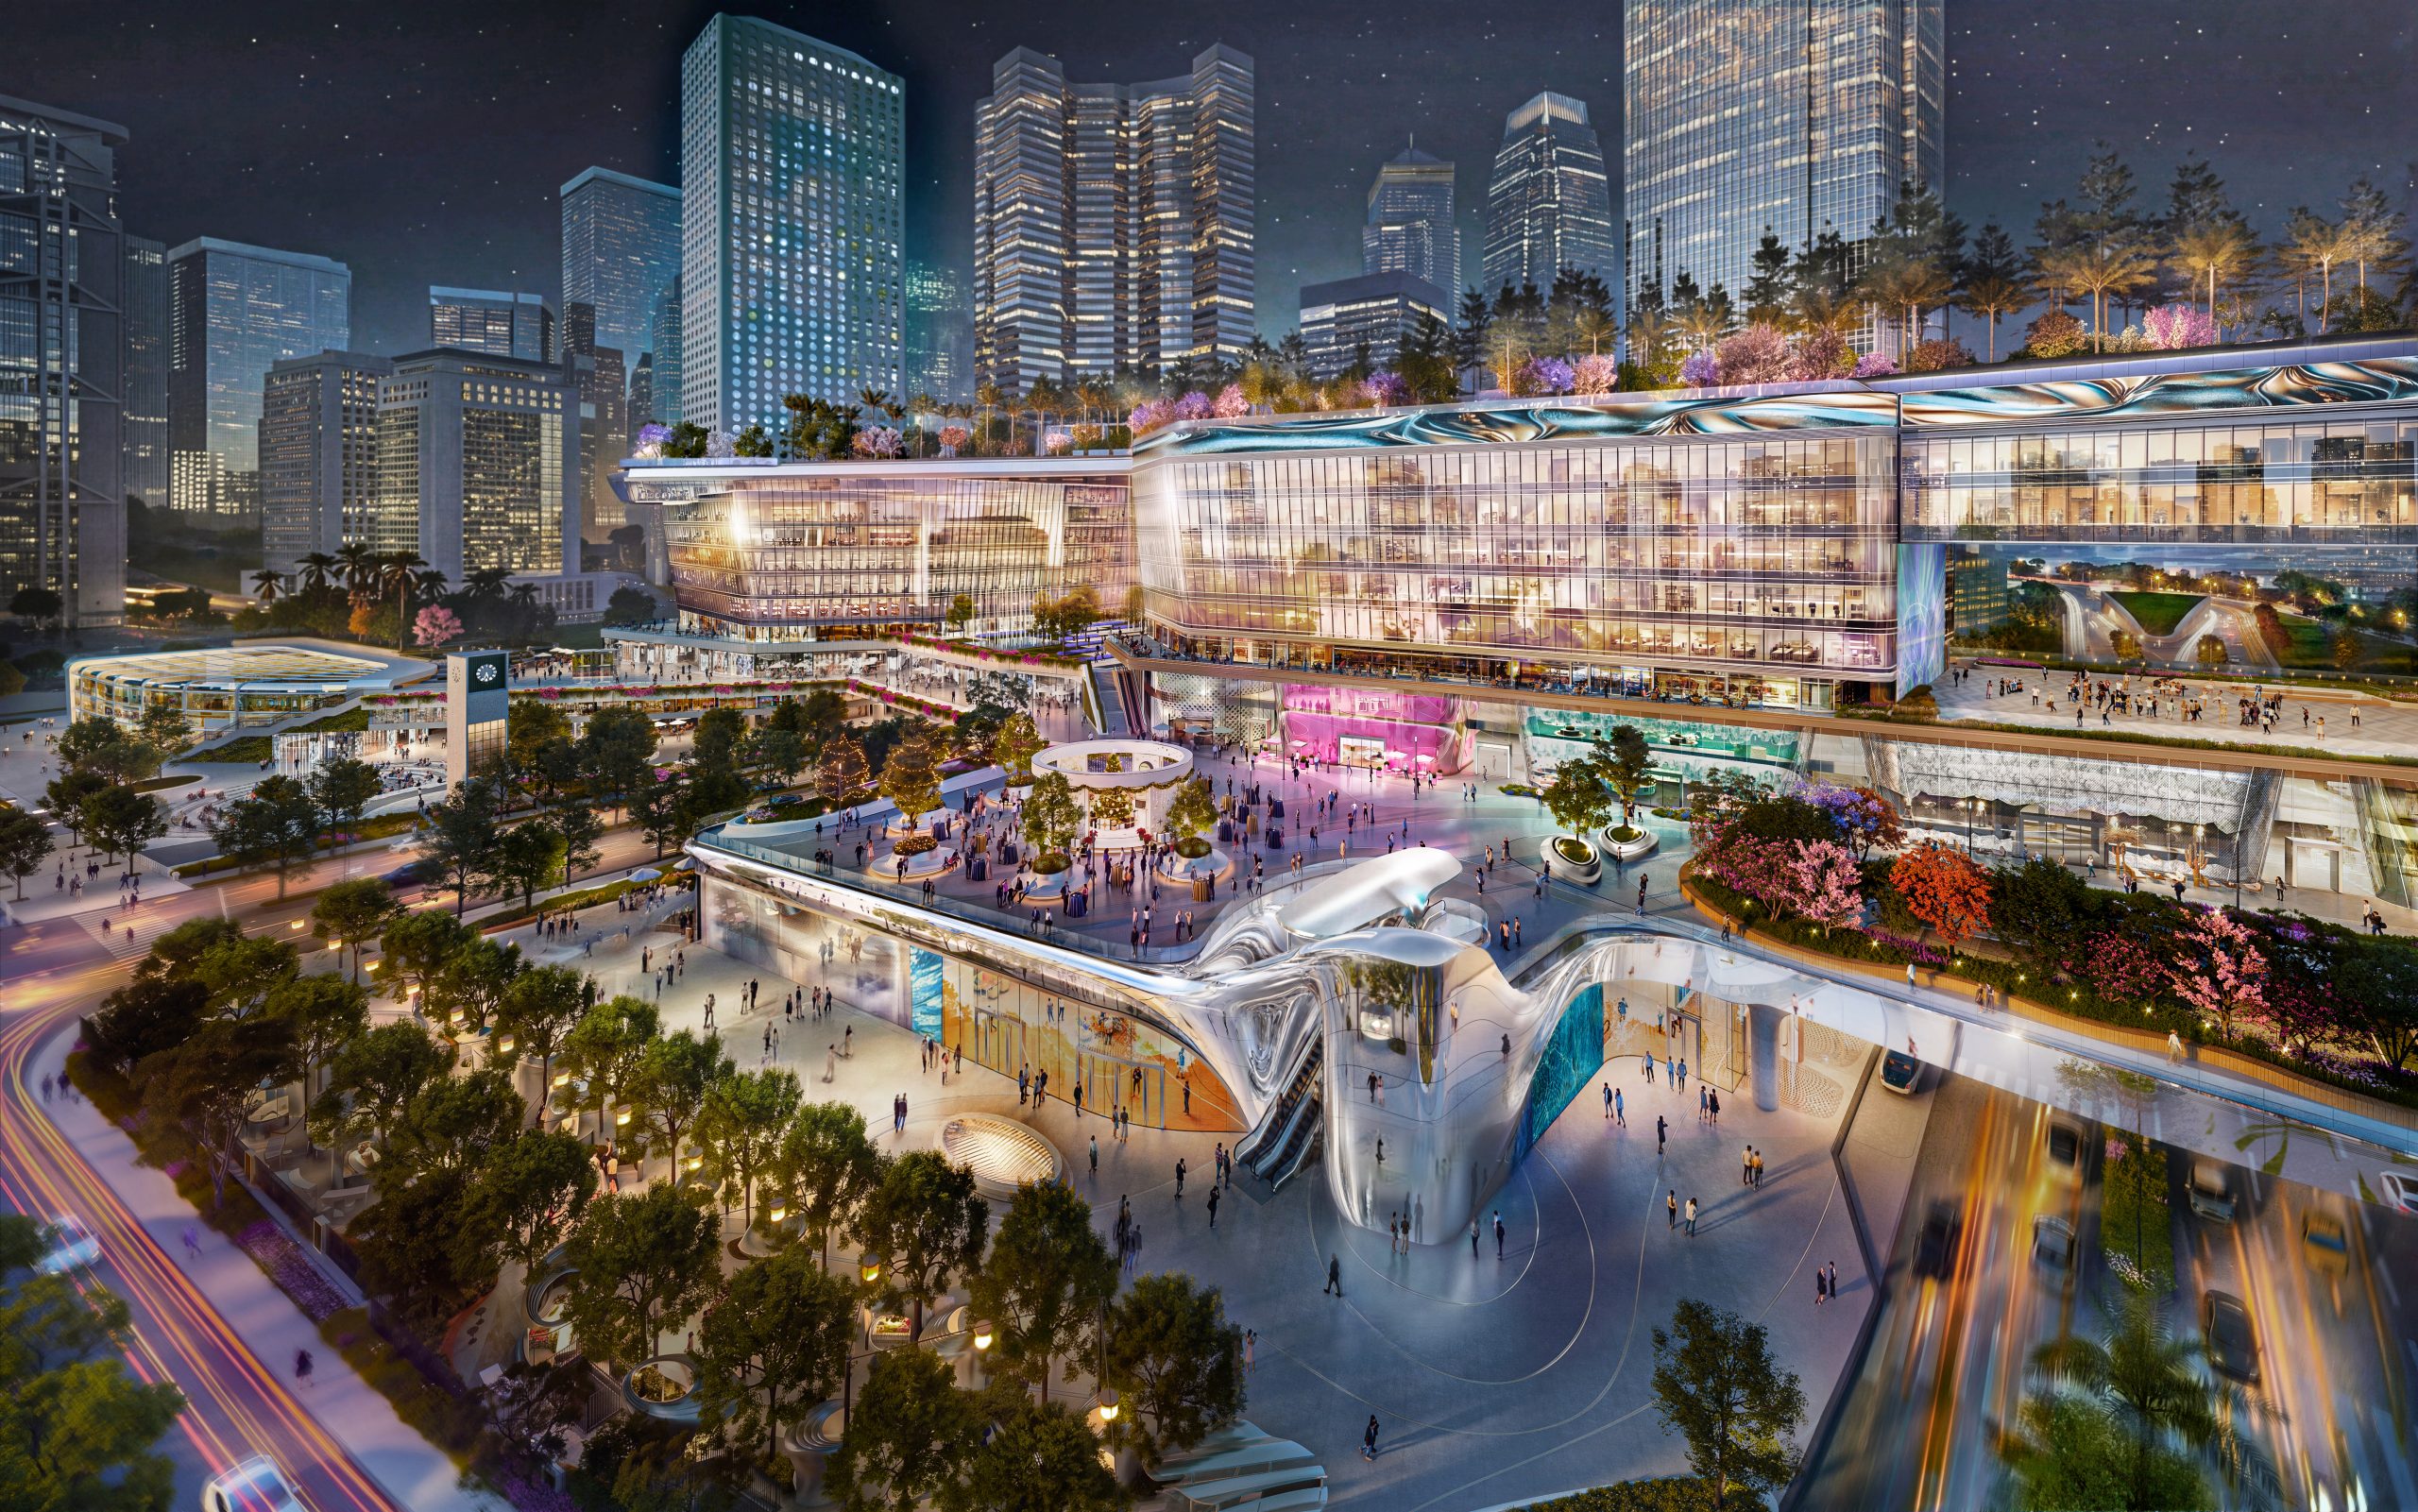
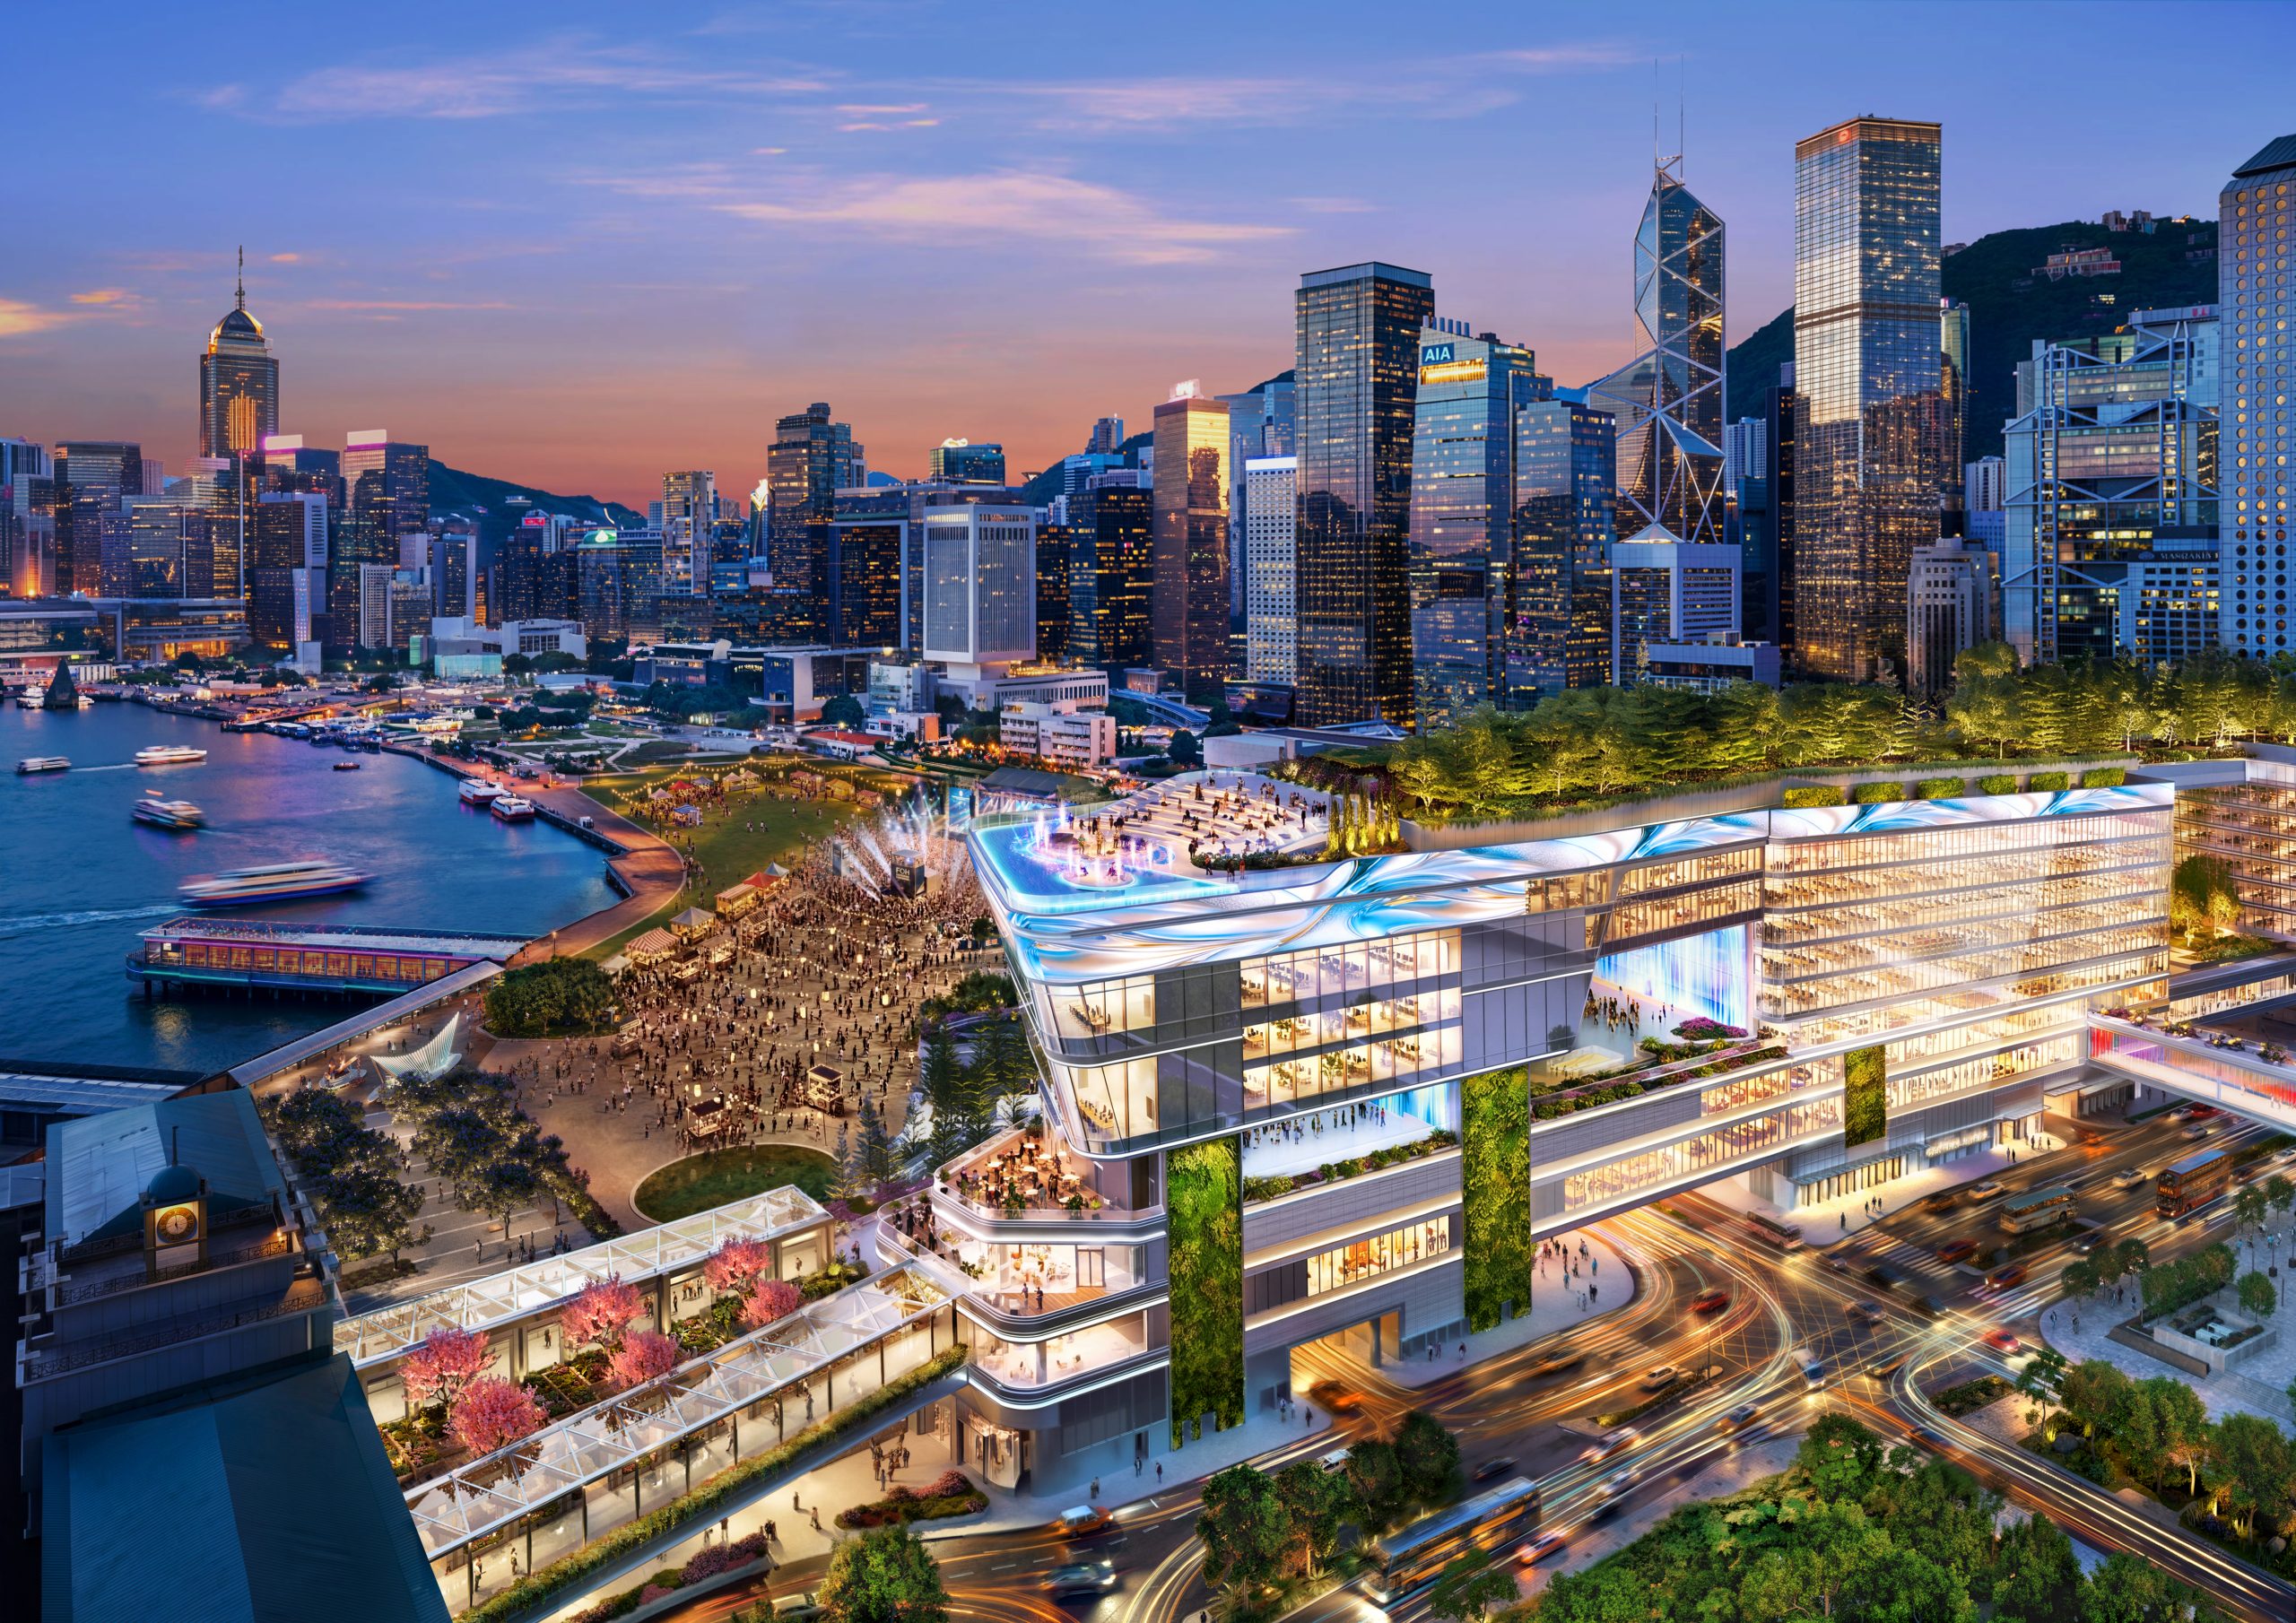
Central Yards, the Group’s flagship project on the New Central Harbourfront, the main contract works
are in progress. This mixed-use project will offer over 700,000 square feet of premium office and
ancillary space, featuring the largest office floorplate in Central, designed for modern headquarters
and innovation-driven financial institutions. It will also offer 900,000 square feet of retail space,
featuring the city’s one-and-only private Broadway-calibre theatre with seating for over 1,100 guests.
In addition, the project provides over 300,000 square feet of green recreational space, including a
rooftop sky garden for public enjoyment. Its Phase 1 shopping and office spaces are scheduled for
completion in the fourth quarter of 2026, while Phase 2 is scheduled for completion in 2032. This
project is poised to become a global harbourfront icon, offering an integrated mix of retail, business,
culture, arts, nature and entertainment, transforming the cityscape of Hong Kong. This development
has attained the highest standards of world-class green and smart building certifications, including
BEAM Plus for New Buildings and Neighbourhood, Leadership in Energy and Environmental Design
(LEED), WELL, WiredScore and SmartScore.
The Yau Tong Bay mixed-use development project, in which the Group holds a 22.8% interest, has
changed to a phased development approach. The Government has issued the provisional basic
terms offer for Phase 1 of the project but the amount of land premium payable is currently under
appeal. Phase 1 will proceed only once an agreement is reached with the Government on the
premium. This harbourfront development is expected to provide a total gross floor area of
approximately 910,000 square feet attributable to the Group.
12
New Territories Land Bank
During the first half of 2026, land lots with a total site area of approximately 2,250,000 square feet
attributable to the Group in Hung Shui Kiu/Ha Tsuen New Development Area and San Tin have been
gazetted by the Government for resumption for public use, with cash compensation of approximately
HK$2,349 million. As at 30 June 2026, excluding the aforementioned land gazetted for resumption,
the Group’s land bank in the New Territories amounted to approximately 38.4 million square feet,
continuing to represent the largest holding among property developers in Hong Kong:
By District
Yuen Long District
North District
Tai Po District
Tuen Mun District and others
Total:
Site area attributable
to the Group
(million sq. ft.)
22.0
12.5
3.4
0.5
38.4
In Hung Shui Kiu/Ha Tsuen New Development Area, following the successful completion of an insitu land exchange last year, the Group, in conjunction with another developer, continued to pursue
in-situ land exchange applications for the remaining four commercial sites. As for two of these sites,
applications have been submitted to the Town Planning Board to convert part of the gross floor area
to residential use. If approved and upon successful completion of all in-situ land exchange formalities
by the deadline of 31 December 2026, these sites will provide the Group with an attributable gross
floor area of approximately 1.4 million square feet for commercial and residential uses. The other
two sites were resumed by the Government for further development during the period, in support of
its latest plan to construct a University Town in the district. In the 2025 Policy Address, the Chief
Executive introduced several measures to accelerate the development of the Northern Metropolis.
Among these, the Northern Metropolis Development Bill will be introduced into the Legislative
Council for scrutiny and passage. It is anticipated that various existing measures and procedures
will be streamlined to achieve the Government’s development objective of “enhancing speed and
efficiency”. The Government has also announced the details and arrangements for the “pay for what
you build” mechanism. The Group is actively studying the feasibility of completing the in-situ land
exchanges through this mechanism to reduce the cost of land premiums. Apart from the land lots
designated for exchange as mentioned above, the Group’s land bank in Hung Shui Kiu/Ha Tsuen
amounted to approximately 2.21 million square feet.
In 2020, the Government announced specific criteria under the implementation framework for its
Land Sharing Pilot Scheme. In order to align with the Government’s policy to satisfy the keen housing
demand, the Group, after reviewing its land holdings in the New Territories, submitted an application
to the relevant authority under this scheme in conjunction with another developer. The project is
located in Lam Tsuen, Tai Po, covering a site area of about 2 million square feet or 19.3 hectares,
slightly larger than Victoria Park in Hong Kong. The project aims to offer 30% (3,636 units) for private
housing and 70% (8,484 units) for public housing. In November 2022, the project received support
from an advisory group and was agreed in principle by the Executive Council. The project is currently
undergoing rezoning. The Group hopes that by participating in this scheme, it can make more
efficient use of land resources and expedite the release of potential value.
In October 2021, the Government promulgated the Northern Metropolis Development Strategy
proposing to develop the Northern Metropolis into an international innovation and technology hub. It
will include the comprehensive San Tin Technopole, which comprises the Hong Kong-Shenzhen
Innovation and Technology Park at the Loop and the area around San Tin/Lok Ma Chau. The
Government further promulgated the North Metropolis Action Agenda 2023 in October 2023 which
included the Technopole as part of the Innovation and Technology Zone. According to the draft San
Tin Technopole Outline Zoning Plan, approved by the Chief Executive in Council in September 2024,
13
the Government will resume land from developers for innovation and technology use. In June 2026,
the Government announced the resumption of land for the development of San Tin Technopole
(Phase 1) (Second Batch). Excluding the land lots resumed by the Government, the Group’s land
bank in San Tin within the Northern Metropolis currently amounts to approximately 3.65 million
square feet.
In addition, the Government released its development proposal for Ngau Tam Mei, which is adjacent
to San Tin, in November 2024. The related public engagement activities were completed in 2025. In
early 2026, the Group applied to the Government for in-situ land exchanges for three land lots within
this area, with a combined total site area of approximately 760,000 square feet. Upon completion of
the land exchange, these sites will in aggregate provide a total gross floor area of approximately
4.94 million square feet. However, the application remains subject to government response. Apart
from the land lots designated for exchange as mentioned above, the Group holds a land bank of
approximately 3.89 million square feet in Ngau Tam Mei.
14
Investment Properties
For the six months ended 30 June 2026, the gross rental income in Hong Kong attributable to the
Group (including gross rental income attributable to subsidiaries, associates and joint ventures)
increased by 3% year on year to HK$3,517 million. The corresponding net rental income before
taxation attributable to the Group increased by 4% year on year to HK$2,593 million. For the
International Finance Centre (“ifc”) project, in which the Group has a 40.77% interest, the gross
rental income attributable to the Group was HK$837 million, representing a year-on-year increase of
4%.
As at 30 June 2026, the average leasing rate for the Group’s major investment properties was 94%.
As at 30 June 2026, the completed investment property portfolio attributable to the Group in Hong
Kong amounted to approximately 10.7 million square feet, the details of which are as follows:
By type
Shopping arcade or retail
Office
Industrial
Residential and hotel apartment
Total:
By geographical area
Hong Kong Island
Kowloon
New Territories
Total:
Gross floor area
attributable to the
Group
(million sq. ft.)
5.8
4.2
0.2
0.5
10.7
(Note)
Gross floor area
attributable to the
Group
(million sq. ft.)
3.0
3.6
4.1
10.7
Percentage
(%)
54
39
2
5
100
Percentage
(%)
28
34
38
100
Note: The Group held an additional attributable gross floor area of approximately 500,000 square feet of hotels, along with
approximately 9,000 car parking spaces.
15
Retail portfolio
According to the Government’s Census and Statistics Department, the value of total retail sales in
Hong Kong for the first half of 2026 increased by 9.6% year on year, driven by an increase in visitor
arrivals and a recovery in local consumer sentiment. Hence, the overall occupancy rate for the
Group's retail portfolio remained consistently high and most shopping malls reported growth in both
visitor traffic and tenant sales.
During the period, the Group formulated tailor-made asset enhancement strategies based on the
uniqueness of each mall, with an aim to enhance distinctiveness and enrich shopper experience.
MCP in Tsueng Kwan O, the 1,000,000-square-foot shopping mall atop an MTR station, was
repositioned as a “sportainment” hub and a series of vibrant promotional campaigns were launched
accordingly. MOSTown in Ma On Shan introduced various pet-friendly facilities and trendy athleisure
brands to align with its modern lifestyle concept. Trend Plaza in Tuen Mun strengthened localised
engagement with shoppers through stores featuring local characteristics and themed dining venues.
The aforementioned malls were awarded “Entertainment Mall of the Year – Hong Kong”, “Lifestyle
Mall of the Year – Hong Kong” and “Mall Initiative of the Year – Hong Kong”, respectively, at the
Retail Asia Awards 2026. Furthermore, the Group secured multiple awards at the Marketing Events
Awards Hong Kong 2026, underscoring its outstanding performance in enhancing the
competitiveness of its shopping malls in Hong Kong.
The Group's two large-scale urban redevelopment projects in Tai Kok Tsui and Hung Hom are being
completed in phases, providing a total retail floor area of approximately 163,000 and 168,000 square
feet, respectively. Both shopping complexes will feature a curated mix of innovative retail concepts,
trendy sports brands and selected dining outlets to cater to the demands of modern consumers.
Upon completion, these projects are expected to further enhance the Group's recurring rental income.
16
Office portfolio
During the first half of 2026, the flight-to-quality trend among tenants in the finance, insurance and
legal sectors drove the vacancy rate of office developments in Core Central to its lowest level in
nearly two years. The Group’s premium office portfolio, particularly The Henderson and ifc in Central,
accordingly benefited from this market environment.
The Henderson, a 465,000-square-foot office development, achieved a leasing rate of over 90% at
the end of June 2026. Designed by the internationally acclaimed architectural firm Zaha Hadid
Architects, this landmark development, which previously received the top honour of the World’s Best
Property at the International Property Awards 2025-2026, achieved another milestone during the
period: its three dining establishments (namely, Hana no Kumo, Peridot and Akira Back) were all
named among the World’s 16 Most Beautiful Restaurants at the Prix Versailles 2026, making them
the only three venues in Hong Kong to receive this accolade. In addition to being the first commercial
building in the Asia-Pacific region to achieve “In Partnership with Forbes Travel Guide” recognition,
The Henderson is the first super Grade-A commercial development in Hong Kong to receive ten
Platinum certifications across multiple sustainability and smart technology standards. The
Henderson is also the first project in China to receive full marks in both the SmartScore Certification
and the China Smart Building Certification. The Henderson has attracted top-tier tenants, including
Point72, Christie’s, Carlyle, Audemars Piguet and Cohen & Steers.
Leveraging strong relationships with tenants, the Group’s other office developments performed well
during the period. ifc in Central, AIA Tower in North Point, as well as the Group’s portfolio of office
and industrial/office premises in Kowloon East, including Manulife Financial Centre, AIA Financial
Centre, 78 Hung To Road and 52 Hung To Road, maintained an overall occupancy rate of
approximately 90%.
As regards Central Yards, the 1,600,000-square-foot mixed-use development on the New Central
Harbourfront, its 750,000-square-foot Phase 1 development is scheduled for completion in the
second half of 2026 and opening in 2027. A financial institution has signed an agreement to lease
70%, over 223,000 square feet, of Phase 1 office and ancillary space. The remaining areas are
attracting strong interest from leading multinational companies. During the first half of 2026, a joint
venture company of the Group successfully secured a five-year tenancy for the Central Harbourfront
Event Space adjacent to Central Yards. Moving forward, the project will adopt a holistic layout
planning of the Victoria Harbourfront to orchestrate diverse events, thereby creating synergies with
Central Yards. This initiative aims to forge a more vibrant, world-class cultural and entertainment
landmark for Hong Kong, further consolidating its status as the “Mega Events Capital”.
17
Construction
The Group continues to adopt innovative technologies and advanced materials to further enhance
construction quality. Among these, “structural bio-inspired silicone sealant for wet surface” has
received Government approval and is being used in government projects. In addition to implementing
the Government's Smart Site Safety System at its construction sites, the Group is actively
participating in the joint development of an AI-powered fire detection system and a portable AIpowered camera scanning system to strengthen site safety. As a result, the Group received
numerous accolades, including Environmental Merit Award, Worker-friendly Construction Site and
Carbon Smart Label Eligible Project, in recognition of its commitment to environmental protection,
innovation and site safety.
The following development projects in Hong Kong were completed during the period:
Interest
of the
Group
(%)
Gross floor
area
attributable
to the Group
(sq. ft.)
Project name and
location
Site
area
(sq. ft.)
Gross
floor area
(sq. ft.)
Type of
development
North Innovale
25 Heung Tsz Road
Kwu Tung North
(formerly known as project
at Fanling Sheung Shui
Town Lot No. 263
Kwu Tung)
56,510
339,066
Commercial/
Residential
90.10
305,498
Belgravia Place (Phase 2)
1 Berwick Street
Cheung Sha Wan
9,358
122,750
Commercial/
Residential
100.00
122,750
Total:
428,248
18
Property Management
The Group’s property management companies consist of Hang Yick Properties Management Limited
(“Hang Yick”), Well Born Real Estate Management Limited (“Well Born”), H-Privilege Limited (“HPrivilege”, which provides superior management services for the Group’s prestigious housing
projects - The H Collection), Goodwill Management Limited and H Commerce Management Limited
(which provides superior management services for The Henderson – The World’s Best Property, as
well as the Group’s commercial properties and shopping malls). These companies, collectively
managing over 83,000 apartments and industrial/commercial units, 10 million square feet of
shopping and office space, as well as 20,000 car parking spaces in Hong Kong, continue to hold
leading positions within the industry.
The property management companies uphold the Group’s commitment to service excellence and
sustainable development. They have implemented an Integrated Management System, which
complies with the requirements of ISO 9001 (Quality Management System), ISO 10002 (Complaints
Handling Management System), ISO 14001 (Environmental Management System) and ISO 45001
(Occupational Health and Safety Management System). During the period, these property
management companies received numerous accolades, including the Excellence in Facility
Management Award and the Carbon Award for their outstanding performance.
As for community services, these property management companies launched a “Year of Fire
Prevention” campaign during the period to raise public awareness of fire safety. They also
collaborated with charitable institutions to organise a series of activities to promote sports and
environmental protection. In addition, their volunteer teams actively participated in various caring
activities and received the “Corporate - Top 10 Highest Volunteer Hour Award”, “Corporate - Most
Active Award (Volunteer Hours)”, as well as “Top 10 Caring Estate” at the Hong Kong Volunteer
Award 2025.
19
Chinese Mainland
In the first half of 2026, the Central Government continued its policy stance of “striving to stabilise
the real estate market”, setting a clear direction to stimulate demand by relaxing restrictions, and to
optimise supply by controlling production volume and reducing inventory. However, as strengthening
the macroeconomic foundation still requires time, the overall real estate market remained sluggish,
despite a gradually narrowing price decline. City-level divergence intensified further. In first-tier and
certain core second-tier cities, transaction volumes rebounded under the impetus of premium “highquality home” projects. Upgrade-driven demand remained the main pillar supporting the new
commodity housing market. Nevertheless, despite a significant reduction in new commodity housing
supply, overall sales remained under pressure and declined compared with the same period last
year. In the land market, the Government maintained its supply strategy of “reducing volume and
enhancing quality”. Real estate enterprises continued to focus their land bidding on premium sites
in core cities.
The residential project completed during the period accounts for an attributable gross floor area of
approximately 200,000 square feet.
20
The Group’s strategies in Chinese Mainland were as follows:
Property Investment: During the period, the Group strategically directed its resources towards
leasing two large-scale projects completed in recent years, namely, Lumina Guangzhou in Yuexiu
District, Guangzhou and Lumina Shanghai in the Xuhui Riverside Area, Shanghai. This initiative
achieved notable success and as at 30 June 2026, the leasing rate for the 1,000,000-square-foot
Lumina Shanghai II was 92%, while Lumina Guangzhou recorded a leasing rate of over 80% for its
970,000-square-foot Grade-A office twin towers. In addition, two newly completed composite
developments — the 830,000-square-foot The Pier in Pudong, Shanghai and the 400,000-squarefoot Yunhui Tower in Nanshan, Shenzhen — are actively launching their leasing campaigns. With
the successive commencement of operations across these joint venture projects, the Group’s rental
income is projected to set a positive trajectory for future recurring revenue.
Property Development: The Group continued to focus on new development opportunities in firsttier and leading second-tier cities, as well as the Greater Bay Area strategic plan.
As at 30 June 2026, in addition to approximately 2.6 million square feet of attributable gross floor
area in completed property stock, the Group’s development land bank in 12 cities amounted to
approximately 7.20 million square feet of gross floor area attributable to the Group, with
approximately 65% designated for the development of residential properties:
21
Land Bank Under Development or Pending Future Development
Estimated
developable
gross floor area
attributable to
the Group*
(million sq. ft.)
First-tier cities
Beijing
Guangzhou
Sub-total:
0.05
0.87
0.92
Sub-total:
Total:
0.05
3.29
0.57
0.10
0.01
1.43
0.03
0.35
0.39
0.06
6.28
7.20
Second-tier cities
Changsha
Chengdu
Chongqing
Dongguan
Foshan
Shijiazhuang
Suzhou
Tianjin
Wuhan
Xuzhou
Utilisation of Land Bank
Residential
Office
Commercial
Others (including clubhouses, schools and
community facilities)
Estimated
developable
gross floor area
attributable to the
Group*
(million sq. ft.)
4.67
1.21
1.14
0.18
Percentage
(%)
65
17
16
2
7.20
100
Total:
- Excluding the developable gross floor area attributable to basement areas and car parks.
22
Property Sales
During the first half of 2026, the volume of pre-sold residential units completed and delivered to
buyers declined compared with the same period last year. Revenue attributable to the Group’s
property development in Chinese Mainland, as recognised in the financial statements for the period
under review, amounted to approximately RMB898 million (equivalent to approximately HK$1,014
million), representing a year-on-year decrease of 59% in Renminbi terms. The attributable loss
before taxation amounted to RMB377 million (2025: RMB100 million), equivalent to approximately
HK$425 million.
During the period, contracted sales attributable to the Group amounted to approximately RMB297
million (equivalent to approximately HK$337 million), representing a decrease of approximately 74%
compared to the total contracted sales in Renminbi terms for the same period last year. In terms of
attributable gross floor area, contracted sales decreased by 78% year on year to approximately 0.2
million square feet. Major projects included the Changan project in Shijiazhuang, CIFI Centre in
Chengdu, as well as Cloud Villa and Tian Hui in Beijing.
As at 30 June 2026, attributable contracted sales of approximately HK$1,242 million had yet to be
recognised in the accounts. It is anticipated that approximately HK$554 million will be recognised in
the second half of 2026 upon completion of the relevant developments and handover of the
completed units to buyers.
Investment Properties
As at 30 June 2026, the completed investment property portfolio attributable to the Group in the
Mainland amounted to approximately 13.9 million square feet, the details of which are as follows:
Total:
Gross floor area
attributable to the
Group*
(million sq. ft.)
9.6
4.3
13.9
Percentage
(%)
69
31
100
Total:
Gross floor area
attributable to the
Group*
(million sq. ft.)
2.2
7.3
2.5
1.9
13.9
Percentage
(%)
16
52
18
14
100
By type
Office
Commercial
By geographical area
Beijing
Shanghai
Guangzhou
Other
- Including lettable areas in the basement.
23
Corporate tenants continued to maintain a prudent approach to their leasing of premises, prioritising
cost reduction and operational efficiency. This restrained spending, together with the significant
volume of new supply, exerted sustained downward pressure on rentals in the Chinese Mainland
leasing market. During the first half of 2026, gross rental income attributable to the Group decreased
by 10% year on year in Renminbi terms. After accounting for the approximately 4% year-on-year
appreciation of the Renminbi against the Hong Kong Dollar, gross rental income attributable to the
Group decreased by 6% year on year to HK$866 million. Net rental income before taxation
attributable to the Group also decreased by 10% year on year to HK$594 million during the period.
In Beijing, World Financial Centre in Chaoyang Central Business District secured Publicis Groupe
S.A., a leading multinational advertising and communications company, as well as Sullivan &
Cromwell LLP as tenants during the first half of 2026. This progressively boosted the leasing rate of
this international Grade-A office complex to more than 60% at the end of June 2026. With its
reputable building quality, this development is expected to continue attracting corporate tenants that
prioritise quality.
In Shanghai, as at 30 June 2026, the office space of Henderson Metropolitan near the Bund was fully
leased, while the leasing rate for its shopping mall was close to 90%. The joint-venture project in the
Middle Huaihai Road business hub recorded an overall leasing rate of over 90%. The leasing rates
for the office developments at Grand Gateway II atop the Xujiahui subway station and Henderson
688 in Nanjing Road West business hub were approximately 80% and 70%, respectively. In addition,
the leasing rates of Greentech Tower and Centro adjacent to the Shanghai Railway Station were
approximately 70% and 60%, respectively. Lumina Shanghai, an integrated development with direct
access to Longyao subway station, is strategically located in the Xuhui Riverside Area, a hub for
culture, media and digital technology development in the city. The 61-storey iconic office tower of
Phase 1 of Lumina Shanghai provides approximately 1,800,000 square feet of Grade-A office space.
During the first half of 2026, an Intel group company was secured as a tenant, boosting the leasing
rate of this development to more than 70%. Its 200,000-square-foot shopping mall hosts an array of
food and beverage outlets, offering diverse dining options. The neighbouring 1,000,000-square-foot
Phase 2 development, Lumina Shanghai II, is home to many renowned automotive corporations,
achieving a leasing rate of 92%. The Pier, in which the Group has a 51% interest, is located in
Xinminyang area of Pudong. This newly completed development comprises two 11-storey office
buildings, one 12-storey office building and five commercial buildings, providing a total gross floor
area of about 830,000 square feet. As the Xinminyang area is positioned as a world-class waterfront
mixed-functional belt with close proximity to Lujiazui business hub, The Pier attracted leasing interest
from a number of financial institutions and multinational corporations.
In Guangzhou, Lumina Guangzhou, an integrated development atop the Haizhu Square interchange
station of two subway lines, is strategically located in this core city of the Guangdong-Hong KongMacao Greater Bay Area. Commanding panoramic views of the Pearl River, its 970,000-square-foot
Grade-A office twin towers attract many multinational corporations and international organizations
as tenants. During the first half of 2026, CLOROX, an American consumer goods manufacturer, was
secured as a tenant, boosting the leasing rate of this development to more than 80% at the end of
June 2026. Its 900,000-square-foot shopping podium and underground commercial area host a wide
variety of specialty eateries and movie theatres, offering customers a diverse dining and leisure
experience. The 600,000-square-foot Hengbao Plaza, located above the Changshou Road subway
station, continued to optimise its tenant mix to enhance its attractiveness, with a leasing rate close
to 80% at the end of June 2026.
In Shenzhen, Yunhui Tower, in which the Group has a 50% interest, was newly completed. Located
in Nanshan District with close proximity to the Nanyou West and Nanyou subway stations, this
commercial composite development comprises industrial R&D offices, supporting dormitory and
commercial facilities, providing a total gross floor area of approximately 400,000 square feet. Leasing
response for its industrial R&D office space has been positive, with the leasing rate reaching 93% at
the end of June 2026.
24
Property Management
Shanghai Starplus Property Management Co., Ltd. (“Starplus”) currently manages a portfolio
spanning four major cities (namely, Beijing, Shanghai, Guangzhou and Shenzhen) with a total floor
area of more than 14,000,000 square feet, including 5,400 car parking spaces in Chinese Mainland.
To ensure the highest service standards across all properties under its management, Starplus has
adopted management practices and professional accreditation standards that comply with ISO 9001
(Quality Management System), ISO 14001 (Environmental Management System), ISO 45001
(Occupational Health and Safety Management System), ISO 14064-1 (Specification with guidance
at the organisation level for quantification and reporting of greenhouse gas emissions and removals)
and ISO 50001 (Energy Management System). Its commitment to professionalism has been
extended to cover all properties under its management.
During the first half of 2026, eight properties under its management (including Lumina Shanghai I
and II, Henderson 688, Henderson Metropolitan, Greentech Tower and Centro in Shanghai, World
Financial Centre in Beijing, as well as Lumina Guangzhou in Guangzhou) were awarded the Gold
Seal for Carbon Audit Contribution (Chinese Mainland) at the Green and Sustainability Contribution
Awards 2026 organised by the Hong Kong Quality Assurance Agency. World Financial Centre in
Beijing and Lumina Guangzhou also received LEED v4.1 (Existing Building - Operations and
Maintenance) platinum certification from the U.S. Green Building Council and the Green Business
Certification Inc.. In addition, Lumina Shanghai I, Tower 2 of Lumina Shanghai II and Henderson 688
were honoured with the Spotlight Award, while Starplus won the Leadership Impact Award from the
International WELL Building Institute. All these achievements demonstrate that the Group’s
commitment to green living and sustainability for its Chinese Mainland properties is widely
recognised both locally and internationally.
25
Henderson Investment Limited (“HIL”)
HIL’s (unaudited) loss attributable to equity shareholders for the six months ended 30 June 2026
amounted to HK$22 million, representing an improvement from the loss attributable to equity
shareholders of HK$41 million recorded in the corresponding period in 2025.
HIL’s business activities are principally carried out by two wholly-owned subsidiaries:
(i) Citistore (Hong Kong) Limited operating five department stores under the name of “Citistore”
(hereinafter collectively referred to as “Citistore”); and (ii) Unicorn Stores (HK) Limited operating
two department stores with supermarkets (namely, “APITA” and “UNY”) and two supermarkets under
the name of “UNY” (hereinafter collectively referred to as “Unicorn”).
Over the years, HIL has been committed to integrating the operations of Citistore and Unicorn.
During the first half of 2026, HIL introduced a series of measures to achieve better synergies between
the two, including improving warehousing and logistics efficiency, optimising manpower allocation,
and reviewing and adjusting leasing arrangements. In addition, HIL continued to upgrade its “CU
APP” membership loyalty programme and strengthen member engagement, with the aim of
providing greater shopping convenience to its approximately 950,000 members.
(I) Citistore
Due to intense competition in the retail market, Citistore recorded a year-on-year decrease of
6% in the aggregate sales proceeds from the sales of own goods, consignment sales and
concessionaire sales for the six months ended 30 June 2026.
During the first half of 2026, Citistore’s sales of own goods decreased by 2% year on year to
HK$125 million, with the gross margin also declining to 30%. Citistore’s consignment sales
represent the sales of consignors’ products placed on designated shelves or in designated
areas under consignment arrangements, while concessionaire sales are conducted by
concessionaires operating from their own shop spaces within Citistore’s stores under licence
agreements. For both consignment and concessionaire sales, Citistore receives commission
income based on a revenue-sharing arrangement or a base commission (if any), whichever is
higher. During the period, proceeds from consignment and concessionaire sales decreased by
5% and 10% respectively, resulting in a 9% decline in total commission income from such
sales to HK$125 million.
After deducting operating expenses, Citistore recorded a profit after taxation of HK$7 million
for the six months ended 30 June 2026, representing a turnaround from the loss after taxation
of HK$7 million recorded in the corresponding period last year.
(II) Unicorn
Unicorn’s sales of own goods and consignment sales for the six months ended 30 June 2026
decreased by 7% year on year to HK$543 million.
After deducting operating expenses, Unicorn recorded a loss after taxation of HK$22 million
for the six months ended 30 June 2026, representing an improvement from the loss after
taxation of HK$30 million recorded in the corresponding period last year.
Looking ahead, HIL will continue to integrate and streamline the operations of Citistore and Unicorn,
with the aim of enhancing efficiency and reducing expenses. Notably, Citistore Tseung Kwan O store
will be relocated to another site within the same mall this September. With a refreshed new look, it
will collaborate with UNY Tseung Kwan O store to provide shoppers with a more comprehensive,
one-stop department store and supermarket shopping experience. In addition, HIL will continue to
expand the “CU APP” membership base and attract greater shopper patronage by optimising its
merchandise mix and intensifying promotional efforts.
26
Miramar Hotel and Investment Company, Limited (“Miramar”)
Miramar’s revenue for the six months ended 30 June 2026 amounted to HK$1,168.3 million,
representing a decrease of 9.8% against the corresponding period last year. Profit attributable to
shareholders increased by 3.0% to HK$331.6 million. Excluding the net change in fair value of
investment properties (after deducting non-controlling interests and related tax effects), the
underlying profit attributable to shareholders decreased by 3.0% to HK$331.7 million.
Hotels and Serviced Apartments Business
During the review period, the overall revenue from the hotels and serviced apartments business
amounted to HK$270.9 million, representing a decrease of 3.1% compared with the same period
last year. Earnings before interest, taxes, depreciation and amortization (EBITDA) amounted to
HK$59.7 million, representing an increase of 11.7% compared with the same period last year. During
the period, renovations and the smart Internet of Things (‘‘IoT’’) upgrades at The Mira Hong Kong
temporarily reduced its available room inventory by approximately 10%. Excluding guestrooms
temporarily unavailable for rental due to the aforementioned renovation projects, the occupancy
rates of The Mira Hong Kong and Mira Moon both exceeded 90%. The refurbishment works at The
Mira Hong Kong are scheduled for completion by the end of September this year, supporting
appropriate increases in room rates.
Property Rental Business
The revenue from the property rental business amounted to HK$395.0 million during the period,
while EBITDA amounted to HK$330.3 million, reflecting increases of 2.5% and 2.3%, respectively
compared with the corresponding period last year. Average occupancy rates for both its shopping
mall and offices exceeded 95%. Earlier this year, Mira Place launched ‘‘Mira ARTvenue’’, a brandnew outdoor cultural and art space at its northern entrance. Miramar also introduced the Mi+ ‘‘Mira
Commune’’ membership in the review period, specially tailored for its office and store tenants’
employees to forge deeper associated spendings with the office and store tenant community and
enrich exclusive member privileges. In addition, Miramar announced the acquisition of a 50%
effective interest in the properties of MPM Plaza in Mong Kok through a joint venture. The acquisition
is expected to be completed on or before 15 September 2026. Situated in a prime retail location in
Mong Kok, the project will help broaden Miramar’s property investment portfolio and diversify its
sources of income. The gross rental yield to be generated from the property is approximately 6.5%,
which is calculated based on the unaudited rental income for the year ended 31 March 2026.
Food and Beverage Business
During the period, the overall revenue from the food and beverage business amounted to HK$125.7
million, a decrease of 9.9% compared with the same period last year; EBITDA turned from a loss of
HK$2.8 million in the same period last year to a profit of HK$5.6 million. Notably, revenue from festive
foods rose by nearly 10% year on year, reflecting the success of the relevant products and
promotional strategies. Looking ahead to the second half of the year, Miramar will carry out
refurbishment works and add several private dining rooms at selected restaurants, and continue to
adjust its food and beverage offerings and promotional strategies.
Travel Business
During the period, travel business recorded revenue of HK$376.7 million, representing a decrease
of 23.2% compared with the same period last year; EBITDA loss was HK$6.4 million, compared with
an EBITDA profit of HK$15.4 million in the same period last year. During the period, the United
States-Israel-Iran war affected airspace safety across the Middle East, forcing the cancellation or
rerouting of flights and tour itineraries bound for Europe and other destinations via the region.
Compounded by airlines raising fuel surcharges, travel costs for passengers have risen further,
dampening the desire for air travel and significantly impacting the performance of the tourism
business.
27
Associated Companies
The Hong Kong and China Gas Company Limited (“HKCG”)
In the first half of 2026, HKCG recorded an after-tax operating profit for the period of HK$4,746
million, representing a 19% increase year on year. Profit attributable to shareholders grew by 23%
to HK$3,640 million.
Utility Businesses
Hong Kong Gas Business
Commercial gas consumption stood at 5,590 million MJ, while industrial gas consumption amounted
to 782 million MJ. On the residential side, gas sales fell by 544 million MJ to 8,042 million MJ. As at
30 June 2026, total town gas sales in Hong Kong had reached 14,414 million MJ (equivalent to
approximately 410 million cubic metres of natural gas), down 3.5% year on year. The customer base
stood at approximately 2.07 million, an increase of nearly 15,000 from year-end 2025. HKCG
adjusted its standard town gas tariff and monthly maintenance charge with effect from 1 August 2026.
Mainland Gas Business
As at 30 June 2026, HKCG’s city-gas projects on the Chinese mainland, including its subsidiary
Towngas Smart Energy Company Limited (“Towngas Smart Energy”, stock code: 1083), totalled 325
across 23 provincial regions. During the period, 690,000 new customers were added, bringing the
total to 44.96 million. Total gas sales volume for the first half reached 18,600 million cubic metres,
broadly flat year on year. Cost pass-throughs were fully completed for industrial and commercial
users, while the pass-through ratio for residential users exceeded 90%. With cost pass-throughs
now largely in place, the dollar margin for city gas was RMB0.55 per cubic metre in the first half of
the year, a further improvement of RMB0.01 per cubic metre year on year.
During the period, HKCG coordinated and dispatched 2,840 million cubic metres of gas, accounting
for 15% of gas sales. HKCG strengthened its strategic cooperation with the three major national
petroleum corporations and provincial gas platforms, by adopting a model of centralised negotiation
and decentralised signing to secure medium- to long-term procurement contracts. Simultaneously,
HKCG broadened access to coalbed methane and liquefied natural gas (“LNG”) resources from
Shaanxi, Shanxi and Ningxia to diversify supply channels and hedge against market volatility.
HKCG pressed ahead with its core “Gas+” strategy, accelerating its transformation from a traditional
city-gas enterprise into an integrated energy services provider. Through continuous refinement of its
business framework and product portfolio, the business achieved energy sales of 1,630 million kWh,
driving associated natural gas sales of 110 million cubic metres.
In the biomethane operation, HKCG currently operates 12 projects across Jiangsu, Zhejiang,
Shandong, Sichuan and other provinces. In the first half of 2026, newly integrated gas volume
reached 10 million cubic metres, bringing the cumulative total to 44.5 million cubic metres.
Separately, the Bringing Hydrogen into Households project in Weifang, Shandong Province, is
expected to commence trial operations shortly. In its industrial hydrogen-blending operation, HKCG
has built the Chinese mainland’s first integrated testing and verification platform for hydrogenblended combustion at industrial end-users in Zhangjiagang, Jiangsu Province.
Water and Environmental Businesses
In the first half of the year, water sales and sewage treatment volume reached 800 million tonnes,
up 2% year on year, while solid waste treatment volume reached 830,000 tonnes, a year-on-year
increase of 5%. Wujiang Hua Yan, a subsidiary of HKCG, saw its pipeline leakage management
project recognised as a national typical case of AI application scenarios, which has been developed
28
into a standardised product for external distribution. With regard to the low-carbon transition front,
Suzhou Qingyuan Hua Yan became the first water company in Jiangsu Province to be awarded
“Green Factory” status for its support of Suzhou’s zero-carbon smart industrial park initiative.
Growth Businesses
Renewable Energy Business
As at 30 June 2026, HKCG’s subsidiary Towngas Smart Energy had established 128 zero-carbon
smart industrial parks across 24 provincial regions on the Chinese mainland. New grid-connected
distributed photovoltaic capacity for industrial and commercial customers increased by 0.2 GW,
bringing cumulative installed capacity to 3 GW. Photovoltaic electricity sales volume grew 12% year
on year to 1,320 million kWh.
During the first half, HKCG leveraged its Assets under Management (“AuM”) strategy, increasing
AuM by 0.66 GW year on year to 1.5 GW. By capitalising on synergies with the gas sector, the
electricity sales business grew rapidly, recording sales of 7,230 million kWh (double that of the same
period in 2025). Additionally, cumulative grid-connected industrial and commercial energy storage
capacity reached 850 MWh.
During the period, Towngas Smart Energy successfully launched the “New Energy Infrastructure
Carbon Neutral Green Held-for-Investment Real Estate Asset-Backed Plan” (“institutional REIT”)
and “Zero-Carbon Smart Phase 4” asset-backed securities programme (“quasi-REIT”), raising
approximately RMB900 million in financing. Cumulative financing reached RMB5,500 million.
To support customers’ low-carbon transition, HKCG introduced a new business model, the Energy
as a Service (“EaaS”) framework, with integrated decarbonisation solutions encompassing
“photovoltaics + energy storage + electricity sales”. HKCG also increased investment in new
technology by upgrading its smart energy management platform. Using artificial intelligence (“AI”) to
optimise power trading algorithms, the platform improves the operation of new energy assets and
iterative trading strategies for enhanced investment returns.
Sustainable Aviation Fuel
EcoCeres, Inc. (“EcoCeres”), a company incubated by HKCG and in which it remains a strategic
shareholder, commenced trial production at its Malaysia plant in 2025. In the first half of the year,
overall sales volume of green fuels including sustainable aviation fuel (“SAF”) recorded strong growth,
reaching 320,000 tonnes, approximately doubled year on year. During the period, EcoCeres
extended its SAF supply agreement with British Airways through to the end of 2030. EcoCeres and
the Dongguan Municipal Government signed an investment letter of intent to establish the Greater
Bay Area’s first complete SAF value chain. The project is expected to produce approximately
450,000 tonnes of SAF and hydrotreated vegetable oil (“HVO”) annually. EcoCeres is also actively
exploring new application scenarios for its products. Its HVO is now being used as an alternative fuel
for data centre backup generators and has been deployed in the first pilot projects using HVOpowered backup generators on the Chinese mainland and in Southeast Asia.
Green Fuels and Chemicals
VENEX, a joint venture under HKCG, achieved multiple breakthroughs in the first half of 2026. Its
production capacity is concentrated on three major port clusters. At its project in Inner Mongolia, the
company is ramping up capacity to 300,000 tonnes, primarily serving North China ports. In Foshan,
a new project is progressing steadily towards its expected 2028 commissioning, when it will have an
anticipated capacity of 200,000 tonnes to serve ports in South China, Hong Kong and Southeast
Asia. Together, these facilities establish a strategic dual-base footprint across northern and southern
China. There are also plans to establish a new plant in East China, for which VENEX is currently
seeking domestic and overseas partners. In terms of market supply chains and sales, following sales
of 16,400 tonnes in 2025 and the expansion of coverage to major domestic ports as well as overseas
29
markets such as Singapore and South Korea, the company completed Hong Kong’s first container
terminal bunkering operation during the period. The green methanol sold was transported from the
Inner Mongolia plant to Hong Kong using cross-boundary logistics, marking the completion of a fully
integrated supply chain from northern China to Hong Kong and laying the groundwork for the Hong
Kong market. During the period, HKCG also received one of the first certifications under the country’s
Global Sustainable Transport Certification (GSTC) scheme, adding to its existing international ISCC
and ISO product carbon footprint certifications.
Hydrogen Energy
Hong Kong’s first hydrogen-powered EV charging system in a commercial building was officially
launched in April this year. Then, in May, HKCG signed a memorandum of understanding with 10
local and international enterprises to further develop Hong Kong’s hydrogen energy ecosystem on a
joint basis. Key objectives include producing green hydrogen from biogas collected at landfills and
deploying and promoting hydrogen commercial vehicles and hydrogen generators in Hong Kong.
HKCG is also promoting the application of hydrogen power generation at construction sites and
charging facilities. Its second-generation hydrogen generator offers three times the power output of
the first generation and will be adopted at Central Yards, using green hydrogen produced from landfill
biogas. This will make the construction site the first in Hong Kong to use green hydrogen for power
generation. HKCG will continue to advance government-approved hydrogen fuel technology trial
projects, including extracting hydrogen from the existing town gas network at the Shau Kei Wan site
to generate electricity for site offices. In addition, Hong Kong’s first green hydrogen project, which is
being developed at the Tseung Kwan O New Territories South East Landfill Extension, is expected
to commence production in the fourth quarter of this year.
Extended Businesses
HKCG operates in a vast market of 47 million city-gas customers across Hong Kong and Chinese
Mainland. Towngas Lifestyle, a subsidiary of HKCG, has been accelerating its transformation into a
service-driven one-stop home concierge service model. It is focused on three core business pillars:
smart kitchens, insurance and home safety. By increasing engagement with its existing customer
base, Towngas Lifestyle is improving conversion rates and driving progressively faster business
growth. In the first half of the year, Towngas Lifestyle delivered continued growth, with revenue
reaching HK$2,200 million, up 11% year on year, and net profit of HK$307 million, up 19% year on
year. In Hong Kong, smart kitchen revenue in the first half of the year reached HK$870 million, up
7% year on year, with retail contributing HK$770 million, an increase of 19%. For project-based
kitchen cabinets, contracts for 2,471 new sets were secured in the first half of the year, achieving
82% of the annual target. White goods sales exceeded 7,500 units, representing 62% of the full-year
target. On the Chinese mainland, trade-in sales of the smart kitchen appliances business rose 17%
year on year to RMB200 million. The heating engineering business grew 14% year on year to
RMB120 million, and a dedicated Heating, Ventilation, and Air Conditioning (“HVAC”) company was
established to provide one-stop Integrated HVAC solutions. In the insurance business, the share of
home property comprehensive insurance in total insurance sales rose to 82%. Smart device
connections reached 440,000 households. In the first half of the year, HKCG launched a
subscription-based safety platform service to address diverse consumer needs for home safety,
achieving a 7% conversion rate. After opening community service stations in Hangzhou and
Zhongshan, HKCG will continue to extend these stations to more cities nationwide with a view to
forming a proprietary community service network. Towngas Lifestyle has also been fully embracing
AI technologies, upgrading its Towngas Cloud Platform and artificial intelligence of things (“AIoT”)
ecosystem. By promoting the use of integrated AI agents in home scenarios, Towngas Lifestyle is
enabling its customers to enjoy higher-quality smart services.
30
Hong Kong Ferry (Holdings) Company Limited (“Hong Kong Ferry”)
Hong Kong Ferry’s underlying profit for the six months ended 30 June 2026 was HK$73 million,
representing an increase of approximately 5.7% from the same period last year. After taking into
account the fair value change of the investment properties, Hong Kong Ferry’s profit attributable to
shareholders for the six months ended 30 June 2026 was HK$80 million, representing a decrease
of approximately 34.5% from the same period last year.
Property Development and Investment Operations
Hong Kong Ferry’s gross rental income arising from the commercial arcades, shops and youth hostel
during the period under review amounted to HK$97 million, an increase of 60% as compared with
the same period last year. During the period under review, the commercial arcades of Metro6 were
fully let. The occupancy rates of the commercial arcades of Shining Heights and The Spectacle were
70% and 91% respectively, and the occupancy rates of the commercial arcades of Green Code
Plaza and Metro Harbour Plaza were 94% and 93% respectively. Thirty-three residential units of its
joint venture development project (namely, The Royale) remain unsold, of which ten residential units,
together with 106 private car parking spaces and 18 motorcycle parking spaces, have been leased
out under short-term tenancy agreements. It has been over a year since Hong Kong Ferry, in
collaboration with Tung Wah Group of Hospitals, commenced the project to convert two residential
towers of “The Symphonie” into the “TN Residence” youth hostel. The car park of the property also
commenced operations in April 2026, of which two private car parking spaces and one motorcycle
parking space have been leased out on a short-term basis. Following Hong Kong Ferry’s completion
of the acquisition of various shops at Portion A of Ground Floor and signage areas of Tai Hung Fai
(Tsuen Wan) Centre located at 55 Chung On Street, Tsuen Wan on 30 September 2025, it has
completed the reconfiguration of shop layouts and carried out renovations to enhance the property’s
image. The optimised signage area and the reinstalled new LED screen have increased the
advertising spaces available for lease. Hong Kong Ferry has also successfully introduced financial
institution to lease the shops, thereby enhancing the property’s rental return. As at 30 June 2026, all
shops had been leased out.
Ferry, Shipyard and Related Operations
During the period under review, the Ferry, Shipyard and Related Operations recorded a deficit of
approximately HK$9 million, a decrease of approximately HK$3.4 million as compared to the deficit
in the same period last year. The decrease in deficit was primarily attributable to an increase in
overall revenue, which offset part of the losses arising from the dangerous goods vehicular ferry
services caused by rising oil prices. Hong Kong Ferry successfully applied to the Transport
Department in June 2026 for a fare increase for the “North Point - Kwun Tong” dangerous goods
vehicular ferry service. The new fares took effect on 27 June 2026 and are expected to reduce losses
in the second half of the year.
Medical, Healthcare and Beauty Services
Hong Kong Ferry’s medical, healthcare and beauty services recorded a profit of approximately
HK$1.3 million during the period under review. Its “Total HealthCare” brand has now established
three “Total HealthCare Health Centres” at Mira Place, Tsim Sha Tsui, Metro Harbour Plaza, Tai
Kok Tsui, and Tai Hung Fai (Tsuen Wan) Centre. AMOUR Aesthetic expanded its leased area at
Mira Place, Tsim Sha Tsui, to deliver an elevated experience for its clientele. Hong Kong Ferry
established a specialist centre at H Zentre, Tsim Sha Tsui through a joint venture. Its performance
has been steadily on the rise and recorded a profit. The specialist centre was renamed “Alliance
Medical Centre” as part of a brand revitalisation initiative in November 2025. Together with another
service point at Mira Place, it operates under a dual-centre model. Hong Kong Ferry also partnered
with a professional sports and fitness centre in Hong Kong with over twenty years of experience to
establish a physiotherapy centre at H Zentre in August 2025. Since the second half of 2024, Hong
Kong Ferry has launched a medical equipment leasing business, jointly investing with specialist
doctors to acquire medical devices for rental to hospitals and doctors.
31
Sunlight Real Estate Investment Trust (“Sunlight REIT”)
For the six months ended 30 June 2026, Sunlight REIT recorded revenue of HK$382.4 million, a
year-on-year decline of 2.2%. After deducting property operating expenses of HK$82.7 million, net
property income came in at HK$299.7 million. Aided by a 7.9% saving in cash interest expense to
HK$84.3 million, distributable income for the six months ended 30 June 2026 was HK$164.0 million,
a 2.7% drop from the corresponding period in the previous year.
At 30 June 2026, the overall occupancy rate of Sunlight REIT’s portfolio stood at 90.8% (31
December 2025: 90.6%). Occupancy rates of the office and retail portfolios came in at 92.0% and
88.4% respectively, while their corresponding passing rents were HK$30.6 per sq. ft. and HK$62.2
per sq. ft., down 1.3% and 2.7% from six months ago. The portfolio recorded a negative rental
reversion of 7.6% for the period under review, while the average retention rate achieved a
satisfactory level of 77%.
Dah Sing Financial Centre, the flagship office property of Sunlight REIT, recorded an occupancy of
91.8%, while its passing rent stayed largely unchanged at HK$35.2 per sq. ft. A similar level of
occupancy was achieved by the Sheung Wan/Central portfolio, reflecting the spillover demand from
Central. In respect of the service-driven office portfolio located in Mong Kok, the occupancy of
Righteous Centre was 88.0%, while its neighbouring property, The Harvest, recorded an occupancy
level of 95.7%.
Regarding the retail portfolio, the occupancy of Sheung Shui Centre Shopping Arcade came in at
86.9%, mainly attributable to the prolonged vacancy pending the replacement of a kindergarten
tenant. Passing rent of this property was HK$98.2 per sq. ft. Meanwhile, Metro City Phase I Property
reported an occupancy rate of 88.0%, while its passing rent was HK$52.0 per sq. ft. Finally, the
occupancy rate of Kwong Wah Plaza Property in Yuen Long was 92.8%, while its passing rent stood
at HK$51.7 per sq. ft.
For the period under review, Sunlight REIT successfully refinanced all borrowings maturing in the
year ending 31 December 2026 at favourable pricing. Total borrowings of Sunlight REIT amounted
to HK$5,023 million at 30 June 2026, including a drawdown of HK$30 million from its revolving credit
facilities which was repaid in full on 2 July 2026. Subsequent to the implementation of certain
refinancing arrangements, the secured loan portion currently stood at HK$2,600 million (31
December 2025: HK$2,100 million) and was backed by a mortgage over certain properties with an
appraised value of HK$7,187 million. The weighted average debt maturity was maintained at 3.0
years, and all term loans are structured as sustainability-linked loans.
Looking ahead, approximately 14.0% and 22.3% of the office and retail rentable areas of Sunlight
REIT are scheduled for lease renewals in the second half of 2026, respectively. In light of prevailing
market conditions, improving occupancy across the portfolio will be key to mitigating the impact of
negative rental reversion. In approaching its 20th listing anniversary, Sunlight REIT will endeavour
to create sustainable value for the benefit of unitholders, while harnessing innovation and technology
to bolster portfolio robustness and support future-ready asset management.
32
CORPORATE FINANCE
The Group has always adhered to prudent financial management principles. As at 30 June 2026,
net debt amounted to HK$58,432 million (31 December 2025: HK$60,219 million) and the financial
gearing ratio was 17.9% (31 December 2025: 18.7%). In addition, shareholders’ loans to the Group,
which have consistently been the Group’s stable source of funding, amounted to HK$76,955 million
as at 30 June 2026 (31 December 2025: HK$80,618 million).
Sustainable finance is integral to the Group’s financing strategy and reflects its commitment to
sustainable development. The Group’s Sustainable Finance Framework covers a wide range of
eligible financing transactions, with proceeds applied to projects that deliver environmental and
social benefits to the community. A Second-Party Opinion was obtained from Moody’s Ratings,
which assigned a Sustainability Quality Score of “SQS2 (Very good)” to the Group’s Sustainable
Finance Framework. During the period, the Group closed Hong Kong’s first biodiversity loans with
HSBC and Hang Seng Bank to support biodiversity-enhancing initiatives at Central Yards, the
Group’s flagship mixed-use development on the New Central Harbourfront. This pioneering facility
aligned with the Green Loan Principles of the Loan Market Association, the Asia Pacific Loan Market
Association, and the Loan Syndications and Trading Association, with a specific focus on urban
biodiversity restoration, conservation and enhancement. In addition, the Group has received wide
recognition for its commitment to environmental protection in its property development projects.
Numerous world-class sustainability awards, certifications and professional accreditations have
been conferred by various international and local professional rating agencies. Since 2020, green
credit and sustainability loan facilities exceeding HK$50,000 million have been secured on
favourable terms. Among them was a Social Loan, the first of its kind ever obtained by a property
developer in Hong Kong. Under the terms of the loan, the Group is required to fulfill its social
responsibility and realise its broader 2030 Sustainability Vision. The Group’s iconic development,
The Henderson, was honoured with the Special Citation on Green Financing by the Hong Kong
Green Building Council. The Group’s HK$5,000 million bilateral multi-tranche sustainability-linked
loan and social loan, extended by DBS Bank (Hong Kong) Limited and closed in the previous year,
were awarded Best Sustainability Loan – Hong Kong in The Asset Triple A Awards for Sustainable
Finance 2026. These accolades underscore the Group’s strong credibility and environmental
commitment, earning widespread recognition from the international financial and professional
communities.
33
Sustainability
Recognising its continuous commitment and performance in sustainability, the Group was included
in the Dow Jones Best-in-Class World Index for the first time by S&P Global, alongside its inclusion
in the Asia Pacific Index and the 2026 Sustainability Yearbook (Global and China Edition). This
placed the Group among the top 10% of the largest 2,500 companies assessed worldwide – a
significant milestone as one of the sustainability leaders. At the Real Estate Asia Awards 2026, the
Group was recognised as Developer of the Year – Asia, and for the fourth consecutive year,
Developer of the Year – Hong Kong. Locally, the Group demonstrated excellence in all three areas
of ESG (Environmental, Social and Governance), and was awarded the Grand ESG Award at the
Hong Kong Investor Relations Awards 2026. In addition, at the 15th Junzi Corporation Awards, the
Group was the only corporate to win the grand Junzi Corporation Award for Exemplary Business
Practices for the second consecutive year, in recognition of its commitment to ethical business
principles and outstanding contributions to industry progress and community wellbeing.
The Group’s G.I.V.E sustainability strategy goes beyond embedding sustainability at the core of its
developments and operations. During the period under review, the Group participated actively in the
World Green Building Council as a Partner of its Asia Pacific Regional Network; the Hong Kong
Green Building Council as Director and Expert Group Members; the Business Environment Council
as Committee Members at its Advisory Groups, advancing industry sharing and supporting the
development of Hong Kong's first Five-Year Plan in the sustainability space. The Group also
continued to sponsor the student ESG challenge that brought together talent from ten local
universities to foster multi-disciplinary collaboration.
34
PROSPECTS
Despite the ongoing Middle East war and disrupted oil shipping routes, Hong Kong’s economic
fundamentals remain stable. To proactively align with the National 15th Five-Year Plan, the HKSAR
Government will formulate Hong Kong’s first five-year plan (2026–2030) for economic and social
development. This initiative will help Hong Kong better integrate into and serve the overall national
development, thereby fostering long-term economic growth for the city.
The Group recently completed the acquisition of all projects spanning Whampoa Street and Baker
Street in Hung Hom. Together with other urban redevelopment projects with 100% ownership
interest or where the relevant compulsory sale application threshold has been met, the total
developable gross floor area attributable to the Group amounted to approximately 1.5 million square
feet. In addition, the Group’s land bank in the New Territories was approximately 38.4 million square
feet, continuing to represent the largest holding among property developers in Hong Kong. The
Group’s land bank will be sufficient to meet its development needs in the coming years.
Property sales — The Group plans to launch eight development projects in Hong Kong for sale in
the second half of 2026. Together with the remaining stock, a total of about 1,700,000 square feet of
residential gross floor area or about 3,400 residential units attributable to the Group, as well as about
180,000 square feet of office/industrial space, are expected to be available for sale in Hong Kong in
the second half of 2026. At the end of June 2026, attributable sales of Hong Kong and Mainland
properties not yet recognised in the accounts, amounted to approximately HK$18,303 million in
aggregate. Of this, approximately HK$6,919 million is expected to be recognised in the accounts in
the second half of 2026 upon completion of the relevant developments and handover of the
completed units to buyers.
Investment Properties — Following the recent completion of The Henderson, which was honoured
as the World’s Best Property, Phase 1 of Central Yards - another flagship development of the Group
located at the New Central Harbourfront - is also expected to be completed in the second half of this
year. This will expand the Group’s investment property portfolio in Hong Kong to an attributable gross
floor area of 11.5 million square feet at the end of 2026 and further enhance its position in the city’s
Central Business District. Notably, a financial institution has signed an agreement to lease 70%, over
223,000 square feet, of Phase 1 office and ancillary space, thereby injecting growth trajectory into
the Group’s recurrent rental income.
Listed Subsidiaries and Associates — These provide the Group with another source of recurring
income. HKCG, in particular, operates in a vast market of 47 million city-gas customers across Hong
Kong and Chinese Mainland. EcoCeres, an associate of HKCG, commenced trial production at its
Malaysia plant in 2025. In the first half of the year, overall sales volume of green fuels including
sustainable aviation fuel (“SAF”) recorded strong growth, reaching 320,000 tonnes, approximately
doubled year on year. During the period, EcoCeres and the Dongguan Municipal Government signed
an investment letter of intent to establish the Greater Bay Area’s first complete SAF value chain,
further consolidating its leading market position. Together with continuous expansion into other
growth businesses, HKCG will deliver sustainable returns to the Group.
Founded in 1976, the Group has experienced rapid business growth over the past 50 years,
emerging as a leading property developer in Hong Kong — an achievement made possible by the
unwavering professionalism and dedication of every staff member, who has laid a solid foundation
for the Group. Supported by robust financial strength and three core business pillars — property
sales, leasing and listed subsidiaries and associates — the Group is poised to build upon its
extraordinary legacy spanning half a century, drive sustainable development, and open a new
chapter for the future.
35
TRIBUTE
Mr Kwong Che Keung, Gordon, an Independent Non-executive Director of the Company, the
chairman of the Audit Committee and the Corporate Governance Committee, and a member of the
Remuneration Committee and the Nomination Committee, passed away on 6 July 2026. Mr Kwong
had served as a director of the Company since 2004. Over his 22-year tenure, he made invaluable
contributions to the Company. The Board deeply mourns the passing of Mr Kwong.
Dr Lee Ka Kit
Dr Lee Ka Shing
Chairman
Chairman
Hong Kong, 20 August 2026
36
BUSINESS RESULTS
Consolidated Statement of Profit or Loss
for the six months ended 30 June 2026 – unaudited
Note
4, 11(a)
For the six months ended 30 June
2026
2025
HK$ million
HK$ million
17,203
(10,884)
9,552
(5,929)
6,319
3,623
92
305
(899)
(512)
Administrative expenses
(1,099)
(1,112)
Profit from operations before changes in fair
value of investment properties and investment
properties under development
4,413
2,304
(836)
(427)
3,577
1,877
(1,190)
(1,205)
Bank interest income
312
272
Net finance costs
(878)
(933)
Share of profits less losses of associates
1,580
1,280
Share of profits less losses of joint ventures
1,131
338
7
5,410
2,562
8
(554)
430
4,856
2,992
Revenue
Direct costs
Other net income
5
Selling and marketing expenses
Decrease in fair value of investment properties and
investment properties under development
Profit from operations after changes in fair value
of investment properties and investment
properties under development
Finance costs
Profit before taxation
Income tax (expense)/credit
Profit for the period
37
6
7(a)
Consolidated Statement of Profit or Loss
for the six months ended 30 June 2026 - unaudited (continued)
Note
For the six months ended 30 June
2026
2025
HK$ million
HK$ million
Attributable to:
Equity shareholders of the Company
Non-controlling interests
4,090
766
2,908
84
4,856
2,992
Earnings per share based on profit attributable to
equity shareholders of the Company
(reported earnings per share)
9(a)(i)
Basic
HK$0.84
HK$0.60
Diluted
9(a)(ii)
HK$0.81
HK$0.60
Earnings per share excluding the effects of the
Group’s aggregate attributable share
of changes in fair value of
investment properties and
investment properties under development
(net of deferred tax)
(underlying earnings per share)
Basic
9(b)
HK$1.05
HK$0.63
Diluted
9(b)
HK$1.00
HK$0.63
Profit for the period
Details of dividends payable to equity shareholders of the Company are set out in note 10.
38
Consolidated Statement of Profit or Loss and Other Comprehensive
Income for the six months ended 30 June 2026 - unaudited
For the six months ended 30 June
2026
2025
HK$ million
HK$ million
4,856
2,992
6
33
(27)
(16)
Items that may be reclassified subsequently to
profit or loss:
- Exchange differences
- Cash flow hedges
- Share of other comprehensive income of
associates and joint ventures
1,671
49
662
(173)
1,378
903
Other comprehensive income for the period
3,077
1,409
Total comprehensive income for the period
7,933
4,401
Attributable to:
Equity shareholders of the Company
Non-controlling interests
7,142
791
4,293
108
Total comprehensive income for the period
7,933
4,401
Profit for the period
Other comprehensive income for the period-net,
after tax and reclassification adjustments:
Items that will not be reclassified to profit or loss:
- Investments in equity securities designated as
financial assets at fair value through other
comprehensive income (non-recycling)
- Share of other comprehensive income of
associates and joint ventures
39
Consolidated Statement of Financial Position
at 30 June 2026
At 30 June
2026
(unaudited)
HK$ million
At 31 December
2025
(audited)
HK$ million
280,573
6,189
731
262
89
51,948
81,993
330
4,186
1,541
276,134
6,192
833
262
91
51,435
82,630
271
4,978
1,564
427,842
424,390
430
73,534
12,218
1,876
21,477
432
79,621
11,589
1,151
22,198
109,535
114,991
25,694
2,503
268
6,470
491
1,351
24,528
2,023
277
6,534
2,797
937
36,777
37,096
Net current assets
72,758
77,895
Total assets less current liabilities
500,600
502,285
Note
Non-current assets
Investment properties
Other property, plant and equipment
Right-of-use assets
Goodwill
Trademarks
Interest in associates
Interest in joint ventures
Derivative financial instruments
Other financial assets
Deferred tax assets
Current assets
Deposits for acquisition of properties
Inventories
Trade and other receivables
Cash held by stakeholders
Cash and bank balances
12
13
Current liabilities
Trade and other payables
Amounts due to related companies
Lease liabilities
Bank loans
Guaranteed notes
Tax payable
14
40
Consolidated Statement of Financial Position
at 30 June 2026 (continued)
At 30 June
2026
(unaudited)
HK$ million
At 31 December
2025
(audited)
HK$ million
53,547
8,403
7,210
76,955
1,285
567
496
16
8,772
54,422
8,001
7,120
80,618
1,520
513
593
16
8,596
157,251
161,399
343,349
340,886
Share capital
Other reserves
52,345
273,210
52,345
270,119
Total equity attributable to equity
shareholders of the Company
325,555
322,464
Non-controlling interests
17,794
18,422
TOTAL EQUITY
343,349
340,886
Note
Non-current liabilities
Bank loans
Guaranteed notes
Convertible bonds
Amount due to a fellow subsidiary
Amounts due to related companies
Derivative financial instruments
Lease liabilities
Provision for reinstatement costs
Deferred tax liabilities
NET ASSETS
CAPITAL AND RESERVES
41
Notes:
1
Review of results
The interim results set out in this preliminary announcement do not constitute the
Group’s condensed interim financial statements for the six months ended 30 June
2026 but are extracted from those financial statements.
The condensed interim financial statements comprise those of Henderson Land
Development Company Limited (“the Company”) and its subsidiaries (collectively
referred to as “the Group”) and have equity accounted for the Group’s interests in
associates and joint ventures.
The condensed interim financial statements are unaudited, but have been reviewed by
KPMG in accordance with Hong Kong Standard on Review Engagements 2410,
Review of interim financial information performed by the independent auditor of the
entity issued by the Hong Kong Institute of Certified Public Accountants (“HKICPA”).
KPMG’s independent review report to the Company’s Board of Directors is included in
the interim report to be sent to the Company’s shareholders. In addition, the
condensed interim financial statements have been reviewed by the Company’s Audit
Committee with no disagreement.
2
Basis of preparation
The condensed interim financial statements have been prepared in accordance with
the applicable disclosure provisions of The Rules Governing the Listing of Securities
on The Stock Exchange of Hong Kong Limited (“Listing Rules”), including compliance
with Hong Kong Accounting Standard (“HKAS”) 34, Interim financial reporting as
issued by the HKICPA. They were authorised for issuance on 20 August 2026.
The condensed interim financial statements have been prepared in accordance with
the same accounting policies adopted in the Group’s consolidated financial statements
for the year ended 31 December 2025 (“the 2025 financial statements”), except for the
accounting policy changes that are expected to be reflected in the Group’s
consolidated financial statements for the year ending 31 December 2026. Details of
these changes in accounting policies are set out in note 3.
The condensed interim financial statements contain condensed consolidated financial
statements and selected explanatory notes. The notes include an explanation of
events and transactions that are significant to an understanding of the changes in
financial position and performance of the Group since the 2025 financial statements.
The condensed interim financial statements and notes thereon do not include all of the
information required for the preparation of a full set of financial statements in
accordance with HKFRS Accounting Standards, which collective term includes all
applicable individual Hong Kong Financial Reporting Standards (“HKFRSs”), HKASs
and Interpretations as issued by the HKICPA.
42
2
Basis of preparation (continued)
The financial information relating to the financial year ended 31 December 2025 that
is included in the condensed interim financial statements for the six months ended 30
June 2026 as comparative information does not constitute the Company’s statutory
annual consolidated financial statements for that financial year but is derived from
those financial statements. Further information relating to such statutory financial
statements required to be disclosed in accordance with section 436 of the Hong Kong
Companies Ordinance (Cap. 622) is as follows:
The Company has delivered the financial statements for the year ended 31 December
2025 to the Registrar of Companies as required by section 662(3) of, and Part 3 of
Schedule 6 to, the Hong Kong Companies Ordinance (Cap. 622).
The Company’s auditor has reported on those financial statements. The auditor’s
report was unqualified; did not include a reference to any matters (including those
matters described in the “Key Audit Matters” section) to which the auditor drew
attention by way of emphasis without qualifying its report; and did not contain a
statement under sections 406(2), 407(2) or (3) of the Hong Kong Companies
Ordinance (Cap. 622).
3
Changes in accounting policies
The HKICPA has issued a number of amendments to HKFRS Accounting Standards
that are first effective for the current accounting period.
Of these, only the
amendments to HKFRS 9, Financial instruments and HKFRS 7, Financial instruments:
disclosures – Amendments to the classification and measurement of financial
instruments, are relevant to the Group’s financial statements. The impacts of
adopting these amendments are discussed below.
43
3
Changes in accounting policies (continued)
Amendments to HKFRS 9, Financial instruments and HKFRS 7, Financial instruments:
disclosures – Amendments to the classification and measurement of financial
instruments
The amendments cover three main aspects:
The amendments clarify when a financial asset or a financial liability is recognised
and derecognised. They also introduce an optional exception that permits an
entity to derecognise a financial liability before the settlement date when the
financial liability is settled in cash using an electronic payment system, provided
that certain specific criteria are met.
For the assessment of whether a financial asset has contractual cash flows that
are solely payments of principal and interest on the principal amount outstanding,
the amendments clarify the assessment of interest and introduce an additional test
for the financial assets with contingent features. The amendments also clarify the
difference between financial assets with non-recourse features and contractuallylinked instruments which may then change the applicable assessments.
The amendments introduce new disclosures for disposals of investments in equity
instruments designated as financial assets at fair value through other
comprehensive income, and for financial instruments not measured as financial
assets at fair value through profit or loss which contain contractual terms that could
change the amount of contractual cash flows based on the occurrence or nonoccurrence of a contingent event that does not relate directly to changes in basic
lending risks and costs.
Upon the adoption of the amendments, the Group has elected to apply the exception
for the derecognition of certain trade payables settled in cash using qualifying
electronic payment system.
Under the exception, these trade payables are
derecognised when the Group has initiated a payment instruction through a qualifying
electronic payment system and, as a result, the Group no longer has the practical
ability to withdraw, stop or cancel the payment instruction and to access such cash to
be used for settlement and the settlement risk associated with the payment system is
insignificant. The Group has applied this election consistently to all settlements made
through the same qualifying electronic payment system.
The Group has applied the amendments retrospectively. As permitted by transition
requirements, the Group has not restated the reported figures of the prior periods.
The application of the amendments and the abovementioned exception do not have a
material impact on the Group’s consolidated financial statements for the periods
presented.
The Group has not applied any new standard, amendment to standard or interpretation
to HKFRSs and HKASs that is not yet effective for the current accounting period.
44
4
Revenue
Revenue of the Group represents revenue from property development (including sales
of properties), rental income, operation and management of department stores and
supermarket-cum-stores, hotel room operation and other businesses mainly including
income from hotel management (other than hotel room operation), construction,
provision of finance, investment holding, project management, property management,
agency services, security guard and cleaning services, food and beverage operation,
travel operation, as well as the trading of building materials.
The major items are analysed as follows:
For the six months ended 30 June
Property development (including sales of
properties)
Rental income
Department stores and supermarket-cum-stores
operations (note (i))
Hotel room operation
Other businesses
Total (note 11(b))
2026
HK$ million
2025
HK$ million
11,796
3,357
4,008
3,363
698
157
1,195
745
156
1,280
17,203
9,552
Note:
(i)
Including commission income earned from consignment and concessionaire counters of the department
stores operation, and the commission income earned from consignment counters of the supermarketcum-stores operation, in the aggregate amount of HK$154 million for the six months ended 30 June 2026
(2025: HK$172 million).
In accordance with HKFRS 15, Revenue from contracts with customers, (i) revenue
from sale of properties and sales of goods from department stores and supermarketcum-stores operations (including the commission income from consignment and
concessionaire counters) are recognised at a point in time; and (ii) revenue from hotel
room operation and promotion income from department stores and supermarketcum-stores operations are recognised over time. Rental income recognised from
HKFRS 16, Leases is categorically classified as revenue from other sources. In
respect of the Group’s other businesses, revenue from construction, property
management, asset management, project management, security guard and cleaning
services in the aggregate amount of HK$485 million (2025: HK$459 million) is
recognised over time while the remaining is recognised at a point in time.
At 30 June 2026, the cumulative aggregate amount of revenue expected to be
recognised in the consolidated statement of profit or loss in the future from precompletion sales contracts entered into in relation to the Group’s properties held
for/under development for sale and completed properties for sale held by the Group’s
subsidiaries, which are pending assignment in Hong Kong and Chinese Mainland,
amounted to HK$12,315 million (31 December 2025: HK$10,915 million) and which
will be recognised when the pre-sold properties are assigned to the customers, in
relation to which an amount of HK$7,600 million (31 December 2025: HK$8,890
million) is expected to occur within one year and an amount of HK$4,715 million (31
December 2025: HK$2,025 million) is expected to occur within one to two years.
45
5
Other net income
For the six months ended 30 June
2026
2025
HK$ million
HK$ million
Net gain on disposal of investment properties
Aggregate net gain on sales of property interests
(note 11(a))
Provision on inventories, net (note 11(a))
Net fair value gain on investments measured as
financial assets at fair value through profit or loss
(“FVPL”)
Net fair value (loss)/gain on derivative financial
instruments at FVPL:
- Interest rate swap contracts, cross currency swap
contracts, cross currency interest rate swap
contracts and foreign exchange forward
contracts (for which no hedge accounting was
applied during the period)
Gain on land resumption (note (i))
Impairment loss on trade debtors, net (note 11(c))
Exchange gain, net
Others
100
100
(106)
(69)
16
9
(21)
115
(2)
2
(12)
48
(note 11(a)) 240
(9)
84
2
92
305
Note:
(i)
On 25 June 2026, the Lands Department of the HKSAR Government had gazetted two notices regarding its
order for the resumption by and reversion to the HKSAR Government of the Group’s certain land lots in the
New Territories, Hong Kong which are required for a public purpose. The land lots held by certain of the
Group’s subsidiaries subject to resumption by the HKSAR Government comprise (i) an aggregate land area
of approximately 58,700 square feet falling within the second phase development of Hung Shui Kiu/Ha Tsuen
New Development Area (Fifth Batch) at a cash compensation of approximately HK$61 million; and (ii) an
aggregate land area of approximately 192,100 square feet falling within San Tin Technopole (Phase 1) at
Yuen Long (Second Batch) at a cash compensation of approximately HK$201 million. The pre-tax gain on
resumption of the land lots held by these subsidiaries attributable to both reported profit and underlying profit
in the amount of HK$115 million was recognised by the Group for the six months ended 30 June 2026.
During the corresponding six months ended 30 June 2025, the Group recognised resumption proceeds of
HK$353 million from the HKSAR Government in relation to the Group’s leasehold land held for development
for sale measuring an aggregate attributable land area of about 330,000 square feet held in Yuen Long South
and Kam Tin, the New Territories, resulting in the Group’s recognition of a pre-tax gain on land resumption
attributable to both reported profit and underlying profit in the amount of HK$240 million for the corresponding
six months ended 30 June 2025.
46
6
Decrease in fair value of investment properties and investment
properties under development
The Group’s investment properties and investment properties under development were
revalued at 30 June 2026 by Cushman & Wakefield Limited, a firm of professional
surveyors who have among their staff Members of The Hong Kong Institute of
Surveyors with recent experience in the location and category of properties being
valued, on a market value basis.
The Group’s management has reviewed the valuation results performed by the
surveyors for financial reporting purposes by verifying all major inputs and assumptions,
and assessing the reasonableness of property valuation. Such valuation is performed
at each interim and annual reporting date and is reviewed and approved by senior
management.
The valuations of completed investment properties in Hong Kong and Chinese Mainland
were primarily based on income capitalisation approach which capitalised the net
income of the properties and taking into account the reversionary potential of the
properties after expiry of the current lease.
For certain investment properties in Hong Kong and Chinese Mainland which are still
under development, the valuations were determined on redevelopment basis and by
estimating the fair value of such properties as if they were completed in accordance
with the relevant development plan and then deducting from that amount the estimated
costs to complete the construction, financing costs and a reasonable profit margin.
As a result, a net fair value loss on the Group’s investment properties and investment
properties under development in Hong Kong and Chinese Mainland (after deducting
non-controlling interests’ attributable share and deferred tax), excluding those held by
associates and joint ventures, in the amount of HK$741 million (2025: HK$208 million)
has been recognised in the consolidated statement of profit or loss for the six months
ended 30 June 2026 (see note 9(b)).
In aggregate, the Group’s attributable share of the net fair value loss (net of deferred
tax) on investment properties and investment properties under development held by
subsidiaries, associates and joint ventures for the six months ended 30 June 2026
amounted to HK$904 million (2025: HK$132 million).
47
6
Decrease in fair value of investment properties and investment
properties under development (continued)
A reconciliation of the abovementioned figures is as follows:
For the six months ended 30 June 2026
Fair value gain/(loss) on
investment properties
and investment
properties under
development held by
- subsidiaries
(before
deducting noncontrolling
interests’
attributable share
and deferred tax)
Add/(Less) :
Deferred tax
Non-controlling interests’
attributable share of
the net fair value gain
(net of deferred tax)
(after deducting noncontrolling interests’
attributable share and
deferred tax) (note
9(b))
- associates
(Group’s
attributable share)
(notes 9(b) and
11(a)(iii))
- joint ventures
(Group’s
attributable share)
(notes 9(b) and
11(a)(iv))
Hong
Kong
Chinese
Mainland
Total
HK$ million
HK$ million
HK$ million
(222)
(614)
(836)
137
137
(33)
(9)
(42)
(255)
(486)
(741)
(86)
(86)
170
(247)
(77)
(171)
(733)
(904)
48
6
Decrease in fair value of investment properties and investment
properties under development (continued)
A reconciliation of the abovementioned figures is as follows: (continued)
For the corresponding six months ended 30 June 2025
Fair value gain/(loss) on
investment properties
and investment
properties under
development held by
- subsidiaries
(before deducting
non-controlling
interests’
attributable share
and deferred tax)
Add/(Less) :
Deferred tax
Non-controlling interests’
attributable share of the
net fair value loss/(gain)
(net of deferred tax)
(after deducting noncontrolling interests’
attributable share and
deferred tax) (note 9(b))
- associates
(Group’s attributable
share) (notes 9(b) and
11(a)(iii))
- joint ventures
(Group’s attributable
share) (notes 9(b) and
11(a)(iv))
Hong Kong
Chinese
Mainland
Total
HK$ million
HK$ million
HK$ million
313
(740)
(427)
166
166
57
(4)
53
370
(578)
(208)
(108)
1
(107)
(40)
223
183
222
(354)
(132)
49
7
Profit before taxation
Profit before taxation is arrived at after charging/(crediting):
For the six months ended 30 June
2026
2025
HK$ million
HK$ million
(a) Finance costs:
Bank loans interest expense
Interest expense on guaranteed notes
Interest expense on convertible bonds at effective
interest rate
Interest expense on other loans
Finance cost on lease liabilities
Other borrowing costs
Note:
1,032
176
1,252
277
110
1,278
14
70
1,216
18
70
Less: Amount capitalised (note)
2,680
(1,490)
2,833
(1,628)
Finance costs (note 11(a))
1,190
1,205
The borrowing costs have been capitalised at weighted average interest rates based on the principal
amounts of the Group’s bank loans, guaranteed notes, convertible bonds and other loans during the six
months ended 30 June 2026 under which interest capitalisation was applicable, ranging from 2.69% to
4.02% (2025: ranging from 3.08% to 4.40%) per annum.
50
7
Profit before taxation (continued)
Profit before taxation is arrived at after charging/(crediting): (continued)
For the six months ended 30 June
2026
2025
HK$ million
HK$ million
(b) Staff costs:
Salaries, wages and other benefits
Contributions to defined contribution
retirement plans
1,535
1,534
61
60
1,596
1,594
For the six months ended 30 June
2026
2025
HK$ million
HK$ million
(c) Other items:
Amortisation of trademarks
Depreciation
− on other property, plant and equipment
− on right-of-use assets
Cost of sales
− properties for sale
− trading stocks and consumable stores
Dividend income from investments designated as
financial assets at fair value through other
comprehensive income (“FVOCI”) (nonrecycling) and investments measured as
financial assets at FVPL
− listed
− unlisted
51
2
2
90
139
231
86
143
231
(note 11(c))
(note 11(c))
8,400
465
3,299
504
(5)
(6)
(4)
8
Income tax
For the six months ended 30 June
2026
2025
HK$ million
HK$ million
Current tax
Provision for Hong Kong Profits Tax
Provision for taxation outside Hong Kong
(Over-provision)/provision for Land Appreciation Tax
488
66
(6)
208
100
7
548
315
6
(745)
554
(430)
Deferred tax
Origination and reversal of temporary differences
Income tax expense/(credit)
Provision for Hong Kong Profits Tax has been made at 16.5% (2025: 16.5%) on the estimated
assessable profits for the period.
Provision for taxation outside Hong Kong is provided for at the applicable rates of taxation for
the period on the estimated assessable profits arising in the relevant foreign tax jurisdictions
during the period.
Land Appreciation Tax is levied on properties in Chinese Mainland developed by the Group for
sale, at progressive rates ranging from 30% to 60% (2025: 30% to 60%) on the appreciation of
land value, which under the applicable regulations is calculated based on the revenue from sale
of properties less deductible expenditure including lease charges of land use rights, borrowing
costs and property development expenditure.
52
9
Earnings per share
(a)
Reported earnings per share
(i)
Basic earnings per share
The calculation of basic earnings per share is based on the consolidated profit
attributable to equity shareholders of the Company of HK$4,090 million (2025:
HK$2,908 million) and the weighted average number of 4,841 million ordinary shares
(2025: 4,841 million ordinary shares) in issue during the period.
(ii)
Diluted earnings per share
Diluted earnings per share for the six months ended 30 June 2026 is calculated by
dividing the consolidated profit attributable to equity shareholders of the Company of
HK$4,090 million during the period (in relation to which no interest expenses on
HK$8,000 million 0.5% guaranteed unsecured convertible bonds due 2030 (the
“Bonds”) are adjusted for, as they are fully capitalised as the cost of an investment
property under development of the Group during the period) by the diluted weighted
average number of 5,073 million ordinary shares after adjusting for the effect of full
conversion of the Bonds at HK$34.53 per Share (the “Adjusted Conversion Price”)
which would result in the issuance of an aggregate of 232 million ordinary shares and
which has been taken into consideration in the weighted average calculation.
Diluted earnings per share were the same as the basic earnings per share for the
corresponding six months ended 30 June 2025 as there were no dilutive potential
ordinary shares in existence during that period.
53
9
Earnings per share (continued)
(b)
Underlying earnings per share
For the purpose of assessing the underlying performance of the Group, basic and
diluted earnings per share are additionally calculated based on the consolidated profit
attributable to equity shareholders of the Company after excluding the effects of
changes in fair value of investment properties and investment properties under
development (“Underlying Profit”) of HK$5,071 million (2025: HK$3,048 million). A
reconciliation of profit is as follows:
For the six months ended 30 June
2026
2025
HK$ million
HK$ million
Profit attributable to equity shareholders of the
Company
Fair value loss of investment properties and
investment properties under development
during the period (after deducting noncontrolling interests’ attributable share and
deferred tax) (note 6)
Share of fair value loss/(gain) of investment
properties (net of deferred tax) during the
period:
− associates (note 6)
− joint ventures (note 6)
The Group’s attributable share of the cumulative
fair value gain of investment properties
disposed of during the period, net of tax (note
11(a)):
− subsidiaries
− associates and joint ventures
4,090
2,908
741
208
86
77
107
(183)
74
3
8
5,071
3,048
Basic underlying earnings per share, based on
the weighted average number of ordinary
shares in issue during the period (note 9(a)(i))
HK$1.05
HK$0.63
Diluted underlying earnings per share, based on
the diluted weighted average number of ordinary
shares (note 9(a)(ii))
HK$1.00
HK$0.63
Underlying Profit
54
10
Dividends
(a)
Dividends payable to equity shareholders of the Company attributable to the interim
period
For the six months ended 30 June
2026
2025
HK$ million
HK$ million
Interim dividend declared after the interim period
of HK$0.50 (2025: HK$0.50) per share
2,421
2,421
The interim dividend declared after the end of the reporting period has not been recognised as
a liability at the end of the reporting period.
(b)
Dividends payable to equity shareholders of the Company attributable to the previous
financial year, approved and paid during the interim period
For the six months ended 30 June
2026
2025
HK$ million
HK$ million
Final dividend in respect of the previous financial year,
approved and paid during the interim period, of
HK$0.76 (2025: HK$1.30) per share
55
3,679
6,294
11 Segment reporting
The Group manages its businesses by a mixture of business lines and geography. In
a manner consistent with the way in which information is reported internally to the
Group’s most senior executive management for the purposes of resource allocation
and assessment of segment performance, the Group has identified the following
reportable segments. No operating segments have been aggregated to form the
following reportable segments.
Property development
Property leasing
Department stores and
supermarket-cum-stores
operations
Hotel room operation
Other businesses
Utility and energy
: Development and sale of properties
: Leasing of properties
: Operation and management of department stores
and supermarket-cum-stores
: The operation of hotel properties owned by the
Group generating room revenue
: Hotel management (other than hotel room
operation), construction, provision of finance
(other than interest income from mortgage loans
classified under “Property development”
segment),
investment
holding,
project
management, property management, agency
services, security guard and cleaning services,
food and beverage operation, travel operation,
as well as the trading of building materials
: Production, distribution and marketing of gas and
related products or services, water supply and
waste treatment, renewable energy businesses,
extended businesses and advanced fuels
businesses
For the purposes of assessing segment performance and allocating resources
between segments, the Group’s most senior executive management monitors the
results attributable to each reportable segment on the following bases.
Revenue and expenses are allocated to the reportable segments with reference to
revenues generated by those segments and the expenses incurred by those segments
respectively. Segment results form the basis of measurement used for assessing
segment performance and represent profit or loss before provision on inventories, net,
sales of property interests, fair value change on investment properties and investment
properties under development, net finance costs, income tax and items not specifically
attributed to individual reportable segments, such as unallocated head office and
corporate expenses, net.
(a) Results of reportable segments
Information regarding the Group’s and its share of associates and joint ventures on
reportable segments as provided to the Group’s most senior executive management
for the purposes of resource allocation and assessment of segment performance for
the six months ended 30 June 2026 and 30 June 2025 is set out below.
56
11
Segment reporting (continued)
(a)
Results of reportable segments (continued)
Company and its
subsidiaries
(before deducting
non-controlling interests)
For the six months ended 30 June 2026
Property development
Hong Kong
Chinese Mainland
Property leasing
Hong Kong
Chinese Mainland
(note (ii))
Department stores and supermarketcum-stores operations
-sale of own goods
-rental of consignment and
concessionaire counters
Revenue
Segment
(note (i))
results
HK$ million HK$ million
Associates and
joint ventures
Share of
Share of
segment
revenue
results
HK$ million HK$ million
Attributable to
non-controlling interests
Consolidated
Combined
segment
revenue
results
HK$ million HK$ million
Segment
Revenue
results
HK$ million HK$ million
Attributable to equity
shareholders of the
Company
Consolidated
Combined
segment
revenue
results
HK$ million
HK$ million
11,272
524
11,796
2,559
(47)
2,512
2,040
490
2,530
1,445
(376)
1,069
13,312
1,014
14,326
4,004
(423)
3,581
(1,434)
(1,434)
(704)
(2)
(706)
(note 1)
11,878
1,014
12,892
(note 1)
3,300
(425)
2,875
2,531
826
3,357
1,843
587
2,430
1,175
52
1,227
903
17
920
3,706
878
4,584
2,746
604
3,350
(189)
(12)
(201)
(153)
(10)
(163)
3,517
866
4,383
2,593
594
3,187
571
(23)
571
(23)
(175)
11
396
(12)
127
54
127
54
(39)
(7)
88
47
698
31
698
31
(214)
4
484
35
Hotel room operation
Other businesses
157
1,195
39
6
166
192
64
64
323
1,387
103
70
(78)
(311)
(19)
39
245
1,076
84
109
Utility and energy
17,203
5,018
4,115
19,285
2,117
2,126
21,318
19,285
7,135
2,126
(2,238)
(845)
19,080
19,285
6,290
2,126
17,203
5,018
23,400
4,243
40,603
9,261
(2,238)
(845)
38,365
8,416
57
11 Segment reporting (continued)
(a) Results of reportable segments (continued)
Company and its
subsidiaries
Attributable to equity
(before deducting
Associates and
Attributable to
shareholders of the
non-controlling interests)
joint ventures
non-controlling interests
Company
Share of
Revenue
Segment
Share of
segment
revenue
results
Consolidated
Combined
segment
revenue
results
Consolidated
Segment
Combined
segment
(note (i))
results
results
revenue
results
HK$ million
HK$ million
HK$ million HK$ million
HK$ million HK$ million
HK$ million HK$ million
HK$ million
HK$ million
(106)
100
(9)
1
(115)
101
(36)
(115)
65
(599)
4,413
(16)
4,219
(615)
8,632
10
(871)
(605)
7,761
(836)
(1,190)
(194)
(612)
(1,030)
(1,802)
(44)
44
(1,074)
(1,758)
Bank interest income
312
47
359
(45)
314
Net finance costs
Profit before taxation
(878)
(565)
(1,443)
(1)
(1,444)
2,699
3,460
6,159
(916)
5,243
(554)
2,145
(749)
2,711
(1,303)
4,856
150
(766)
(1,153)
4,090
For the six months ended 30 June 2026
(continued)
Provision on inventories, net
(note 5)
Sales of property interests (note 2)
(note 5)
Unallocated head office and corporate expenses,
net
Profit from operations
Decrease in fair value of investment properties and
investment properties
under development
(note 7(a))
Finance costs
Income tax expense
Profit for the period
Revenue
Notes:
(1) The revenue and segment results for the six months ended 30 June 2026 related to the sale of leasehold land and interest income from mortgage loans (of which revenue in the amounts of HK$7 million and
HK$60 million respectively and segment profit in the amounts of HK$6 million and HK$54 million respectively) are classified under the “Property development” segment. The pre-tax profit contribution from the
property development segment in Hong Kong for the six months ended 30 June 2026 also included the Group’s share of pre-tax gain attributable to reported profit in the aggregate amount of HK$1,568 million
upon the resumption by the HKSAR Government of the Group’s leasehold land during the period.
(2) The Group’s attributable share of the realised cumulative fair value gain of investment properties disposed of during the six months ended 30 June 2026 amounted to HK$77 million (note 9(b)).
Adding to it
the Group’s share of net gain attributable to reported profit on disposal of investment properties of HK$65 million (see above) for the six months ended 30 June 2026, the Group’s share of the realised gain
from the sales of property interests attributable to underlying profit amounted to HK$142 million (which includes an amount of HK$123 million related to “The Legacy” project) during the six months ended 30
June 2026.
58
11 Segment reporting (continued)
(a) Results of reportable segments (continued)
In relation to the share of profits less losses of associates and joint ventures:
Hotel
Property
Property
room
Other
Utility
development
leasing operation businesses
Sub-total and energy
Total
HK$ million HK$ million HK$ million HK$ million HK$ million HK$ million HK$ million
For the six months ended 30 June 2026
Share of profits less losses of associates
(note (iii))
- Material listed associate
The Hong Kong and China Gas
Company Limited
- Other listed associates and unlisted
associates
Share of profits less losses of joint ventures
(note (iv))
88
7
(458)
(363)
1,881
1,518
(16)
72
7
78
(380)
62
(301)
1,881
62
1,580
780
401
34
(84)
1,131
1,131
780
473
41
(464)
830
1,881
2,711
59
11
(a)
Segment reporting (continued)
Results of reportable segments (continued)
Company and its
subsidiaries
(before deducting
non-controlling interests)
Revenue
Segment
(note (i))
results
HK$ million HK$ million
For the corresponding six months
ended 30 June 2025
Property development
Hong Kong
Chinese Mainland
Property leasing
Hong Kong
Chinese Mainland
(note (ii))
Department stores and supermarketcum-stores operations
-sale of own goods
-rental of consignment and
concessionaire counters
Hotel room operation
Other businesses
Utility and energy
Associates and
joint ventures
Share of
Share of
segment
revenue
results
HK$ million
HK$ million
Attributable to
non-controlling interests
Combined
revenue
HK$ million
Consolidated
segment
results
HK$ million
Revenue
HK$ million
Segment
results
HK$ million
Attributable to equity
shareholders of the
Company
Consolidated
Combined
segment
revenue
results
HK$ million
HK$ million
3,019
989
358
(14)
811
1,372
(37)
(91)
3,830
2,361
321
(105)
(18)
(11)
(3)
(note 1)
3,812
2,361
(note 1)
310
(108)
4,008
344
2,183
(128)
6,191
216
(18)
(14)
6,173
202
2,474
889
1,771
656
1,122
44
866
14
3,596
933
2,637
670
(185)
(11)
(154)
(9)
3,411
922
2,483
661
3,363
2,427
1,166
880
4,529
3,307
(196)
(163)
4,333
3,144
603
(32)
603
(32)
(184)
14
419
(18)
142
745
61
29
142
745
61
29
(44)
(228)
(4)
10
98
517
57
39
156
1,280
9,552
9,552
36
(30)
2,806
2,806
138
180
3,667
17,182
20,849
41
19
812
1,937
2,749
294
1,460
13,219
17,182
30,401
77
(11)
3,618
1,937
5,555
(78)
(398)
(918)
(918)
(18)
38
(147)
(147)
216
1,062
12,301
17,182
29,483
59
27
3,471
1,937
5,408
60
11 Segment reporting (continued)
(a) Results of reportable segments (continued)
Company and its
subsidiaries
Attributable to equity
(before deducting
Associates and
Attributable to
shareholders of the
non-controlling interests)
joint ventures
non-controlling interests
Company
Share of
For the corresponding six months ended
30 June 2025 (continued)
Consolidated
Revenue
Segment
Share of
segment
Combined
segment
(note (i))
results
revenue
results
revenue
results
HK$ million
HK$ million
HK$ million
HK$ million
HK$ million
HK$ million
Consolidated
Segment
Combined
segment
Revenue
results
revenue
results
HK$ million
HK$ million
HK$ million
HK$ million
(69)
(1)
(70)
(70)
(433)
2,304
(26)
2,722
(459)
5,026
(1)
(148)
(460)
4,878
(427)
(1,205)
139
(697)
(288)
(1,902)
24
50
(264)
(1,852)
Bank interest income
272
56
328
(54)
274
Net finance costs
Profit before taxation
(933)
(641)
(1,574)
(4)
(1,578)
944
2,220
3,164
(128)
3,036
Income tax credit/(expense)
430
1,374
(602)
1,618
(172)
2,992
44
(84)
(128)
2,908
Provision on inventories, net
Sales of property interests (note 2)
Unallocated head office and corporate
expenses, net
(note 5)
(note 5)
Profit from operations
(Decrease)/increase in fair value of investment
properties and investment properties under
development
(note 7(a))
Finance costs
Profit for the period
Notes:
(1)
The revenue and segment results for the corresponding six months ended 30 June 2025 related to the sale of leasehold land and interest income from mortgage loans (of which revenue in the amounts of
HK$2 million and HK$77 million respectively and segment profit in the amounts of HK$1 million and HK$71 million respectively) are classified under the “Property development” segment. The pre-tax profit
contribution from the property development segment in Hong Kong for the corresponding six months ended 30 June 2025 also included the Group’s share of pre-tax gain attributable to reported profit in the
aggregate amount of HK$240 million upon the resumption by the HKSAR Government of the Group’s leasehold land during the period (note 5).
(2)
The Group’s attributable share of the realised cumulative fair value gain of investment properties disposed of during the corresponding six months ended 30 June 2025 amounted to HK$8 million (note 9(b)).
Adding to it the Group’s share of net gain/loss attributable to reported profit on disposal of investment properties of HK$Nil (see above) for the corresponding six months ended 30 June 2025, the Group’s
share of the realised gain from the sales of property interests attributable to underlying profit amounted to HK$8 million during the corresponding six months ended 30 June 2025.
61
11 Segment reporting (continued)
(a) Results of reportable segments (continued)
In relation to the share of profits less losses of associates and joint ventures:
Hotel
Property
Property
room
development
leasing
operation
HK$ million HK$ million HK$ million
Other
Utility
businesses
Sub-total and energy
Total
HK$ million HK$ million HK$ million HK$ million
For the corresponding six months ended
30 June 2025
Share of profits less losses of associates
(note (iii))
- Material listed associate
The Hong Kong and China Gas
Company Limited
- Other listed associates and unlisted
associates
Share of profits less losses of joint ventures
(note (iv))
74
4
(427)
(349)
1,576
1,227
(32)
42
4
85
(342)
53
(296)
1,576
53
1,280
(169)
631
16
(140)
338
338
(169)
673
20
(482)
42
1,576
1,618
62
11 Segment reporting (continued)
(a)
Results of reportable segments (continued)
Notes:
(i)
The revenue figures above are arrived at after the elimination of inter-segment revenues, in the amounts of
HK$190 million (2025: HK$216 million) and HK$1,306 million (2025: HK$1,238 million) in relation to the
reportable segments under “Property leasing” and “Others”, respectively.
(ii)
Revenue for the “Property leasing” segment comprised rental income of HK$2,858 million (2025: HK$2,890
million) and rental-related income of HK$499 million (2025: HK$473 million), which in aggregate amounted
to HK$3,357 million for the six months ended 30 June 2026 (2025: HK$3,363 million)(see note 4).
(iii)
The Group’s share of profits less losses of associates contributed from the “Property leasing” segment during
the period of HK$72 million (2025: HK$42 million) included the Group’s attributable share of net decrease in
fair value of investment properties (net of deferred tax) during the period of HK$86 million (2025: HK$107
million) (see note 6).
The Group’s share of losses less profits of associates contributed from the “Other businesses” segment
during the period of HK$380 million (2025: HK$342 million) included the Group’s attributable share of profit
after tax from hotel management (other than hotel room operation) during the period of HK$2 million (2025:
HK$1 million).
(iv)
The Group’s share of profits less losses of joint ventures contributed from the “Property leasing” segment
during the period of HK$401 million (2025: HK$631 million) included the Group’s attributable share of net
decrease in fair value of investment properties (net of deferred tax) during the period of HK$77 million (2025:
attributable share of net increase in fair value of investment properties (net of deferred tax) of HK$183 million)
(see note 6).
The Group’s share of losses less profits of joint ventures contributed from the “Other businesses” segment
during the period of HK$84 million (2025: HK$140 million) included the Group’s attributable share of profit
after tax from hotel management (other than hotel room operation) during the period of HK$6 million (2025:
HK$4 million).
63
11 Segment reporting (continued)
(b) Geographical information
The following table sets out information about the geographical segment location of (i)
the Group’s revenue from external customers; and (ii) the Group’s investment properties,
other property, plant and equipment, right-of-use assets, goodwill, trademarks, interests
in associates and joint ventures (together, the “Specified non-current assets”). The
geographical location of customers is based on the location at which the services were
provided or the goods were delivered. The geographical location of the Specified noncurrent assets is based on the physical location of the asset in the case of investment
properties, other property, plant and equipment and right-of-use assets, the location of
the operation to which the cash-generating unit(s) is(are) allocated in the case of goodwill
and trademarks, and the location of operations in the case of interests in associates and
joint ventures.
Revenue from external
customers
Specified non-current
assets
For the six months ended 30 June
2026
2025
HK$ million HK$ million
At 30 June At 31 December
2026
2025
HK$ million
HK$ million
Hong Kong
Chinese Mainland
The United
Kingdom
15,612
1,591
7,423
2,129
352,743
69,004
349,941
67,597
38
39
17,203
9,552
421,785
417,577
(note 4)
(note 4)
(c) Other segment information
Depreciation and
amortisation
(Reversal of impairment
loss)/impairment loss
on trade debtors, net
For the six months ended
30 June
For the six months ended
30 June
2026
HK$ million
2025
HK$ million
2026
HK$ million
2025
HK$ million
25
15
26
12
(2)
4
4
5
62
65
3
38
88
3
37
88
231
231
2
9
(note 7(c))
(note 7(c))
(note 5)
(note 5)
Property development
Property leasing
Department stores and
supermarket-cum-stores
operations
-sale of own goods
-rental of consignment
and concessionaire
counters
Hotel room operation
Other businesses
64
12 Inventories
Property development
Leasehold land held for development for sale
Properties held for/under development for sale
Completed properties for sale
Other operations
Trading stocks and consumable stores
65
At 30 June
2026
HK$ million
At 31 December
2025
HK$ million
9,451
33,637
30,331
9,530
35,844
34,126
73,419
79,500
115
121
73,534
79,621
13 Trade and other receivables
(i)
(ii)
Debtors and current receivables
Trade receivables
Instalments receivable
Sub-total: Trade debtors
Other debtors
Prepayments and deposits
Gross amount due from customers for
contract work (^)
Amounts due from associates
Amounts due from joint ventures
Other current financial assets
Loans receivable
Financial assets measured at FVPL
Derivative financial instruments
At 30 June
2026
HK$ million
At 31 December
2025
HK$ million
303
73
376
5,324
3,590
293
82
375
5,045
3,661
14
29
53
14
29
36
9,386
9,160
1,851
904
77
1,273
922
234
2,832
2,429
12,218
11,589
(^) This balance represented the excess of cumulative revenue recognised in profit or loss over the cumulative
payments made by customers at the end of the reporting period, and was recognised as contract asset.
Included in other debtors is an amount receivable of HK$1,864 million (31 December 2025:
HK$1,864 million) which was overdue at 30 June 2026, but which is pledged against certain
collaterals provided by the debtor.
Loans receivable, of which HK$1,737 million (31 December 2025: HK$1,163 million) are
secured and interest-bearing at interest rates of 5.5% and Hong Kong Interbank Offered Rate
(“HIBOR”) plus 2.25% (31 December 2025: interest rates of 5.5% and HIBOR plus 2.25%)
per annum, and HK$114 million (31 December 2025: HK$110 million) are unsecured and
interest-bearing at interest rate of 6.0% (31 December 2025: 6.0%) per annum, are both
expected to be recovered within one year from the end of the reporting period, and were both
not past due at 30 June 2026 and 31 December 2025.
66
13 Trade and other receivables (continued)
All of the trade and other receivables are expected to be recovered or recognised as expense
within one year except for various deposits, prepayments and other debtors of HK$4,016
million (31 December 2025: HK$4,177 million) which are expected to be recovered after more
than one year from the end of the reporting period.
The amounts due from associates and joint ventures at 30 June 2026 and 31 December 2025
are unsecured, interest-free, have no fixed terms of repayment and were not past due at 30
June 2026 and 31 December 2025.
At the end of the reporting period, the ageing analysis of trade debtors (which are included in
trade and other receivables), based on the dates of invoices or demand notes and net of loss
allowance, is as follows:
Current or up to 1 month
More than 1 month and up to 3 months
More than 3 months and up to 6 months
More than 6 months
At 30 June
2026
HK$ million
At 31 December
2025
HK$ million
228
48
27
73
239
42
33
61
376
375
Regular review and follow-up actions are carried out on overdue amounts of instalments
receivable from sale of properties and loans receivable which enable management to assess
their recoverability and to minimise exposure to credit risk. In relation to property sales for
which the buyers have entered into mortgage loans advanced by the Group, management
mitigates the credit risk by holding collateral in the form of properties to cover the amounts of
mortgage loans advanced by the Group to the property buyers. In respect of rental income
from leasing properties, monthly rents are received in advance and sufficient rental deposits
are held to cover potential exposure to credit risk.
For other trade receivables, credit terms given to customers are generally based on the
financial strength and repayment history of each customer, and (i) for property sales
transactions, credit terms are granted to buyers in accordance with the sales plans of the
projects; and (ii) for property leasing transactions, credit terms granted to tenants generally
ranged between 30 days and 60 days from the due date. As such, the Group does not obtain
collateral from its customers. An ageing analysis of the receivables is prepared on a regular
basis and is closely monitored to minimise any credit risk associated with the receivables.
Adequate allowances for impairment losses have been made for estimated irrecoverable
amounts.
The Group has made advances to certain associates and certain joint ventures in Hong Kong
and Chinese Mainland (included within the Group’s interests in associates and joint ventures
and loans receivable respectively) which are interest-bearing, unsecured, have no fixed
repayment terms and have various repayment dates. Management assesses the credit risk
on the loans receivable from such associates and joint ventures based on their financial
conditions and the profitability of the projects operated by such associates and joint ventures,
as well as the counterparty risks of the joint venture partners with reference to their credit
ratings and market conditions.
67
14 Trade and other payables
At 30 June
2026
HK$ million
At 31 December
2025
HK$ million
8,683
12
2,079
8,934
10
2,071
5,092
331
1,569
7,928
3,943
344
1,548
7,678
25,694
24,528
Creditors and accrued expenses
Gross amount due to customers for contract work(#)
Rental and other deposits received
Forward sales deposits received and other contract
liabilities (#)
Derivative financial instruments
Amounts due to associates
Amounts due to joint ventures
(#) These balances represented the excess of cumulative payments made by customers over the cumulative revenue
recognised in profit or loss at the end of the reporting period, and were recognised as contract liabilities.
At the end of the reporting period, the ageing analysis of trade creditors (which are included in
trade and other payables), based on the due dates for settlement, is as follows:
At 30 June
2026
HK$ million
At 31 December
2025
HK$ million
2,246
625
509
2,257
1,564
892
327
2,547
5,637
5,330
Due within 1 month or on demand
Due after 1 month but within 3 months
Due after 3 months but within 6 months
Due after 6 months
The amounts due to associates and joint ventures at 30 June 2026 and 31 December 2025 are
unsecured, interest-free and have no fixed terms of repayment except for aggregate amounts
due to certain associates and certain joint ventures of HK$837 million (31 December 2025:
HK$849 million) which are unsecured, interest-bearing at interest rates ranging from Renminbi
(“RMB”) Loan Prime Rate minus 0.65% to RMB Loan Prime Rate and 20% below the RMB
Loan Prime Rate (31 December 2025: interest rates of 2.92% and ranging from RMB Loan
Prime Rate minus 0.65% to RMB Loan Prime Rate) per annum and wholly repayable between
3 July 2026 and 22 April 2027 (31 December 2025: between 20 January 2026 and 23 October
2026).
15 Non-adjusting event after the reporting period
After the end of the reporting period, the Directors declared an interim dividend.
details are disclosed in note 10(a).
68
Further
Financial review
Results of operations
The following discussions should be read in conjunction with the Company’s unaudited
condensed consolidated financial statements for the six months ended 30 June 2026.
Revenue and profit
Profit/(loss) contribution
from operations
Six months ended 30 June
2026
Increase
2025
HK$ million
%
HK$ million
Revenue
Six months ended 30 June
2026
2025
HK$ million
HK$ million
Increase /
(Decrease)
%
11,796
3,357
4,008
3,363
+194%
2,512
2,430
344
2,427
+630%
698
157
1,195
745
156
1,280
-6%
+1%
-7%
31
39
6
29
36
(30)
+7%
+8%
+120%
17,203
9,552
+80%
5,018
2,806
+79%
Reportable segments
- Property development
- Property leasing
- Department stores and
supermarket-cum-stores
operations
- Hotel room operation
- Other businesses
Six months ended 30 June
2026
2025
HK$ million
HK$ million
Increase
%
Profit attributable to equity shareholders of the
Company
- excluding the Group’s attributable share of
changes in fair value of investment properties
and investment properties under development
(net of deferred taxation) held by the Group’s
subsidiaries, associates and joint ventures
(“Underlying Profit”) (Note)
5,071
3,048
+66%
- including the Group’s attributable share of
changes in fair value of investment properties
and investment properties under development
(net of deferred taxation) held by the Group’s
subsidiaries, associates and joint ventures
4,090
2,908
+41%
Note :
Underlying profit attributable to equity shareholders of the Company (“Underlying Profit”) excludes the Group’s
attributable share of fair value change (net of deferred tax) of the investment properties and investment properties
under development held by subsidiaries, associates and joint ventures. In order to fully exclude the aforesaid
effects of changes in fair value from the Underlying Profit, the Group’s attributable share of the cumulative fair value
gain (net of tax) of investment properties disposed of during the period (which has been included in calculating the
net gain on disposal of investment properties and hence the profit attributable to equity shareholders of the Company
during the period) of HK$77 million (2025: HK$8 million) was added back in arriving at the Underlying Profit.
69
Below is the comparison of the Underlying Profits for the six months ended 30 June 2026 and 30
June 2025 by excluding (i) certain fair value adjustments; and (ii) the gains on land resumption
by the HKSAR Government for both periods:Six months ended 30 June
2026
2025
HK$ million
HK$ million
Underlying Profit
Increase
HK$ million
%
5,071
3,048
2,023
Net fair value loss / (gain)
on derivative financial
instruments measured at
fair value through profit or
loss relating to certain
interest rate swap
contracts, cross currency
swap contracts, cross
currency interest rate swap
contracts and foreign
exchange forward contracts
for which no hedge
accounting was applied
during the period
21
(48)
69
Post-tax gain on land
resumption by the HKSAR
Government of the Group’s
land sites in the New
Territories, Hong Kong
attributable to underlying
profit (as referred to in the
paragraph headed
“Resumption of certain land
lots by the HKSAR
Government” below)
(1,278)
(233)
(1,045)
3,814
2,767
1,047
+66%
Add / (Less) :
(i)
(ii)
+38%
Discussions on the major reportable segments are set out below.
Property development
The gross revenue and pre-tax profit contributions from the property development segment in
Hong Kong, for both periods of six months ended 30 June 2026 and 30 June 2025, comprised
the gross revenue and pre-tax profit contributions generated from the sales of properties, gain
on land resumption by the HKSAR Government and interest income from mortgage loans.
Gross revenue - subsidiaries and by geographical contribution
The gross revenue from property sales during the six months ended 30 June 2026 and 30 June
2025 generated by the Group’s subsidiaries, and by geographical contribution, were as follows:-
70
Six months ended 30 June
2026
2025
HK$ million
HK$ million
Increase/(Decrease)
HK$ million
%
By geographical contribution:
Hong Kong
Chinese Mainland
11,272
524
11,796
3,019
989
4,008
8,253
(465)
7,788
+273%
-47%
+194%
The gross revenue from property sales in Hong Kong of HK$11,272 million during the six months
ended 30 June 2026 was mainly contributed from the following residential development projects
completed before 1 January 2026, and the sold units of which were delivered to the buyers during
the period:
(i)
HK$4,055 million from “The Legacy” in Mid-Levels, Hong Kong Island;
(ii)
HK$2,049 million from “Henley Park” and “The Henley (Phases 1 to 3)” in The Kai Tak
Development Area, Kowloon;
(iii)
HK$1,303 million from “The Haddon” in Hung Hom, Kowloon;
(iv) HK$1,133 million from “Eight Southpark” in Ma Tau Kok, Kowloon;
(v)
HK$1,050 million from “The Paddington” in Cheung Sha Wan, Kowloon; and
(vi) HK$758 million from “Belgravia Place Phase 1” in Cheung Sha Wan, Kowloon.
Although the residential project of “Belgravia Place Phase 2” in Cheung Sha Wan, Kowloon was
completed in June 2026, the sold units of this project are scheduled for delivery to the buyers in
the second half of 2026 and therefore no revenue and profit contributions have been recognised
from this project for the six months ended 30 June 2026.
The gross revenue from property sales in Chinese Mainland of HK$524 million during the six
months ended 30 June 2026 was mainly contributed as to HK$523 million from the “Changan
Project” in Shijiazhuang, being a residential development project completed before 1 January
2026 and the sold units of which were delivered to the buyers during the period.
Pre-tax profits/(losses) – by geographical distribution and from subsidiaries, associates
and joint ventures
The Group’s attributable share of pre-tax profits/(losses) from property development, by
geographical contribution and from subsidiaries (after deducting non-controlling interests),
associates and joint ventures during the six months ended 30 June 2026 and 30 June 2025, were
as follows:-
71
Six months ended 30 June
2026
2025
HK$ million
HK$ million
Increase
HK$ million
%
By geographical contribution:
Hong Kong
Chinese Mainland
3,300
(425)
2,875
310
(108)
202
2,990
(317)
2,673
+965%
+294%
+1,323%
The increase in the Group’s attributable share of pre-tax profits from property development in
Hong Kong during the six months ended 30 June 2026 of HK$2,990 million (or 965%) was mainly
due to (i) the Group’s attributable share of pre-tax profit contribution of HK$1,295 million from the
property sales of “The Legacy” during the period (2025: Nil); and (ii) the Group’s share of pre-tax
gain attributable to reported profit in aggregate amount of HK$1,568 million upon the resumption
by and reversion to the HKSAR Government of the Group’s certain land lots in the New Territories
which are required for a public purpose, under two notices gazetted by the Lands Department by
order of the HKSAR Government on 25 June 2026 (the “Resumption Order”), the details of which
are referred to in the paragraph headed “Resumption of certain land lots by the HKSAR
Government” below and which demonstrated an increase of HK$1,328 million compared with the
Group’s pre-tax gain on land resumption of HK$240 million recognised during the corresponding
period of six months ended 30 June 2025.
The increase in the Group’s attributable share of pre-tax losses from property sales in Chinese
Mainland during the six months ended 30 June 2026 of HK$317 million (or 294%) was mainly
due to the increase in the Group’s attributable share of pre-tax loss contributions from “Panyu
Project” in Guangzhou, “Chancheng Project” in Foshan and “La Botanica” in Xian (all being
projects held by the Group’s joint ventures).
Six months ended 30 June
2026
2025
HK$ million
HK$ million
Increase
HK$ million
%
By contribution from subsidiaries
(after deducting non-controlling
interests), associates and joint
ventures:
Subsidiaries
Associates
1,806
1
330
1,476
1
Joint ventures
1,068
2,875
(128)
202
1,196
2,673
+447%
Not
applicable
+934%
+1,323%
The increase of HK$1,476 million (or 447%) in the Group’s attributable share of pre-tax profits
from property sales of the Group’s subsidiaries during the six months ended 30 June 2026 was
mainly due to the Group’s attributable share of pre-tax profit contribution of HK$1,295 million
from the property sales of “The Legacy” in Hong Kong during the period (2025: Nil) as referred
to above.
The increase of HK$1,196 million (or 934%) in the Group’s attributable share of pre-tax profits
from property sales of the Group’s joint ventures during the six months ended 30 June 2026 was
mainly due to the Group’s share of pre-tax gain attributable to reported profit in aggregate amount
of HK$1,453 million in relation to the land lots in the New Territories, Hong Kong held by the
72
Group’s certain joint ventures which are subject to the Resumption Order, but which amount was
partially offset by the increase of the Group’s attributable share of pre-tax loss from property
sales of the joint ventures in Chinese Mainland in the amount of HK$282 million.
Property leasing
Gross revenue – subsidiaries and by geographical contribution
The gross revenue from property leasing during the six months ended 30 June 2026 and 30 June
2025 generated by the Group’s subsidiaries, and by geographical contribution, were as follows:Six months ended 30 June
2026
2025
HK$ million
HK$ million
Increase/(Decrease)
HK$ million
%
By geographical contribution:
Hong Kong
Chinese Mainland
2,531
826
3,357
2,474
889
3,363
57
(63)
(6)
+2%
-7%
Pre-tax net rental income – by geographical distribution and from subsidiaries, associates
and joint ventures
The Group’s attributable share of pre-tax net rental income, by geographical contribution and
from subsidiaries (after deducting non-controlling interests), associates and joint ventures during
the six months ended 30 June 2026 and 30 June 2025, were as follows:Six months ended 30 June
2026
2025
HK$ million
HK$ million
Increase/(Decrease)
HK$ million
%
By geographical contribution:
Hong Kong
Chinese Mainland
2,593
594
3,187
2,483
661
3,144
110
(67)
43
+4%
-10%
+1%
2,267
250
670
3,187
2,264
236
644
3,144
3
14
26
43
+6%
+4%
+1%
By contribution from subsidiaries
(after deducting non-controlling
interests), associates and joint
ventures:
Subsidiaries
Associates
Joint ventures
For Hong Kong, on an overall portfolio basis, there was a year-on-year increase of HK$57 million
(or 2%) in rental revenue contribution and a year-on-year increase of HK$110 million (or 4%) in
the Group’s attributable share of pre-tax net rental income contribution for the six months ended
30 June 2026. During the six months ended 30 June 2026, there were year-on-year increases
of (i) HK$73 million in the pre-tax net rental income contributions from the investment properties
73
held by the Group’s subsidiaries (mainly in relation to “The Henderson” whose occupancy rate
had increased from around 80% at the end of June 2025 to over 90% at the end of June 2026);
and (ii) HK$37 million in the Group’s attributable share of pre-tax net rental income contributions
from the investment properties held by associates and joint ventures (mainly in relation to the
investment properties held by Hong Kong Ferry (Holdings) Company Limited, a listed associate
of the Group, and the “International Finance Centre” (“ifc”) project which is held by a joint venture
of the Group).
For Chinese Mainland, on an overall portfolio basis, there was a year-on-year decrease of HK$63
million (or 7%) in rental revenue contribution and a year-on-year decrease of HK$67 million (or
10%) in the Group’s attributable share of pre-tax net rental income contribution for the six months
ended 30 June 2026. Based on the average exchange rates between the Renminbi (“RMB”)
and Hong Kong dollars (“HKD”) for the two financial periods of six months ended 30 June 2026
and 30 June 2025, there was a year-on-year appreciation of RMB against HKD by approximately
4% during the six months ended 30 June 2026, and excluding the effect of foreign currency
translation, there was in RMB terms:
(i)
a year-on-year decrease in the Group’s attributable share of rental revenue of 10% which
was mainly attributable to the decrease in rental revenue contributions from “World
Financial Centre” in Beijing and certain investment properties in Shanghai due to lower
average occupancy rates and reduced rental rates during the six months ended 30 June
2026 compared with those for the corresponding six months ended 30 June 2025; and
(ii)
a year-on-year decrease in the Group’s attributable share of pre-tax net rental income of
15% which was also mainly attributable to the decrease in rental revenue contributions from
“World Financial Centre” in Beijing and certain investment properties in Shanghai for the
reason as referred to above.
Department stores and supermarket-cum-stores operations
Department stores and supermarket-cum-stores operations are carried out by Citistore (Hong
Kong) Limited (“Citistore”) and Unicorn Stores (HK) Limited (“Unicorn”) respectively, both being
wholly-owned subsidiaries of Henderson Investment Limited, a non-wholly owned listed
subsidiary of the Group. For the six months ended 30 June 2026, revenue contribution
amounted to HK$698 million (2025: HK$745 million) which represented a year-on-year decrease
of HK$47 million (or 6%) from that for the corresponding six months ended 30 June 2025. The
decrease in revenue during the six months ended 30 June 2026 was mainly attributable to the
fall in retail sales of the Group due to (i) the expansion of cross-border e-commerce operators in
Hong Kong which further eroded local market share while local retailers engaged in aggressive
promotion activities which intensified competitive pressure; and (ii) the continuing increase in
outbound travel, and cross-border consumption and shopping.
Profit contribution (after the elimination of rental expenditure payable by Citistore and Unicorn to
the Group, in respect of certain store premises leased by Citistore and Unicorn from the Group
for business operation) for the six months ended 30 June 2026 increased by HK$2 million (or
7%) to HK$31 million (2025: HK$29 million). The increase in profit contribution was mainly
attributable to the better cost control and savings in operating expenditures during the six months
ended 30 June 2026.
Hotel room operation
This mainly relates to the sales of hotel rooms by Miramar Hotel and Investment Company,
Limited (“Miramar”, a non-wholly owned listed subsidiary of the Group) in respect of “The Mira
74
Hong Kong Hotel” and “Mira Moon Hotel”, being the two hotels operated by Miramar in Hong
Kong.
During the six months ended 30 June 2026, revenue amounted to HK$157 million (2025: HK$156
million) and pre-tax profit amounted to HK$39 million (2025: HK$36 million), representing a yearon-year increase in revenue of HK$1 million (or 1%) and a year-on-year increase in pre-tax profit
of HK$3 million (or 8%). The almost flat performance of revenue contribution for the period
under review was mainly due to the offsetting effect between an increase in the average daily
room rate by 4% and a decrease in the average occupancy rate by 7 percentage points during
the period, which was due to the partial renovation of the guestrooms of “The Mira Hong Kong
Hotel” since June 2025. The more remarkable increase in pre-tax profit contribution for the
period under review, in percentage terms, was due to the decrease in staff costs and
expenditures on cleaning and supplies of the two hotels during the period.
Other businesses
Other businesses mainly comprise hotel management (other than hotel room operation),
construction, provision of finance (other than interest income from mortgage loans which are
classified under the “Property development” segment above), investment holding, project
management, property management, agency services, security guard and cleaning services, as
well as travel and food and beverage operations.
Revenue and pre-tax profit contribution from other businesses for the six months ended 30 June
2026 amounted to HK$1,195 million and HK$6 million respectively, representing:
(a) a decrease in revenue of HK$85 million (or 7%) from the revenue contribution of HK$1,280
million for the corresponding six months ended 30 June 2025, which was mainly attributable
to the decrease in revenue contribution of HK$113 million from the Group’s travel operations
mainly due to the geopolitical instability arising from the war in the Middle East which affected
group tour operations in that region, but was partially offset by the increase in revenue
contribution of HK$31 million from the Group’s food and beverage operations mainly due to
the commencement of operations of the hospitality banqueting and catering services at “The
Cloud” atop “The Henderson”, Hong Kong;
and
(b) an increase in pre-tax profit contribution of HK$36 million (or 120%) over and above the pretax loss contribution of HK$30 million for the corresponding six months ended 30 June 2025,
which was mainly attributable to the decrease in pre-tax loss contribution of HK$15 million
from the Group’s food and beverage operations for the reason as referred to above, the
decrease in pre-tax loss contribution of HK$12 million from the Group’s construction
activities and the increase in pre-tax profit contribution of HK$8 million from the Group’s
property and assets management activities during the period.
Associates
The Group’s attributable share of post-tax profits less losses of associates during the six months
ended 30 June 2026 amounted to HK$1,580 million (2025: HK$1,280 million), representing an
increase of HK$300 million (or 23%) over that for the corresponding six months ended 30 June
2025. Excluding the Group’s attributable share of changes in fair value of investment properties
held by the associates (net of deferred taxation) during the two periods, the Group’s attributable
share of the underlying post-tax profits less losses of associates for the six months ended 30
June 2026 amounted to HK$1,669 million (2025: HK$1,387 million), representing an increase of
75
HK$282 million (or 20%) over that for the corresponding six months ended 30 June 2025. Such
year-on-year increase in the underlying post-tax profits during the six months ended 30 June
2026 was mainly due to the year-on-year increase of HK$281 million in the Group’s attributable
share of post-tax underlying profit contribution from The Hong Kong and China Gas Company
Limited (a listed associate of the Group) which arose mainly from its growth business engaged
in the advanced biofuels production.
Joint ventures
The Group’s attributable share of post-tax profits less losses of joint ventures during the six
months ended 30 June 2026 amounted to HK$1,131 million (2025: HK$338 million), representing
an increase of HK$793 million (or 235%) over that for the corresponding six months ended 30
June 2025. Excluding the Group’s attributable share of changes in fair value of investment
properties held by the joint ventures (net of deferred taxation) during the two periods, the Group’s
attributable share of the underlying post-tax profits less losses of joint ventures for the six months
ended 30 June 2026 amounted to HK$1,208 million (2025: HK$155 million), representing an
increase of HK$1,053 million (or 679%) over that for the corresponding six months ended 30
June 2025. Such year-on-year increase in the underlying post-tax profits during the six months
ended 30 June 2026 was mainly due to the Group’s attributable share of net post-tax gains of
HK$1,173 million on land resumption by the HKSAR Government of land sites held by the
Group’s certain joint ventures falling within the second phase development of Hung Shui Kiu/Ha
Tsuen New Development Area (Fifth Batch) and San Tin Technopole (Phase 1) at Yuen Long
(Second Batch) in Hong Kong, the details of which are referred to in the paragraph
headed “Resumption of certain land lots by the HKSAR Government” below (2025: Nil).
Finance costs
Finance costs (comprising interest expense and other borrowing costs) before interest
capitalisation for the six months ended 30 June 2026 amounted to HK$2,680 million (2025:
HK$2,833 million), which included finance costs relating to the HK$8,000 million convertible
bonds issued by the Group in July 2025 (as referred to in the paragraph headed “Issuance of a
convertible bond during the previous year ended 31 December 2025” below) based on the
effective interest rate in the amount of HK$110 million (2025: Nil).
Finance costs after interest capitalisation for the six months ended 30 June 2026 amounted to
HK$1,190 million (2025: HK$1,205 million), and after set-off against the Group’s bank interest
income of HK$312 million for the six months ended 30 June 2026 (2025: HK$272 million), the
Group recognised net finance costs in the Group’s consolidated statement of profit or loss for the
six months ended 30 June 2026 in the amount of HK$878 million (2025: HK$933 million).
The Group’s overall effective borrowing rate for the six months ended 30 June 2026 was
approximately 3.30% per annum (2025: approximately 3.67% per annum).
Revaluation of investment properties and investment properties under
development
The Group recognised a decrease in fair value on its investment properties and investment
properties under development (before deferred taxation and non-controlling interests) of HK$836
million in the consolidated statement of profit or loss for the six months ended 30 June 2026
(2025: a decrease in fair value of HK$427 million).
76
Financial resources and liquidity
Medium Term Note Programme
At 30 June 2026, the aggregate carrying amount of notes guaranteed by the Company and
issued under the Group’s Medium Term Note Programme established on 30 August 2011 (“MTN
Programme”) and under which the Company had on 6 May 2022 increased the maximum
aggregate principal amount of notes outstanding at any one time from US$5,000 million to
US$7,000 million, was HK$8,894 million (31 December 2025: HK$10,798 million) with tenures of
between two years and twenty years (31 December 2025: between two years and twenty years).
During the six months ended 30 June 2026, the Group issued a Hong Kong dollar-denominated
guaranteed note under the MTN Programme in the principal amount of HK$800 million (2025:
two Hong Kong dollar-denominated guaranteed notes in the aggregate principal amount of
HK$400 million) with tenure of seven years (2025: tenures of two years and three years). Such
guaranteed notes issued by the Group serve to finance the Group’s capital expenditure
requirements as referred to in the paragraph headed “Capital commitments” below. These
notes are included in the Group’s bank and other borrowings at 30 June 2026 and 31 December
2025 as referred to in the paragraph headed “Maturity profile and interest cover” below. During
the six months ended 30 June 2026, the Group repaid certain guaranteed notes in the aggregate
equivalent principal amount of HK$2,700 million (2025: HK$9,619 million) under the MTN
Programme.
Maturity profile and interest cover
The maturity profile of the total debt, the cash and bank balances, the net debt and the gearing
ratio of the Group were as follows:
At 30 June
2026
HK$ million
At 31 December
2025
HK$ million
Bank and other borrowings (including the debt
component of the HK$8,000 million convertible
bonds issued by the Group in July 2025)
repayable:
- Within 1 year
- After 1 year but within 2 years
- After 2 years but within 5 years
- After 5 years
Amounts due to related companies
Total debt
Less:
Cash and bank balances
Net debt
6,961
15,908
34,803
18,449
3,788
79,909
9,331
15,175
36,749
17,619
3,543
82,417
(21,477)
58,432
(22,198)
60,219
Shareholders’ funds
325,555
322,464
Gearing ratio (%)
17.9%
18.7%
Gearing ratio is calculated based on the net debt and shareholders’ funds of the Group at the
end of the reporting period.
77
At 30 June 2026, the Group’s total debt comprised (i) bank and other borrowings in Hong Kong,
being bank loans of HK$57,377 million (31 December 2025: HK$58,230 million), guaranteed
notes of HK$8,894 million (31 December 2025: HK$10,798 million) and the debt component of
HK$7,210 million (31 December 2025: HK$7,120 million) in relation to the HK$8,000 million
convertible bonds issued by the Group in July 2025; (ii) bank borrowings in Chinese Mainland in
the equivalent amount of HK$2,640 million (31 December 2025: in the equivalent amount of
HK$2,726 million); and (iii) amounts due to related companies in the equivalent amount of
HK$3,788 million (31 December 2025: in the equivalent amount of HK$3,543 million), which in
aggregate amounted to HK$79,909 million (31 December 2025: HK$82,417 million). The bank
and other borrowings in Hong Kong are unsecured and have a weighted average debt maturity
profile of approximately 3.80 years (31 December 2025: approximately 3.81 years). The bank
borrowings in Chinese Mainland are unsecured and have a weighted average debt maturity
profile of approximately 2.55 years (31 December 2025: approximately 3.16 years). The
amounts due to related companies are unsecured and have a weighted average debt maturity
profile of approximately three years (31 December 2025: approximately three years).
In addition, at 30 June 2026, there was an amount due from the Group to a fellow subsidiary
(being a wholly-owned subsidiary of the ultimate controlling party of the Group) of HK$76,955
million (31 December 2025: HK$80,618 million) which is unsecured, interest-bearing and has no
fixed repayment terms.
At 30 June 2026, after taking into account the effect of swap contracts, 35% (31 December 2025:
37%) of the Group’s total debt carried fixed interest rates.
The interest cover of the Group is calculated as follows:
Six months ended 30 June
2026
2025
HK$ million
HK$ million
Profit from operations (including the cumulative fair value
change (net of tax) of investment properties disposed of
during the period, but before changes in fair value of
investment properties and investment properties under
development for the period) plus the Group’s share of the
underlying profits less losses of associates and joint
ventures (“Underlying Operating Profit”)
7,364
3,854
Net interest expense (before interest capitalisation)
2,284
2,473
Interest cover (times)
3.22
1.56
The year-on-year increase in the Underlying Operating Profit for the six months ended 30 June
2026 is mainly due to the year-on-year increase in pre-tax profit contribution from the Group’s
property development segment in Hong Kong, as further described in the paragraph headed
“Property development” above.
With abundant banking facilities in place and the recurrent income generated from its operations,
the Group has adequate financial resources in meeting the funding requirements for its ongoing
operations as well as its future expansion.
78
Treasury and financial management
The Group is exposed to interest rate and foreign exchange risks. To efficiently and effectively
manage these risks, the Group’s financing and treasury activities are centrally co-ordinated at
the corporate level. As a matter of policy, all transactions in derivative financial instruments are
undertaken solely for risk management purposes and no derivative financial instruments were
held by the Group at the end of the reporting period for speculative purposes.
The Group conducts its business primarily in Hong Kong with the related cash flows, assets and
liabilities being denominated mainly in Hong Kong dollars. The Group’s primary foreign
exchange exposure at 30 June 2026 arose from its property developments and investments in
Chinese Mainland which were denominated in RMB, the guaranteed notes (“Notes”) which were
denominated in United States dollars and Japanese Yen (“¥”) and the bank borrowings which
were denominated in ¥ and RMB at 30 June 2026.
In respect of the Group’s operations in Chinese Mainland, apart from its capital contributions and,
in some cases, loan contributions to projects which are denominated in RMB and are not hedged,
the Group endeavours to establish a natural hedge by maintaining an appropriate level of
external borrowings in RMB. In respect of the Notes and bank borrowings in Hong Kong at each
of 30 June 2026 and 31 December 2025, hedging arrangements had been made by the Group
with certain counterparty banks which comprised (i) interest rate swap contracts; (ii) cross
currency swap contracts; (iii) cross currency interest rate swap contracts; and (iv) foreign
exchange forward contracts to hedge against interest rate risk and foreign currency risk during
their tenure. Based on the abovementioned swap and forward contracts, the aggregate amount
of the Notes and bank borrowings in Hong Kong which were hedged against the interest rate risk
only, the foreign currency risk only and both the interest rate risk and foreign currency risk, was
HK$11,437 million at 30 June 2026 (31 December 2025: HK$15,282 million) which represented
14% of the Group’s total debt at 30 June 2026 (31 December 2025: 19%).
Material acquisitions and disposals
There were no material acquisitions and disposals during the period under review.
Resumption of certain land lots by the HKSAR Government
On 25 June 2026, the Lands Department of the HKSAR Government had gazetted two notices
regarding its order for the resumption by and reversion to the HKSAR Government of the Group’s
certain land lots in the New Territories, Hong Kong which are required for a public purpose. The
Group’s attributable share of land lots which is subject to resumption by the HKSAR Government
comprises (i) an aggregate land area of approximately 102,700 square feet falling within the
second phase development of Hung Shui Kiu/Ha Tsuen New Development Area (Fifth Batch) at
a cash compensation of approximately HK$107 million; and (ii) an aggregate land area of
approximately 2,149,400 square feet falling within San Tin Technopole (Phase 1) at Yuen Long
(Second Batch) at a cash compensation of approximately HK$2,231 million. The post-tax gain
on land resumption attributable to both reported profit and underlying profit in the amount of
HK$1,278 million was recognised by the Group for the six months ended 30 June
2026.
During the corresponding six months ended 30 June 2025, the Group recognised resumption
proceeds of HK$353 million from the HKSAR Government in relation to the Group’s leasehold
land held for development for sale measuring an aggregate attributable land area of about
330,000 square feet held in Yuen Long South and Kam Tin, the New Territories, Hong Kong,
resulting in a post-tax gain on land resumption for the Group attributable to both reported profit
79
and underlying profit in the amount of HK$233 million for the corresponding six months ended
30 June 2025.
Issuance of a convertible bond during the previous year ended 31
December 2025
Under a subscription agreement dated 8 July 2025, on 16 July 2025, an indirect wholly-owned
subsidiary of the Company (the “Issuer”) through an independent financial institution as sole lead
manager completed the issuance of HK$8,000 million 0.5% guaranteed unsecured convertible
bonds due 2030 (the “Bonds”) which are convertible into fully-paid shares (“Shares”) in the share
capital of the Company (the “Conversion Shares”) at the option of the holders of the Bonds. The
conversion price of the conversion of the Bonds into Conversion Shares is currently adjusted to
HK$34.53 (the “Adjusted Conversion Price”) while being subject to further adjustments, and the
maturity date of the Bonds is 16 July 2030. The due payment of all amounts to be payable by
the Issuer and the due performance by the Issuer of its obligations under the Bonds have been
unconditionally and irrevocably guaranteed by the Company. The net proceeds from the issue
of the Bonds (net of expenses) amounted to approximately HK$7,920 million. The debt
component of the Bonds was initially recognised at the fair value of a similar liability that does
not have an equity conversion option. Taking into account the interest expenses incurred
(based on the effective interest rate) and the interest expenses paid and payable, both for the
period from initial recognition up to and including 30 June 2026, the carrying amounts of the
Bond’s debt component and equity component were HK$7,210 million and HK$887 million
respectively at 30 June 2026.
Subsequent to 16 July 2025 and up to and including 30 June 2026, no holders of the Bonds had
exercised the option to convert the Bonds into Conversion Shares.
Assuming full conversion of the Bonds at the Adjusted Conversion Price and no change to the
share capital of the Company, an aggregate of 231,682,594 Conversion Shares would be issued
by the Company representing approximately 4.57% of the total number of issued Shares at 30
June 2026 and as enlarged by the allotment and issue of the Conversion Shares.
Based on the Group’s cash and bank balances at 30 June 2026, the Group’s cash flow from
operating activities and the Group’s available committed undrawn bank loan facilities, the Group
has the ability to meet its redemption obligations under the Bonds.
Charge on assets
The assets of the Group’s subsidiaries were not charged to any party at 30 June 2026 and 31
December 2025.
Capital commitments
At 30 June 2026, capital commitments of the Group amounted to HK$11,173 million (31
December 2025: HK$13,819 million). In addition, the Group’s attributable share of capital
commitments undertaken by joint ventures and certain associates at 30 June 2026 amounted to
HK$3,816 million (31 December 2025: HK$3,244 million).
Contingent liabilities
At 30 June 2026, the Group’s contingent liabilities amounted to HK$6,640 million (31 December
2025: HK$6,057 million), which mainly included:80
(i)
an aggregate attributable amount of HK$863 million (31 December 2025: HK$242 million)
relating to performance bonds, guarantees and undertakings for the due and proper
performance of the obligations of the Group’s projects held by subsidiaries and joint
ventures, the increase of which is mainly attributable to the Group’s guarantees to a bank
in relation to the finance undertakings by such bank in favour of the HKSAR Government
for the project completion of “One Victoria Cove”, being the Group’s joint venture
residential-cum-commercial development project at 1 Bailey Street, Hung Hom, Kowloon,
Hong Kong under the terms and conditions of the relevant land grants;
(ii)
an amount of HK$908 million (31 December 2025: HK$946 million) relating to guarantees
given by the Group to financial institutions on behalf of purchasers of property units of the
Group’s development projects in Chinese Mainland in relation to which the related Building
Ownership Certificate (房產證) had not yet been issued at 30 June 2026 (and such
guarantees will be released upon the issuance of the Building Ownership Certificate);
(iii)
an amount of up to HK$3,278 million (31 December 2025: up to HK$3,278 million) relating
to the Group’s attributable and proportional share (in accordance with the Group’s
attributable interest in a joint venture engaged in the development of “One Victoria Cove”,
being a residential-cum-commercial development project situated on a site owned by the
Urban Renewal Authority at Bailey Street/Wing Kwong Street, To Kwa Wan, Kowloon,
Hong Kong and in which the Group has 50% equity interest (the “First Developer”)) of
contingent liabilities in respect of an irrevocable, unconditional and several guarantee
given by the Group to two lending banks in relation to 50% of the maximum amount which
may be drawn down by the First Developer on a loan facility of up to HK$6,556 million
which was entered into on 29 December 2023 between such lending banks and the First
Developer (and part of such proceeds refinanced the previous loan pursuant to the loan
facility agreement dated 25 July 2022 of up to HK$3,276 million entered into between a
lending bank and the First Developer and which matured on 28 January 2024); and
(iv)
an amount of up to HK$1,150 million (31 December 2025: up to HK$1,150 million) relating
to the Group’s attributable and proportional share (in accordance with the Group’s
attributable interest in a joint venture engaged in the development of a site at Nos. 983987A King’s Road and Nos. 16-94 Pan Hoi Street, Quarry Bay, Hong Kong and in which
the Group has 50% equity interest (the “Second Developer”)) of contingent liabilities in
respect of an irrevocable, unconditional and several guarantee given by the Group to the
lending bank in relation to 50% of the maximum amount which may be drawn down by the
Second Developer on a loan facility of up to HK$2,300 million which was entered into on
17 December 2025 between such lending bank and the Second Developer (and such
proceeds refinanced the previous shareholders’ loans advanced to the Second Developer
for the purpose of acquiring the land site for development).
Employees and remuneration policy
At 30 June 2026, the Group had 9,974 (31 December 2025: 10,078) full-time employees. The
remuneration of the employees is in line with the market and commensurate with the level of pay
in the industry. Discretionary year-end bonuses are payable to the employees based on
individual performance. Other benefits to the employees include medical insurance, retirement
scheme, training programmes and education subsidies.
Total staff costs for the six months ended 30 June 2026 amounted to HK$1,596 million (2025:
HK$1,594 million).
81
OTHER INFORMATION
Review of Interim Results
The unaudited interim results for the six months ended 30 June 2026 have been reviewed by the auditor
of the Company, KPMG in accordance with Hong Kong Standard on Review Engagements 2410 “Review
of interim financial information performed by the independent auditor of the entity” issued by the Hong
Kong Institute of Certified Public Accountants.
Purchase, Sale or Redemption of the Company’s Listed Securities
During the period, neither the Company nor any of its subsidiaries had purchased, sold or redeemed any
of the Company’s listed securities (including sale of treasury shares, if any).
Audit Committee
The Audit Committee met in August 2026 and reviewed the systems of internal control, risk management
and compliance, and the interim report for the six months ended 30 June 2026.
Corporate Governance
During the six months ended 30 June 2026, the Company complied with the applicable code provisions
set out in the Corporate Governance Code (the “CG Code”) as stated in Appendix C1 to the Rules
Governing the Listing of Securities on The Stock Exchange of Hong Kong Limited (the “Listing Rules”),
with the exception that the roles of the chairman and the chief executive officer of the Company have not
been segregated as required by the CG Code. The Company is of the view that it is in the best interest of
the Company that each of Dr Lee Ka Kit and Dr Lee Ka Shing, with his relevant in-depth expertise and
knowledge in the Group’s business, acts in the dual capacity as Chairman and Managing Director of the
Company. Although the roles of the chairman and the chief executive officer of the Company have not
been segregated, powers and authorities have not been over-concentrated as all major decisions are
made in consultation with Board members as well as appropriate Board committees and senior
management, who possess the relevant knowledge and expertise. Hence, the current arrangements are
subject to adequate checks and balances notwithstanding the deviation.
Model Code for Securities Transactions by Directors
The Company has adopted the Model Code for Securities Transactions by Directors of Listed Issuers set
out in Appendix C3 to the Listing Rules as the code for dealing in securities of the Company by the
Directors (the “Model Code”). Having made specific enquiry, the Company confirmed that all Directors
have complied with the required standards as set out in the Model Code.
82
Forward-Looking Statements
This announcement contains certain statements that are forward looking or which use certain forwardlooking terminologies. These forward-looking statements are based on the current beliefs, assumptions
and expectations of the Board of Directors of the Company regarding the industry and markets in which
it operates. These forward-looking statements are subject to risks, uncertainties and other factors beyond
the Company’s control which may cause actual results or performance to differ materially from those
expressed or implied in such forward-looking statements.
On behalf of the Board
Dr Lee Ka Kit
Dr Lee Ka Shing
Chairman
Chairman
Hong Kong, 20 August 2026
As at the date of this announcement, the Board comprises: (1) executive directors: Lee Ka Kit (Chairman and Managing Director),
Lee Ka Shing (Chairman and Managing Director), Lam Ko Yin, Colin (Vice Chairman), Yip Ying Chee, John, Fung Lee Woon
King, Kwok Ping Ho, Suen Kwok Lam, Wong Ho Ming, Augustine and Fung Hau Chung, Andrew; (2) non-executive director:
Lee Pui Ling, Angelina; and (3) independent non-executive directors: Ko Ping Keung, Wu King Cheong, Woo Ka Biu, Jackson,
Poon Chung Kwong and Au Siu Kee, Alexander.
83