|
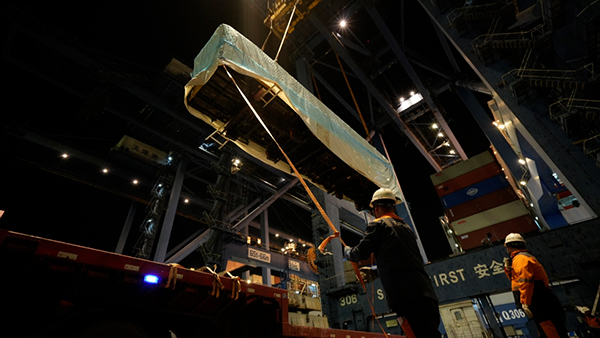
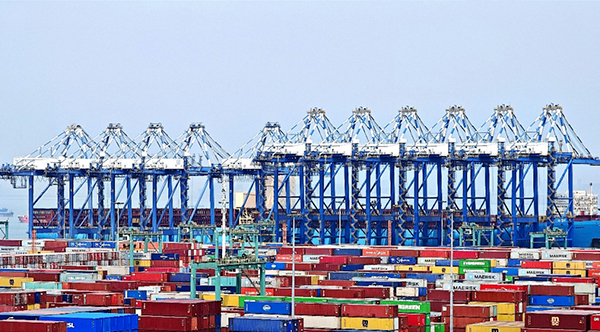
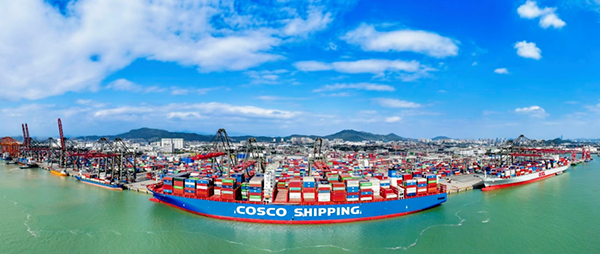
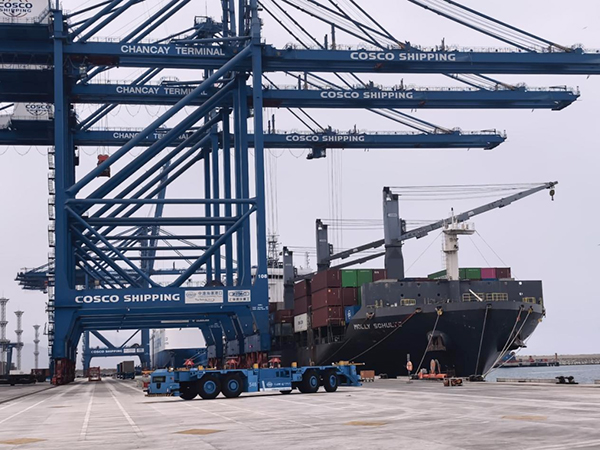
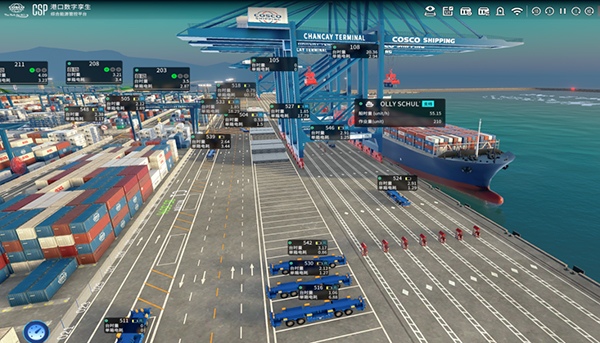
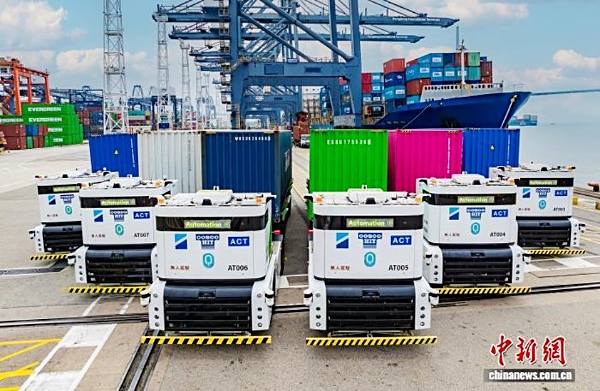
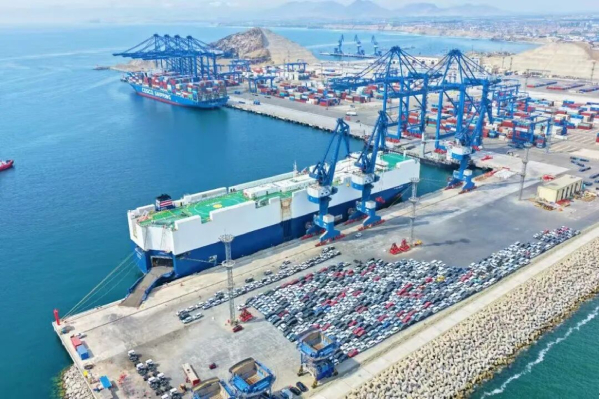
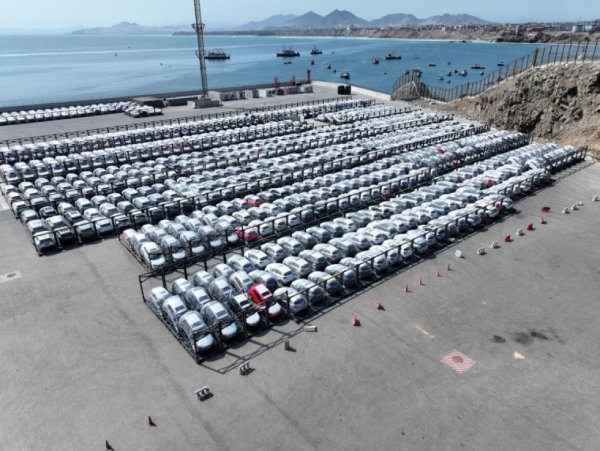
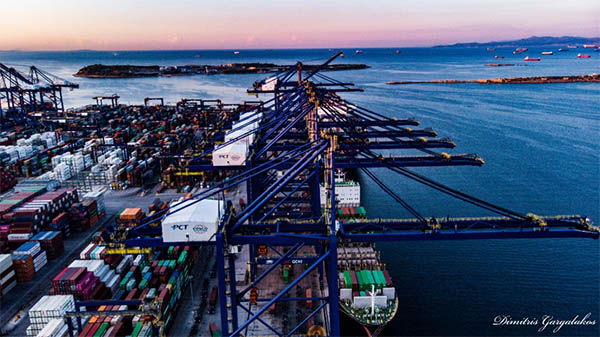
Cosco Shipping Ports Limited is a port operator that manages container terminals and provides logistics services. The company operates the CSP Chancay terminal and engages in multimodal transport, including routes for minerals and automobile frame operations. It serves markets in China and Peru, facilitating trade through port-shipping line synergies. Summarised from the company's own disclosures |
Industry Integrated Freight & Logistics | Homepage ports.coscoshipping.com |
| Sector Industrials | IR page ports.coscoshipping.com/en/Investors | |
|
Tags
port operations, container terminals, multimodal transport, logistics, automobile logistics, mineral transport, CSP Chancay, CSP Terminals
|
Press page ports.coscoshipping.com/en/Investors/AnnouncementsCirculars/Announcements |
Metrics
| Valuation | |
|---|---|
| Market cap | HK$ 27.39B |
| Market cap (USD) | $ 3.491B |
| P/E | 10.73 |
| PEG | — |
| P/BV | 0.39 |
| P/S | 3.49 |
| P/OCF | 10.70 |
| P/FCF | — |
| Dividend yield | 4.2% |
| Turnover / mcap | 0.18% |
| Returns | |
|---|---|
| ROE | 5.7% |
| ROI | 5.4% |
| ROIC | 3.7% |
| Profit margin | 34.7% |
| Growth | |
|---|---|
| Revenue growing | No |
| Profits growing | Yes |
| Revenue up 3y | No |
| Revenue up 5y | No |
| Earnings growth 3y (net profit CAGR) | -12.1% |
| Quality | |
|---|---|
| Profitable | Yes |
| Margin expanding | Yes |
| Buying back stock | No |
| Diluting (TTM) | Yes |
| Debt/Equity | 1.4% |
| Podcast bulls (TTM) | Sign up |
| Podcast bears (TTM) | Sign up |
| Podcast sentiment (TTM) | Sign up |
| Podcast sentiment % (TTM) | Sign up |
| News sentiment (TTM) | 7 |
| Quality score | 5.9% |
| Insiders | |
|---|---|
| Buys, 1w | Sign up |
| Buys, 1m | Sign up |
| Buys, 1y | Sign up |
| Sells, 1w | Sign up |
| Sells, 1m | Sign up |
| Sells, 1y | Sign up |
Sign up to see this company's insider trades
| Figure | FY 2020 | FY 2019 | FY 2018 | FY 2017 | FY 2016 | FY 2015 | FY 2014 | FY 2013 | FY 2012 | FY 2011 | FY 2010 |
|---|---|---|---|---|---|---|---|---|---|---|---|
| Revenue | 1.001B | 1.028B | 1B | 634.71M | 556.377M | 798.151M | 870.091M | 798.626M | 735.5M | 599.159M | 446.492M |
| Net profit | 347.474M | 308.017M | 324.583M | 512.454M | 247.031M | 381.644M | 292.759M | 702.676M | 342.194M | 388.771M | 361.307M |
| Figure | FY 2020 | FY 2019 | FY 2018 | FY 2017 | FY 2016 | FY 2015 | FY 2014 | FY 2013 | FY 2012 | FY 2011 | FY 2010 |
|---|---|---|---|---|---|---|---|---|---|---|---|
| Share price | 0.62 | 0.74 | 0.96 | 1.1 | — | — | — | — | — | — | — |
| Price performance 12m | -0.17 | -0.23 | -0.12 | — | — | — | — | — | — | — | — |
Sign up to see institutional holdings
Sign UpPodcast Mentions
Sign up to see podcast mentions and sentiment
Sign UpAnnouncements and reports published on HKEXnews, newest first, monthly and next-day returns, proxy forms and board-meeting notices included. The link opens the announcement on HKEXnews. Press releases from the company's own website, newest first.
COSCO SHIPPING Ports Limited 中遠海運港口有限公司
PRESS RELEASE COSCO SHIPPING Ports Announces 2026 Third Quarter Results Weaving New Connections Empowering Smart Journeys
Hong Kong, China, 29 October 2026 - COSCO SHIPPING Ports Limited (“COSCO SHIPPING Ports” or “CSP” or the “Company”, SEHK: 1199), the world’s leading ports logistics service provider, today announced the results of the Company and its subsidiaries (the “Group”) for the 3 months and 9 months ended 30 September 2026.
2026 Third Quarter Results Highlights
Total throughput increased by 8.4% YoY to 42,266,553 TEU Equity throughput increased by 8.1% YoY to 12,884,563 TEU Revenue of the Company increased by 13.0% YoY to US$484,325,000 Profit attributable to equity holders of the Company increased by 0.1% YoY to US$82,589,000
2026 9 Months Results Highlights
Total throughput increased by 8.1% YoY to 122,423,600 TEU Equity throughput increased by 7.4% YoY to 37,376,571 TEU Revenue of the Company increased by 12.6% YoY to US$1,389,669,000 Profit attributable to equity holders of the Company increased by 19.7% YoY to US$316,261,000
FINANCIAL REVIEW COSCO SHIPPING Ports continued to achieve steady improvements in operational quality and efficiency and leveraged an efficient and tightly-knit port and shipping network to lay a solid foundation for the sustainable development of its businesses. In the third quarter of 2026, revenue increased by 13.0% YoY to US$484.3 million while gross profit increased by 19.3% YoY to US$128.1 million, recording an increase in growth rate. The revenue for the first nine months increased by 12.6% YoY to 1
COSCO SHIPPING Ports Limited 中遠海運港口有限公司 US$1,389.7 million, gross profit increased by 12.6% YoY to US$367.6 million, and the profit attributable to equity holders of the Company increased by 19.7% YoY to US$316.3 million.
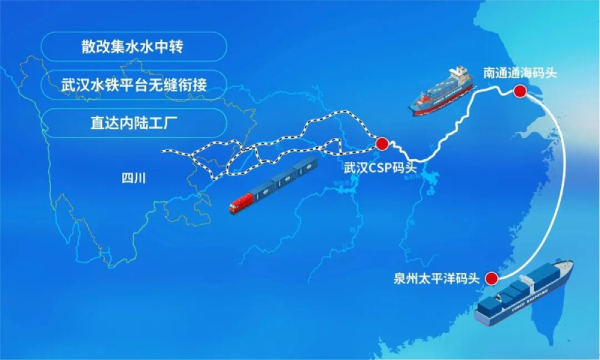
OPERATIONAL REVIEW China For the three months ended 30 September 2026, total throughput of the terminals in China increased by 4.9% YoY to 30,944,536 TEU (3Q2025: 29,502,970 TEU) and accounted for 73.2% of the Group’s total throughput. Total equity throughput of terminals in China increased by 4.9% YoY to 8,836,915 TEU (3Q2025: 8,422,090 TEU), accounting for 68.6% of the Group’s total equity throughput. Bohai Rim For the three months ended 30 September 2026, total throughput of the Bohai Rim region increased by 4.3% YoY to 14,119,086 TEU (3Q2025: 13,542,749 TEU) and accounted for 33.4% of the Group’s total. Total equity throughput of the Bohai Rim region increased by 3.5% YoY to 3,596,452 TEU (3Q2025: 3,475,303 TEU) and accounted for 27.9% of the Group’s total equity throughput. Driven by the increasing investment demand in artificial intelligence, exports of high-tech products recorded steady growth, contributing a 6.7% YoY increase in the total throughput of Dalian Container Terminal Co., Ltd. to 1,460,461 TEU (3Q2025: 1,368,930 TEU). Yangtze River Delta For the three months ended 30 September 2026, total throughput of the Yangtze River Delta region decreased by 0.3% YoY to 4,337,745 TEU (3Q2025: 4,351,648 TEU) and accounted for 10.3% of the Group’s total. Total equity throughput of the Yangtze River Delta region increased by 1.6% YoY to 1,267,657 TEU (3Q2025: 1,247,595 TEU) and accounted for 9.8% of the Group’s total equity throughput. Wuhan CSP Terminal Co., Ltd. (“CSP Wuhan Terminal”) has continued to consolidate its hub position and build a denser shipping route network. It has also continuously strengthened its port-railway cargo sourcing competitiveness, driving a 17.0% YoY increase in total throughput to 87,112 TEU (3Q2025: 74,429 TEU). Southeast Coast and Others For the three months ended 30 September 2026, total throughput of the Southeast Coast and Others region increased by 7.6% YoY to 1,514,882 TEU (3Q2025: 1,407,977 TEU) 2
COSCO SHIPPING Ports Limited 中遠海運港口有限公司 and accounted for 3.6% of the Group’s total throughput. Total equity throughput of Southeast Coast and Others region increased by 7.7% YoY to 1,179,290 TEU (3Q2025: 1,095,296 TEU) and accounted for 9.2% of the Group’s total equity throughput. Xiamen Ocean Gate Container Terminal Co., Ltd. launched several new foreign trade routes within the year, driving a 7.8% YoY increase in total throughput to 753,836 TEU (3Q2025: 699,553 TEU). Pearl River Delta For the three months ended 30 September 2026, total throughput of the Pearl River Delta region increased by 7.6% to 8,300,352 TEU (3Q2025: 7,710,996 TEU) and accounted for 19.6% of the Group’s total throughput. Total equity throughput of the Pearl River Delta region increased by 7.1% YoY to 2,225,574 TEU (3Q2025: 2,077,750 TEU) and accounted for 17.3% of the Group’s total equity throughput. Leveraging two-way trade with emerging markets such as Southeast Asia, Guangzhou South China Oceangate Container Terminal Company Limited recorded significant growth in both intra-Asia and Africa-bound routes, driving a 13.6% YoY increase in total throughput to 1,670,028 TEU (3Q2025: 1,470,426 TEU). Southwest Coast For the three months ended 30 September 2026, total throughput of the Southwest Coast region increased by 7.3% YoY to 2,672,471 TEU (3Q2025: 2,489,600 TEU), accounting for 6.3% of the Group’s total throughput. Total equity throughput of the Southwest Coast region increased by 7.9% YoY to 567,942 TEU (3Q2025: 526,146 TEU) and accounted for 4.4% of the Group’s total equity throughput. Beibu Gulf Port Co., Ltd. has accelerated the development of the Beibu Gulf International Gateway Port and International Hub Port, driven a YoY increase in Southwest Coast region.
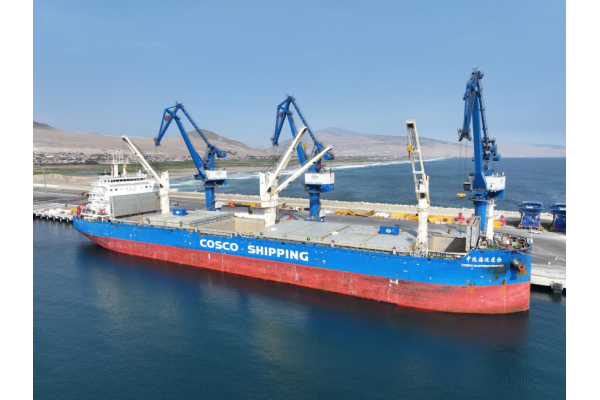
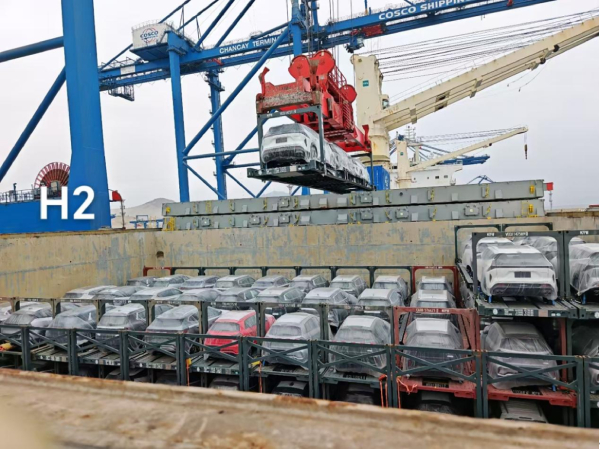
Overseas For the three months ended 30 September 2026, total throughput in overseas terminals increased by 19.4% YoY to 11,322,017 TEU (3Q2025: 9,478,574 TEU) and accounted for 26.8% of the Group’s total. Total equity throughput of overseas region increased by 15.6% YoY to 4,047,648 TEU (3Q2025: 3,499,958 TEU) and accounted for 31.4% of the Group’s total equity throughput. Benefiting from growing demand in the Mediterranean region, Piraeus Container Terminal Single Member S.A. (“Piraeus Terminal”) achieving a 11.4% YoY increase in total throughput to 1,090,284 TEU (3Q2025: 978,711 TEU). COSCO SHIPPING Ports Chancay PERU S.A. (“CSP Chancay Terminal”) made full efforts to improve its route network and actively build international logistics corridors, completing the “three mainlines and five feeders” route layout, further enhancing regional connectivity and driving a 24.9% YoY increase in 3
COSCO SHIPPING Ports Limited 中遠海運港口有限公司 total throughput to 139,669 TEU (3Q2025: 111,862 TEU).
PROSPECTS Since the beginning of 2026, the global economic and trade landscape has continued to undergo deep adjustments, with geopolitical tensions, changes in trade policies and supply chain cost pressures intertwined. Against this backdrop, COSCO SHIPPING Ports has continued to strengthen the resilience of its global network, actively respond to the spillover effects of the Middle East situation and the challenges brought by shipping alliance restructuring, and fully leverage its synergies with COSCO SHIPPING Group and the Ocean Alliance. In the third quarter, leveraging its global layout and prudent operations, the Company sustained YoY growth in both total throughput and profit attributable to equity holders, while operating quality and efficiency improved steadily. Recently, benefiting from supply chain adjustments and strong investment in artificial intelligence, both the International Monetary Fund (IMF) and the World Trade Organization (WTO) have upwardly revised their forecasts for global economic growth and global goods trade growth, with growth expected to continue in 2027. According to statistics from the General Administration of Customs of China, in the first three quarters of this year, the total value of goods imports and exports reached RMB39.94 trillion, representing a YoY increase of 18.8%. Of this, exports amounted to RMB23.2 trillion, a YoY increase of 16.4%, and imports totaled RMB16.74 trillion, a YoY increase of 22.3%. Market diversification continued to expand, with significant growth in imports and exports with free trade partners. The export structure continued to improve toward new and higher-quality products, with rapid growth in exports of high-tech products and green products. Looking ahead, although global economic and trade conditions still face considerable uncertainty, and the trajectory of the Middle East situation, energy price volatility, supply chain cost pressures and changes in trade policies will continue to affect the shipping market, the growth forecasts for the global economy and goods trade, as well as the strong momentum demonstrated by China’s foreign trade in terms of market diversification and export structure upgrading, bring positive opportunities to the port industry. In the face of opportunities and challenges, the Company will actively respond with a focus on the following three aspects. First, continuously optimize its global resource layout. We will seize opportunities in emerging markets and regional cooperation, enhance the service capabilities and risk resistance of key node ports, optimize trunk and feeder network connectivity, seek controlling stakes in strategic hub ports, and take equity stakes in key gateway ports at appropriate times, so as to build an efficient and 4
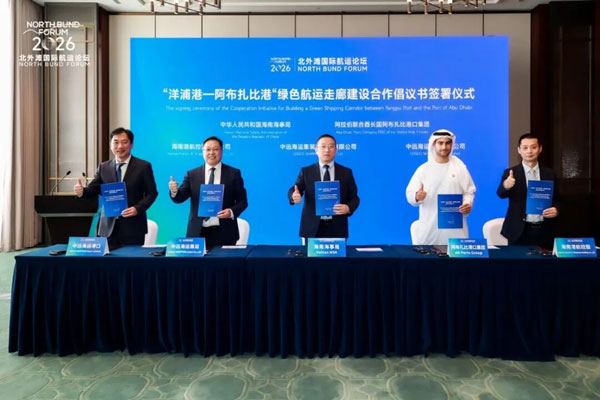
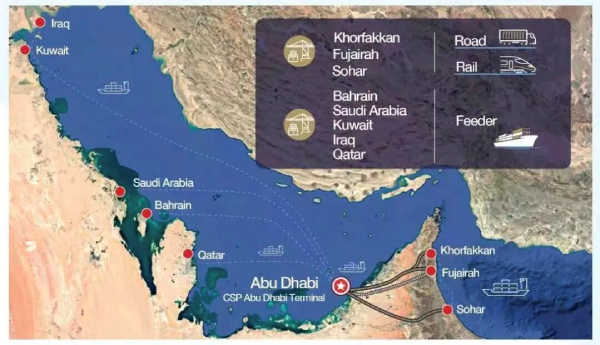
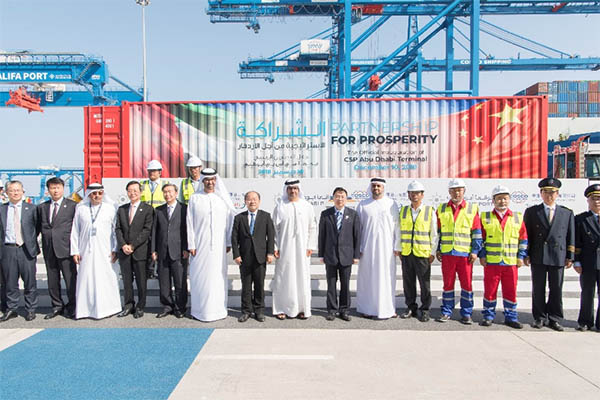
COSCO SHIPPING Ports Limited 中遠海運港口有限公司 collaborative global terminal system. At the same time, we will capture the opportunities brought by the recovery of the Suez Canal and strengthen service support and cargo sourcing capabilities at hub ports along the route. Second, deepen lean operations and synergies. We will strengthen the operational capabilities of hub ports such as CSP Wuhan Terminal, Piraeus Terminal, CSP Abu Dhabi Terminal and CSP Chancay Terminal, closely monitor the Middle East situation, and improve contingency plans and multi-route logistics corridors. We will adopt customer demand-oriented precision marketing, attract new shipping routes and extra vessel calls, deepen business linkages with the Group’s internal fleet, promote revenue growth and cost reduction, and use digital empowerment to improve terminal operating efficiency. Third, accelerate innovation-driven development. Focusing on the two main lines of “digital intelligence” and “green and low-carbon”, we will advance full-process automation of terminal operations and the application of artificial intelligence, expand the use of clean energy, participate in the construction of green fuel supply chains, cultivate new quality productive forces in the port and shipping industry, build new momentum for sustainable development, and create long-term stable returns for shareholders.
5
COSCO SHIPPING Ports Limited 中遠海運港口有限公司 About COSCO SHIPPING Ports (https://ports.coscoshipping.com) COSCO SHIPPING Ports Limited (Stock Code: 1199) is a leading ports logistics service provider in the world and its terminals portfolio covers the five main port regions and the middle and lower reaches of the Yangtze River in China, Europe, the Mediterranean, the Middle East, Southeast Asia, South America and Africa, etc. As at 30 September 2026, COSCO SHIPPING Ports operated and managed 395 berths at 40 ports globally, of which 245 were for containers. Building on the brand philosophy of “The Ports for ALL”, COSCO SHIPPING Ports has established its corporate mission of “Connecting Different Worlds” and is committed to maintaining a customer-centric approach to continuously improve the service and capacity of its global network and enhance the strategic positioning of key node ports and optimise logistics resource distribution. Leveraging ports as a conduit to connect global shipping services and serve global trade, the Company is dedicated to establishing a platform for mutual benefits and shared successes for all stakeholders involved with a vision of becoming “the leading global port logistics service provider with a customer-oriented focus”. Please visit the Company’s website(https://ports.coscoshipping.com)and the designated website of Hong Kong Exchanges and Clearing Limited(https://www.hkexnews.hk)for 2026 Third Quarter Results Announcement.
For further inquiry, please contact: COSCO SHIPPING Ports Limited Venus Zhao General Manager Public Relations Division Tel: 2809-8131 Fax: 2907-6088 Email: [email protected]
6
This announcement is made by the Company on a voluntary basis to enhance the practice of good corporate governance and further promote the transparency and accountability of the Company. The Company currently intends to continue to publish quarterly financial and operational highlights in the future. The board of directors of COSCO SHIPPING Ports Limited (the “Company” or “COSCO SHIPPING Ports”) presents the unaudited condensed consolidated results of the Company and its subsidiaries (the “Group”) for the three months and the nine months ended 30 September 2026.
Announcement of Results for the Three Months Ended 30 September 2026 ●
Total throughput increased by 8.4% YoY to 42,266,553 TEU
●
Equity throughput increased by 8.1% YoY to 12,884,563 TEU
●
Revenue of the Company increased by 13.0% YoY to US$484,325,000
●
Profit attributable to equity holders of the Company increased by 0.1% YoY to US$82,589,000
Announcement of Results for the Nine Months Ended 30 September 2026 ●
Total throughput increased by 8.1% YoY to 122,423,600 TEU
●
Equity throughput increased by 7.4% YoY to 37,376,571 TEU
●
Revenue of the Company increased by 12.6% YoY to US$1,389,669,000
●
Profit attributable to equity holders of the Company increased by 19.7% YoY to US$316,261,000
1
Financial Highlights 3Q 2026 Financial Highlights US$ (million)
Revenue Cost of sales Gross profit Share of profits from joint ventures and associates Profit attributable to equity holders of the Company Basic earnings per share (US cents)
3Q 2026 484.3 356.2 128.1 100.4 82.6 2.06
3Q 2025 428.7 321.3 107.4 93.1 82.5 2.13
Change (%) +13.0 +10.9 +19.3 +7.9 +0.1 -3.3
9 months 2026 1,389.7 1,022.1 367.6 272.2 316.3 7.95
9 months 2025 1,234.7 908.2 326.5 268.8 264.3 6.94
Change (%) +12.6 +12.5 +12.6 +1.2 +19.7 +14.6
9 months 2026 Financial Highlights US$ (million)
Revenue Cost of sales Gross profit Share of profits from joint ventures and associates Profit attributable to equity holders of the Company Basic earnings per share (US cents)
2
Unaudited Condensed Consolidated Balance Sheet As at 30 September 2026 As at 30 September 2026 US$’000
As at 31 December 2025 US$’000
4,363,500 974,699 89,039 407,995 1,164,991 3,894,692 119,416
4,431,490 987,163 82,811 434,532 1,119,036 3,723,808 129,500
149,413 111,888 7,972
149,620 111,511 4,128
11,283,605
11,173,599
23,625
22,927
307,135 9,350 7,479 1,408,304
233,830 8,326 12,360 1,332,387
1,755,893
1,609,830
Total assets
13,039,498
12,783,429
EQUITY Capital and reserves attributable to the equity holders of the Company Share capital Reserves
51,546 6,765,858
50,821 6,360,748
Non-controlling interests
6,817,404 1,158,291
6,411,569 1,131,796
Total equity
7,975,695
7,543,365
ASSETS Non-current assets Property, plant and equipment Right-of-use assets Investment properties Intangible assets Joint ventures Associates Loans to associates Financial assets at fair value through other comprehensive income Deferred tax assets Other non-current assets
Current assets Inventories Trade and other receivables, prepayments and contract assets Current tax recoverable Restricted bank deposits Cash and cash equivalents
3
LIABILITIES Non-current liabilities Deferred tax liabilities Lease liabilities Long term borrowings Loans from non-controlling shareholders of subsidiaries Pension and retirement liabilities Other long term liabilities
126,172 793,440 1,993,511
114,739 796,756 2,366,352
55,769 17,990 59,450
57,744 16,885 53,283
3,046,332
3,405,759
758,103 39,347 53,035 799,402 113,178 254,406
621,455 37,593 54,577 578,720 294,321 247,639
2,017,471
1,834,305
Total liabilities
5,063,803
5,240,064
Total equity and liabilities
13,039,498
12,783,429
Current liabilities Trade and other payables and contract liabilities Current tax liabilities Current portion of lease liabilities Current portion of long term borrowings Short term borrowings Put option liability
4
Unaudited Condensed Consolidated Income Statement
Note
Three months ended 30 September 2026 2025 US$’000 US$’000
Nine months ended 30 September 2026 2025 US$’000 US$’000
Revenues Cost of sales
484,325 (356,231)
428,670 (321,267)
1,389,669 (1,022,068)
1,234,678 (908,199)
Gross profit
128,094
107,403
367,601
326,479
Administrative expenses Other operating income, net
(56,047) 8,941
(48,321) 2,911
(150,084) 72,322
(134,742) 7,181
Operating profit Finance income Finance costs
80,988 6,422 (37,823)
61,993 7,379 (44,208)
289,839 17,544 (115,568)
198,918 20,313 (115,311)
49,587
25,164
191,815
103,920
20,773 79,620
16,077 76,995
58,723 213,457
47,719 221,109
118,236 (19,068)
463,995 (84,908)
99,168
379,087
Operating profit (after finance income and costs) Share of profits less losses of
- joint ventures
- associates
7 6 , 9 9 5
2
2 1 372,748 , (49,096) 1 0 323,652 9
Profit before taxation Taxation
149,980 (47,481)
Profit for the period
102,499
Profit attributable to: Equity holders of the Company Non-controlling interests
82,589 19,910
82,502 16,666
316,261 62,826
264,298 59,354
102,499
99,168
379,087
323,652
US2.06 cents US2.06 cents
US2.13 cents US2.13 cents
US7.95 cents US7.95 cents
US6.94 cents US6.94 cents
Earnings per share for profit attributable to equity holders of the Company
- Basic
- Diluted
1 1
5
Notes: 1.
3Basic earnings per share is calculated by dividing the profit attributable to equity holders of the Company by .the weighted average number of ordinary shares in issue during the period. During the three months and nine months ended 30 September 2026 were 4,016,710,738 shares and 3,979,081,436 shares respectively (three months and nine months ended 30 September 2025: 3,874,248,000 shares and 3,806,859,053 shares respectively). Diluted earnings per share is calculated based on the profit attributable to the equity holders of the Company and the weighted average number of ordinary shares in issue during the period, after adjusting for the number of dilutive potential ordinary shares deemed to be issued at no considerations as if all outstanding dilutive share options granted by the Company had been exercised. The Company had no potentially dilutive ordinary shares in issue during the three months and nine months ended 30 September 2026 and 2025.
4The accounting policies adopted in preparation of the financial data for the three months and nine months .ended 30 September 2026 are consistent with those used in the annual consolidated financial statements of the Group for the year ended 31 December 2025, except for the adoption of certain new standards and amendments to existing standards issued by the Hong Kong Institute of Certified Public Accountants which are mandatory for the financial year beginning 1 January 2026. The financial data are based on the internal records and financial data of the Group and are unaudited.
6
Operational Review For the three months ended 30 September 2026, the Group’s total throughput increased by 8.4% YoY to 42,266,553 TEU (3Q2025: 38,981,544 TEU). Among them, the total throughput from terminal companies in which the Group has controlling stakes increased by 2.4% YoY to 8,764,224 TEU (3Q2025: 8,560,759 TEU), accounting for 20.7% of the Group’s total throughput, while that of non-controlling terminal companies increased by 10.1% YoY to 33,502,329 TEU (3Q2025: 30,420,785 TEU), accounting for 79.3% of the Group’s total throughput. For the nine months ended 30 September 2026, the Group’s total throughput increased by 8.1% YoY to 122,423,600 TEU (3Q2025: 113,277,515 TEU). Among them, the total throughput from terminal companies in which the Group has controlling stakes increased by 2.5% YoY to 25,657,798 TEU (3Q2025: 25,042,777 TEU), accounting for 21.0% of the Group’s total throughput; while the total throughput of non-controlling terminal companies increased by 9.7% YoY to 96,765,802 TEU (3Q2025: 88,234,738 TEU), accounting for 79.0% of the Group’s total throughput. 3Q2026 (TEU)
3Q2025 (TEU)
Change (%)
Total Throughput Throughput from terminals in which the Group has controlling stakes Throughput from the Group’s non-controlling terminals
42,266,553
38,981,544
+8.4
8,764,224
8,560,759
+2.4
33,502,329
30,420,785
+10.1
Equity Throughput Equity throughput from terminals in which the Group has controlling stakes Equity throughput from the Group’s non-controlling terminals
12,884,563
11,922,048
+8.1
5,229,775
5,015,574
+4.3
7,654,788
6,906,474
+10.8
9 months 2026 (TEU)
9 months 2025 (TEU)
Change (%)
Total Throughput Throughput from terminals in which the Group has controlling stakes Throughput from the Group’s non-controlling terminals
122,423,600
113,277,515
+8.1
25,657,798
25,042,777
+2.5
96,765,802
88,234,738
+9.7
Equity Throughput Equity throughput from terminals in which the Group has controlling stakes Equity throughput from the Group’s non-controlling terminals
37,376,571
34,801,623
+7.4
15,171,737
14,707,117
+3.2
22,204,834
20,094,506
+10.5
7
China For the three months ended 30 September 2026, total throughput of the terminals in China increased by 4.9% YoY to 30,944,536 TEU (3Q2025: 29,502,970 TEU) and accounted for 73.2% of the Group’s total throughput. Total equity throughput of terminals in China increased by 4.9% YoY to 8,836,915 TEU (3Q2025: 8,422,090 TEU), accounting for 68.6% of the Group’s total equity throughput. Bohai Rim For the three months ended 30 September 2026, total throughput of the Bohai Rim region increased by 4.3% YoY to 14,119,086 TEU (3Q2025: 13,542,749 TEU) and accounted for 33.4% of the Group’s total. Total equity throughput of the Bohai Rim region increased by 3.5% YoY to 3,596,452 TEU (3Q2025: 3,475,303 TEU) and accounted for 27.9% of the Group’s total equity throughput. Driven by the increasing investment demand in artificial intelligence, exports of high-tech products recorded steady growth, contributing a 6.7% YoY increase in the total throughput of Dalian Container Terminal Co., Ltd. to 1,460,461 TEU (3Q2025: 1,368,930 TEU). Yangtze River Delta For the three months ended 30 September 2026, total throughput of the Yangtze River Delta region decreased by 0.3% YoY to 4,337,745 TEU (3Q2025: 4,351,648 TEU) and accounted for 10.3% of the Group’s total. Total equity throughput of the Yangtze River Delta region increased by 1.6% YoY to 1,267,657 TEU (3Q2025: 1,247,595 TEU) and accounted for 9.8% of the Group’s total equity throughput. Wuhan CSP Terminal Co., Ltd. (“CSP Wuhan Terminal”) has continued to consolidate its hub position and build a denser shipping route network. It has also continuously strengthened its port-railway cargo sourcing competitiveness, driving a 17.0% YoY increase in total throughput to 87,112 TEU (3Q2025: 74,429 TEU). Southeast Coast and Others For the three months ended 30 September 2026, total throughput of the Southeast Coast and Others region increased by 7.6% YoY to 1,514,882 TEU (3Q2025: 1,407,977 TEU) and accounted for 3.6% of the Group’s total throughput. Total equity throughput of Southeast Coast and Others region increased by 7.7% YoY to 1,179,290 TEU (3Q2025: 1,095,296 TEU) and accounted for 9.2% of the Group’s total equity throughput. Xiamen Ocean Gate Container Terminal Co., Ltd. launched several new foreign trade routes within the year, driving a 7.8% YoY increase in total throughput to 753,836 TEU (3Q2025: 699,553 TEU). Pearl River Delta For the three months ended 30 September 2026, total throughput of the Pearl River Delta region increased by 7.6% to 8,300,352 TEU (3Q2025: 7,710,996 TEU) and accounted for 19.6% of the Group’s total throughput. Total equity throughput of the Pearl River Delta region increased by 7.1% YoY to 2,225,574 TEU (3Q2025: 2,077,750 TEU) and accounted for 17.3% of the Group’s total equity throughput. Leveraging two-way trade with emerging markets such as Southeast Asia, Guangzhou South China Oceangate Container Terminal Company Limited recorded significant growth in both intra-Asia and Africa-bound routes, driving a 13.6% YoY increase in total throughput to 1,670,028 TEU (3Q2025: 1,470,426 TEU).
8
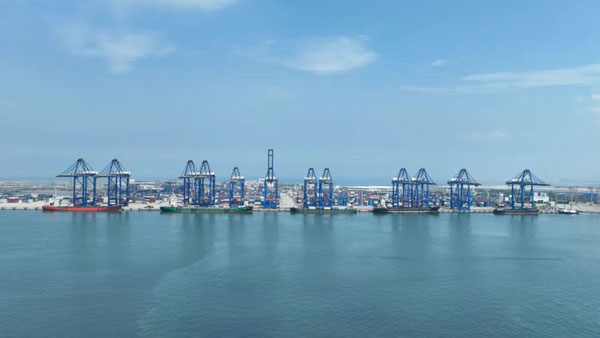
Southwest Coast For the three months ended 30 September 2026, total throughput of the Southwest Coast region increased by 7.3% YoY to 2,672,471 TEU (3Q2025: 2,489,600 TEU), accounting for 6.3% of the Group’s total throughput. Total equity throughput of the Southwest Coast region increased by 7.9% YoY to 567,942 TEU (3Q2025: 526,146 TEU) and accounted for 4.4% of the Group’s total equity throughput. Beibu Gulf Port Co., Ltd. has accelerated the development of the Beibu Gulf International Gateway Port and International Hub Port, driven a YoY increase in Southwest Coast region.
Overseas For the three months ended 30 September 2026, total throughput in overseas terminals increased by 19.4% YoY to 11,322,017 TEU (3Q2025: 9,478,574 TEU) and accounted for 26.8% of the Group’s total. Total equity throughput of overseas region increased by 15.6% YoY to 4,047,648 TEU (3Q2025: 3,499,958 TEU) and accounted for 31.4% of the Group’s total equity throughput. Benefiting from growing demand in the Mediterranean region, Piraeus Container Terminal Single Member S.A. (“Piraeus Terminal”) achieving a 11.4% YoY increase in total throughput to 1,090,284 TEU (3Q2025: 978,711 TEU). COSCO SHIPPING Ports Chancay PERU S.A. (“CSP Chancay Terminal”) made full efforts to improve its route network and actively build international logistics corridors, completing the “three mainlines and five feeders” route layout, further enhancing regional connectivity and driving a 24.9% YoY increase in total throughput to 139,669 TEU (3Q2025: 111,862 TEU).
9
Prospects Since the beginning of 2026, the global economic and trade landscape has continued to undergo deep adjustments, with geopolitical tensions, changes in trade policies and supply chain cost pressures intertwined. Against this backdrop, COSCO SHIPPING Ports has continued to strengthen the resilience of its global network, actively respond to the spillover effects of the Middle East situation and the challenges brought by shipping alliance restructuring, and fully leverage its synergies with COSCO SHIPPING Group and the Ocean Alliance. In the third quarter, leveraging its global layout and prudent operations, the Company sustained YoY growth in both total throughput and profit attributable to equity holders, while operating quality and efficiency improved steadily. Recently, benefiting from supply chain adjustments and strong investment in artificial intelligence, both the International Monetary Fund (IMF) and the World Trade Organization (WTO) have upwardly revised their forecasts for global economic growth and global goods trade growth, with growth expected to continue in 2027. According to statistics from the General Administration of Customs of China, in the first three quarters of this year, the total value of goods imports and exports reached RMB39.94 trillion, representing a YoY increase of 18.8%. Of this, exports amounted to RMB23.2 trillion, a YoY increase of 16.4%, and imports totaled RMB16.74 trillion, a YoY increase of 22.3%. Market diversification continued to expand, with significant growth in imports and exports with free trade partners. The export structure continued to improve toward new and higher-quality products, with rapid growth in exports of high-tech products and green products. Looking ahead, although global economic and trade conditions still face considerable uncertainty, and the trajectory of the Middle East situation, energy price volatility, supply chain cost pressures and changes in trade policies will continue to affect the shipping market, the growth forecasts for the global economy and goods trade, as well as the strong momentum demonstrated by China’s foreign trade in terms of market diversification and export structure upgrading, bring positive opportunities to the port industry. In the face of opportunities and challenges, the Company will actively respond with a focus on the following three aspects. First, continuously optimize its global resource layout. We will seize opportunities in emerging markets and regional cooperation, enhance the service capabilities and risk resistance of key node ports, optimize trunk and feeder network connectivity, seek controlling stakes in strategic hub ports, and take equity stakes in key gateway ports at appropriate times, so as to build an efficient and collaborative global terminal system. At the same time, we will capture the opportunities brought by the recovery of the Suez Canal and strengthen service support and cargo sourcing capabilities at hub ports along the route. Second, deepen lean operations and synergies. We will strengthen the operational capabilities of hub ports such as CSP Wuhan Terminal, Piraeus Terminal, CSP Abu Dhabi Terminal L.L.C. and CSP Chancay Terminal, closely monitor the Middle East situation, and improve contingency plans and multi-route logistics corridors. We will adopt customer demand-oriented precision marketing, attract new shipping routes and extra vessel calls, deepen business linkages with the Group’s internal fleet, promote revenue growth and cost reduction, and use digital empowerment to improve terminal operating efficiency. Third, accelerate innovation-driven development. Focusing on the two main lines of “digital intelligence” and “green and low-carbon”, we will advance full-process automation of terminal operations and the application of artificial intelligence, expand the use of clean energy, participate in the construction of green fuel supply chains, cultivate new quality productive forces in the port and shipping industry, build new momentum for sustainable development, and create long-term stable returns for shareholders.
10
Throughput of the Group for the three months and nine months ended 30 September 2026 was set out below: Three months ended 30 September 2026 2025 Change (TEU) (TEU) (%)
Nine months ended 30 September 2026 2025 Change (TEU) (TEU) (%)
Bohai Rim Qingdao Port International Co., Ltd. Dalian Container Terminal Co., Ltd. Dalian Dagang Container Terminal Co., Ltd. Tianjin Port Container Terminal Co., Ltd. Yingkou Terminals Note 1 Jinzhou New Age Container Terminal Co., Ltd. Qinhuangdao Port New Harbour Container Terminal Co., Ltd.
14,119,086 9,320,000 1,460,461 0 2,342,472 654,514 226,047
13,542,749 8,810,000 1,368,930 4,482 2,369,067 631,396 190,447
+4.3 +5.8 +6.7 -100.0 -1.1 +3.7 +18.7
41,602,634 27,540,000 4,156,310 1,075 6,946,570 1,923,616 545,416
39,378,491 25,840,000 3,941,054 13,358 6,674,310 1,856,151 571,963
+5.6 +6.6 +5.5 -92.0 +4.1 +3.6 -4.6
115,592
168,427
-31.4
489,647
481,655
+1.7
Yangtze River Delta Shanghai Pudong International Container Terminals Limited Shanghai Mingdong Container Terminals Limited Ningbo Yuan Dong Terminals Limited Lianyungang New Oriental International Terminals Co., Ltd. Taicang International Container Terminal Co., Ltd. Nantong Tonghai Port Co., Ltd. Wuhan CSP Terminal Co., Ltd.
4,337,745
4,351,648
-0.3
13,021,914
12,730,804
+2.3
764,133 1,814,235 861,419
793,970 1,848,129 880,881
-3.8 -1.8 -2.2
2,310,456 5,499,189 2,503,121
2,214,732 5,408,177 2,618,612
+4.3 +1.7 -4.4
318,892 84,566 407,388 87,112
289,283 59,028 405,928 74,429
+10.2 +43.3 +0.4 +17.0
977,907 233,895 1,211,657 285,689
856,882 184,924 1,225,533 221,944
+14.1 +26.5 -1.1 +28.7
Southeast Coast and others Xiamen Ocean Gate Container Terminal Co., Ltd. Quan Zhou Pacific Container Terminal Co., Ltd. Jinjiang Pacific Ports Development Co., Ltd. Kao Ming Container Terminal Corp.
1,514,882 753,836 378,955 61,611 320,480
1,407,977 699,553 368,891 40,092 299,441
+7.6 +7.8 +2.7 +53.7 +7.0
4,219,578 2,120,223 1,079,549 162,888 856,918
4,191,283 1,979,100 1,064,521 134,307 1,013,355
+0.7 +7.1 +1.4 +21.3 -15.4
Pearl River Delta Yantian Terminals Note 2 Guangzhou Terminals Note 3 Hong Kong Terminals Note 4
8,300,352 4,579,418 3,172,001 548,933
7,710,996 4,210,729 2,980,419 519,848
+7.6 +8.8 +6.4 +5.6
23,878,032 12,925,314 9,347,458 1,605,260
22,344,417 11,798,366 9,001,124 1,544,927
+6.9 +9.6 +3.8 +3.9
Southwest Coast Beibu Gulf Port Co., Ltd.
2,672,471 2,672,471
2,489,600 2,489,600
+7.3 +7.3
7,241,595 7,241,595
7,248,100 7,248,100
-0.1 -0.1
Overseas Piraeus Container Terminal Single Member S.A. CSP Zeebrugge Terminal NV
11,322,017 1,090,284 225,259
9,478,574 978,711 236,554
+19.4 +11.4 -4.8
32,459,847 3,085,434 654,064
1,010,582 97,734 1,305,646 9,562 602,676
950,108 414,509 1,327,816 1,595 582,115
+6.4 -76.4 -1.7 +499.5 +3.5
2,930,195 540,711 3,928,277 29,659 1,658,361
396,224 1,659,326 899,226 684,232 0 1,083,991 172,579 342,330 139,669 1,433,827 168,870
421,786 1,530,673 750,392 588,293 0 1,083,944 181,198 319,018 111,862 N/A N/A
-6.1 +8.4 +19.8 +16.3 N/A +0.0 -4.8 +7.3 +24.9 N/A N/A
1,227,391 4,697,309 2,342,418 2,015,438 0
42,266,553
38,981,544
+8.4
COSCO SHIPPING Ports (Spain) Holding, S.L. and its subsidiaries CSP Abu Dhabi Terminal L.L.C. COSCO-PSA Terminal Private Limited Reefer Terminal S.p.A. Euromax Terminal Rotterdam B.V. Kumport Liman Hizmetleri ve Lojistik Sanayi ve Ticaret A. Ş. Suez Canal Container Terminal S.A.E. Red Sea Gateway Terminal Company Limited Antwerp Gateway NV SSA Terminals (Seattle), LLC Note 5 Busan Port Terminal Co., Ltd. Vado Gateway S.p.A. HHLA Container Terminal Tollerort GmbH COSCO SHIPPING Ports Chancay PERU S.A. Laemchabang Terminals Note 6 Red Sea Container Terminals Company S.A.E. Note 7 Total
11
3,215,990 399,548 977,830 341,442 4,138,011 277,769
2 3 1 , 122,423,600 8 0 7
27,384,420 +18.5 3,033,606 3 +1.7 , 673,812 -2.9 06 732 2,800,515 33 +4.6 , ,,8 -55.3 1,210,267 168 0 +0.5 3,910,256 3,100 27,797 26,2 +6.7 2,1 1,754,574 975 -5.5 10 11, 1,146,973 1,0,75 +7.0 72 4,003,501 , ,59 +17.3 1, 267 2,167,816 4 +8.1 04, 75 1,872,017 60 ,6 +7.7 1, 5 0 3,6 N/A 8 7 3,195,795 797, 4 +0.6 7, 441,695 52, -9.5 1038, , 913,989 91 +7.0 61 231,807 059, + +47.3 69 N/A 145, N N/A 8 N/A 779/ N N/A A 9/. 35 113,277,515 A +8.1
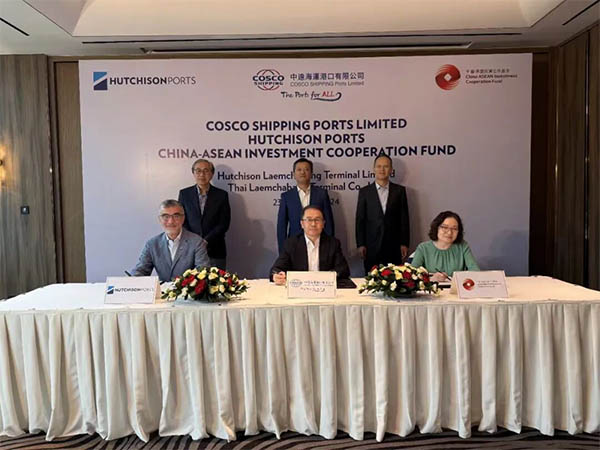
Note 1: Throughput of Yingkou Terminals was the total throughput of Yingkou Container Terminals Company Limited and Yingkou New Century Container Terminal Co., Ltd. Note 2: Throughput of Yantian Terminals was the total throughput of Yantian International Container Terminals Co., Ltd. and Yantian International Container Terminals (Phase III) Limited of Port of Yantian. Note 3: Throughput of Guangzhou Terminals was the total throughput of Guangzhou South China Oceangate Container Terminal Company Limited and Nansha Stevedoring Corporation Limited of Port of Guangzhou. Note 4: Throughput of Hong Kong Terminals was the total throughput of COSCO-HIT Terminals (Hong Kong) Limited and Asia Container Terminals Limited of Port of Hong Kong. Note 5: The terminal suspended operations in the first nine months of 2026 due to new local stormwater discharge regulations. Note 6: The equity transfer of Laemchabang Terminals was completed on 17 September 2025 and its throughput has been included since October 2025. Throughput of Laemchabang Terminals was the total throughput of Hutchison Laemchabang Terminal Limited and Thai Laemchabang Terminal Co., Ltd. Therefore, no comparable figure is available for the throughput for the three months and nine months ended 30 September 2025. Note 7: The terminal commenced operations on 15 January 2026 and its throughput has been included since January 2026. Therefore, no comparable figure is available for the throughput for the three months and nine months ended 30 September 2025. Note 8: Total throughput of bulk cargo, excluding the throughput of Beibu Gulf Port Co., Ltd., for the three months and nine months ended 30 September 2026 were 115,313,615 tons and 344,383,441 tons respectively (three months and nine months ended 30 September 2025: 114,563,695 tons and 341,010,549 tons respectively), representing an increase of 0.7% and an increase of 1.0% respectively. Total throughput of automobile for the three months and nine months ended 30 September 2026 were 92,192 vehicles and 339,328 vehicles respectively (three months and nine months ended 30 September 2025: 147,174 vehicles and 401,737 vehicles respectively), representing a decrease of 37.4% and a decrease of 15.5% respectively. Throughput of reefer of Reefer Terminal S.p.A. (Vado Reefer Terminal) for the three months and nine months ended 30 September 2026 were 64,688 pallets and 201,452 pallets respectively (three months and nine months ended 30 September 2025: 66,144 pallets and 218,043 pallets respectively), representing a decrease of 2.2% and a decrease of 7.6% respectively.
12
Caution Statement The Company’s shareholders and potential investors should note that all the figures contained herein are unaudited. Investors are cautioned not to rely on the financial and operational highlights for the three months and nine months ended 30 September 2026. The Company’s shareholders and potential investors are urged to exercise caution when dealing in the shares of the Company and are recommended to consult their professional advisers if they are in doubt as to their investment positions. By Order of the Board COSCO SHIPPING Ports Limited ZHU Tao Chairman
Hong Kong, 29 October 2026 As at the date of this announcement, the Board comprises Mr. ZHU Tao1 (Chairman), Ms. WU Yu1 (Managing Director), Mr. MA Xianghui2, Mr. CHEN Shuai2, Mr. GU Jinshan2, Mr. LAM Yiu Kin3, Prof. CHAN Ka Lok3, Mr. YANG Liang Yee Philip3 and Prof. TAM Kam Lan, Annie3. 1
Executive Director Non-executive Director 3 Independent Non-executive Director 2
13
















Prompts
Click prompts to add them under the company line, click again to take one out, then copy the result into your AI chat. Shared by Asian Century Stocks and Uncovered Thai Stocks. Thank you.
ETFs Holding Cosco Shipping Ports Limited
Exchange-traded funds whose newest published daily portfolio holds one of the company's listings, largest weight first.