VOLUNTARY ANNOUNCEMENT - PHASE II CLINICAL DATA OF TQ-A3334 "TLR7 AGONIST" PRESENTED AT THE 2026 AASLD
Bull 5
Bear 0
Clinical/regulatory
|
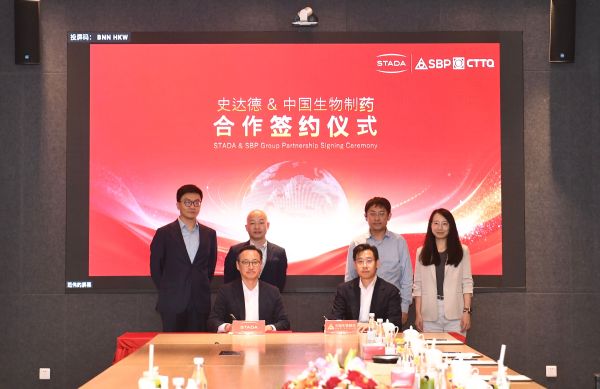
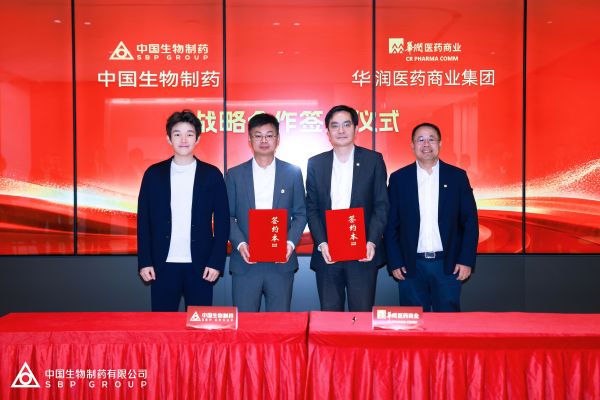
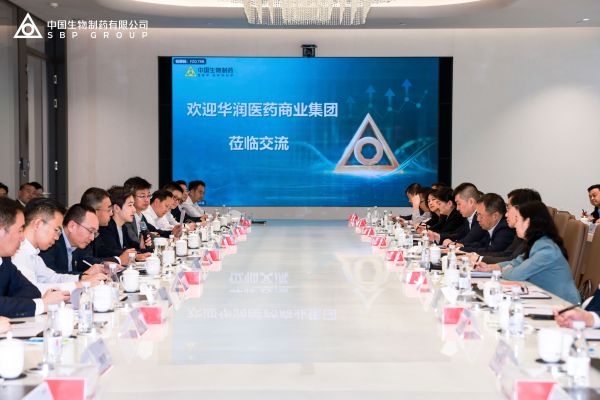
Sino Biopharmaceutical Limited is an investment holding company whose subsidiaries develop and commercialize pharmaceuticals, primarily in oncology, liver and cardiometabolic diseases, and respiratory and autoimmune conditions. The group's key products include anlotinib, benmelstobart, culmerciclib, rovadicitinib, and magnesium isoglycyrrhizinate, alongside a pipeline of antibody-drug conjugates, bispecific antibodies, and siRNA therapeutics. It operates R&D centers in Shanghai, Nanjing, Beijing, and Guangzhou, and serves markets in China and internationally, including the United States and Australia. In 2026, the company granted Sanofi an exclusive global license for rovadicitinib. The group also maintains a strategic partnership with China Resources Pharmaceutical Group. Summarised from the company's own disclosures, fiscal year ended Apr 2026 |
Industry Drug Manufacturers - General | Homepage sbpgroup.com |
| Sector Healthcare | IR page sbpgroup.com/investor-relations | |
|
Tags
oncology, antibody-drug conjugates, bispecific antibodies, sirna therapeutics, liver diseases, cardiometabolic diseases, respiratory diseases, autoimmune diseases, small molecules, protein degraders, Saitanxin, Culmerciclib, Hernexeos, Zongertinib, Putanning, Meloxicam, Anqixin, Recombinant Human Coagulation Factor VIIa, Focus V, Anlotinib, Andewei, Benmelstobart, Anxu, Rovadicitinib, Yilishu, Efbemalenograstim Alfa, Anboni, Unecritinib, Anluoqing, Envonalkib, Anfangning, Garsorasib, Anbeisi, Bevacizumab, Delituo, Rituximab, Saituo, Trastuzumab, Paletan, Pertuzumab, LM-302, LM-108, M701, TQB2868, TQB2102, TQB3019, Tianqing Ganmei, Magnesium Isoglycyrrhizinate, Lanifibranor, CPX101, Kylo-11, Kylo-12, Kylo-0603, TQC3721, Zhengda Tianqing, Sanofi
|
Press page — |
Metrics
| Valuation | |
|---|---|
| Market cap | HK$ 100.23B |
| Market cap (USD) | $ 12.773B |
| P/E | 36.77 |
| PEG | 0.99 |
| P/BV | 1.77 |
| P/S | 2.53 |
| P/OCF | 8.15 |
| P/FCF | — |
| Dividend yield | 2.2% |
| Turnover / mcap | 0.20% |
| Returns | |
|---|---|
| ROE | 12.5% |
| ROI | 10.5% |
| ROIC | 10.5% |
| Profit margin | 16.7% |
| Growth | |
|---|---|
| Revenue growing | Yes |
| Profits growing | Yes |
| Revenue up 3y | No |
| Revenue up 5y | No |
| Earnings growth 3y (net profit CAGR) | 37.2% |
| Quality | |
|---|---|
| Profitable | Yes |
| Margin expanding | Yes |
| Buying back stock | Yes |
| Diluting (TTM) | No |
| Debt/Equity | 18.7% |
| Podcast bulls (TTM) | Sign up |
| Podcast bears (TTM) | Sign up |
| Podcast sentiment (TTM) | Sign up |
| Podcast sentiment % (TTM) | Sign up |
| News sentiment (TTM) | 0 |
| Quality score | 35.3% |
| Insiders | |
|---|---|
| Buys, 1w | Sign up |
| Buys, 1m | Sign up |
| Buys, 1y | Sign up |
| Sells, 1w | Sign up |
| Sells, 1m | Sign up |
| Sells, 1y | Sign up |
Sign up to see this company's insider trades
| Figure | FY 2025 | FY 2024 | FY 2023 | FY 2022 | FY 2021 | FY 2020 | FY 2019 | FY 2018 | FY 2017 | FY 2016 | FY 2015 | FY 2014 | FY 2013 | FY 2012 | FY 2011 | FY 2010 |
|---|---|---|---|---|---|---|---|---|---|---|---|---|---|---|---|---|
| Revenue | 31.834B | 28.866B | 26.199B | 28.78B | 26.861B | 23.647B | 24.234B | 20.889B | 14.819B | 13.6B | 11.834B | 9.847B | 7.82B | 6.819B | 4.761B | 3.559B |
| Net profit | 5.315B | 3.5B | 2.332B | 2.544B | 14.608B | 2.771B | 2.707B | 9.046B | 2.171B | 1.644B | 1.447B | 1.204B | 818.856M | 729.513M | 381.039M | 493.798M |
Sign up to see institutional holdings
Sign UpPodcast Mentions
Sign up to see podcast mentions and sentiment
Sign UpAnnouncements and reports published on HKEXnews, newest first, monthly and next-day returns, proxy forms and board-meeting notices included. The link opens the announcement on HKEXnews. Press releases from the company's own website, newest first.





















Prompts
Click prompts to add them under the company line, click again to take one out, then copy the result into your AI chat. Shared by Asian Century Stocks and Uncovered Thai Stocks. Thank you.
Sino Biopharmaceutical Limited (ticker 1177), listed in Hong Kong.
Copied
Company History
Name and ticker changes, and re-registrations under a new regulatory id. When a ticker stopped being used is not recorded, so former tickers are undated.
| Date | Change | Detail |
|---|---|---|
| Jun 30, 2017 | Reporting currency | Its HK reports are in CNY instead of HKD from this period. Earlier figures are shown in CNY, converted at each period end's exchange rate. |
ETFs Holding Sino Biopharmaceutical Limited
Exchange-traded funds whose newest published daily portfolio holds one of the company's listings, largest weight first.
| ETF | Weight in ETF | Shares | Market value | As of |
|---|---|---|---|---|
| MEMA | 0.97% | 175,000 | $ 121.663K | Aug 31, 2026 |
| EMOP | 0.48% | 17,932,000 | $ 10.084M | Jun 30, 2026 |
| TDI | 0.38% | 2,435,000 | $ 1.369M | Jun 30, 2026 |
| DEHP | 0.16% | 912,000 | $ 647.555K | Nov 12, 2026 |
| AVSE | 0.13% | 396,000 | $ 276.147K | Nov 16, 2026 |
| AVEM | 0.12% | 46,694,500 | $ 32.562M | Nov 16, 2026 |
| DFSE | 0.10% | 797,000 | $ 565.9K | Nov 12, 2026 |
| REMG | 0.07% | 140,000 | $ 78.721K | Jun 30, 2026 |
| NTSE | 0.06% | 66,000 | $ 37.115K | Jun 30, 2026 |
| DFAE | 0.05% | 6,358,000 | $ 4.514M | Nov 12, 2026 |
| DFEM | 0.04% | 5,359,000 | $ 3.805M | Nov 12, 2026 |
| DFAX | 0.02% | 3,258,000 | $ 2.313M | Nov 12, 2026 |