Pursuant to the rules and regulations of the China Securities Regulatory Commission and the Shanghai Stock Exchange, China Shenhua Energy Company Limited is required to announce quarterly report. This announcement is made pursuant to Rule 13.09(2)…
Pursuant to the rules and regulations of the China Securities Regulatory Commission and the
Shanghai Stock Exchange, China Shenhua Energy Company Limited is required to announce
quarterly report. This announcement is made pursuant to Rule 13.09(2) and Rule 13.10B of the
Rules Governing the Listing of Securities on The Stock Exchange of Hong Kong Limited and
the Inside Information Provisions under Part XIVA of the Securities and Futures Ordinance (Cap.
571 of the Laws of Hong Kong).
The board of directors of the Company (the “Board”) hereby presents the results of the Group
for the nine months ended 30 September 2026 prepared in accordance with the IFRS Accounting
Standards. Such results have not been audited or reviewed by the independent auditors.
1
IMPORTANT NOTICE:
•
The Board and the directors and senior management of the Company warrant that this
quarterly report does not contain any misrepresentations, misleading statements or material
omissions, and are liable for the authenticity, accuracy and completeness of the information
contained herein, and shall jointly and severally accept legal liability.
•
Zhang Changyan, person-in-charge of the Company, Zhang Changyan, person-in-charge of
the accounting function of the Company and Yu Yanling, person-in-charge of the accounting
department of the Company, warrant the authenticity, accuracy and completeness of the
financial information contained in the quarterly report.
•
This report was approved at the twenty-third meeting of the sixth session of the Board of the
Company.
•
The third quarterly financial statements have not been audited.
I.
MAJOR FINANCIAL INDICATORS
(I)
Major accounting data and financial indicators
Unit: RMB million
Item
Revenue
Profit for the period
attributable to equity
holders of the Company
Basic earnings per share
(RMB/share)
Net cash generated from
operating activities
Change for
the period
from the
beginning
of the year
Change
to the end
for the
of the
Reporting From the
Reporting
Period beginning of
Period as
as compared the year to
compared
The
to the same the end of
to the same
Reporting
period the Reporting
period
Period The same period last year last year
Period The same period last year last year
Before
After
After
Before
After
After
restatement restatement restatement
restatement restatement restatement
%
%
106,693
16,263
75,042
14,660
96,228
15,858
10.9
2.6
296,031
47,317
213,151
41,366
271,651
46,336
9.0
2.1
0.750
0.738
0.749
0.1
2.198
2.082
2.187
0.5
N/A
N/A
N/A
N/A
92,700
65,253
75,315
23.1
2
As at the end
of the Reporting
Period
Total assets
Equity attributable to equity holders of the Company
Change as at the
end of the Reporting
Period as compared
to the end of
As at the end of last year
last year
Before restatement After restatement After restatement
%
924,371
453,033
631,777
412,576
912,431
519,946
1.3
(12.9)
Reasons for retrospective adjustment or restatement:
As at the end of the Reporting Period, the Company completed the acquisition of the
equity interests in 12 target companies held in aggregate by the Controlling Shareholder,
China Energy, and its wholly-owned subsidiary, Western Energy. For details, please
refer to the H share announcements published by the Company on 15 August and 19
December 2025, and 22 January, 28 January, 30 January, 5 February, 12 February, 12
March, 17 March and 30 March 2026 on the website of The Stock Exchange of Hong
Kong Limited (www.hkexnews.hk). Except for Jinshen Energy, the remaining 11 target
companies have been included in the consolidated financial statements of the Company.
The above acquisition falls under a business combination under common control. The
Company has made retrospective adjustments to the comparative consolidated financial
statements presented in this report in accordance with the relevant provisions.
(II) Major differences in preparing financial statements under different accounting
standards
Unit: RMB million
Net profit
Net assets
attributable to equity
attributable to equity
holders of the Company holders of the Company
January to
As at 31
January to September
As at 30
December
September
2025 September
2025
2026
(Restated)
2026
(Restated)
Under China Accounting
Standards for Business
Enterprises
Adjustments for:
Simple production
maintenance, safety
production and other related
expenditures
Under IFRS Accounting
Standards
3
44,403
42,780
444,569
512,016
2,914
3,556
8,464
7,930
47,317
46,336
453,033
519,946
Explanation on differences in accounting data under domestic and overseas accounting
standards:
Pursuant to the relevant regulations of the related government authorities in the PRC,
the Group accrued provisions for simple production maintenance, safety production
and other related expenditures, which are recognised as expenses in profit or loss for
the current period and separately recorded as a specific reserve in shareholders’ equity.
Upon utilisation of the specific reserve as fixed assets within the stipulated scope, the
full amount of accumulated depreciation is recognised at the same time when the cost
of the relevant assets is recorded. Under IFRS Accounting Standards, these expenses
are recognised in profit or loss as and when incurred. Relevant capital expenditure is
recognised as property, plant and equipment when incurred and depreciated according
to the relevant depreciation method. The effect on deferred tax arising from such
difference is also reflected.
(III) Changes in major items of the consolidated financial statements and the main
reasons thereof
Unit: RMB million
No.
Items of
consolidated
statement of profit
January to
or loss and other
January to September
comprehensive
September
2025
income
2026 (Restated)
1
Revenue
296,031
271,651
2
Cost of sales
(209,285)
(189,424)
3
Other gains and
losses
113
517
4
Other expenses
(1,281)
(544)
5
Interest income
1,628
2,030
6
Finance costs
(4,017)
(3,581)
7
Share of results of
associates
2,273
3,275
4
Change Main reasons for changes
%
9.0 G r o w t h i n r e v e n u e f r o m
coal, coal chemical, power
generation and other
operations
10.5 Increase in the purchase cost of
purchased coal; and increase
in procurement cost of coal
for power generation
(78.1) H i g h e r i n v e s t m e n t i n c o m e
generated from the disposal
of subsidiaries in the
corresponding period of the
last year
135.5 I n c r e a s e i n l a t e p a y m e n t
surcharges and other expenses
of the Group
(19.8) Decrease in the Group’s deposit
balance
12.2 I n c r e a s e i n t h e G r o u p ’ s
borrowings
(30.6) Decrease in the Company ’ s
investment income from
associates
Unit: RMB million
No.
Items of
consolidated
statement of
financial position
As at
As at 31 December
30 September
2025
2026 (Restated)
Change Main reasons for changes
%
1
Construction in
progress
56,711
48,730
2
Interests in associates
82,476
71,633
3
Other non-current
assets
Inventories
Accounts and bills
receivables
Financial assets at
fair value through
other comprehensive
income
Prepaid expenses and
other current assets
Restricted bank
deposits
59,597
68,269
17,811
30,209
15,280
22,198
862
2,010
(57.1) Decrease in bank acceptance bills
scheduled for discounting or
endorsement
24,643
28,240
15,472
20,077
57,947
70,449
(12.7) Decrease in deposits, security
deposits, etc.
(22.9) Decrease in the balance of the special
account for the mine geological
environment treatment and
restoration fund
(17.7) Recovery of matured partial time
deposits
59,755
50,487
4
5
6
7
8
9
10
Time deposits with
original maturity over
three months
Cash and cash
equivalents
11
Short-term borrowings
79,462
29,624
12
Accrued expenses and
other payables
Current portion of
long-term liabilities
87,478
57,044
6,083
13,205
14
Contract liabilities
11,848
6,174
15
Long-term liabilities
27,120
30,862
13
5
16.4 C o n t i n u e d i n v e s t m e n t i n c o a l
chemical, power generation and
coal projects under construction
15.1 Increase in the investment in
associates, such as the Finance
Company and Jinshen Energy and
recognition of investment income
from associates
(12.7) D e c r e a s e i n p r e p a y m e n t f o r
construction and equipment
16.6 Increase in coal inventories
36.1 Increase in sales bills settlement
18.4 Net cash generated from operating
activities during the Reporting
Period
168.2 The increase in the loans for mergers
and acquisitions
53.4 2026 interim dividend declared but
not yet paid by the Company
(53.9) Certain amounts included in the
current portion of long-term
liabilities were repaid upon
maturity
91.9 Increase in advance receipts from
coal sales proceeds
(12.1) Payment of long-term payables
for mining rights by certain coal
subsidiaries and branches of the
Group
Unit: RMB million
No.
II.
Items of
condensed
consolidated
statement of
cash flows
January
January to September
to September
2025
2026 (Restated)
1
Net cash generated
from operating
activities
92,700
75,315
2
Net cash used in
investing activities
(34,869)
(28,857)
3
Net cash used in
financing activities
(48,215)
(66,440)
Change Main reasons for changes
%
23.1 Year-on-year increase in the Group’s
income from coal, coal chemical,
power generation and other
operations
20.8 Relatively more cash paid by the
Group for the acquisition and
construction of long-term assets
and increase in capital investment
in associates
(27.4) Relatively large amount of cash from
additional borrowings received by
the Company
SHAREHOLDER INFORMATION
Total number of shareholders of ordinary shares, number of shareholders of preference
shares with restored voting rights and shareholdings of the top ten shareholders
Total number of shareholders of ordinary shares at the end of the
Reporting Period (accounts)
Including: Holders of A shares (including China Energy) (accounts)
Registered holders of H shares (accounts)
6
185,813
184,213
1,600
Unit: share
Name of shareholders
Shareholdings of top 10 shareholders (excluding lending of shares by way of refinancing)
Number
Shares pledged,
of shares
marked or frozen
held subject
Nature of
Number of
to selling
shareholder
shares held Percentage restrictions Status
Number
%
China Energy Investment Corporation Limited
(國家能源投資集團有限責任公司)
HKSCC NOMINEES LIMITED
China Securities Finance Corporation Limited
(中國證券金融股份有限公司)
China Life Insurance Company Limited –
Traditional – General Insurance Products –
005L – CT001 Shanghai
(中國人壽保險股份有限公司-傳統-普通
保險產品-005L-CT001 滬)
China Reform Investment Co., Ltd.
(國新投資有限公司)
Guoxin Hongsheng Investment (Beijing) Co., Ltd.
(國新宏盛投資(北京)有限公司)
Taiping Life Insurance Company Limited –
Traditional-General Insurance Products022L-CT001 Shanghai
(太平人壽保險有限公司-傳統-普通保險
產品-022L-CT001 滬)
Hong Kong Securities Clearing Company Limited
Guofeng Xinghua (Beijing) Private Equity Fund
Management Co., Ltd. – Honghu Zhiyuan
(Shanghai) Private Investment Fund Co., Ltd.
(國豐興華(北京)私募基金管理有限公司-
鴻鵠志遠(上海)私募投資基金有限公司)
Taiping Life Insurance Company Limited
(太平人壽保險有限公司)
State-owned
corporation
Overseas
corporation
Others
15,175,957,642
69.97 1,363,248,446 Nil
N/A
3,371,074,301
15.54
0 Unknown
N/A
436,687,905
2.01
0 Nil
N/A
Others
275,706,192
1.27
87,871,853 Nil
N/A
State-owned
corporation
State-owned
corporation
Others
199,309,722
0.92
0 Nil
N/A
158,964,273
0.73
0 Nil
N/A
114,321,009
0.53
94,956,525 Nil
N/A
Overseas
corporation
Others
85,581,666
0.39
0 Nil
N/A
55,987,298
0.26
0 Nil
N/A
54,958,845
0.25
0 Nil
N/A
State-owned
corporation
7
Unit: share
Name of shareholders
Shareholdings of top 10 shareholders not subject to selling restrictions
(excluding lending of shares by way of refinancing)
Number of shares
Type and number of shares
held not subject
to selling
restrictions Type
China Energy Investment Corporation Limited (國
家能源投資集團有限責任公司)
HKSCC NOMINEES LIMITED
China Securities Finance Corporation Limited (中
國證券金融股份有限公司)
China Reform Investment Co., Ltd.
(國新投資有限公司)
China Life Insurance Company Limited –
Traditional – General Insurance Products –
005L – CT001 Shanghai (中國人壽保險股份
有限公司-傳統-普通保險產品-005L-
CT001 滬)
Guoxin Hongsheng Investment (Beijing) Co., Ltd.
(國新宏盛投資(北京)有限公司)
Hong Kong Securities Clearing Company Limited
Guofeng Xinghua (Beijing) Private Equity Fund
Management Co., Ltd. – Honghu Zhiyuan
(Shanghai) Private Investment Fund Co., Ltd.
(國豐興華(北京)私募基金管理有限公司-鴻
鵠志遠(上海)私募投資基金有限公司)
Taiping Life Insurance Company Limited
(太平人壽保險有限公司)
Guofeng Xinghua (Beijing) Private Equity Fund
Management Co., Ltd. - Guofeng Xinghua
Honghu Zhiyuan Private Securities Investment
Fund II (國豐興華(北京)私募基金管理有限公
司-國豐興華鴻鵠志遠二期私募證券投資基
金)
8
Number
13,812,709,196 RMB ordinary shares
13,812,709,196
3,371,074,301 Overseas-listed foreign
shares
436,687,905 RMB ordinary shares
3,371,074,301
199,309,722 RMB ordinary shares
199,309,722
187,834,339 RMB ordinary shares
187,834,339
158,964,273 RMB ordinary shares
158,964,273
85,581,666 RMB ordinary shares
55,987,298 RMB ordinary shares
85,581,666
55,987,298
54,958,845 RMB ordinary shares
54,958,845
52,206,131 RMB ordinary shares
52,206,131
436,687,905
Description of the related party relationships
among the abovementioned shareholders or
whether they are parties acting in concert
Details of top 10 shareholders and top 10
shareholders not subject to selling restrictions
participating in margin trading and securities
lending and refinancing business
Notes:
Both HKSCC NOMINEES LIMITED and Hong Kong Securities Clearing Company Limited
are wholly-owned subsidiaries of Hong Kong Exchanges and Clearing Limited; the de
facto controller of both China Reform Investment Co., Ltd. (國新投資有限公司) and
Guoxin Hongsheng Investment (Beijing) Co., Ltd. (國新宏盛投資(北京)有限公司) is
China Reform Holdings Corporation Limited (中國國新控股有限責任公司); Guofeng
Xinghua (Beijing) Private Equity Fund Management Co., Ltd. (國豐興華(北京)私募基
金管理有限公司) acts as the private fund manager for both Guofeng Xinghua (Beijing)
Private Equity Fund Management Co., Ltd. – Honghu Zhiyuan (Shanghai) Private
Investment Fund Co., Ltd. (國豐興華(北京)私募基金管理有限公司-鴻鵠志遠(上海)私
募投資基金有限公司) and Guofeng Xinghua (Beijing) Private Equity Fund Management
Co., Ltd. - Guofeng Xinghua Honghu Zhiyuan Private Securities Investment Fund II (國豐
興華(北京)私募基金管理有限公司 - 國豐興華鴻鵠志遠二期私募證券投資基金). Save
as disclosed above, the Company is not aware of any related party relationships between
the top 10 shareholders without selling restrictions and the top 10 shareholders, and
whether they are parties acting in concert as defined in the Measures for Administration of
Acquisition of Listed Companies (上市公司收購管理辦法).
N/A
- H shares held by HKSCC NOMINEES LIMITED are held on behalf of a number of its
clients; A shares held by Hong Kong Securities Clearing Company Limited are held on
behalf of a number of its clients.
- As at the end of the Reporting Period, in addition to directly holding shares of the Company,
China Energy, the controlling shareholder of the Company, also held 11,593,528 A shares of
the Company through its wholly-owned subsidiary, China Energy Capital Holdings Co., Ltd.
China Energy directly and indirectly held an aggregate of 15,187,551,170 A shares of the
Company, representing 70.02% of the Company’s total issued shares.
- For details of the lifting of selling restrictions, listing and circulation of certain restricted
shares of the Company, please refer to the H share announcement of the Company dated 23
September 2026 and the A share announcement of the Company dated 24 September 2026.
Participation of shareholders with shareholding of more than 5%, top 10 shareholders
and top 10 shareholders not subject to selling restrictions in lending of shares by way of
refinancing
□ Applicable
✓ Not applicable
Change in the top 10 shareholders and top 10 shareholders not subject to selling
restrictions from the previous period due to shares lending/repayment through
refinancing:
□ Applicable
✓ Not applicable
9
III. OTHER IMPORTANT MATTERS
(I)
Major operational data
2026
Operational indicators
(I)
(II)
(III)
(IV)
Unit
July to January to
September September
Coal
- Commercial coal production
Million tonnes
- Coal sales
Million tonnes
Of which: Self-produced coal Million tonnes
Purchased coal
Million tonnes
Transportation
- Transportation turnover of
Billion tonnes km
self-owned railways
- Loading volume at Huanghua Port Million tonnes
- Loading volume at Tianjin
Million tonnes
Coal Dock
- Shipping volume
Million tonnes
- Shipment turnover
Billion tonne
nautical miles
Power
- Gross power generation
Billion kWh
- Total power output dispatch
Billion kWh
Coal chemical
- Polyolefin sales volume
Ten thousand tonnes
- Oil products sales volume
Ten thousand tonnes
- Methanol sales volume
Ten thousand tonnes
- Ethylene glycol sales volume
Ten thousand tonnes
2025
(Restated)
July to January to
September September
Change
(%)
July to January to
September September
132.0
160.4
131.8
28.6
381.9
460.6
376.1
84.5
131.7
165.1
135.5
29.6
390.9
460.0
388.2
71.8
0.2
(2.8)
(2.7)
(3.4)
(2.3)
0.1
(3.1)
17.7
79.2
242.4
81.3
234.1
(2.6)
3.5
53.8
10.3
165.9
32.7
57.1
11.8
164.7
33.6
(5.8)
(12.7)
0.7
(2.7)
59.1
59.4
201.1
195.9
79.8
74.6
208.3
200.2
(25.9)
(20.4)
(3.5)
(2.1)
80.88
75.60
217.52
203.68
83.13
77.88
212.55
199.25
(2.7)
(2.9)
2.3
2.2
55.8
33.5
19.2
8.1
163.2
82.7
55.4
23.8
48.6
13.0
13.9
3.3
154.0
23.1
48.9
15.4
14.8
157.7
38.1
145.5
6.0
258.0
13.3
54.5
Note: As at the end of the Reporting Period, the Company completed the acquisition of equity interests in 12
target companies held in aggregate by China Energy, the controlling shareholder, and its wholly-owned
subsidiary Western Energy. The Group’s major operating indicators for 2026 include the relevant data of
the newly consolidated assets other than Jinshen Energy. To ensure the comparability of business data,
the Group has made retrospective adjustments to the major operating indicators for the comparable period
(the same applies hereinafter).
10
(II) Operation of the coal segment
Coal sales
(1)
I.
II.
III.
By types of sources of coal and pricing mechanism
Self-produced thermal coal
- Medium– and long-term thermal coal
- Others
Self-produced coking coal
- Clean coal
- Raw coal
Purchased coal
Total sales volume/average price
(exclusive of tax)
January to September 2026
Percentage
Price
Sales to total sales (exclusive
volume
volume
of tax)
Million
RMB/
tonnes
%
tonne
368.5
80.0
401
311.4
67.6
361
57.1
12.4
614
7.6
1.7
795
3.0
0.7
1,201
4.6
1.0
531
84.5
18.3
621
460.6
100.0
448
11
January to September 2025 (Restated)
Percentage
Price
Sales to total sales (exclusive
volume
volume
of tax)
Million
RMB/
tonnes
%
tonne
380.8
82.8
389
300.5
65.3
349
80.3
17.5
540
7.4
1.6
599
2.9
0.6
880
4.5
1.0
419
71.8
15.6
547
460.0
100.0
417
Change
Sales
volume
Price
(exclusive
of tax)
%
(3.2)
3.6
(28.9)
2.7
3.4
2.2
17.7
%
3.1
3.4
13.7
32.7
36.5
26.7
13.5
0.1
7.4
(2)
I.
II.
By sales regions
Domestic sales
Of which: Sales of imported coal
Export and overseas sales
January to September 2026
Percentage
Price
Sales to total sales (exclusive
volume
volume
of tax)
Million
RMB/
tonnes
%
tonne
458.3
99.5
447
12.8
2.8
600
2.3
0.5
524
Total sales volume/average price
(exclusive of tax)
460.6
100.0
448
January to September 2025 (Restated)
Percentage
Price
Sales to total sales (exclusive
volume
volume
of tax)
Million
RMB/
tonnes
%
tonne
456.3
99.2
416
9.1
2.0
528
3.7
0.8
565
460.0
100.0
417
Change
Sales
volume
Price
(exclusive
of tax)
%
0.4
40.7
(37.8)
%
7.5
13.6
(7.3)
0.1
7.4
Operating results (before elimination on consolidation)
Item
Unit
Revenue
RMB million
Cost of sales
RMB million
Gross profit
Gross profit
margin
RMB million
%
Profit before
income tax
RMB million
January to
January to September
September
2025
2026 (Restated)
211,140
6.6 Increase in average sales price
of coal
(158,146) (146,518)
7.9 Increase in sales volume and
purchase price of purchased
coal
52,994
51,484
2.9
25.1
26.0 Decreased
by 0.9
percentage
point
43,862
42,354
3.6
12
198,002
Change Main reasons for changes
%
Gross profit from sales of coal products by types of sources of coal (before
elimination on consolidation)
January to September 2026
Item
Sales
Cost of
Gross
revenue
sales
profit
RMB million RMB million RMB million
January to September 2025 (Restated)
Gross
profit
Sales
Cost of
Gross
margin
revenue
sales
profit
% RMB million RMB million RMB million
Gross
profit
margin
%
Self-produced coal
Purchased coal
153,676
52,521
(86,149)
(50,237)
67,527
2,284
43.9
4.3
152,476
39,336
(89,485)
(38,538)
62,991
798
41.3
2.0
Total
206,197
(136,386)
69,811
33.9
191,812
(128,023)
63,789
33.3
Note: The cost of sales of purchased coal includes the purchase cost of purchased coal, as well as
the transportation and port charges incurred to realise the sales.
Unit production cost of self-produced coal
Unit: RMB/tonne
January to
September
2026
January to
September
2025
(Restated)
Unit production cost of
self-produced coal
Raw materials, fuel and power
151.3
155.2
(2.5)
19.3
22.2
Personnel expenses
Repairs and maintenance
Depreciation and amortisation
Others
42.4
6.4
21.3
61.9
44.3
6.6
20.4
61.7
(13.1) Decrease in electricity costs,
material costs, etc.
(4.3)
(3.0)
4.4
0.3
Item
Change
% Main reasons for changes
Other costs consist of the following three components: ① expenses directly related
to production, including coal washing, selecting and processing expenses, and
mining engineering expenses, etc., accounting for approximately 77%; ② auxiliary
production expenses, accounting for approximately 13%; ③ land requisition and
surface subsidence compensation, environmental protection expenses, tax, etc.,
accounting for approximately 10%.
13
(III) Operation of the power segment
Location/
Type of power
Power generation and power output dispatch
Gross power generation
Power output dispatch
Average utilization hours
Price of electricity sold
(billion kWh)
(billion kWh)
(hour)
(RMB/MWh)
July to
July to
July to
July to
July to September
July to September
July to September
July to September
September
2025
September
2025
September
2025
September
2025
2026 (Restated) Change
2026 (Restated) Change
2026 (Restated) Change
2026 (Restated) Change
%
%
%
%
Domestic
Coal-fired power
Gas-fired power
Wind power
Photovoltaic power
Hydropower
Overseas
Coal-fired power
80.47
77.47
1.70
0.62
0.53
0.15
0.41
0.41
82.81
79.84
1.86
0.42
0.54
0.15
0.32
0.32
(2.8)
(3.0)
(8.6)
47.6
(1.9)
0.0
28.1
28.1
75.24
72.29
1.66
0.62
0.53
0.14
0.36
0.36
77.60
74.68
1.81
0.42
0.54
0.15
0.28
0.28
(3.0)
(3.2)
(8.3)
47.6
(1.9)
(6.7)
28.6
28.6
1,152
1,196
767
416
413
1,822
1,372
1,372
1,330
1,380
873
399
477
1,992
1,076
1,076
(13.4)
(13.3)
(12.1)
4.3
(13.4)
(8.5)
27.5
27.5
370
367
614
213
279
198
455
455
361
357
575
218
299
196
494
494
2.5
2.8
6.8
(2.3)
(6.7)
1.0
(7.9)
(7.9)
Total/Weighted
average
80.88
83.13
(2.7)
75.60
77.88
(2.9)
1,153
1,329
(13.2)
371
361
2.8
Location/
Type of power
Gross power generation
Power output dispatch
Average utilization hours
Price of electricity sold
(billion kWh)
(billion kWh)
(hour)
(RMB/MWh)
January to
January to
January to
January to
January to September
January to September
January to September
January to September
September
2025
September
2025
September
2025
September
2025
2026 (Restated)
Change
2026 (Restated)
Change
2026 (Restated)
Change
2026 (Restated)
Change
%
%
%
%
Domestic
Coal-fired power
Gas-fired power
Wind power
Photovoltaic power
Hydropower
Overseas
Coal-fired power
216.41
209.12
3.97
1.59
1.41
0.32
1.11
1.11
211.52
204.15
4.79
0.97
1.29
0.32
1.03
1.03
2.3
2.4
(17.1)
63.9
9.3
0.0
7.8
7.8
202.72
195.56
3.88
1.57
1.40
0.31
0.96
0.96
198.36
191.13
4.68
0.96
1.28
0.31
0.89
0.89
2.2
2.3
(17.1)
63.5
9.4
0.0
7.9
7.9
3,099
3,230
1,797
1,059
1,088
4,047
3,692
3,692
3,398
3,528
2,258
916
1,143
4,141
3,427
3,427
(8.8)
(8.4)
(20.4)
15.6
(4.8)
(2.3)
7.7
7.7
370
367
635
224
279
234
489
489
367
364
582
220
293
234
486
486
0.8
0.8
9.1
1.8
(4.8)
0.0
0.6
0.6
Total/Weighted
average
217.52
212.55
2.3
203.68
199.25
2.2
3,101
3,398
(8.7)
370
368
0.5
14
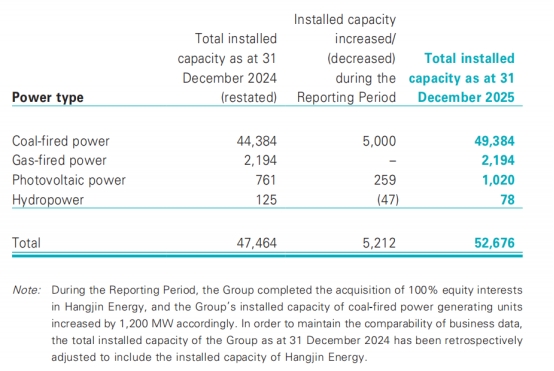
Installed capacity of power generation units
Unit: MW
Increase in
Total installed installed capacity Total installed
capacity as at 31 from January to capacity as at 30
December 2025 September 2026 September 2026
Type of power
Coal-fired power
Gas-fired power
Wind power
Photovoltaic power
Hydropower
49,384
2,194
–
1,020
78
17,574
14
1,497
319
–
66,958
2,208
1,497
1,339
78
Total
52,676
19,404
72,080
From January to September 2026, the installed capacity of the Group’s power
generating units increased by 19,404 MW. Of this increase, 15,640 MW resulted
from the Company ’ s completion of the acquisition of equity interests in the
relevant companies held by its controlling shareholder, China Energy, and China
Energy ’ s wholly-owned subsidiary, Western Energy. The remaining increase
of 3,764 MW arose from the commissioning of new generating units and other
factors, principally including the completion and commissioning of Unit 4 of
Qingyuan Phase II, Units 5 and 6 of Dingzhou Phase III, and Units 5 and 6 of
Cangdong Phase III.
15
Operating results (before elimination on consolidation)
January to
September
2026
January to
September
2025
(Restated)
79,297
Item
Unit
Revenue
RMB million
82,410
Cost of sales
RMB million
(72,058)
Gross profit
Gross profit margin
RMB million
%
10,352
12.6
Profit before income tax
RMB million
8,223
Change Main reasons for changes
%
3.9 Increase in power output dispatch and average
power sales price
(65,352)
10.3 Increase in power output dispatch and the
increase in coal purchase price leading to
an increase in the cost of coal purchase
13,945
(25.8)
17.6 Decreased
by 5.0
percentage
points
11,936
(31.1)
From January to September 2026, the Group ’ s average cost of power output
dispatch of the power business (including heat sales) was RMB335.6/MWh
(from January to September 2025: RMB309.9/MWh, restated), representing a
year-on-year increase of 8.3%, primarily due to the increase in the purchase price
of coal.
(IV) Major operation of transportation and coal chemical segments (before elimination
on consolidation)
Unit: RMB million
Railway
Item
January to January to
September September
2025
2026
Revenue
Cost of sales
Gross profit
Gross profit
margin (%)
33,948
(20,615)
13,333
39.3
Profit before
income tax
11,433
Port
January to
January to September
2025
September
2026 (Restated)
Change
%
Shipping
January to
January to September
2025
September
2026 (Restated)
Change
%
5,223
(2,661)
2,562
49.1
7,777
(6,946)
831
10.7
32,765
3.6
(20,162)
2.2
12,603
5.8
38.5 Increased
by 0.8
percentage
point
10,544
8.4
2,197
5,371
(2.8)
(2,694)
(1.2)
2,677
(4.3)
49.8 Decreased
by 0.7
percentage
point
2,275
(3.4)
576
Coal chemical
January to
January to September
2025
September
2026 (Restated) Change
Change
%
%
6,419
21.2
(5,636)
23.2
783
6.1
12.2 Decreased
by 1.5
percentage
points
480
20.0
23,739
(18,819)
4,920
20.7
3,198
15,821
50.0
(15,265)
23.3
556
784.9
3.5 Increased
by 17.2
percentage
points
(915)
/
During January to September 2026, the year-on-year increase in the gross profit of the
coal chemical segment was primarily due to the increase in the sales volume and sales
prices of the Group’s major coal chemical products, as well as a lower base resulting
from the shutdown of coal-to-liquid production facilities for process upgrading and
modification during the corresponding period of the last year.
16
IV. F I N A N C I A L S T A T E M E N T S P R E P A R E D I N A C C O R D A N C E W I T H I F R S
ACCOUNTING STANDARDS
CONSOLIDATED STATEMENT OF PROFIT OR LOSS AND
OTHER COMPREHENSIVE INCOME
For the nine months ended 30 September
Item
2026
RMB million
(unaudited)
2025
RMB million
(unaudited)
(restated)
Revenue
Goods and labour services
Cost of sales
296,031
(209,285)
271,651
(189,424)
Gross profit
Selling expenses
General and administrative expenses
Research and development costs
Other gains and losses
Loss allowances, net of reversal
Other income
Other expenses
Interest income
Finance costs
Share of results of associates
86,746
(755)
(11,012)
(1,833)
113
49
810
(1,281)
1,628
(4,017)
2,273
82,227
(816)
(11,368)
(1,893)
517
185
729
(544)
2,030
(3,581)
3,275
Profit before income tax
Income tax expense
72,721
(15,046)
70,761
(14,095)
Profit for the period
57,675
56,666
17
Item
2026
RMB million
(unaudited)
2025
RMB million
(unaudited)
(restated)
239
23
88
115
Items that may be reclassified subsequently to profit or loss, net of
income tax:
Exchange differences
Share of other comprehensive income of associates
(124)
(151)
(92)
(119)
Other comprehensive income for the period, net of income tax
52
(73)
Total comprehensive income for the period
57,727
56,593
Profit for the period attributable to:
Equity holders of the Company
Non-controlling interests
47,317
10,358
46,336
10,330
57,675
56,666
47,502
10,225
46,265
10,328
57,727
56,593
2.198
2.187
Other comprehensive income for the period
Items that will not be reclassified subsequently to profit or loss,
net of income tax:
Change in the fair value of investments in equity instruments at
fair value through other comprehensive income
Share of other comprehensive income of associates
Total comprehensive income for the period attributable to:
Equity holders of the Company
Non-controlling interests
Earnings per share
-Basic (RMB)
18
CONSOLIDATED STATEMENT OF FINANCIAL POSITION
As at 30 September 2026
Non-current assets
Property, plant and equipment
Construction in progress
Exploration and evaluation assets
Intangible assets
Right-of-use assets
Interests in associates
Equity instruments at fair value through other comprehensive
income
Financial assets at fair value through profit or loss
Other non-current assets
Deferred tax assets
Total non-current assets
As at
30 September
2026
RMB million
(unaudited)
As at
31 December
2025
RMB million
(unaudited)
(restated)
439,509
56,711
12,437
8,968
42,279
82,476
7,214
437,782
48,730
12,437
10,109
39,787
71,633
6,942
123
59,597
8,358
133
68,269
7,868
717,672
703,690
Current assets
Inventories
Accounts and bills receivables
Financial assets at fair value through profit or loss
Financial assets at fair value through other comprehensive
income
Prepaid expenses and other current assets
Restricted bank deposits
Time deposits with original maturity over three months
Cash and cash equivalents
17,811
30,209
0
862
15,280
22,198
0
2,010
24,643
15,472
57,947
59,755
28,240
20,077
70,449
50,487
Total current assets
206,699
208,741
19
As at
30 September
2026
RMB million
(unaudited)
As at
31 December
2025
RMB million
(unaudited)
(restated)
Current liabilities
Borrowings
Accounts and bills payables
Accrued expenses and other payables
Current portion of lease liabilities
Current portion of long-term liabilities
Income tax payable
Contract liabilities
79,462
55,998
87,478
181
6,083
3,507
11,848
29,624
60,091
57,044
427
13,205
4,503
6,174
Total current liabilities
244,557
171,068
Net current assets
(37,858)
37,673
Total assets less current liabilities
679,814
741,363
Non-current liabilities
Borrowings
Lease liabilities
Long-term liabilities
Accrued reclamation obligations
Deferred tax liabilities
Other non-current liabilities
76,040
1,087
27,120
15,401
7,806
1,635
72,925
1,115
30,862
14,632
7,762
1,839
Total non-current liabilities
129,089
129,135
Net assets
550,725
612,228
Equity
Share capital
Reserves
21,689
431,344
19,869
500,077
453,033
97,692
519,946
92,282
550,725
612,228
Equity attributable to equity holders of the Company
Non-controlling interests
Total equity
20
CONDENSED CONSOLIDATED STATEMENT OF CASH FLOWS
For the nine months ended 30 September
2026
RMB million
(unaudited)
2025
RMB million
(unaudited)
(restated)
Operating activities
Cash generated from operations
Income tax paid
109,226
(16,526)
90,306
(14,991)
Net cash generated from operating activities
92,700
75,315
(44,969)
(38,689)
(2,212)
551
(1,358)
492
13,900
411
(9,353)
0
2,456
1,141
(13,900)
4,604
(8,566)
47,740
456
(1,618)
512
2,969
1,542
(30,400)
(3,146)
(33,440)
21,068
26,083
(34,869)
(28,857)
Investing activities
Acquisition of property, plant and equipment, intangible assets,
exploration and evaluation assets, additions to construction in
progress and other non-current assets
Increase in right-of-use assets
Proceeds from disposal of property, plant and equipment,
intangible assets, lease prepayments and other non-current
assets
Proceeds from maturity of structured deposits
Repayment of investment from associates
Investments in associates
Net cash increase from disposal of subsidiaries
Dividend received from associates
Interest received
Purchase of structured deposits
Decrease/(increase) in restricted bank deposits
Increase in time deposits with original maturity over three
months
Maturity of time deposits with original maturity over three
months
Net cash used in investing activities
21
2026
RMB million
(unaudited)
2025
RMB million
(unaudited)
(restated)
Financing activities
Capital element of lease rentals paid
Interest element of lease rentals paid
Interest paid
Proceeds from borrowings
Repayments of borrowings
Repayments of bonds
Repayments of commercial factoring
Proceeds from bills discounted and commercial factoring
Cash paid for acquisition of subsidiaries under common control
Proceeds from the issuance of shares
Contributions from controlling shareholders
Contributions from non-controlling shareholders
Distribution to non-controlling shareholders
Dividends paid to equity holders of the Company
(566)
(19)
(3,929)
164,239
(110,996)
0
(6,097)
7,287
(90,942)
19,966
0
1,353
(6,169)
(22,342)
(985)
(39)
(3,503)
34,704
(34,661)
(3,021)
(500)
1,691
(853)
0
500
1,615
(16,485)
(44,903)
Net cash used in financing activities
(48,215)
(66,440)
Net increase/(decrease) in cash and cash equivalents
9,616
(19,982)
Cash and cash equivalents as at the beginning of the period
Effect of foreign exchange rate changes
50,487
(348)
87,799
(75)
Cash and cash equivalents as at the end of the period
59,755
67,742
22
V.
DEFINITIONS
China Shenhua/the
Company
China Shenhua Energy Company Limited
The Group
The Company and its controlled subsidiaries
China Energy
China Energy Investment Corporation Limited
Western Energy
China Energy Western Energy Investment Co., Ltd.
Jinshen Energy
Shanxi Province Jinshen Energy Co., Ltd.
Finance Company
China Energy Finance Co., Ltd.
China Accounting
Standards for Business
Enterprises
the Accounting Standards for Business Enterprises, Application
Guidance to Accounting Standards for Business Enterprises,
Interpretations of Accounting Standards for Business Enterprises
and other related requirements issued by the Ministry of Finance
of the People’s Republic of
China
IFRS Accounting
Standards
IFRS Accounting Standards issued by the International
Accounting Standards Board
The Reporting Period
July to September 2026
By order of the Board
China Shenhua Energy Company Limited
Zhang Changyan
Executive Director and Chief Executive Officer
Beijing, 23 October 2026
As at the date of this announcement, the Board comprises the following: Mr. Zhang Changyan as
executive director, Mr. Kang Fengwei and Mr. Li Xinhua as non-executive directors, Ms. Zhang
Mengjiao, Mr. Yih, Dieter Lai Tak and Mr. Wang Hong as independent non-executive directors,
and Ms. Jiao Lei as employee director.
23
 China Shenhua WeChat