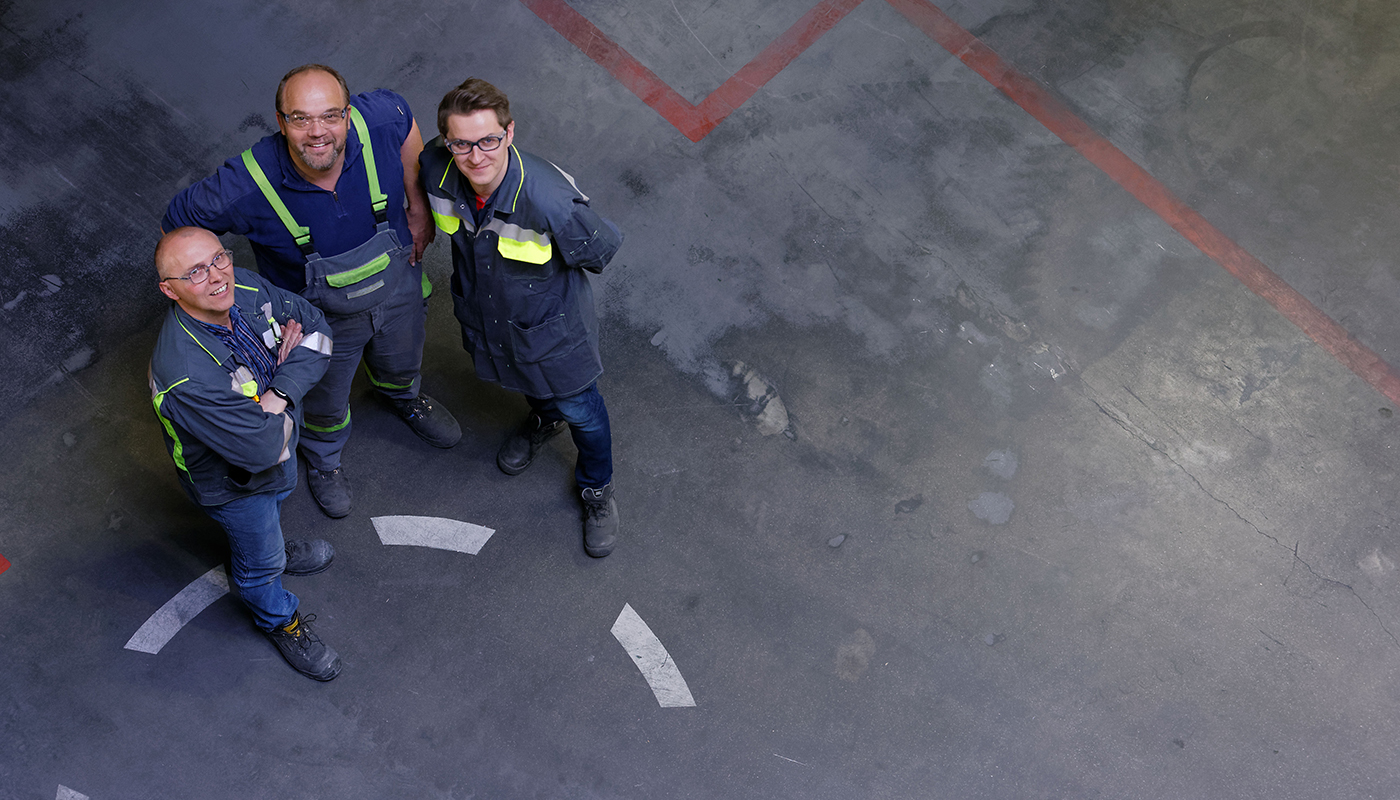
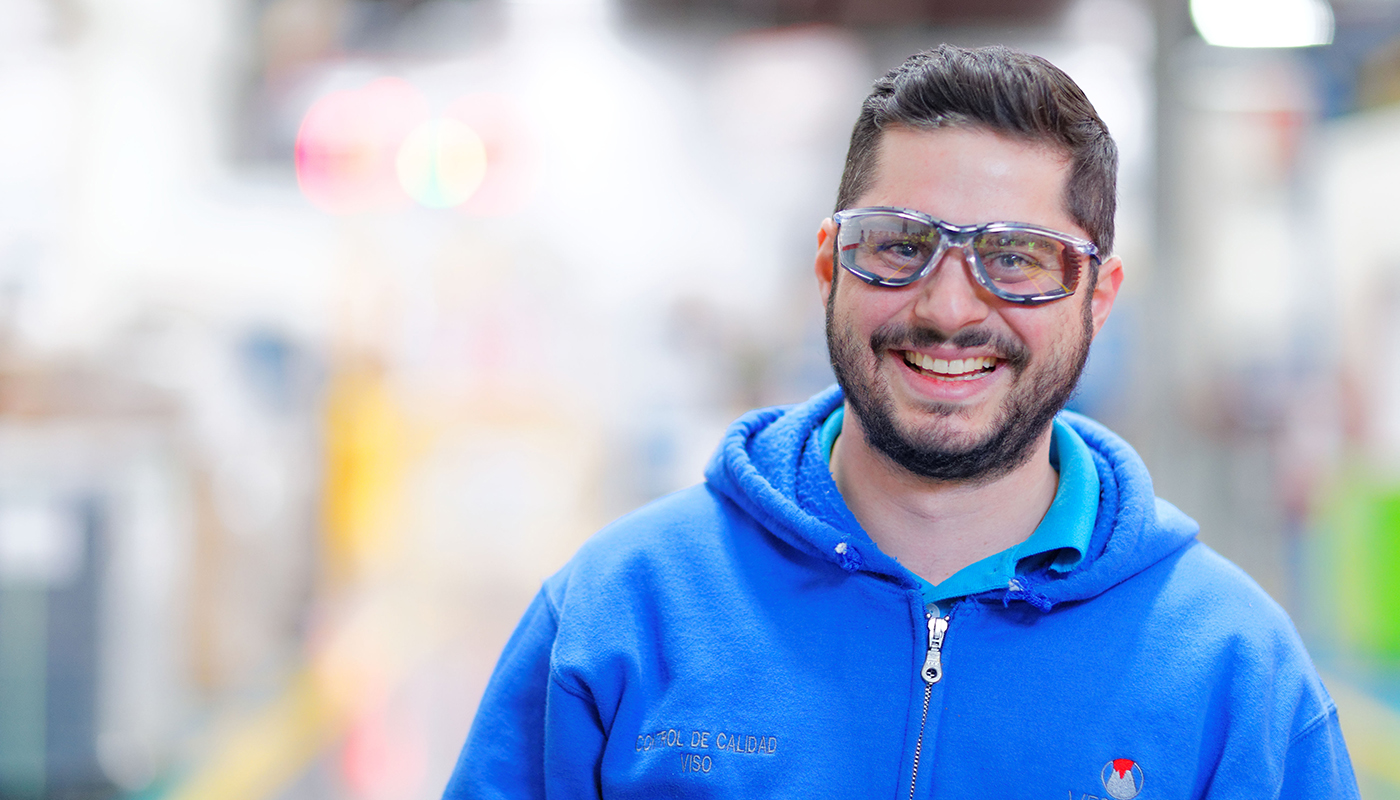
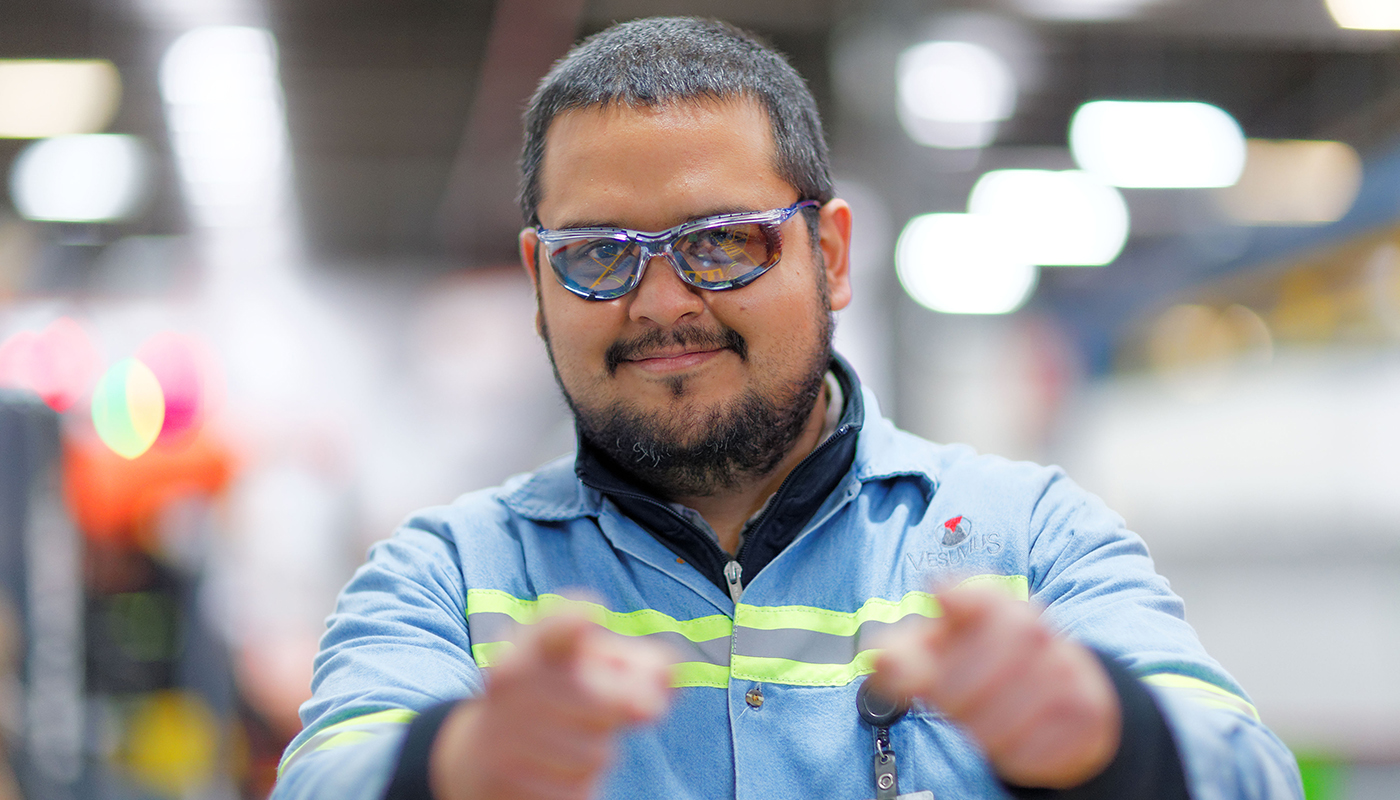
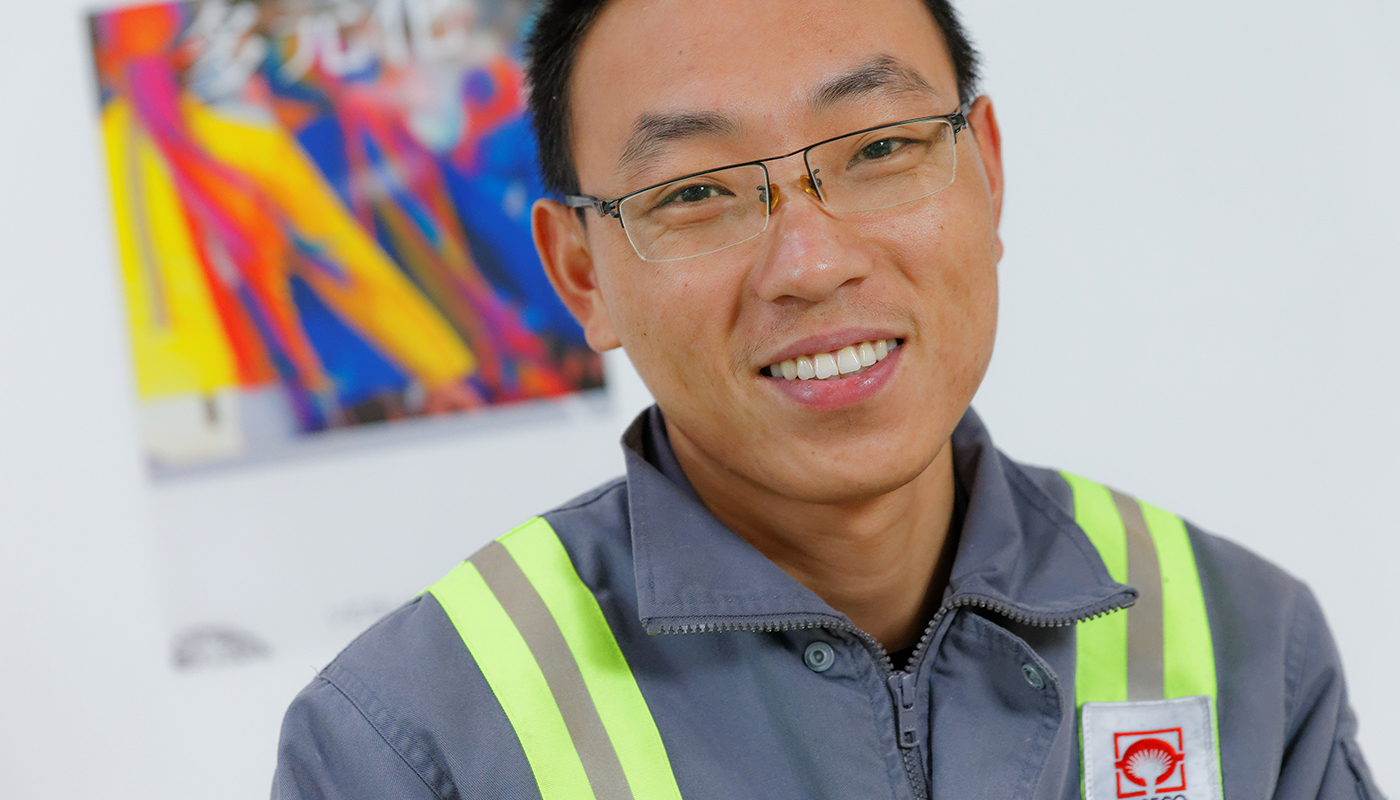
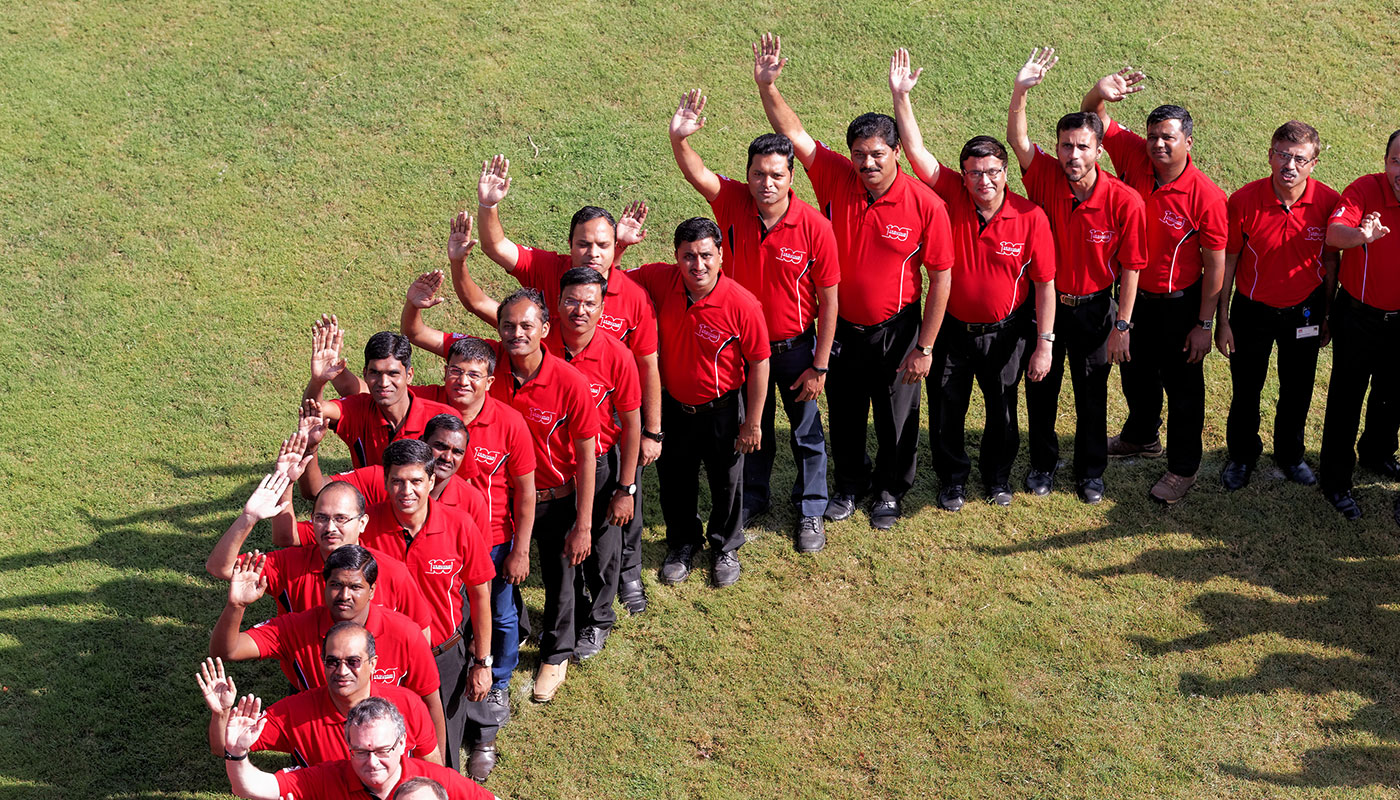
Our worldwide network of experts has developed a unique expertise of our markets' techniques which we can leverage to deliver on time creative solutions to all customers' requirement. Vesuvius has built its business model on proximity to its…
Our worldwide network of experts has developed a unique expertise of our markets' techniques which we can leverage to deliver on time creative solutions to all customers' requirement.
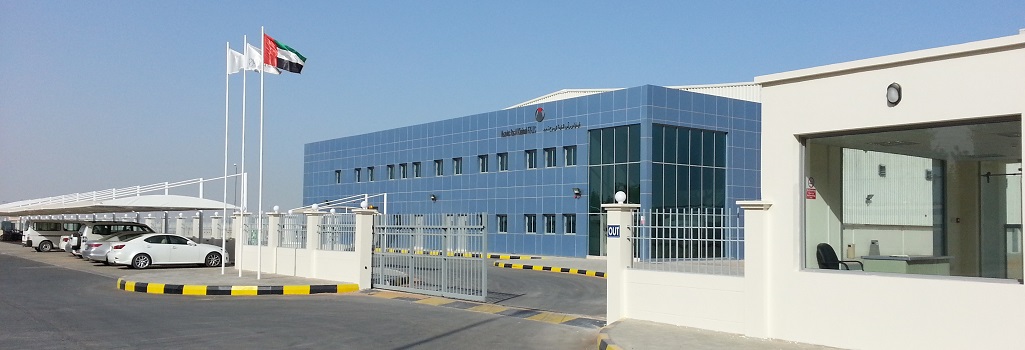
Vesuvius has built its business model on proximity to its customers.
All All North America South America Europe Africa Middle East India Asia Oceania
Pittsburgh, Pennsylvania
Welland, Canada
Wurtland, Kentucky
Ohio
Illinois
Graham, North Carolina
Wampum, Pennsylvania
Ramos Arizpe, Mexico
Charlotte, USA
Monterrey, Mexico
Bogotá, Colombia
Concepción, Chile
Piedade, Brazil
Rio de Janeiro, Brazil
San Nicolás, Argentina
Sao Paulo, Brazil
Lima, Peru
Resende, Brazil
Åmål, Sweden
Borken, Germany
Dnipro, Ukraine
Enschede, Netherlands
Gliwice, Poland
Ghlin, Belgium
Großalmerode (Grossalmerode), Germany
Hengelo, Netherlands
Istanbul, Türkiye
Igorre, Spain
Izurza, Spain
London, UK
Lyon, France
Москва (Moscow), Russia
Muggiò, Italy
Mülheim, Germany
Ostend, Belgium
Paris, France
Skawina, Poland
Třinec, Czech Republic
Feignies, France
Galati, Romania
Krakow, Poland
Berkatal, Germany
Dilovasi, Türkiye
Kutahya, Türkiye
Brussels, Belgium
Porto, Portugal
Johannesburg, South Africa
Maadi
Olifantsfontein, South Africa
Sadat City, Egypt
Dubai, UAE
Ras al Khaimah, UAE
Temirtau, Kazakhstan
Kolkata
Mehsana
Pune
Puducherry
Visakhapatnam (Vizag)
Sambhaji Nagar
Anshan, China
Bangkok, Thailand
Bayuquan, China
Chūō-ku (Kobe), Japan
Changshu, China
Hà Nội (Hanoi), Vietnam
Hong Kong
Jakarta, Indonesia
Gyeonggi-do, South Korea
Pingtung, Taiwan
Pelabuhan Klang, Malaysia
Seoul, South Korea
Suzhou, China
Toyokawa, Japan
Kaohsiung, Taiwan
Wuhan, China
Yingkou, China
Brisbane, Australia
Sydney, Australia
Port Kembla, Australia
UK Headquarters
EU Headquarters
North America
South America
Europe
Africa
Middle East
India
Asia
Oceania
Select a location
Country Any Algeria Argentina Australia Belgium Brazil Canada Chile China Colombia Czech Republic Egypt France Germany Hong Kong India Indonesia Italy Japan Kazakhstan Korea, Republic of Malaysia Mexico Netherlands Peru Poland Portugal Romania Russian Federation South Africa Spain Sweden Taiwan, Province of China Thailand Turkey Ukraine United Arab Emirates United Kingdom United States Vietnam
Business Type Any Sales & Services Research & Innovation Manufacturing Shared Services Centre Headquarters
Business All Vesuvius Vesuvius Group
Submit
Pittsburgh
Vesuvius Research USA
Research & Innovation
Vesuvius Research USA
4604 Campbells Run Road
Pittsburgh,
PA 15205
Phone: (1) 412-788-4441
Fax: (1) 412-787-5718
Research & Innovation
Vesuvius Canada, Inc.
Sales & Services
Manufacturing
333 Prince Charles Drive
PO Box 220
Welland, Ontario L3B 5P4
Phone:(1) 905-732-4441
Fax: (1) 905-735-8245
Sales & Services
Manufacturing
Vesuvius USA Corporation
Manufacturing
1080 Port Road
Wurtland KY 41144
Phone: (1) 606-833-9936
Fax: (1) 606-833-1772
Manufacturing
Cleveland
Vesuvius Inc. (Cleveland Foundry)
Sales & Services
Manufacturing
PO Box 81227,
Cleveland,
Ohio 44181, USA
Phone:+1 440 826 4548
Fax: +1 440 243 7658
Conneaut
Vesuvius-Foseco-Conneaut
Manufacturing
Vesuvius USA Corporation Conneaut Plant
1100 Maple Avenue,
Conneaut,
Ohio 44030, USA
Phone: +1 (440) 593-1161
Fax: +1 (440) 593-6268
Sales & Services
Manufacturing
Chicago Heights
Vesuvius USA
Sales & Services
Manufacturing
333 State Street
Chicago Heights,
IL 60411
Phone (central): (1) 708-757-7880
Fax (central):(1) 708-757-3880
Charleston
Vesuvius USA Corporation
Manufacturing
955 N, 5th Street
Charleston, IL 61920-0290
Phone:(1) 217 3457095
Fax: (1) 217 3457124
FCAD - Champaign
Vesuvius USA Corp./FCAD
Sales & Services
Manufacturing
Shared Services Centre
P.O. Box 4014
1404 Newton Drive,
Champaign, IL 61822
Phone: (1)217 3515000
Fax: (1)217 35208534
Sales & Services
Manufacturing
Graham
Vesuvius USA
Sales & Services
Manufacturing
Permatech, LLC.
911 East Elm Street
Graham, NC 27253
USA
Phone: +1 336 578 0701
Fax: +1 336 578 7758
Sales & Services
Manufacturing
Vesuvius Penn Corporation
Sales & Services
Manufacturing
Vesuvius Penn Corporation
PO Box 97
Wampum
Pennsylvania 16157
United States
Sales & Services
Manufacturing
Vesuvius Mexico SA de CV (Foseco Division)
Manufacturing
Vesuvius Mexico SA de CV (Foseco Division RA)
Blvd. Insignia No. 9000
Corredor Industrial Insignia
Parque Industrial 360
Ramos Arizpe
CP 25946
Mexico
Manufacturing
Vesuvius USA Corporation
Sales & Services
Vesuvius USA Corporation
5510 77 Center Drive
Suite 100
Charlotte
North Carolina 28217
Sales & Services
Vesuvius Mexico SA de CV (Foseco Division)
Manufacturing
Av. Ruiz Cortines, #140
Col. Jardines de San Rafael
Guadalupe, Nuevo Leon
ZIP 67119
Phone: +52 (84) 42884836
Vesuvius Mexico, S. A. de C. V.
Sales & Services
Manufacturing
Av. Ruiz Cortines, #140
Col. Jardines de San Rafael
Guadalupe, Nuevo Leon
ZIP 67119
Phone:+52 81 8319-4500
Fax: +52 81 8319-4599
Sales & Services
Manufacturing
Vesuvius Colombia
Sales & Services
Colombia, Carrera 7 numero 71-21, Torre B, piso 15, Oficina 1531, Bogota city
Phone: +57 1-3251154
Sales & Services
Vesuvius Refractarios de Chile S.A.
Sales & Services
San Martin 870, Oficina 308 Torre B
Concepcion Chile
Phone: (56) 41 2178710
Fax: (56) 41 291 2143
Sales & Services
Vesuvius Sensor and Probes do Brasil
Sales & Services
Manufacturing
Rua Benjamin da Silveira Baldy 2001 - Paula e Mendes
Piedade - SP - Brazil
18170-000
Phone: 55 15 3344-9000
Sales & Services
Manufacturing
Vesuvius Refratarios Ltda.
Sales & Services
Manufacturing
Rodovia Presidente Dutra KM 298 Polo Industrial
Resende City
Rio de Janeiro Estate
CEP: 27.537-00
Phone: (55) 21 2414-0606
Av. Brazil 49.550
Sales & Services
Manufacturing
Distrito Industrial de Palmares
Campo Grande
Rio de Janeiro
CEP '23065-480
Phone:(55) 24 2108-0200
Sales & Services
Manufacturing
San Nicolas
Sales & Services
Calle San Nicolas 845
Parque Industrial Comirsa
San Nicolas
Phone: +54 336 4462 212
Sales & Services
Foseco Industrial e Comercial Ltda.
Sales & Services
Manufacturing
Foseco Industrial e Comercial Ltda,
Via Raposo Tavares km. 15
Sao Paulo
Sao Paulo 05577-100
Brazil
Phone: (55) 11 3719 9788
Fax: (55) 11 3731 0240
Sales & Services
Manufacturing
Vesuvius Peru SAC
Sales & Services
Vesuvius Peru SAC
Calle Dean Valdivia 148
Piso 11 - Oficina 1134
Edificio Platinum Plaza,
Distrito San Isidro
Provincia y Departamento de Lima,
Zip Code: Lima 27
Peru
Sales & Services
Vesuvius Refratários Ltda.
Sales & Services
Manufacturing
Vesuvius Refratários Ltda.
Rodovia Presidente Dutra KM 298 Polo Industrial
RESENDE CITY
Rio de Janeiro
ESTATE CEP: 27.537-00
Brazil
Sales & Services
Manufacturing
Vesuvius Scandinavia AB
Sales & Services
Förrådsgatan, 4
S-662 34 Åmål
SWEDEN
Sales & Services
Vesuvius GmbH
Sales & Services
Manufacturing
Vesuvius GmbH
Gelsenkirchener Strasse 10,
46325 - Borken
GERMANY
Phone: +49 2861 830
Fax: +49 2861 83 338
Sales & Services
Manufacturing
Vesuvius - Ukraine
Sales & Services
Vesuvius Ukraine – for Nataliya Galasyuk.
Andriya Fabra str. 17 of. 8.
Dnipro city 49000
Ukraine
Sales & Services
Enschede Foundry R&D Centre
Research & Innovation
Pantheon 30
7521 PR Enschede
The Netherlands
Phone:+31 53 751 5000
Research & Innovation
VESUVIUS POLAND Sp. z o.o.
Sales & Services
Foundry Division – Sales Office
PORTOWA BUSINESS CENTER
ul. Portowa 8
44-100 Gliwice
Poland
Sales & Services
Vesuvius Group S.A./N.V.
Sales & Services
Research & Innovation
Vesuvius Group, S.A./N.V.
Rue de Douvrain 17
7011 Ghlin
Phone: (32) 65 400810
Phone (other): (32) 65 404 664Fax:(32) 65 311474
Sales & Services
Research & Innovation
Vesuvius GmbH
Manufacturing
Vesuvius GmbH
Werk Großalmerode
Bunte Mühle 22
37247 Grossalmerode
GERMANY
Phone: +49 5604 935 60
Fax: +49 5604 935 704
Manufacturing
Foseco Nederland BV
Sales & Services
Manufacturing
Foseco Nederland BV
P.O. Box 8,
7553 GJ Hengelo
Netherlands
Phone: +31 74 24 92 100
Fax: +49 2861 83 93 125
Sales & Services
Manufacturing
Istanbul (GEBZE)
Vesuvius Istanbul Refrakter San ve Tic A.Ş.
Sales & Services
Manufacturing
Vesuvius Istanbul Refrakter San ve Tic A.Ş.
GEBZE Organize Sanayi Bolgesi
1000. Cadde No:1022
41420 Çayırova / KOCAELI / TURKIYE
Phone: +90 262677 1050
Fax:+90 262677 1060
Sales & Services
Manufacturing
Foseco Española, S.A
Manufacturing
Igorreko Industrialdea, E-7
48140 Igorre
Bizkaia
Phone: + 34 94 631 5393
Fax: + 34 94 631 5587
Manufacturing
Foseco Española S.A.
Sales & Services
Foseco Española, S.A
Bº Elizalde, 5
48213 Izurtza
Bizkaia
Phone: +34 94 620 2500
Fax: +34 94 620 3773
Sales & Services
Vesuvius plc
Headquarters
Vesuvius plc
165 Fleet Street
London
EC4A 2AE
Phone: +44 (0)20 7822 0000
Fax: +44 (0)20 7822 0100
Headquarters
Sert Decines (Lyon)
Sales & Services
Manufacturing
Vesuvius-SERT SA
41 Boulevard Marcel Sembat
Venissieux
69200
Lyon
France
Phone:+33 4 78 26 50 50
Fax: +33 4 78 41 40 00
Sales & Services
Manufacturing
Moscow
Vesuvius LLC
Sales & Services
Vesuvius LLC
Myasishcheva str., 1, office 502,
Zhoukovsky, 140180 Moscow region,
RUSSIA
Phone: +7 495 642 09 67
Fax:+7 495 933 45 28
Sales & Services
Vesuvius Sensors & Probes Europe Spa
Sales & Services
Manufacturing
Via Mantova 10
20835 Muggiò (MB)
ITALY
Phone: (39) 039 271111
Fax: (39) 039 27111289
Sales & Services
Manufacturing
Vesuvius Mülheim GmbH
Sales & Services
Manufacturing
Vesuvius GmbH
Schieferbank 2-16
45472 - Mülheim a.d. Ruhr
Germany
Phone: +49 208 43466-0
Fax:+49 208 43466-80
Sales & Services
Manufacturing
Vesuvius Belgium N.V.
Manufacturing
Vesuvius Belgium N.V., Zandvoordestraat 366
8400 Oostende
Phone: (32) 59 508810
Fax: (32) 59 507284
Manufacturing
Foseco France
Sales & Services
Foseco France
Etage 1 Bâtiment A
17 Rue Mozart
77185 Lognes
Phone: +33 (0)6 80 03 72 30
Sales & Services
Vesuvius Poland Sp. z o.o.
Sales & Services
Research & Innovation
Manufacturing
Tyniecka12
Skawina
32-050
Phone:(+48) 12 277 5100, (+48) 12 277 5166, (+48) 12 277 5155
Fax:(+48) 12 277 5110
Sales & Services
Research & Innovation
Manufacturing
Vesuvius Česká republika, a.s.
Sales & Services
Manufacturing
Prumyslova 726, Konská
739 61 Třinec
Czechia
Phone:(420) 558 340411
Fax: (420) 558 321121
Sales & Services
Manufacturing
Vesuvius France SA
Sales & Services
Manufacturing
Vesuvius France SA
68, Rue Paul Deudon
59750 Feignies
Phone: (33) 327 691010
Fax: (33) 327 681411
Sales & Services
Manufacturing
Galati - Vesuvius Refractories SRL
Sales & Services
107 Marea Unire Blvd
800329 Galati Romania
Phone: +40236434011
Fax: +40236434011
Sales & Services
Vesuvius CSD Sp. z o.o
Sales & Services
Vesuvius CSD Sp. z o.o.
ul. Kołowa 8
30-134 Kraków,
Poland
Phone: +48 12 299 96 01
Fax: +48 12 299 96 99
Sales & Services
Shared Services Centre
Vesuvius Crucible GmbH
Manufacturing
Vesuvius Crucible GmbH
Noltinastraße 29
Berkatal-Frankenhain 37297
Germany
Manufacturing
Dilovasi
Vesuvius PiroMET Refrakter Sanayi ve Ticaret Anonim Şirketi
Manufacturing
Vesuvius PiroMET Refrakter Sanayi ve Ticaret Anonim Şirketi
Cerkesli OSB Mah. IMES 2.Cad.No:3
Dilovası-KOCAELI
Türkiye
Manufacturing
Kutahya
PİROMETALURJİ MALZEME REFRAKTER MAKİNA İMALAT SAN. ve TİC. A
Sales & Services
Manufacturing
PİROMETALURJİ MALZEME REFRAKTER MAKİNA İMALAT SAN. ve TİC. A
Çalca OSB Mah Eskişehir Yolu 6.km
2.OSB 7.Cad.
No:4 Merkez-Kütahya
Türkiye
Sales & Services
Manufacturing
Vesuvius Group
Headquarters
Vesuvius Group
Av. Louise 235
1050 Ixelles
Belgium
Phone: +32 65 40 08 10
Headquarters
Foseco Portugal Produtos Para Fundicao Ltda
Sales & Services
Foseco Portugal Produtos Para Fundição, Lda
Rua Manuel Pinto de Azevedo, Nº 626
4100-320 Porto
Portugal
Sales & Services
Foseco a Division of Vesuvius South Africa (Pty) Ltd
Sales & Services
Manufacturing
12 Bosworth Street,
Alrode,
Gauteng - 1450
South Africa
Phone: +27 (0) 11 903 9500
Fax: +27 11 908 2380
Sales & Services
Manufacturing
Vesuvius Mid-East Limited
Sales & Services
Vesuvius Mid-East Limited
Bldg. N° 56, Rd 15, app.103
Maadi
Cairo
Phone: +202 23595502 or +202 23595503
Fax: +202 2380 4020 or +202 2380 3160
Sales & Services
Vesuvius South Africa (Pty) Limited
Sales & Services
Manufacturing
Vesuvius South Africa (Pty) Limited,
Pebble Lane
Private Bag X2
Olifantsfontein 1665, South Africa
Phone: (27) 11 206-1800
Fax: (27) 11 206-1899
Sales & Services
Manufacturing
Vesuvius Mid East Limited
Manufacturing
4th. Industrial Zone,
Complex for Small Industries,
Hangar n°22
Sadat City, Egypt
(20) 48 265 8160
(20) 48 265 8616
Manufacturing
Vesuvius Emirates FZE (Middle East Office)
Sales & Services
Vesuvius Emirates FZE
Foseco Middle East
Warehouse IJ-09/3,Hamariyah Free Zone (Phase 1)
Sharjah, United Arab Emirates
Phone: +971 (0)6 526 2370
Fax: +971 (0)6 526 2379
Sales & Services
Vesuvius Ras Al Khaimah FZ-LLC
Sales & Services
Manufacturing
Vesuvius Ras Al Khaimah FZ-LLC
PO Box 86408
Ras Al Khaimah
U.A.E.
Phone: +971 (0)7 206 7999
Fax: +971 (0)7 206 7998
Sales & Services
Manufacturing
Branch of VESUVIUS Limited Liability Company Kazakhstan
Sales & Services
Republic Avenue
Building 4
Temirtau
M28D5A2
Kazakhstan
Sales & Services
Vesuvius India Ltd
Sales & Services
Manufacturing
P 104, Taratolla Road
Kolkata - 700088
India
Phone: (91) 33 30410600
Fax: (91) 33 24011235
Sales & Services
Manufacturing
Vesuvius India Ltd
Manufacturing
212/B G.I.D.C Estate
Mehsana
Gujarat - 384 002
India
Phone: (91) 2762 252949
Fax: (91) 2762 252909
Manufacturing
Foseco India Limited
Sales & Services
Manufacturing
Gat. Nos. 922/923,
Sanaswadi,
Taluka Shirur,
District Pune 412 208,
Maharashtra - India
Phone:+91 (0)2137 668100
Fax: +91 (0)2137 668160
Sales & Services
Manufacturing
Foseco India Limited (Feeding Systems Cell)
Sales & Services
Manufacturing
PIPDIC Industrial Estate,
Mettupalayam,
Puducherry - 605 009
India
Phone:+91 413 4302021
Fax:+91 413 2278065
Sales & Services
Manufacturing
Vesuvius India Limited
Sales & Services
Research & Innovation
Manufacturing
Plot No. 70, 71, 72 & 74, 74P
Industrial Park, Parawada
Visakhapatnam - 531021
India
Phone:(91) 891 2749120 / 3011300 / 3011337
Fax:(91) 891 2587511
Vesuvius Refractories India Private Limited (VRIPL)
Research & Innovation
Survey No. 90 & 98, Part, Block – G
Industrial Park, Fakirtakiya Village, Autonagar
Visakhapatnam – 530049
Sales & Services
Research & Innovation
Manufacturing
Vesuvius Crucible (India) Limited
Sales & Services
Manufacturing
Foseco Crucible (India) Limited
12B-11, M.I.D.C.
Waluj Chh. Sambhaji Nagar (Aurangabad)
Maharashtra 431 136
India
Sales & Services
Manufacturing
VSV Advanced Ceramics (Anshan) Co., Ltd.
Manufacturing
Xiao Tai Zi Village,
Ning Yuan Town, Qian Shan District, Anshan 114011
Liao Ning Province
Phone: (86) 412 892 1408
Fax:(86) 412 892 1408
Manufacturing
Foseco (Thailand) Limited
Sales & Services
22 nd Floor, Ocean Tower 1, 170/69
Rachadapisek Road, Klongtoey,
Bangkok 10110,
Thailand
Phone: + 66 2 261 3164 67
Fax: + 66 2 261 3168
Sales & Services
Bayuquan Refractories (BRC)
Manufacturing
Qing Long Shan Street, Yingkou Industrial Park
115007, Bayuquan, Yingkou, Liaoning
Phone: (86) (0)417-6233888
Fax: (86) (0)417-6233999
Manufacturing
Foseco Japan Limited & Vesuvius Japan Limited
Sales & Services
Orix Kobe Sannomiya Bldg., 6-1-10, Gokodori, Chuo-ku,
Kobe 651-0087 Japan
Phone (Foseco Japan): +81 (0)78 252 2231
Fax (Foseco Japan): +81 (0)78 252 2261
Phone (Vesuvius Japan):+81 (0) 78-251-2310Phone (Vesuvius Japan):+81 (0) 78-251-2350
Sales & Services
Vesuvius Foundry Technologies (Jiangsu) Co.,Ltd
Sales & Services
Manufacturing
No. 2 Changchun Road, Changshu Economic and Technological Zone,
Changsu, Suzhou, Jiangsu, 215537, China
Phone:+86 512 6299 1128
Customer Service Phone: +86 512 6299 2763
Sales & Services
Manufacturing
Vesuvius Vietnam
Sales & Services
Suite 702, 7th Floor, Vitranco Building
192 Thai Thinh
Dong Da District
Hanoi
Vietnam
Phone: +84909998889
Sales & Services
Vesuvius China Holdings Co Ltd
Sales & Services
Vesuvius China Holdings Co Ltd
Unit 01, 82/F, International Commerce Centre,
1 Austin Road West,
Kowloon
Hong Kong
Phone: +852 3669 7888 (main switch), +852 3669 7993
Fax: +852 3669 7800
Sales & Services
Vesuvius-P.T.Foseco Indonesia
Sales & Services
Manufacturing
Jalan Rawagelam 2/No.5 Kawasan Industri Pulogadung,
Jakarta Timur 13930, Indonesia
Phone: (62) 21 460 5555
Fax: (62) 21 460 3489
Sales & Services
Manufacturing
Foseco Korea Limited
Sales & Services
Manufacturing
74, Jeongju-ro, Wonmi-gu,
Bucheon-si, Gyeonggi-do, 14523
Rep.of Korea
Phone:+82 32 675 3211
Fax:+82 32 675 7512
Sales & Services
Manufacturing
Foseco Golden Gate Co. Limited
Sales & Services
Manufacturing
No. 6 Kung Yeh 2nd Road,
Ping Tung Industrial District,
Ping Tung, 90049 Taiwan, R.O.C.
屏東市工業二路6號
Phone: 886 8 722 8108
Fax: 886 8 722 8182
Sales & Services
Manufacturing
Vesuvius Malaysia Sdn Bhd
Sales & Services
Lot PT 11693
Jalan Pelabuhan Utara
Kawasan Industri
Bandar Sultan Suleiman
42000 Pelabuhan Klang
Selangor
Phone: (60) 3 3176 0508
Fax: (60) 3 3176 0446 Sales
Sales & Services
Vesuvius UK Ltd Korea Branch
Sales & Services
Vesuvius SL
Hyundai Venture Building # 415
10, Bamgogae-Ro 1-Gil, Gangnam-Gu,
Seoul, South Korea
zip code : 06349
Phone: +82 2 578 5682
Fax: +82 2 578 5683
Sales & Services
Vesuvius Crucible Co., Ltd (Suzhou MM)
Sales & Services
Manufacturing
Vesuvius Crucible Co., Ltd
108 Tongsheng Road
Suzhou Industrial Park
Suzhou 215126
Jiangsu Province
People's Republic of China
Vesuvius Advanced Ceramics (China) Co., Ltd
Sales & Services
Research & Innovation
Manufacturing
Vesuvius Advanced Ceramics (China) Co., Ltd,
221 Xing Ming Street
China-Singapore Suzhou Industrial Park
Suzhou 215021
Jiangsu Province
People's Republic of China
Phone:(86) (0)512-6741-2088
Fax: (86) (0)512-6741-1700
Vesuvius Foundry Products (Suzhou) Co., Ltd
Sales & Services
Manufacturing
12 Wei Wen Road
Suzhou Industrial Park
Suzhou 215122
Jiangsu
China
Phone: (86) 512 6299 1128Customer Service Phone:(86) 512 6299 2763
Sales & Services
Research & Innovation
Manufacturing
Shared Services Centre
Foseco Japan Limited - Toyokawa
Sales & Services
Manufacturing
Foseco Japan Limited - Toyokawa Plant,
44 Tenma, Hirao-cho, Toyokawa city,
Aichi, Japan, 442-0863
Phone:+81 (0)533 88 2221
Fax:+81 (0)533 88 3772
Sales & Services
Manufacturing
Vesuvius UK Limited Taiwan Branch (United Kingdom)
Sales & Services
Vesuvius UK Limited Taiwan Branch (United Kingdom)
10F, N°251, Minhua Rd.,
Gushan District,
KAOHSIUNG
TAIWAN R.O.C
Sales & Services
Wuhan Wugang-Vesuvius Advanced Ceramics Co., Ltd.
Manufacturing
Wuhan Wugang-Vesuvius Advanced Ceramics Co., Ltd
Gongnong Village
Qingshan District
Wuhan City 430082
China
Wuhan Wugang-Vesuvius Advanced CCR Co., Ltd.
Manufacturing
Wuhan Wugang-Vesuvius Advanced CCR Co., Ltd.
Gongnong Village
Qingshan District
Wuhan City 430082
China
Manufacturing
Yingkou YingWei Magnesium Co., Ltd
Sales & Services
Manufacturing
Yingkou YingWei Magnesium Co., Ltd
Bayuquan Magnesium Co Ltd (BMC)
50 Wanghai New District
Bayuquan District
Yingkou City 115007
China
Sales & Services
Manufacturing
Vesuvius-Foseco Australia-Brisbane
Sales & Services
Foseco Australia - Brisbane,
1/25 Manton Street,
Morningside,
QLD 4170
Phone: +61 738992733
Fax: +61 738992744
Sales & Services
Vesuvius Australia Pty Ltd.
Sales & Services
Manufacturing
PO Box 535
Padstow
New South Wales 2211
Australia
Phone: (61) 2 9914 5500
Fax:(61) 2 9914 5547
Sales & Services
Manufacturing
Vesuvius Australia Pty Ltd.
Sales & Services
Manufacturing
PO Box 97
Port Kembla
New South Wales 2505
Australia
Sales & Services
Manufacturing
Vesuvius
Sales & Services Research & Innovation Manufacturing
Vesuvius Group
Shared Services Centre Headquarters
You are here: Home Who We Are Where We Operate

 | ###
 | ###
 | ###
 |