Interim results for the six months ended 30 June 2026 and ordinary cash dividend declaration THUNGELA RESOURCES LIMITED (Incorporated in the Republic of South Africa) (Registration number: 2021/303811/06) JSE Share Code: TGA LSE Share Code: TGA ISIN:…
Interim results for the six months ended 30 June 2026 and ordinary cash dividend declaration
THUNGELA RESOURCES LIMITED
(Incorporated in the Republic of South Africa)
(Registration number: 2021/303811/06)
JSE Share Code: TGA
LSE Share Code: TGA
ISIN: ZAE000296554
Tax number: 9111917259
(‘Thungela’ or the ‘Company’ and, together with its affiliates, the ‘Group’)
Interim results for the six months ended 30 June 2026 and ordinary cash
dividend declaration
Strong performance underpinned by consistent operational execution and
financial discipline
• Total recordable case frequency rate improved to 2.62
• Group recorded export saleable production of 8.5Mt, an increase of 6%
• Adjusted operating free cash flow* of R1.9 billion for the period and net cash*
of R6.1 billion at 30 June 2026
• Declaration of an interim ordinary cash dividend of R5.50 per share
• Full-year guidance reaffirmed
Key performance metrics
(Rand million unless otherwise stated) 30 June 2026 30 June 2025 % change
Export saleable production (kt) 8,477 8,012 6
Export equity sales (kt) 8,938 8,319 7
Revenue 15,172 14,813 2
Profit for the reporting period 1,391 248 461
Earnings per share (cents/share) 1,095 193 467
Headline earnings per share
(cents/share) 480 192 150
Dividend per share (cents/share) 550 200 175
Alternative performance measures*
Adjusted EBITDA 1,318 691 91
Adjusted EBITDA margin (%) 8.7 4.7 4pp
Adjusted operating free cash flow 1,894 484 291
Net cash 6,113 6,250 (2)
Sustaining capital expenditure (705) (703) —
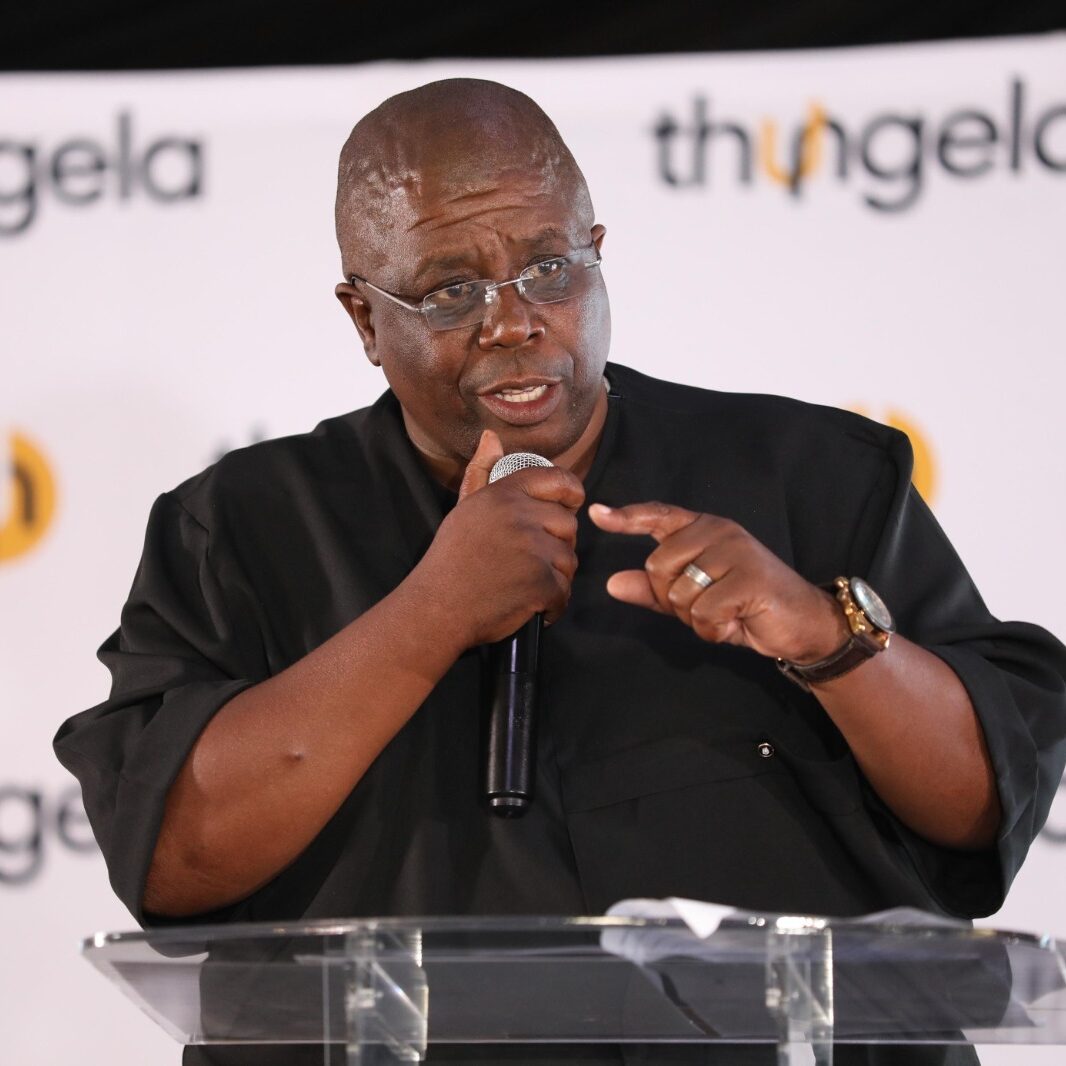
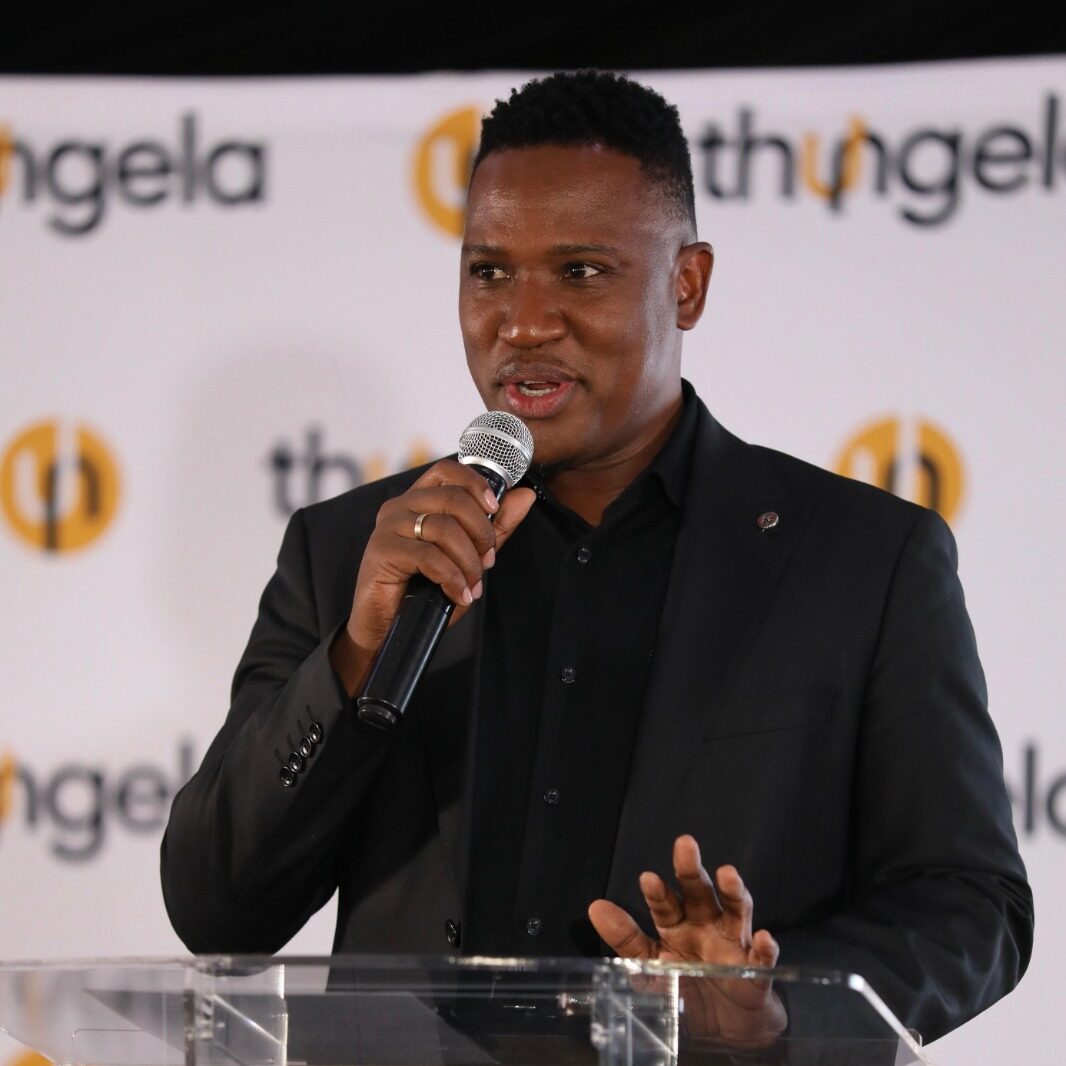
MESSAGE FROM MOSES MADONDO, CHIEF EXECUTIVE OFFICER
Thungela delivered a strong performance in the first half of 2026, demonstrating the
resilience of the business and the benefits of consistent operational execution and
financial discipline. Supported by a robust balance sheet, the Group has remained
well positioned to navigate market volatility while retaining strategic flexibility. The
results reflect our continued focus on maintaining safe operations, driving
operational excellence and applying a disciplined approach to capital allocation.
As Thungela marks five years as a listed company, we do so from a position of
strength, built on a solid foundation of operational excellence, financial discipline and
consistent value delivery. Following its review of the Group’s strategy, the board
confirmed Thungela’s strategy of growing earnings and building resilience through
the cycle in order to create long-term value for its stakeholders. Our priorities remain
focused on maximising the value of existing assets, pursue select growth
opportunities where we can apply our expertise and to develop future optionality for
long-term growth.
Safety remains at the core of everything we do and is the foundation upon which
decisions are made, ensuring that all our people return from work, safe and healthy
each day. We are proud to have operated a fatality-free business for three and a half
years. Our safety drive reflects our unwavering zero-harm mindset, anchored by
three main elements – doing the basics right, effective work management and a
safety culture. The Group’s total recordable case frequency rate1 improved to 2.62 in
the first half of 2026, from 3.21 for the comparable period, supported by a significant
improvement at Ensham. This reflects the continued focus on aligning Ensham with
Thungela’s work practices.
We continue to monitor the evolving situation in the Middle East and any potential
impact on our people and operations, including those at Thungela Marketing
International in Dubai. To date, operations have continued without safety incidents
or operational disruptions.
Group revenue increased to R15.2 billion for the period, supported by benchmark
coal prices that were 15% and 25% higher than the comparable period in South
Africa and Australia, respectively. Revenue was negatively impacted by the South
African rand, which traded on average 11% stronger to the US dollar than the
comparative period. The US dollar has remained weak, largely driven by shifts in
Federal Reserve monetary policies. The Group generated adjusted EBITDA* of
R1.3 billion and net profit of R1.4 billion, representing earnings per share of R10.95
and headline earnings per share of R4.80, an increase from R1.93 and R1.92 in the
prior period, respectively.
The Group generated cash flows from operating activities of R2.6 billion in the first
half of the year. After an investment of R705 million in sustaining capital*, this
resulted in an adjusted operating free cash flow* for the period of R1.9 billion. This
included R1.1 billion generated from foreign exchange derivatives, highlighting the
value of the Group’s disciplined approach to managing currency risk. At
30 June 2026, the Group’s net cash* position was R6.1 billion.
The Group’s export saleable production for the first half increased by 6% to
8.5Mt and export sales increased by 12% to 9.5Mt.
We have made meaningful progress in reshaping the business. The Annea Colliery
and the Zibulo North Shaft life-extension projects were successfully delivered on
time and within budget and continue to ramp-up. The completed projects and the
advancement of the Lephalale Coal Bed Methane project as well as the disposal of
closed assets demonstrates the ability to execute on our strategic priorities.
The business also made meaningful progress in optimising the asset portfolio. The
sale of the Kleinkopje mining right completed during the period and has resulted in a
non-cash reduction of the environmental provisions of approximately R1.1 billion
associated with the disposed areas. Together with the sale of Goedehoop North,
which is expected to be completed in the second half of the year, the Group expects
its South African environmental liabilities to be fully cash-collateralised by year end.
Operational performance
South Africa
Improved performance at Khwezela, driven largely by enhanced water management
activities, together with the continued strong contribution from Mafube, underpinned
South African export saleable production of 6.3Mt. This enabled operations to
maintain production broadly in line with the prior year, despite operations ending at
Goedehoop North.
The South African FOB cost per export tonne* was R1,374, which is within the
guidance range. Cost performance remained resilient despite production timing
impacts in the first half of the year, and we expect full-year cost guidance to be
achieved, as operational performance improves during the second half of the year.
Export sales of 7.4Mt, including third-party sales of 0.6Mt, exceeded production
during the period. This was enabled by improved rail performance from Transnet
Freight Rail and our ability to leverage additional rail allocation opportunities across
the export corridor. Industry collaboration continues to deliver tangible benefits, with
rail performance improving to an annualised run rate of 59.9Mt, from 56.8Mt in 2025,
representing a meaningful step forward for the South African coal export industry.
The average realised export price through the Richards Bay Coal Terminal was
USD89.18 per tonne, representing a 15.7% discount to the benchmark price. The
benefit from the stronger pricing was partially offset by a lower quality sales mix.
Australia
Ensham delivered a strong first-half performance, underpinned by a significant
improvement in safety and production. Export saleable production increased to
2.2Mt, compared to 1.6Mt in the prior period. The operation benefited from improved
management of mining conditions, following the geological challenges encountered
in the first half of 2025.
The strong operational performance during the first half also supported unit cost
performance. Ensham FOB cost per export tonne* decreased to R1,466, below the
guidance range. This further benefited from the translation impact of a stronger
South African rand.
Realised coal prices at Ensham were impacted by previously contracted fixed-price
tonnes, resulting in an average realised export price of USD110.92 per tonne,
representing a discount of 13.3% to the benchmark price. This discount is expected
to narrow in the second half of the year as the effect of these contracts moderates.
Driving ESG
Our purpose remains to responsibly create value together for a shared future. This
purpose guides our approach to creating value not only for shareholders, but also for
employees, host communities, local governments and future generations. We remain
committed to ensuring that the benefits generated by mining create lasting
opportunities in our host communities beyond the life of our operations.
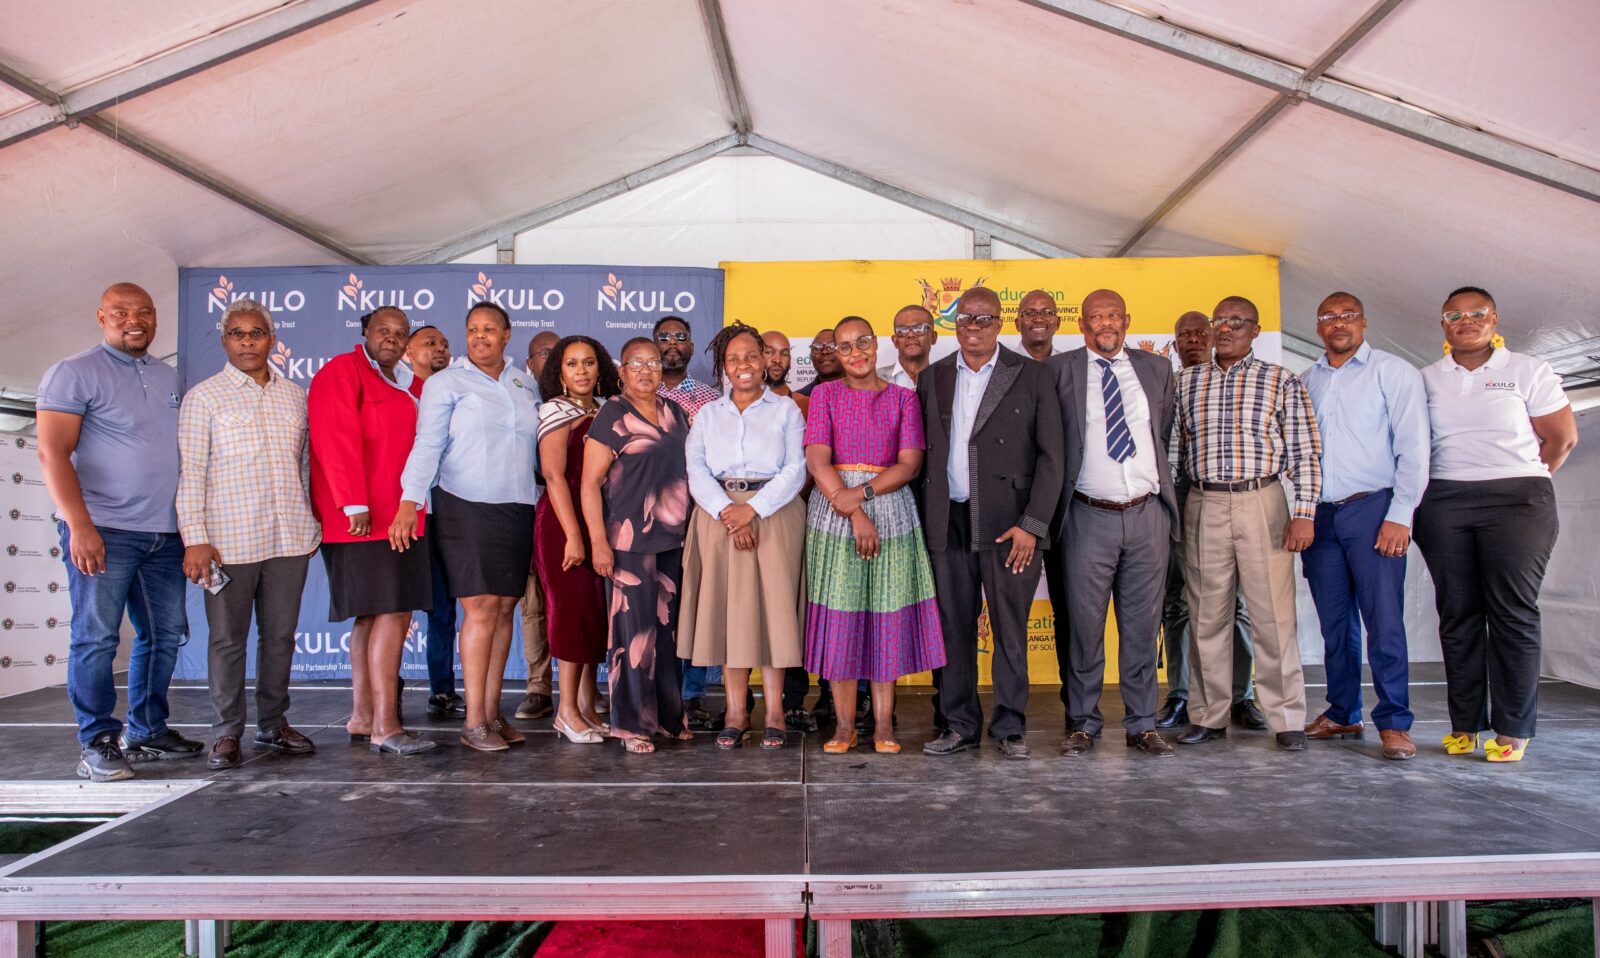
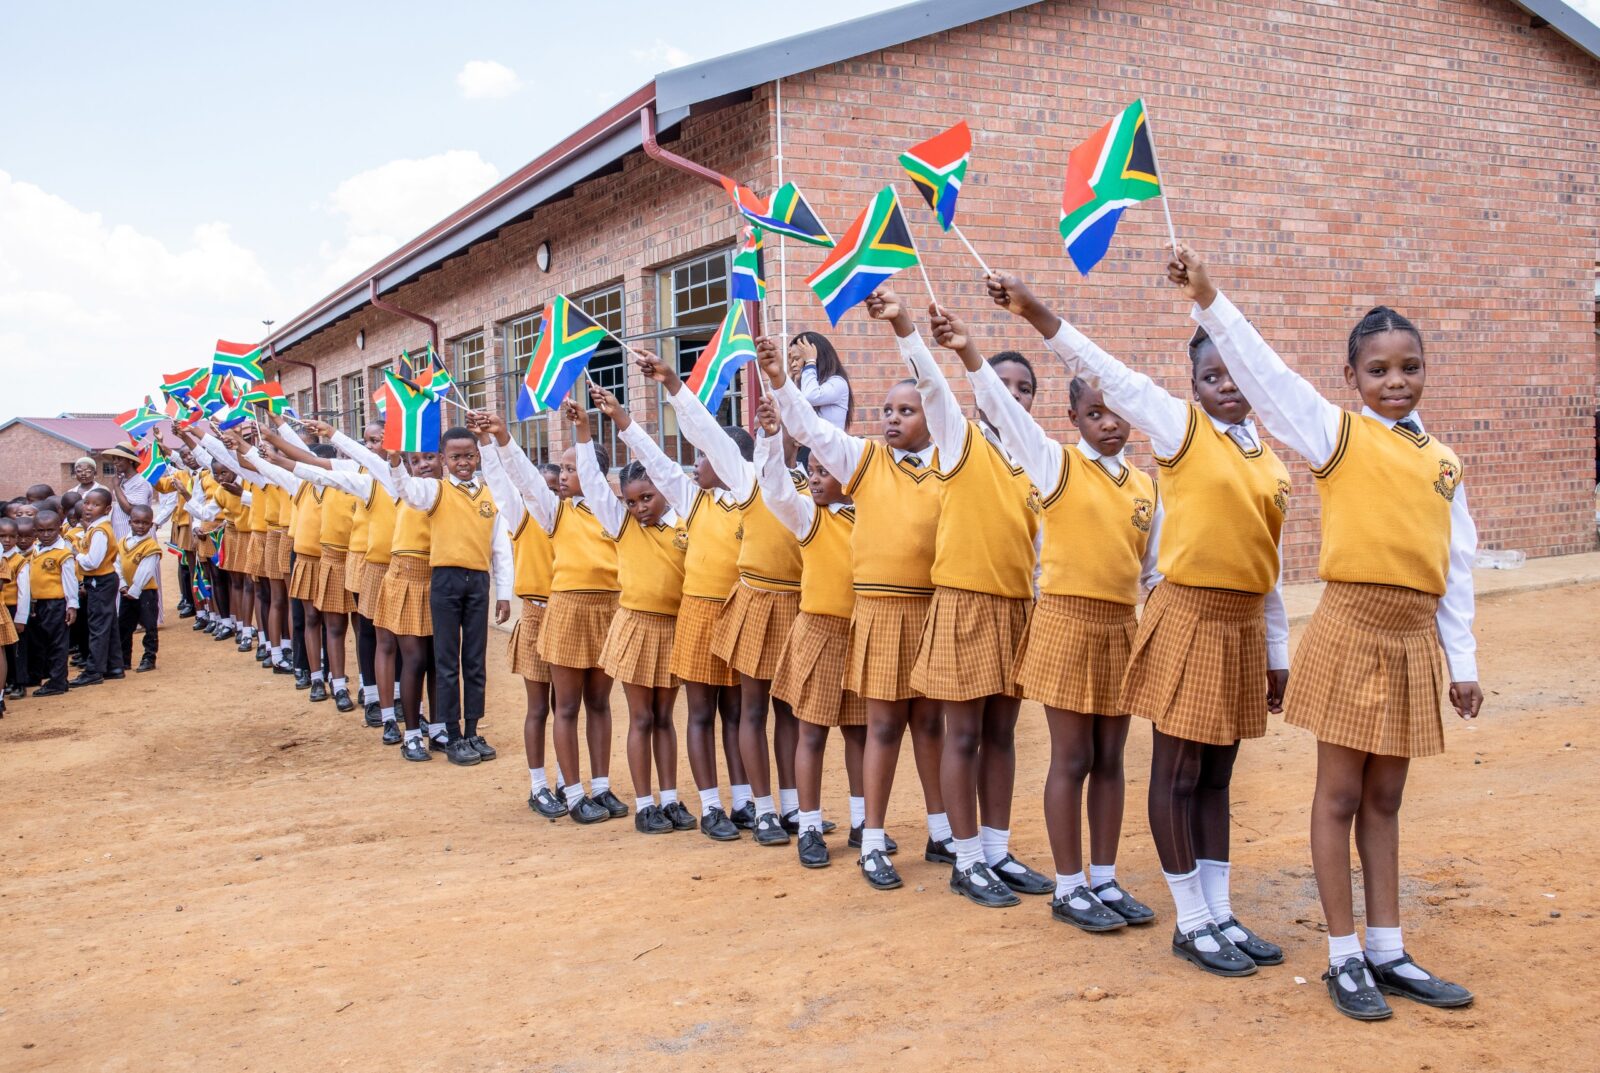
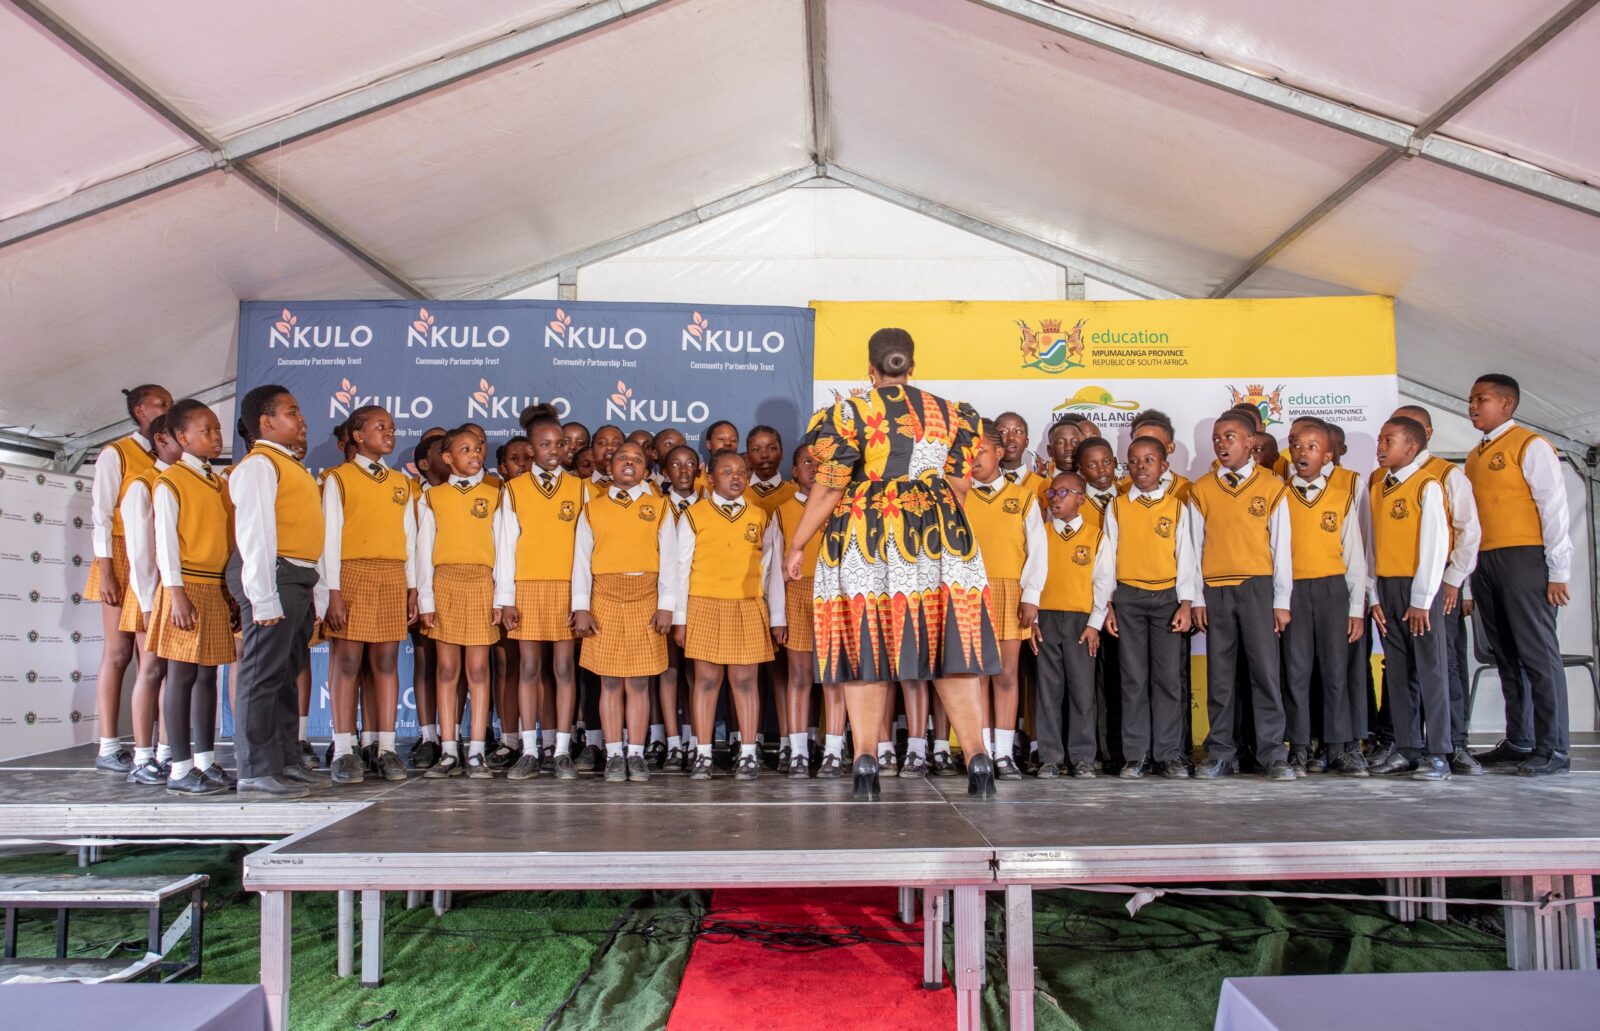
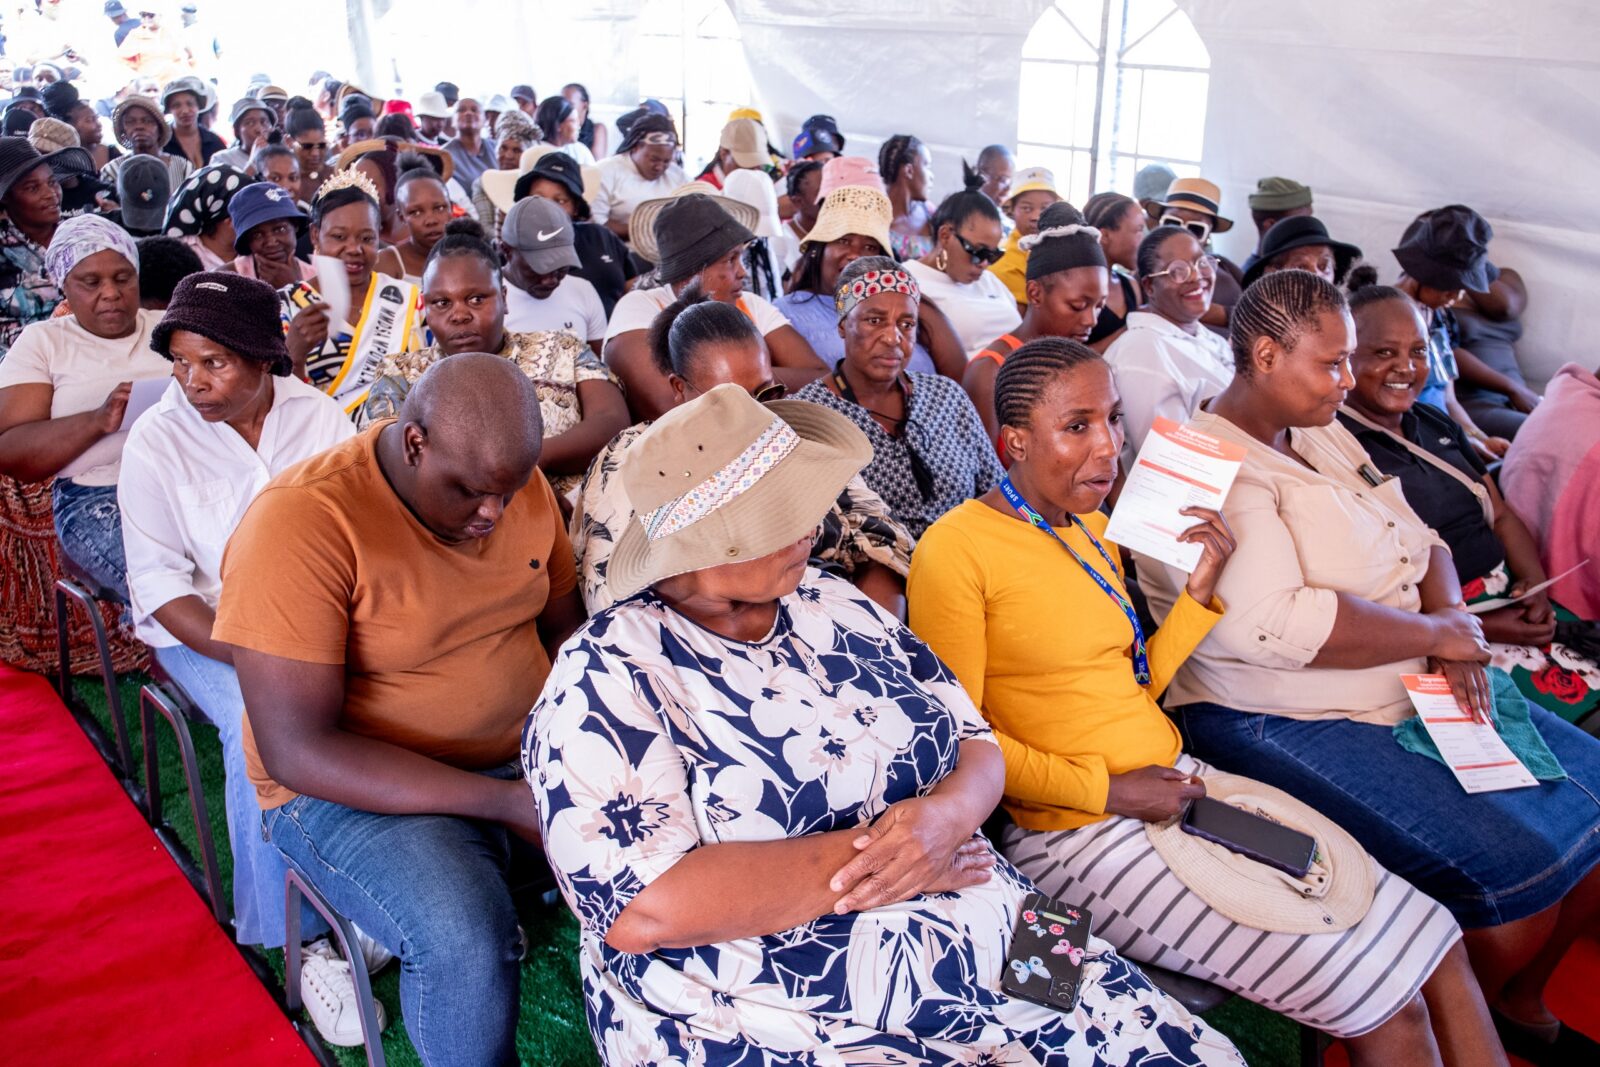
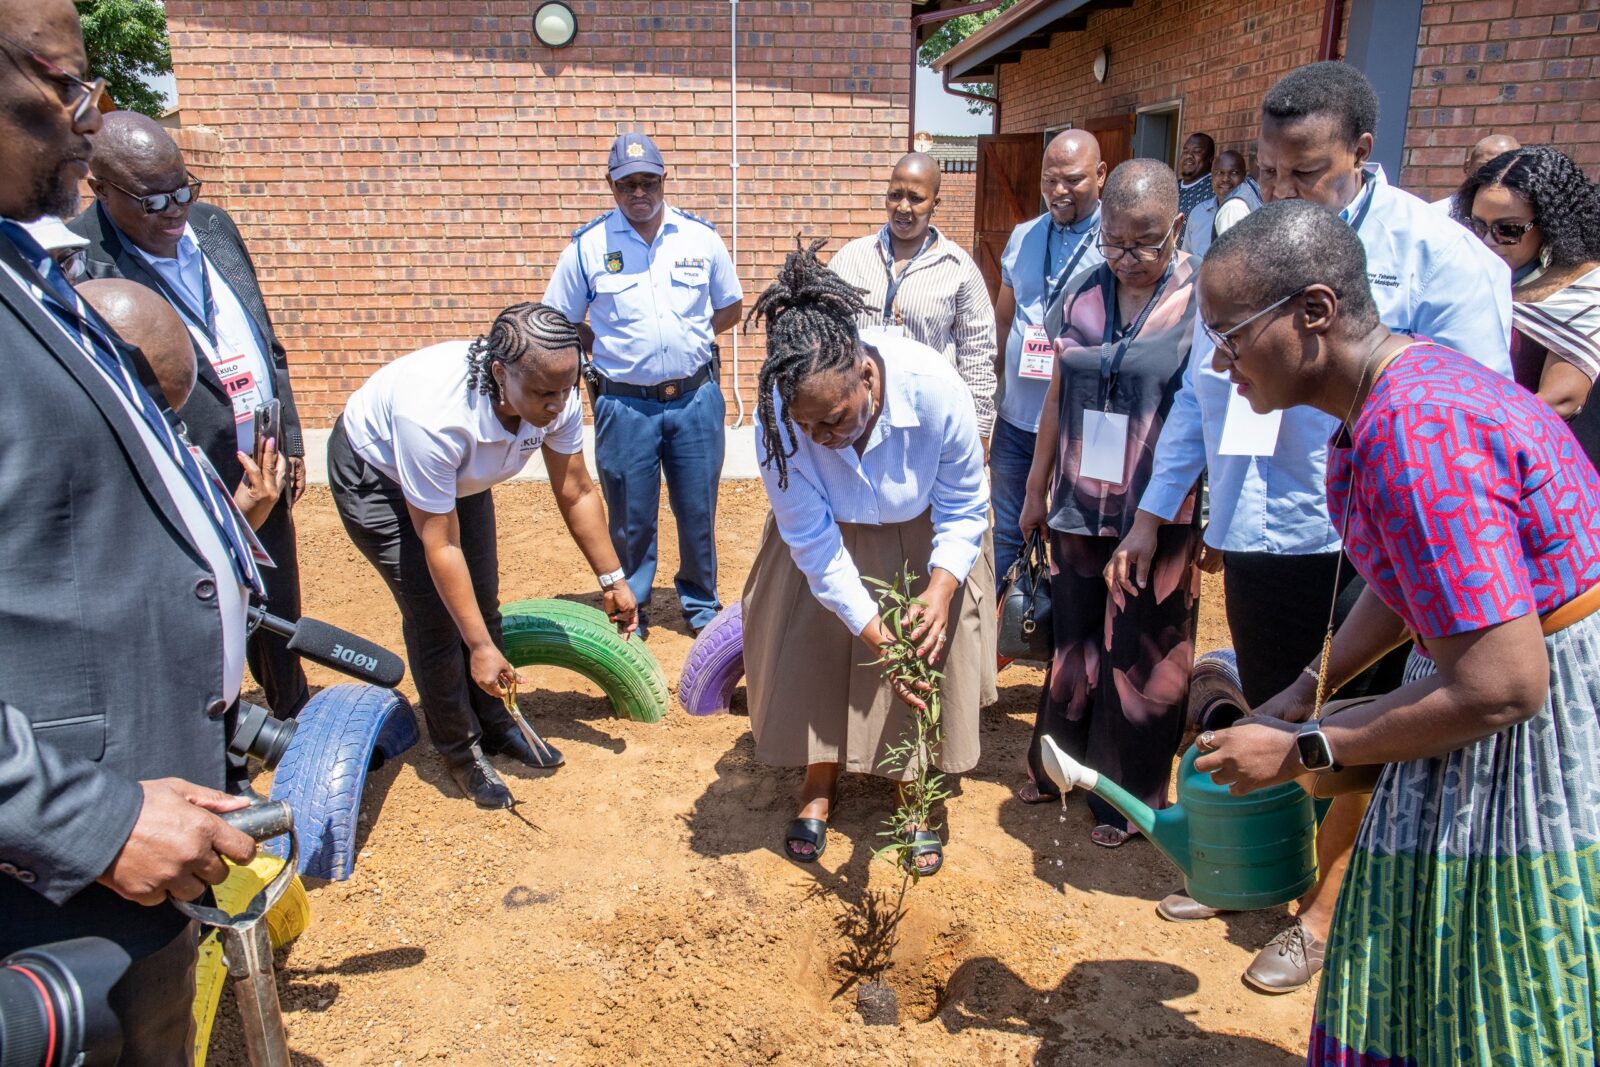
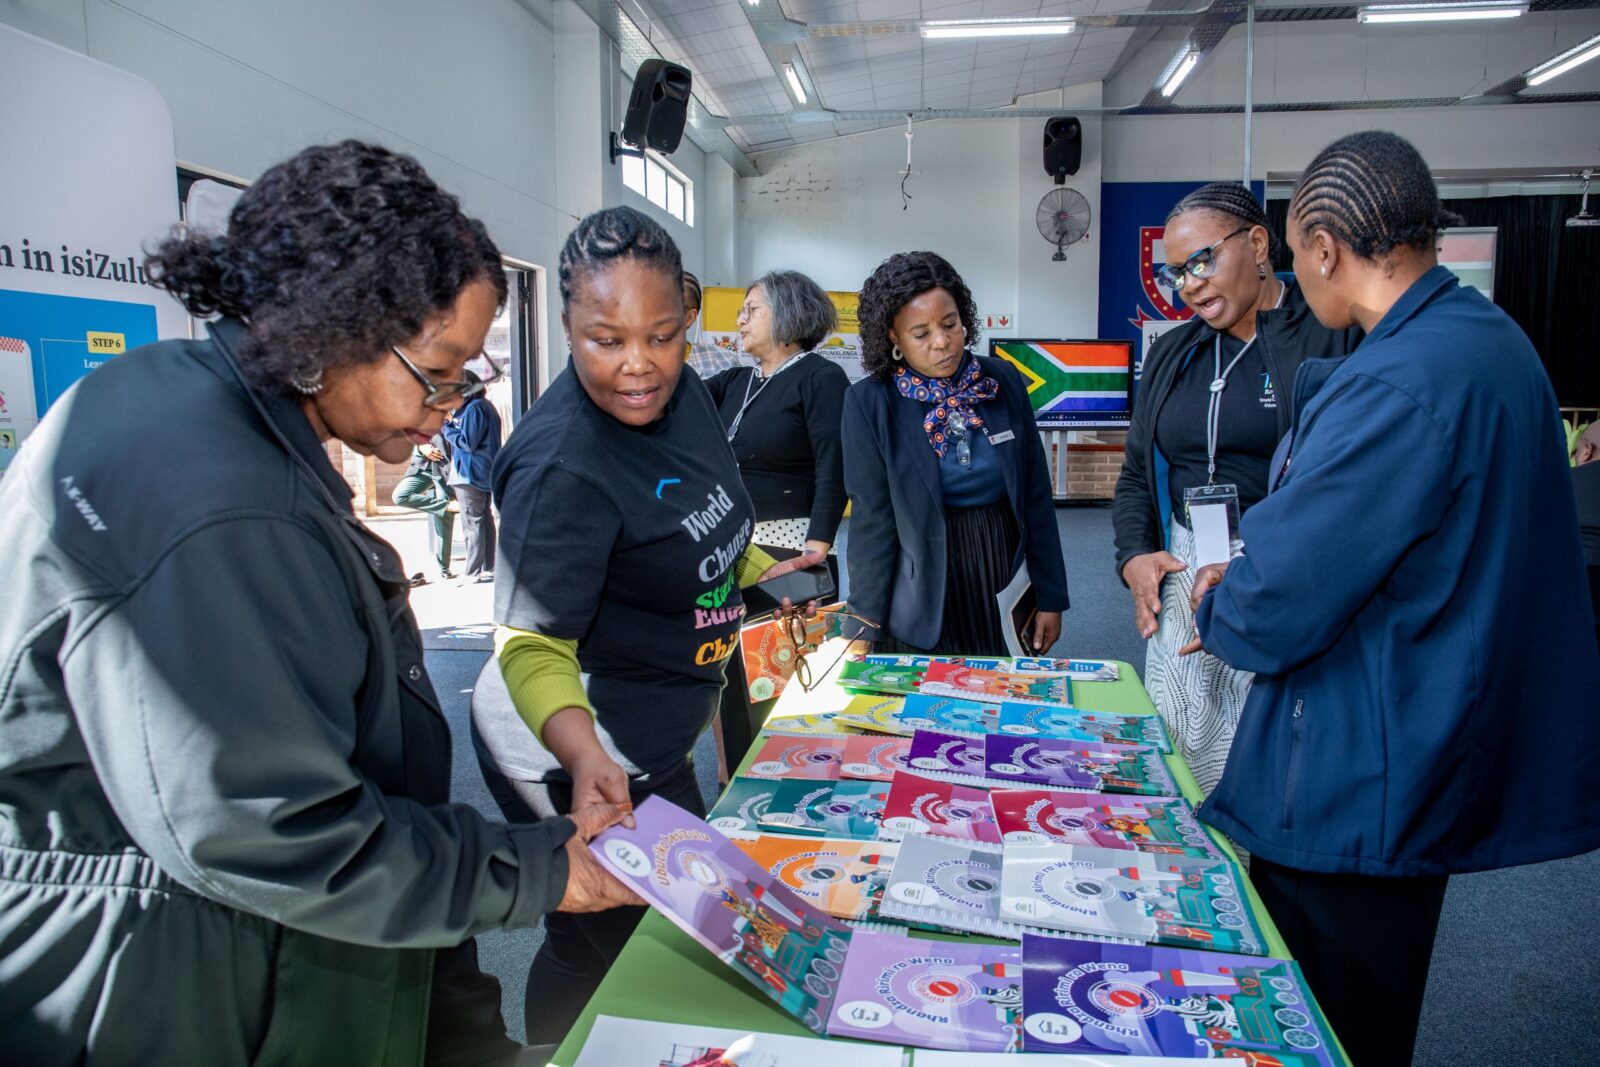
Through the Thungela Education Initiative and the Nkulo Community Partnership
Trust, meaningful progress continues to be made in expanding access to quality
education and community infrastructure. During the period, the Nkulo Community
Partnership Trust replaced 19 asbestos classrooms and associated ablution facilities
at Mphephethe Primary School, providing learners with a safer and more conducive
learning environment, while the Bonginhlanhla Stimulation Centre nears completion
and will provide specialised support to children living with disabilities. In addition, 49
entrepreneurs graduated from the Thuthukani enterprise and supplier development
programme, bringing the total number of graduates to 185 since its inception in 2023
and supporting sustainable economic development in our communities.
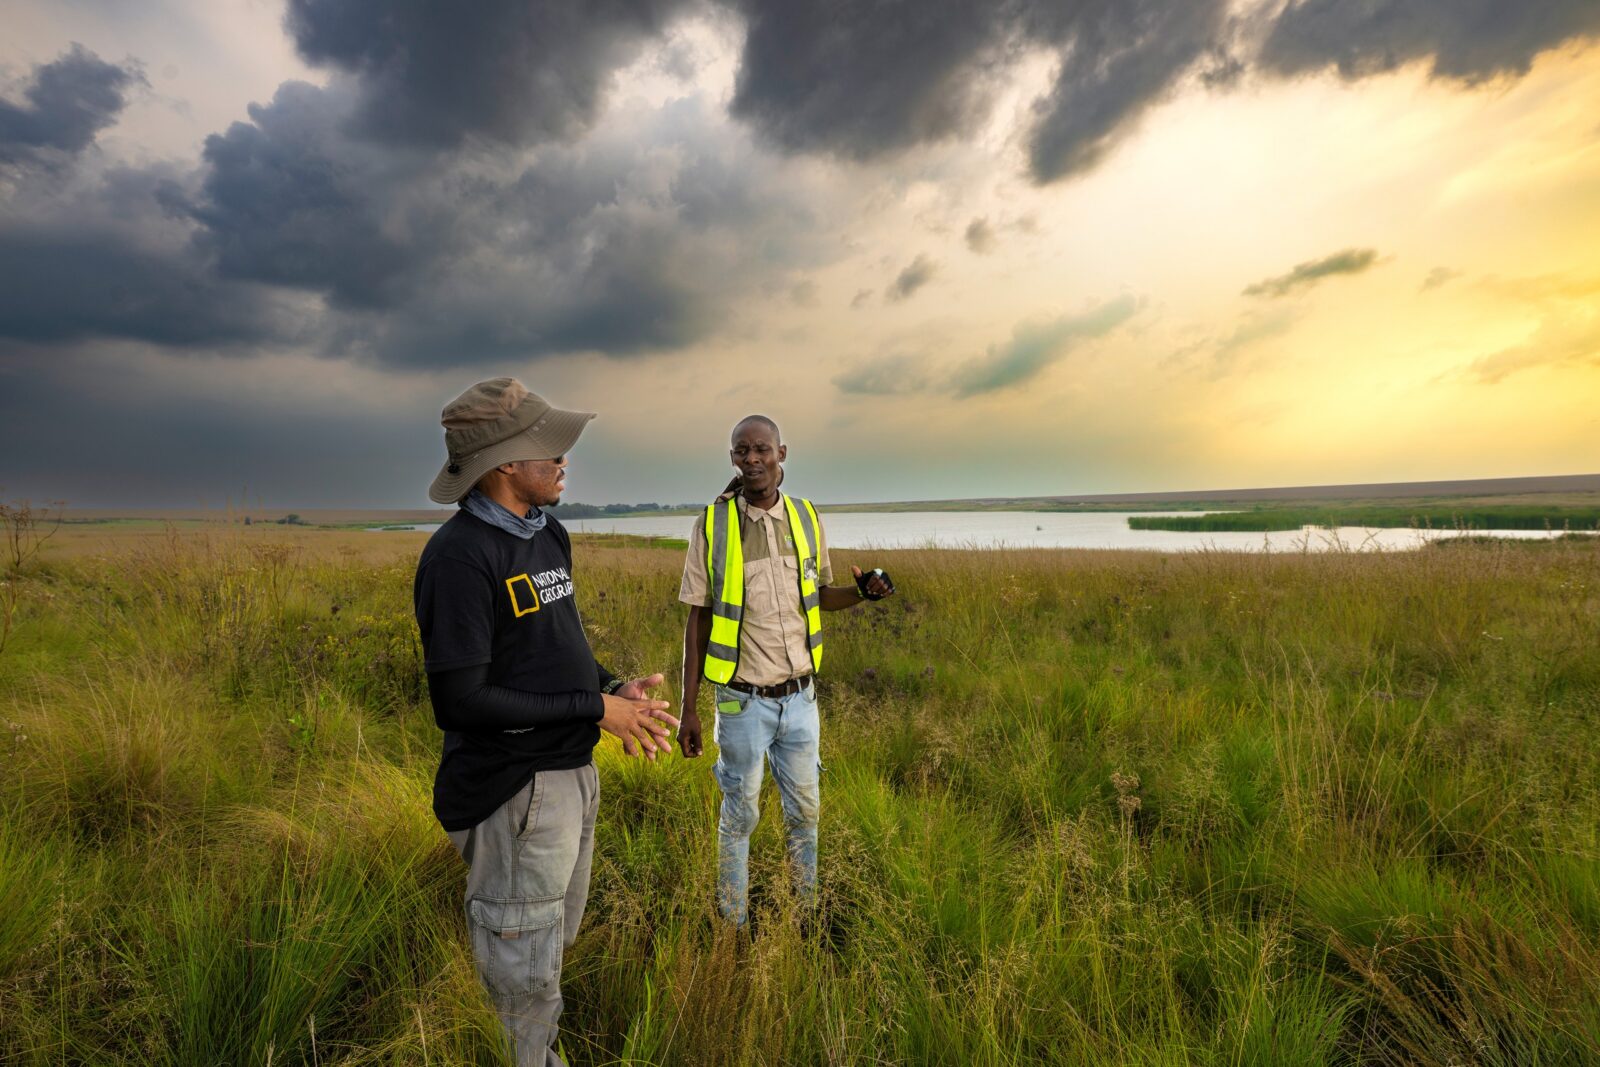
We are pleased to report that there were no significant environmental incidents for
the period. This reflects the effectiveness of our environmental management
systems and the continued focus on responsible operational practices across all our
sites.
We continue to explore opportunities that support a lower-carbon future, with the
Lephalale Coal Bed Methane project remaining a key strategic initiative. Efforts
during the period focused on further assessing the project’s commercial viability and
market potential, alongside advancing regulatory approvals through the submission
of a production right application and the commencement of related regulatory
processes.
The market
The protracted conflict in the Middle East has significantly contributed to the
increased volatility across global energy markets. Against this backdrop, benchmark
thermal coal prices strengthened relative to the prior year, supported by higher oil
and gas prices and concerns regarding global energy security. The conflict, which
has now continued for over five months despite several attempts at a ceasefire, has
kept coal prices volatile, closely linked to the broader energy complex. Coal has
once again been reinforced as a source of national energy security.
Downside price risk remains, anchored to underlying demand fundamentals, as
increased energy costs, inflation and supply chain pressures weigh on industrial
activity and thermal coal demand. This has created a divergence in regional demand
factors. In India, where South African coal is more exposed, the weakening currency,
increased freight rates and cost-sensitive end-users have capped the upside
potential for South African coal. In Northeast Asia, where Australian coal is more
relevant, occasional utility demand and supply disruptions in China provided
intermittent support to the Newcastle Benchmark coal price. Exporters are
competing with alternative supply origins able to offer lower prices, resulting in the
recent price softening as demand fundamentals begin to weaken.
Looking ahead, thermal coal markets are expected to be influenced by
developments in global gas markets and seasonal energy demand. As consumers in
Europe and Asia rebuild inventories ahead of the Northern Hemisphere winter,
tighter gas market conditions could provide support to coal prices. However, the
potential for stronger prices may be moderated by subdued demand growth in key
consuming regions, substantial domestic coal inventories in major markets,
continued growth in renewable generation and broader macroeconomic uncertainty.
While near-term market volatility is likely to persist, longer-term market dynamics
remain supportive. The anticipated global gas supply surplus has been delayed,
while the pace of the energy transition continues to be more gradual than previously
expected. As governments seek to balance decarbonisation objectives with energy
security, affordability and system reliability, coal continues to play an important role in
meeting global energy needs. A relatively balanced supply and demand outlook is
expected to provide greater underlying support for coal markets, notwithstanding
periodic price volatility.
The Group remains confident in the long-term fundamentals of coal. Coal remains an
affordable, accessible and reliable source of energy for many economies, particularly
in developing regions where energy demand continues to grow. Against a backdrop
of increasing energy security concerns, grid stability requirements and the slower-
than-expected pace of renewable energy deployment, coal is expected to remain an
important part of the global energy mix for decades to come, supporting economic
development, industrial activity and reliable electricity supply.
Delivering shareholder returns
The board continues to balance shareholder returns with financial flexibility to
support resilience through the cycle and fund value-accretive investment
opportunities.
The board has therefore resolved to declare an interim dividend of R5.50 per share,
a total cash distribution of R773 million, which is above the dividend policy of
distributing a minimum of 30% of adjusted operating free cash flow* to shareholders.
In addition, the Sisonke Employee Empowerment Scheme and the Nkulo
Community Partnership Trust will receive R57 million collectively.
Looking ahead
The first half of 2026 demonstrates the resilience of Thungela’s business model in an
increasingly dynamic world and reflects the ambition, commitment and confidence of
our people in delivering a consistent performance.
As we look ahead, our priorities remain clear. We will continue to place safety and
health at the centre of everything we do, while maintaining our focus on operational
excellence, disciplined capital allocation and sustainable value creation.
Thungela is well positioned to navigate the cycle, supported by a strong balance
sheet, a portfolio of quality assets and a strategy focused on growing earnings,
resilience and long-term value creation for shareholders.
OPERATIONAL GUIDANCE – 2026
South Africa Ensham
Export saleable production (Mt) 13.0 – 13.6 3.9 – 4.2
FOB cost per export tonne* (Rand/tonne)1 1,330 – 1,380 1,650 – 1,740
FOB cost per export tonne excluding royalties* 1,320 – 1,370 1,480 – 1,570
(Rand/tonne)1
Capital – sustaining* (Rand million) 700 – 1,000 500 – 700
Capital – expansionary (Rand million) 100 nil
1 The Ensham FOB costs* in the table above are based on an exchange rate of R12.09:AUD1.
South African operations
Export saleable production guidance for the full year remains appropriate at 13.0Mt
to 13.6Mt, as we expect a stronger second half production performance, in line with
the performance of previous years.
Zibulo experienced an increase in conveyor belt and support services challenges in
the mining footprint that will be retired once all production is shifted to the Zibulo
North Shaft. These challenges are transient and continue to receive the necessary
operational and technical focus.
Despite export saleable production in South Africa reported at 6.3Mt for the reporting
period, the full-year guidance for FOB cost per export tonne excluding royalties*, of
between R1,320 and R1,370, remains appropriate. Similarly, the range including
royalties remains appropriate at between R1,330 and R1,380 per tonne.
The range for sustaining capital expenditure* remains appropriate at between R700
million and R1.0 billion. Expansionary capital expenditure will be marginally
above the guidance of R100 million as the Zibulo North Shaft project is closed out.
Ensham
Export saleable production guidance for 2026 remains unchanged at 3.9Mt to 4.2Mt.
Production in the first half of the year was in line with expectations, and current
operating plans for the remainder of the year continue to support delivery within the
guided range.
FOB cost per export tonne excluding royalties* has been positively impacted by the
stronger exchange rate of the South African rand to the Australian dollar. We expect
FOB cost per export tonne excluding royalties* to remain within the guidance range
of between R1,480 and R1,570 in 2026. The equivalent cost including royalties is
expected to remain between R1,650 and R1,740 per tonne.
Sustaining capital expenditure* at Ensham is expected to remain between R500
million and R700 million in 2026.
DIVIDEND DECLARATION
The board has declared an ordinary interim ordinary cash dividend of R5.50 per
share, payable to shareholders on the Johannesburg Stock Exchange and the
London Stock Exchange in September 2026 and October 2026, respectively.
Further details regarding the dividend declaration can be found in a separate
announcement dated 17 August 2026 on the Johannesburg Stock Exchange News
Services (SENS) and the London Regulatory News Services (RNS).
FOOTNOTE
(1) Total recordable case frequency rate was previously reported in the Interim
Financial Statements for the six months ended 30 June 2025 as 2.98 for the Group,
1.86 for South Africa and 18.42 for Australia. These figures were updated in the 31
December 2025 annual results subsequent to the assurance process.
FORWARD-LOOKING STATEMENTS
This announcement includes forward-looking statements. All statements included in
this document (other than statements of historical facts) are, or may be deemed to
be, forward-looking statements, including, without limitation, those regarding
Thungela’s financial position, business, acquisition and divestment strategy, dividend
policy, plans and objectives of management for future operations (including
development plans and objectives relating to Thungela’s products, production
forecasts and resource and reserve positions). By their nature, such forward-looking
statements involve known and unknown risks, uncertainties and other factors which
may cause the actual results, performance or achievements of Thungela, or industry
results, to be materially different from any future results, performance or
achievements expressed or implied by such forward-looking statements. Thungela
therefore cautions that forward-looking statements are not guarantees of future
performance.
Any forward-looking statement made in this announcement or elsewhere is
applicable only at the date on which such forward-looking statement is made. New
factors that could cause Thungela’s business not to develop as expected may
emerge from time to time and it is not possible to predict all of them. Further, the
extent to which any factor or combination of factors may cause actual results to differ
materially from those contained in any forward-looking statement are not known.
Thungela has no duty to, and does not intend to, update or revise the forward-
looking statements contained in this announcement after the date of this document,
except as may be required by law. Any forward-looking statements included in this
announcement have not been reviewed or reported on by the Group’s independent
external auditor.
Investors are cautioned not to rely on these forward-looking statements and are
encouraged to read the Interim Financial Statements for the six months ended 30
June 2026 (Interim Financial Statements 2026), which are available from the
Thungela website via the following web link:
https://www.thungela.com/investors/financial-results
ALTERNATIVE PERFORMANCE MEASURES
Throughout this results announcement, a range of financial and non-financial
measures are used to assess our performance, including a number of financial
measures that are not defined or specified under International Financial Reporting
Standards (IFRS Accounting Standards), which are termed ‘alternative performance
measures’ (APMs). Management uses these measures to monitor the Group’s
financial performance alongside IFRS Accounting Standards measures, to improve
the comparability of information between reporting periods. These APMs should be
considered in addition to, and not as a substitute for, or as superior to, measures of
financial performance, financial position or cash flows reported in accordance with
IFRS Accounting Standards. APMs are not uniformly defined by all companies,
including those in the Group’s industry. Accordingly, these measures may not be
comparable with similarly titled measures and disclosures by other companies. In
this results announcement, APMs are denoted with an asterisk (*).
RESULTS ANNOUNCEMENT
This results announcement, including the forward-looking statements, is the
responsibility of the directors of Thungela.
Shareholders are advised that this results announcement is only a select extract of
the information contained in the Interim Financial Statements 2026 and does not
contain full or complete details. Any investment decisions by investors and/or
shareholders should be based on a consideration of the Interim Financial
Statements 2026 as a whole and investors and/or shareholders are encouraged to
review the Interim Financial Statements 2026, which are available on the Thungela
website via the following web link: https://www.thungela.com/investors/financial-
results, and available on the JSE’s cloudlink, at
https://senspdf.jse.co.za/documents/2026/JSE/ISSE/TGAE/TGAInt2026.pdf
This results announcement has been prepared in compliance with the JSE Limited
Listings Requirements.
A conference call and webcast relating to the details of this results announcement
will be held at 12:00 SAST (10:00 GMT) on Monday, 17 August 2026. Registration
details for the conference call and webcast are below:
Conference call:
https://services.choruscall.it/DiamondPassRegistration/register?confirmationNumber
=7721589&linkSecurityString=160b7e901e
Webcast:
https://78449.themediaframe.com/links/thungela260323.html
The condensed consolidated interim financial statements for the six months ended 30
June 2026 were reviewed by PricewaterhouseCoopers Inc. who have issued an
unqualified review report. The full independent auditor’s review report and Interim
Financial Statements 2026 are available for viewing on the Thungela website via the
following web link: https://www.thungela.com/investors/finacial-results.
This results announcement has not been audited or reviewed by the Group’s
independent external auditor. Any reference to future financial performance included
in this announcement has not been separately reported on by the Group’s
independent external auditor.
The Company’s registered office is located at: 25 Bath Avenue, Rosebank,
Johannesburg, 2196, South Africa.
The information contained within this announcement is deemed by the Company to
constitute inside information as stipulated under the market abuse regulation (EU) no.
596/2014 as amended by the market abuse (amendment) (UK mar) regulations 2019.
Upon the publication of this announcement via the regulatory information service, this
inside information is now considered to be in the public domain.
On behalf of the board of directors
Sango Ntsaluba, Chairperson
Moses Madondo, Chief executive officer
Johannesburg, South Africa
Date of SENS release: 17 August 2026
Investor relations
Hugo Nunes and Shreshini Singh
Email: [email protected]
Media
Hulisani Rasivhaga
Email: [email protected]
UK Financial adviser and corporate broker
Panmure Liberum Limited
Tel: +44 20 3100 2000
Sponsor
Rand Merchant Bank
(A division of FirstRand Bank Limited)
Tel: +27 11 282 8000
Date: 17/08/2026 06:00:00
Produced by the JSE SENS Department. The SENS service is an information dissemination service administered by the JSE Limited (‘JSE’).
The JSE does not, whether expressly, tacitly or implicitly, represent, warrant or in any way guarantee the truth, accuracy or completeness of
the information published on SENS. The JSE, their officers, employees and agents accept no liability for (or in respect of) any direct,
indirect, incidental or consequential loss or damage of any kind or nature, howsoever arising, from the use of SENS or the use of, or reliance on,
information disseminated through SENS.