Director/PDMR Shareholding
Bull 0
Bear 0
Routine
SVS
|
Savills plc is a global property advisor providing insights and advice to individuals, businesses, and investors to facilitate property decisions. The company offers a wide range of specialist services, including real estate investment banking, investment advice, valuation, planning, and property management. Its operations cover a broad spectrum of property sectors, from commercial and prime residential real estate to agricultural land and new-build developments. Savills serves clients across the Americas, Europe, Asia Pacific, Africa, and the Middle East, operating through a network of offices in multiple countries. The firm has been active for over a century, assisting clients in finding properties, buyers, and tenants through its international specialist network. Summarised from the company's own disclosures, fiscal year ended Dec 2023 |
Industry Real Estate Services | Homepage savills.com |
| Sector Real Estate | IR page ir.savills.com | |
|
Tags
real estate advisory, investment banking, property valuation, property management, residential real estate, commercial real estate, planning services
|
Press page — |
Metrics
| Valuation | |
|---|---|
| Market cap | £ 1.217B |
| Market cap (USD) | $ 1.62B |
| P/E | 17.70 |
| PEG | — |
| P/BV | 1.62 |
| P/S | 0.46 |
| P/OCF | 7.07 |
| P/FCF | 8.42 |
| Dividend yield | 4.1% |
| Turnover / mcap | — |
| Returns | |
|---|---|
| ROE | 9.3% |
| ROI | 7.9% |
| ROIC | 7.3% |
| Profit margin | 2.9% |
| Growth | |
|---|---|
| Revenue growing | Yes |
| Profits growing | Yes |
| Revenue up 3y | No |
| Revenue up 5y | No |
| Earnings growth 3y (net profit CAGR) | -15.9% |
| Quality | |
|---|---|
| Profitable | Yes |
| Margin expanding | Yes |
| Buying back stock | No |
| Diluting (TTM) | Yes |
| Debt/Equity | 16.0% |
| Podcast bulls (TTM) | Sign up |
| Podcast bears (TTM) | Sign up |
| Podcast sentiment (TTM) | Sign up |
| Podcast sentiment % (TTM) | Sign up |
| News sentiment (TTM) | 0 |
| Quality score | 21.1% |
| Insiders | |
|---|---|
| Buys, 1w | Sign up |
| Buys, 1m | Sign up |
| Buys, 1y | Sign up |
| Sells, 1w | Sign up |
| Sells, 1m | Sign up |
| Sells, 1y | Sign up |
Sign up to see this company's insider trades
| Figure | FY 2025 | FY 2024 | FY 2023 | FY 2022 | FY 2021 | FY 2020 | FY 2019 | FY 2018 | FY 2017 | FY 2016 | FY 2014 | FY 2013 | FY 2012 | FY 2011 |
|---|---|---|---|---|---|---|---|---|---|---|---|---|---|---|
| Revenue | 2.551B | 2.404B | 2.238B | 2.298B | 2.147B | 1.741B | 1.913B | 1.761B | 1.6B | 1.446B | 1.078B | 904.8M | 806.4M | 721.5M |
| Net profit | 73.6M | 52.9M | 39.5M | 119.8M | 146.7M | 68M | 83.6M | 77.2M | 81.1M | 67.7M | 62.7M | 51.4M | 38.8M | 26.8M |
| Free cash flow | 144.5M | 146.9M | 1.4M | 144.2M | 284.1M | 235.8M | 79.2M | — | — | — | — | — | — | — |
Filed figures
Lines the statements and their notes report beside the headline figures, read from the filings' XBRL as filed (no restatement applied), with figures computed from one filing's own lines. Cash-flow lines carry their cash direction: an outflow is negative. Each period links to its filing; a figure's period, report date and tag are in its tooltip.
| Figure | Dec 2019 | Dec 2020 | Dec 2021 | Dec 2022 | Dec 2023 | Dec 2024 | Dec 2025 |
|---|---|---|---|---|---|---|---|
| Balance sheet detail | |||||||
| Trade receivables (GBP) | 569M | 497M | 603M | 643M | 656M | 719M | 770M |
| ↳ YoY growth | -12.7% | +21.3% | +6.7% | +2.1% | +9.5% | +7.1% | |
| ↳ 5y CAGR | +4.8% | +9.2% | |||||
| Borrowings, current (GBP) | 33.4M | 12.2M | 2.1M | 10.6M | 7.9M | 41.3M | 48M |
| Borrowings, non-current (GBP) | 148M | 148M | 148M | 149M | 149M | 120M | 129M |
| Lease liabilities (GBP) | 267M | 304M | 285M | 278M | 254M | 233M | 255M |
| Cash and deposits (GBP) | 210M | 338M | 690M | 669M | 507M | 537M | 532M |
| Intangible assets (GBP) | 44.5M | 49.8M | 72.6M | 66.3M | 55.8M | 51.8M | 42.3M |
| Right-of-use assets (GBP) | 226M | 253M | 233M | 224M | 198M | 183M | 205M |
| Net debt (borrowings + leases - cash) (GBP) | 239M | 127M | -254M | -232M | -95.4M | -143M | -99.5M |
| Cash flow detail | |||||||
| Operating cash flow (GBP) | 95.4M | 249M | 303M | 164M | 18.8M | 159M | 172M |
| Purchases of property, plant and equipment (GBP) | -16.2M | -12.8M | -18.6M | -19.8M | -17.4M | -11.7M | -27.8M |
| Purchases of intangible assets (GBP) | -7.3M | -5.3M | -5.9M | -7M | -5.5M | -9.1M | -5.3M |
| Dividends paid (cash effect) (GBP) | -43.3M | -400,000 | -32.3M | -85.9M | -51M | -33.8M | -43.2M |
| Share buybacks (cash effect) (GBP) | -14.1M | -8.3M | -49M | -49M | -26.3M | -22.9M | -17.4M |
| Interest paid (cash effect) (GBP) | -17.8M | -15M | -14M | -16.9M | -33.3M | -42M | -40.6M |
| Income taxes paid (cash effect) (GBP) | -25.8M | -29.6M | -33.4M | -43.3M | -37.7M | -33.9M | -36.9M |
| Free cash flow (OCF - PPE - intangibles) (GBP) | 71.9M | 231M | 278M | 137M | -4.1M | 138M | 139M |
| Income detail | |||||||
| Total comprehensive income (GBP) | 47.3M | 67.9M | 149M | 160M | -3.5M | 54.1M | 56.8M |
| Comprehensive income to owners (GBP) | 46.6M | 67.5M | 149M | 158M | -1.4M | 55.9M | 54.1M |
| Reported | Apr 12, 2021 | Apr 12, 2021 | Apr 29, 2022 | Apr 6, 2023 | Apr 25, 2024 | Apr 11, 2025 | Apr 30, 2026 |
Sign up to see institutional holdings
Sign UpPodcast Mentions
Sign up to see podcast mentions and sentiment
Sign UpResults, director/PDMR dealings and voting-rights totals announced to the FCA's National Storage Mechanism, newest first. The link opens the announcement on the NSM. Press releases from the company's own website, newest first.
New York leads for next-generation wealth as priorities shift for where to live and invest
Bull 0
Bear 0
Other
Savills News
New York leads for next-generation wealth as priorities shift for where to live and invest
21 October 2026
### Article ### Contacts & Related Articles
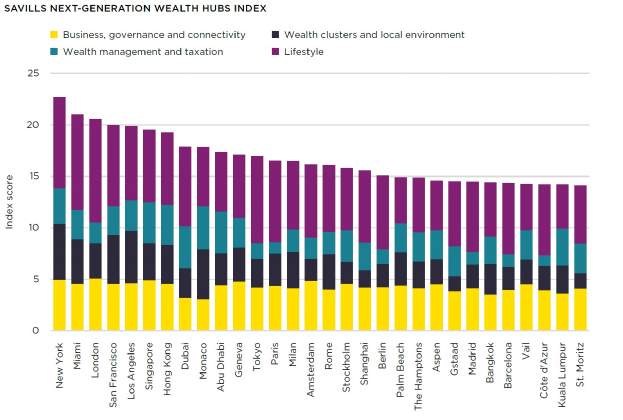
According to the Savills Next-Generation Wealth Hubs Index, New York is the world’s leading destination for the next generation of wealthy individuals under 40 who have recently made or inherited their wealth. It is followed by Miami, London, San Francisco and Los Angeles. Markets across Europe, the Middle East and Africa (EMEA) account for more than half of the global top 30. The region’s strength lies in its combination of lifestyle, global connectivity and wealth preservation.
“An estimated US$84 trillion is expected to transfer between generations over the next two decades,” comments Kelcie Sellers, Associate Director, Savills World Research. “As this wealth passes to a younger, more globally mobile and digitally connected generation, priorities are evolving, with lifestyle, education, wellness, and personal values increasingly influencing where they choose to live, invest and establish their business.”
New York, which tops the global ranking, benefits from an unrivalled concentration of talent, capital and business opportunity, alongside international schools, luxury retail, Michelin-starred dining and high-end hospitality. Other leading hubs in the region include Miami (2nd), San Francisco (4th) and Los Angeles (5th). Lifestyle-driven destinations are also gaining appeal, including mountain resorts such as Aspen (22nd) and Vail (27th), as well as popular weekend retreats such as Palm Beach (20th) and The Hamptons (21st). As wellness, experiences, flexibility and quality of life become increasingly important priorities, these destinations are likely to see their appeal continue to grow.
London ranks third globally. Other leading European destinations include Monaco (9th), Geneva (11th), Paris (13th) and Milan (14th). Destinations across Southern Europe and the Alps are also gaining ground, offering a high quality of life and increasingly supporting year-round living.
Despite a backdrop of geopolitical tension and heightened uncertainty, Abu Dhabi (8th) and Dubai (10th) continue to rank among the world’s leading wealth destinations. Across the Gulf region, economic diversification, intergenerational wealth transfer and long-term capital deployment are becoming increasingly important. Asia Pacific is home to six locations in the global top 30, highlighting the region’s growing importance as both a centre of wealth creation and wealth management. Singapore (6th) and Hong Kong (7th) lead the region, followed by Tokyo (12th), Shanghai (18th), Bangkok (25th) and Kuala Lumpur (29th).
The Great Wealth Transfer is reshaping the geography of wealth and creating new opportunities for property markets. As capital moves across generations and borders, residential demand is also changing. The role of residential property is evolving: it is no longer viewed solely as a means of capital preservation, but increasingly as a way to support the lifestyle of wealth holders and their families. Residential real estate must now deliver more than capital preservation alone. It must support how wealth holders and their families want to live, work, travel, connect and plan for the future.
The Savills Next-Generation Wealth Hubs Index provides insight into the locations best placed to attract and retain the next generation of high-net-worth individuals, defined as those under 40 who have recently made or inherited their wealth, or are poised to benefit from the Great Wealth Transfer. The report analyses more than 100 destinations and is based on four overarching pillars: business, governance and connectivity; wealth clusters and local environment; wealth management and taxation; and lifestyle. The index draws on 48 indicators to compare established global wealth hubs and lifestyle destinations, highlighting the locations best placed to balance business opportunity, wealth preservation, connectivity and quality of life.
Research
Author:

Lucie Hanuš Schwabová
Head of Communications, Marketing
[+420 731 576 827](tel:+420 731 576 827)

Ivona Novotná
PR Specialist, Marketing
[+420 731 889 963](tel:+420 731 889 963)
Read Time:
3 minutes
Share this article
New York leads for next-generation wealth as priorities shift for where to live and invest
https://www.savills.com/insight-and-opinion/savills-news/395911/new-york-leads-for-next-generation-wealth-as-priorities-shift-for-where-to-live-and-invest Copy
Related Articles

Office Space
Workplace highly valued by C-Suite, but many lack ability to accurately measure its worth

Data Centres
Data centres scaling fastest across APAC, although US remains far ahead in capacity terms
Research
Savills Deep Tech Index: San Francisco, New York and the UK's Golden Triangle benefit most from the AI boom
Recommended articles
Research 21 October 2026
New York leads for next-generation wealth as priorities shift for where to live and invest
Occupier Services 08 September 2026
Workplace highly valued by C-Suite, but many lack ability to accurately measure its worth
Commercial Investment 27 August 2026
Global real estate turnover rises 13%, with 2026 set to end up as experienced investors make selective purchases
Subscribe to receive exclusive news and listings
Send
Success! You are now subscribed to the Savills mailing list.
Sorry, something went wrong.
Savills by region
Africa
Americas & Caribbean
Asia Pacific
Europe
Middle East
Residential real estate
Commercial real estate
Rural real estate
Services & Sectors
Services
Sectors
About Savills
More information
Talk to us
All content © copyright 2026 Savills. All rights reserved. Savills plc, incorporated and registered in England and Wales. Registered office: 33 Margaret Street, London, W1G 0JD. Registered number: 2122174. Savills plc is a holding company, some of whose subsidiaries are authorised and regulated by the Financial Conduct Authority (FCA)
Find us on social
Director/PDMR Shareholding
Bull 0
Bear 0
Routine












Prompts
Click prompts to add them under the company line, click again to take one out, then copy the result into your AI chat. Shared by Asian Century Stocks and Uncovered Thai Stocks. Thank you.
Savills plc (ticker SVS), listed in United Kingdom.
Copied
ETFs Holding Savills plc
Exchange-traded funds whose newest published daily portfolio holds one of the company's listings, largest weight first.