Director/PDMR Shareholding
Bull 0
Bear 0
Routine
SCT
Fiscal year ends July
Quarters are offset from the calendar — Q1 is Aug–Oct
|
Softcat is a provider of IT infrastructure, products, and services to corporate and public sector customers. The company operates across five key areas: Hybrid Cloud Solutions, Workspace, Cyber, Networking and Connectivity, and Data, Automation and AI. It serves sectors including healthcare, education, government, defence, police, and emergency services. Softcat partners with over 200 technology vendors, including Microsoft, Cisco, Dell, Mimecast, and Check Point, to deliver end-to-end solutions. The company offers multinational services and expanded its international reach through the acquisition of GDT. Softcat provides licensing, cloud solutions, and managed services to support digital transformation and operational efficiency for its clients. Summarised from the company's own disclosures, fiscal year ended Oct 2026 |
Industry Information Technology Services | Homepage softcat.com |
| Sector Technology | IR page softcat.com/about-us/investor-centre | |
|
Tags
it infrastructure, hybrid cloud, cyber security, networking, data automation, public sector it, corporate it, vendor agnostic, managed services, licensing, GDT, Microsoft, Cisco, Dell, Mimecast, Check Point, Apple, Azure AAA, Apple Hub
|
Press page — |
Metrics
| Valuation | |
|---|---|
| Market cap | £ 2.706B |
| Market cap (USD) | $ 3.632B |
| P/E | 18.00 |
| PEG | 1.75 |
| P/BV | 7.43 |
| P/S | 1.37 |
| P/OCF | 17.18 |
| P/FCF | 17.86 |
| Dividend yield | — |
| Turnover / mcap | — |
| Returns | |
|---|---|
| ROE | 42.8% |
| ROI | 76.5% |
| ROIC | 74.1% |
| Profit margin | 7.6% |
| Growth | |
|---|---|
| Revenue growing | Yes |
| Profits growing | Yes |
| Revenue up 3y | No |
| Revenue up 5y | No |
| Earnings growth 3y (net profit CAGR) | 10.3% |
| Quality | |
|---|---|
| Profitable | Yes |
| Margin expanding | No |
| Buying back stock | No |
| Diluting (TTM) | — |
| Debt/Equity | — |
| Podcast bulls (TTM) | Sign up |
| Podcast bears (TTM) | Sign up |
| Podcast sentiment (TTM) | Sign up |
| Podcast sentiment % (TTM) | Sign up |
| News sentiment (TTM) | 0 |
| Quality score | 11.8% |
| Insiders | |
|---|---|
| Buys, 1w | Sign up |
| Buys, 1m | Sign up |
| Buys, 1y | Sign up |
| Sells, 1w | Sign up |
| Sells, 1m | Sign up |
| Sells, 1y | Sign up |
Sign up to see this company's insider trades
| Figure | FY 2026 | FY 2025 | FY 2024 | FY 2023 | FY 2022 | FY 2021 | FY 2020 | FY 2019 | FY 2018 | FY 2017 | FY 2016 | FY 2015 | FY 2011 | FY 2010 | FY 2009 |
|---|---|---|---|---|---|---|---|---|---|---|---|---|---|---|---|
| Revenue | 1.975B | 1.458B | 962.633M | 985.3M | 1.078B | 1.157B | 1.077B | 433.97M | 1.082B | 832.486M | 672.351M | 596.084M | — | 145.751M | 113.114M |
| Net profit | 150.3M | 133.008M | 119.044M | 112.029M | 110.405M | 96.185M | 75.664M | 27.45M | 19.432M | 40.108M | 33.158M | 31.117M | 11.534M | 7.062M | 5.146M |
| Free cash flow | 151.5M | — | — | — | — | — | — | — | — | — | — | — | — | — | — |
Filed figures
Lines the statements and their notes report beside the headline figures, read from the filings' XBRL as filed (no restatement applied), with figures computed from one filing's own lines. Cash-flow lines carry their cash direction: an outflow is negative. Each period links to its filing; a figure's period, report date and tag are in its tooltip.
| Figure | Jul 2022 | Jul 2023 | Jul 2024 | Jul 2025 | Jul 2026 |
|---|---|---|---|---|---|
| Balance sheet detail | |||||
| Trade receivables (GBP) | — | 490M | 585M | 713M | 894M |
| ↳ YoY growth | +19.4% | +21.8% | +25.4% | ||
| Lease liabilities (GBP) | — | 9.76M | 10.4M | 35.2M | 37.9M |
| Cash and deposits (GBP) | 97.3M | 123M | 158M | 182M | 200M |
| Intangible assets (GBP) | — | 7.16M | 11.6M | — | — |
| Right-of-use assets (GBP) | — | 9.97M | 10.1M | 31.8M | 33.2M |
| Cash flow detail | |||||
| Operating cash flow (GBP) | — | 105M | 116M | 141M | 158M |
| Purchases of property, plant and equipment (GBP) | — | -2.54M | -1.12M | -11.8M | -6M |
| Purchases of intangible assets (GBP) | — | -701,000 | -6.02M | -3.44M | -600,000 |
| Dividends paid (cash effect) (GBP) | — | -74.2M | -76M | -95.7M | -92.5M |
| Share buybacks (cash effect) (GBP) | — | — | — | 0.00 | -45M |
| Free cash flow (OCF - PPE - intangibles) (GBP) | — | 102M | 108M | 125M | 151M |
| Income detail | |||||
| Total comprehensive income (GBP) | — | 111M | 119M | 132M | 149M |
| Comprehensive income to owners (GBP) | — | 111M | 119M | 132M | 149M |
| Reported | Nov 1, 2024 | Nov 1, 2024 | Nov 1, 2024 | Oct 27, 2026 | Oct 27, 2026 |
Sign up to see institutional holdings
Sign UpPodcast Mentions
Sign up to see podcast mentions and sentiment
Sign UpResults, director/PDMR dealings and voting-rights totals announced to the FCA's National Storage Mechanism, newest first. The link opens the announcement on the NSM. Press releases from the company's own website, newest first.


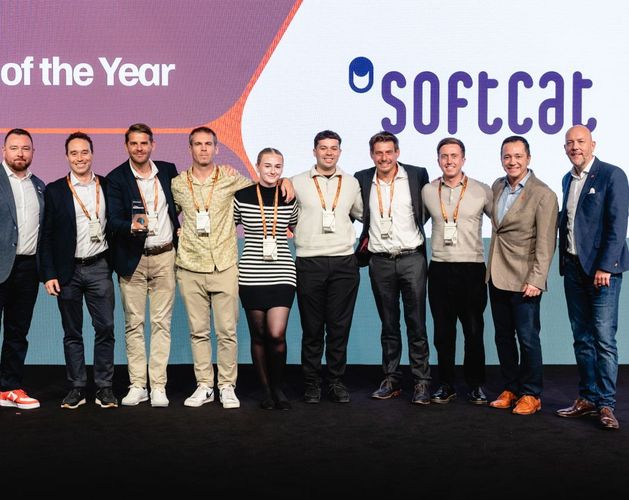
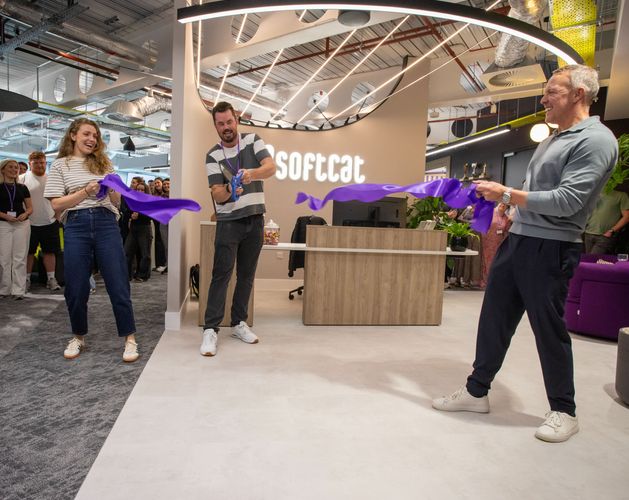
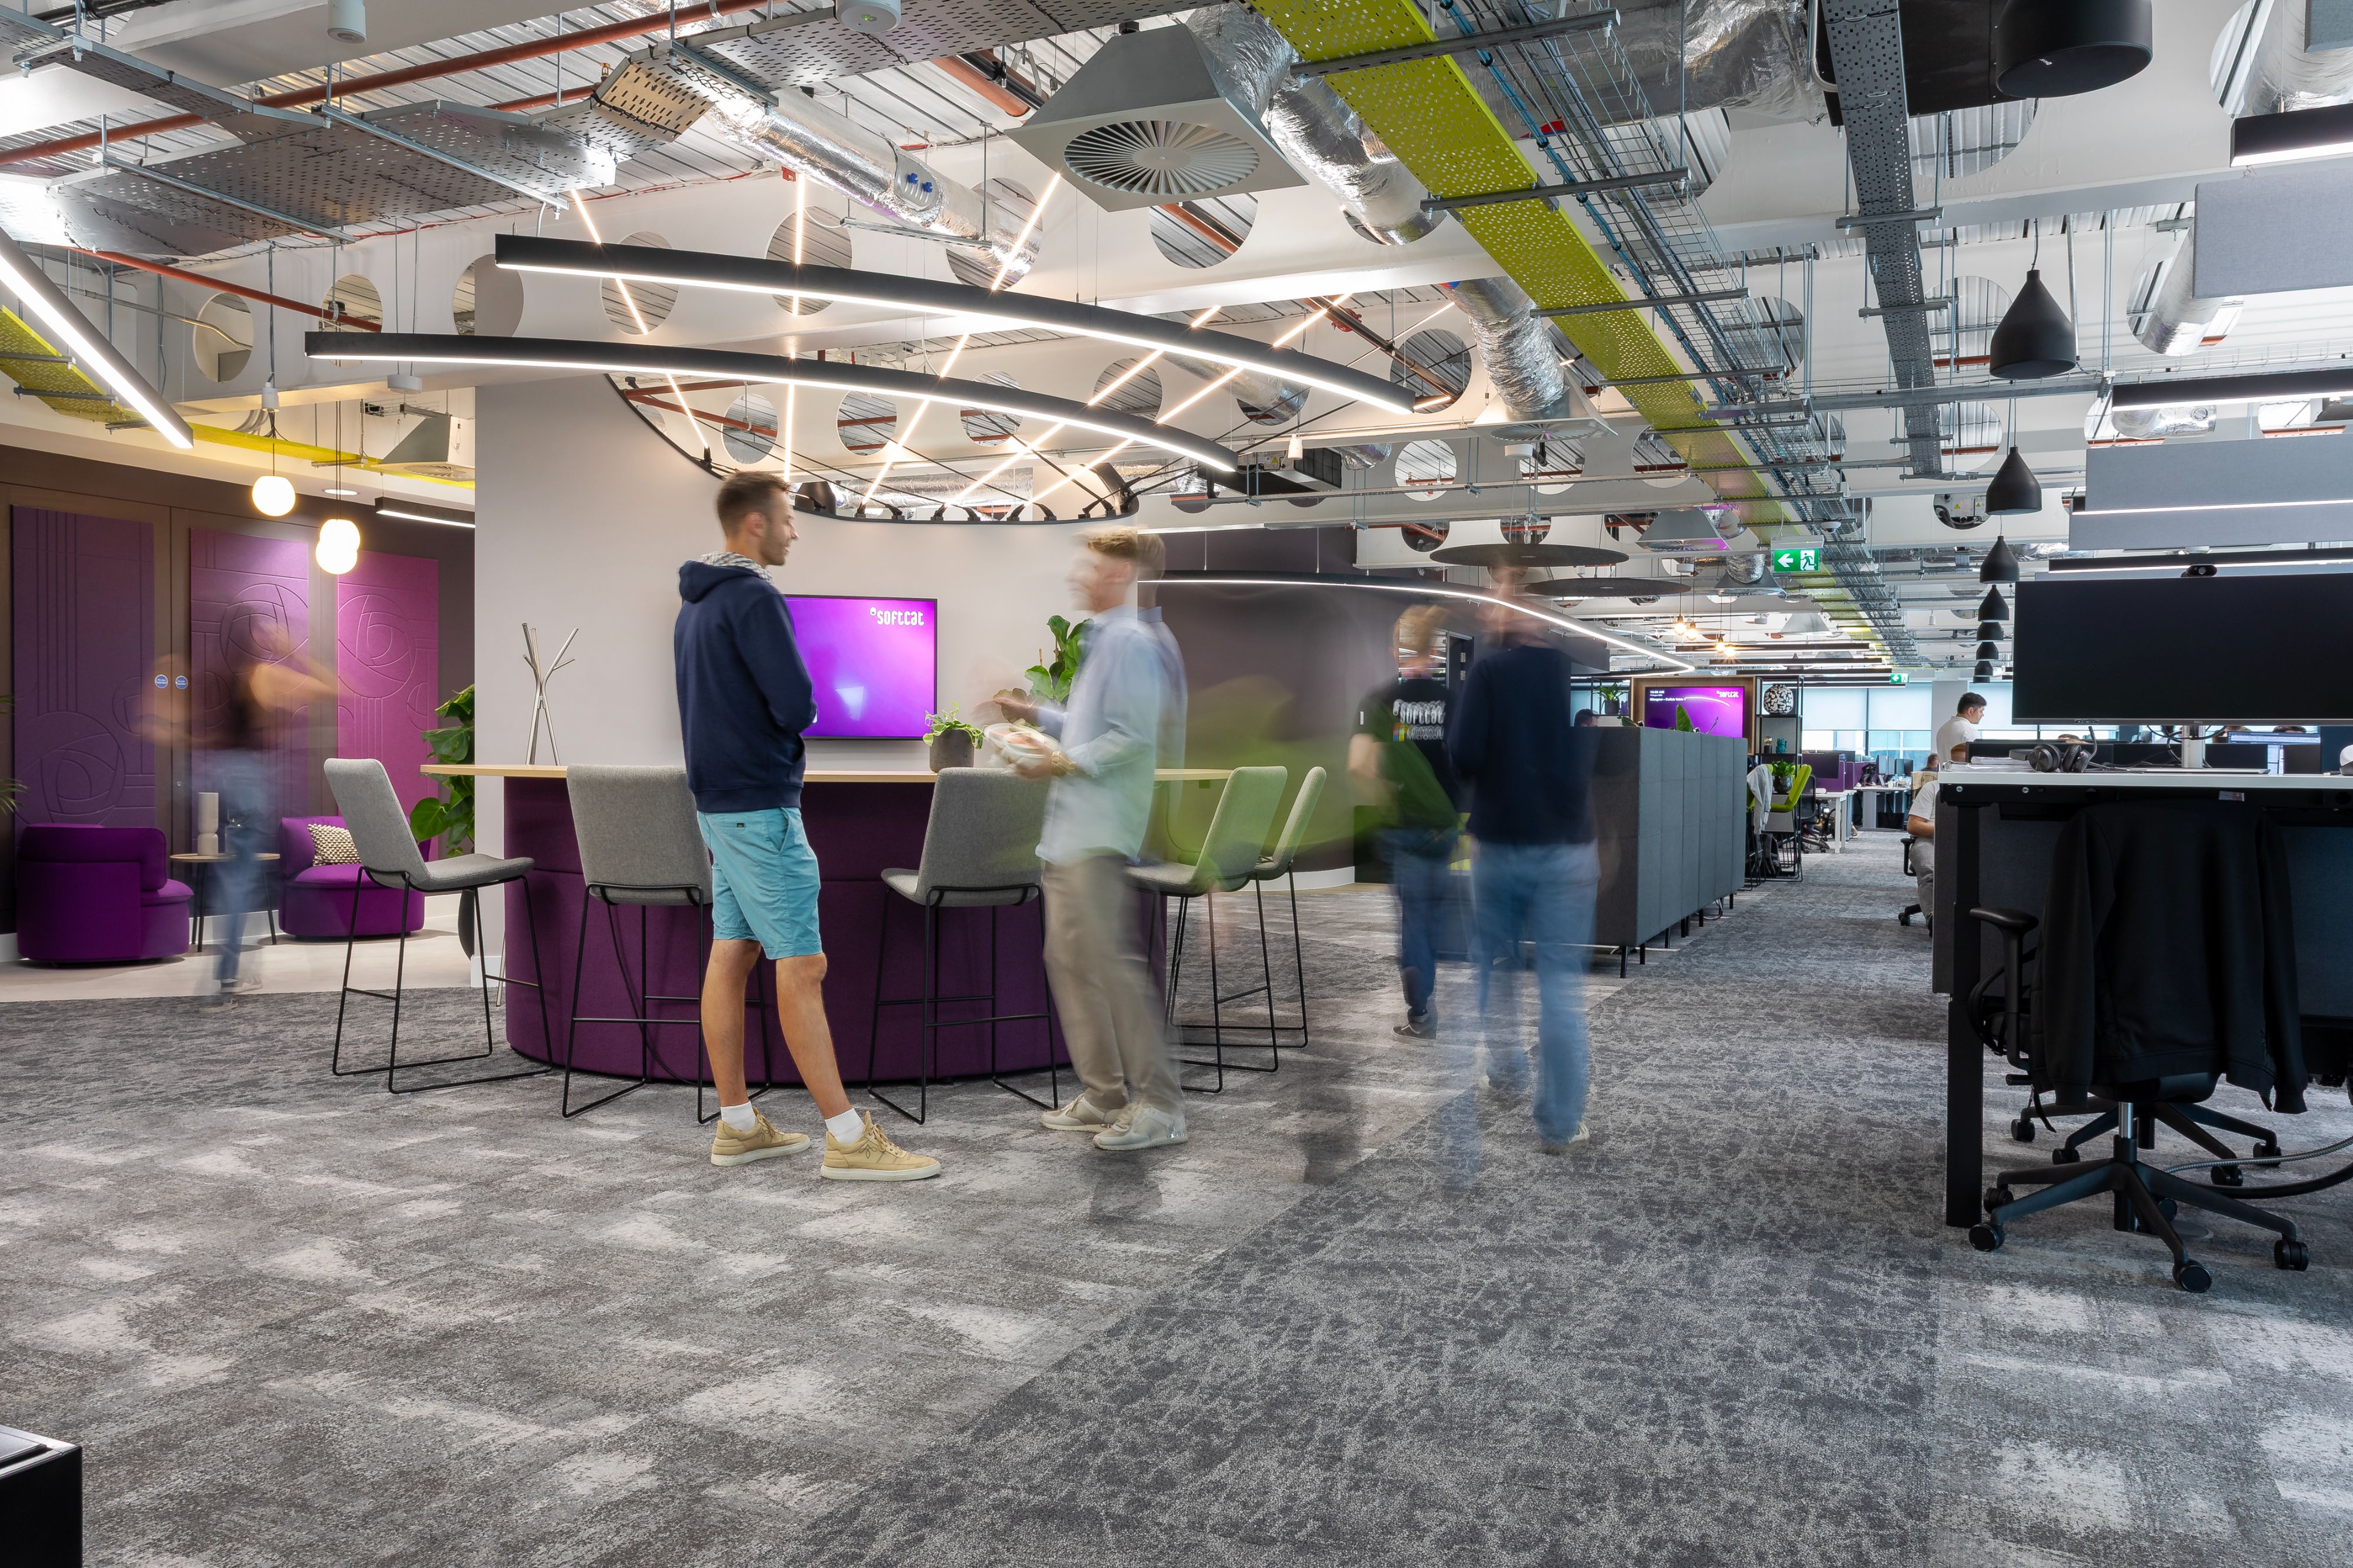 "Strong customer relationships are built on collaboration, trust and spending time together, and our new Glasgow office gives us an even better space to do exactly that. Whether we're hosting customers, working alongside partners or bringing colleagues together to solve challenges, this move creates more opportunities to connect and deliver great outcomes. We're looking forward to welcoming customers into our new home and continuing to support their success from the heart of Glasgow." - Tom Hough, Sales Manager
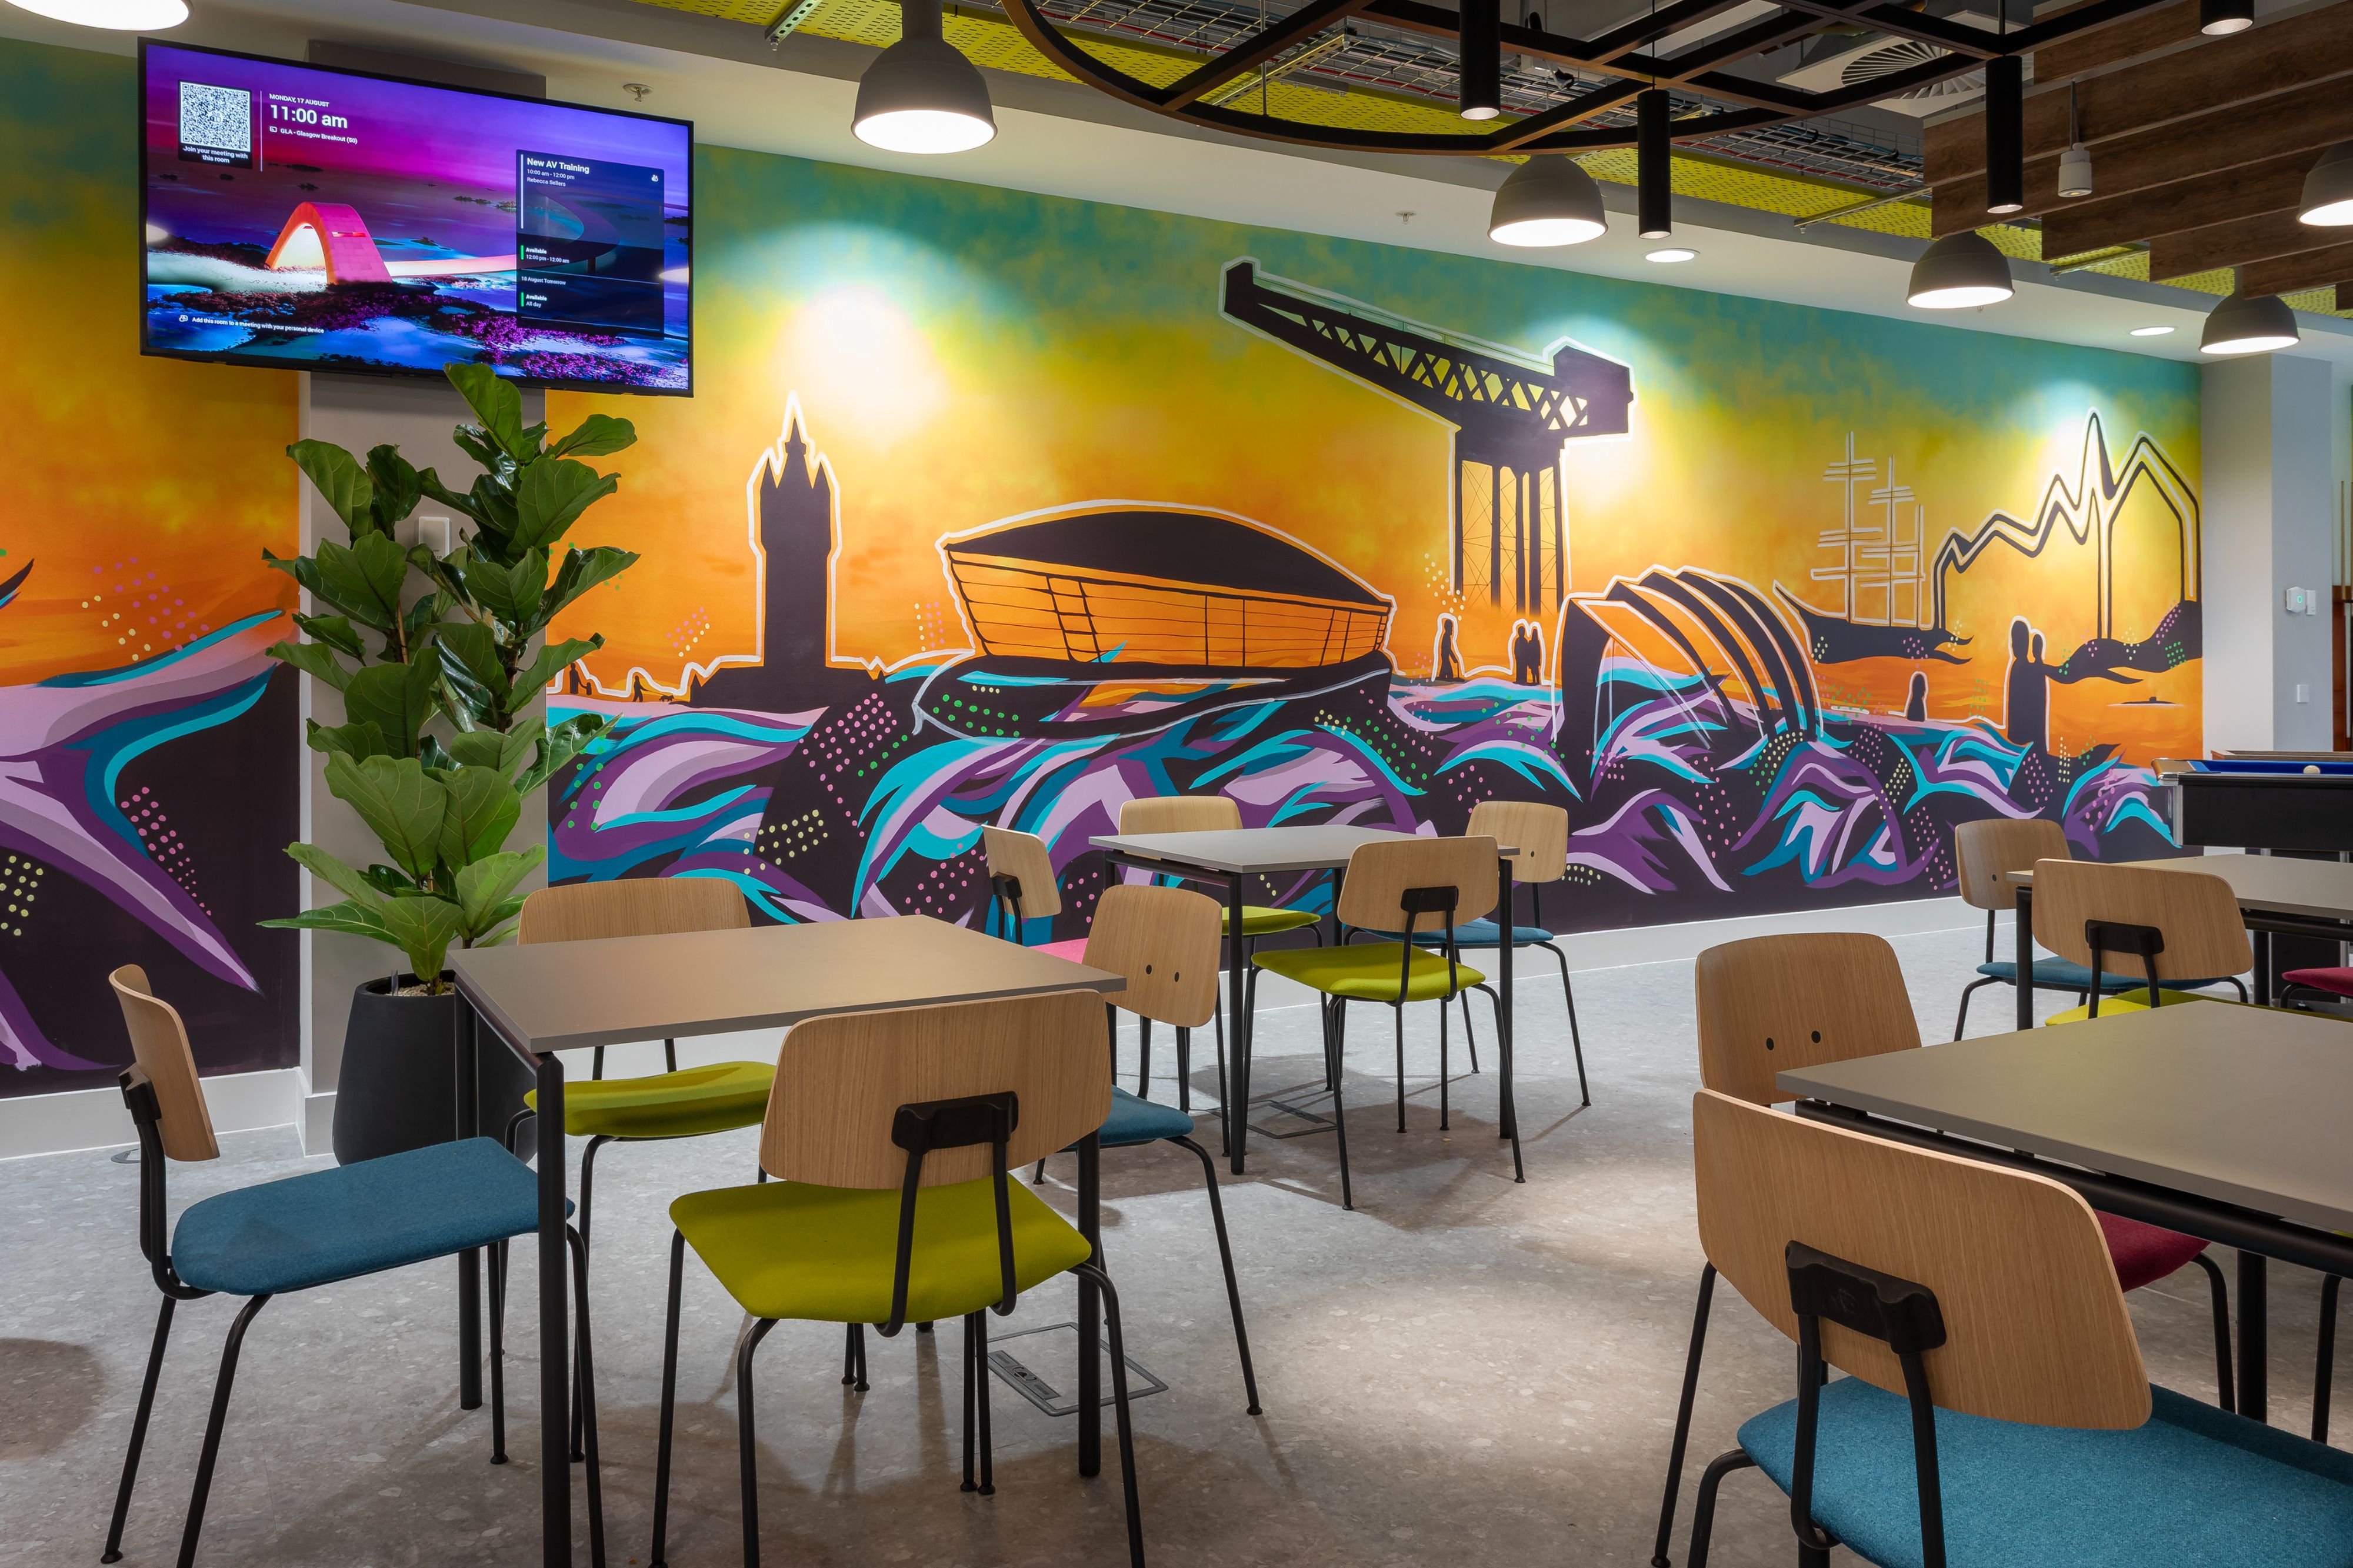 "As part of the Glasgow office relocation, we're delivering a major IT refresh, introducing Dell monitors, the latest Cisco meeting room and network technology, and LapSafe smart lockers. Alongside additional meeting rooms, new collaboration spaces, and a multifunction breakout area, we're also bringing in Soundtrack as our audio system and Sony digital signage powered by Appspace. Together, these enhancements will create a smarter, more connected, and future-ready office experience aligned with the latest standards across our office estate." - Rebecca Sellers, Technical Delivery Manager
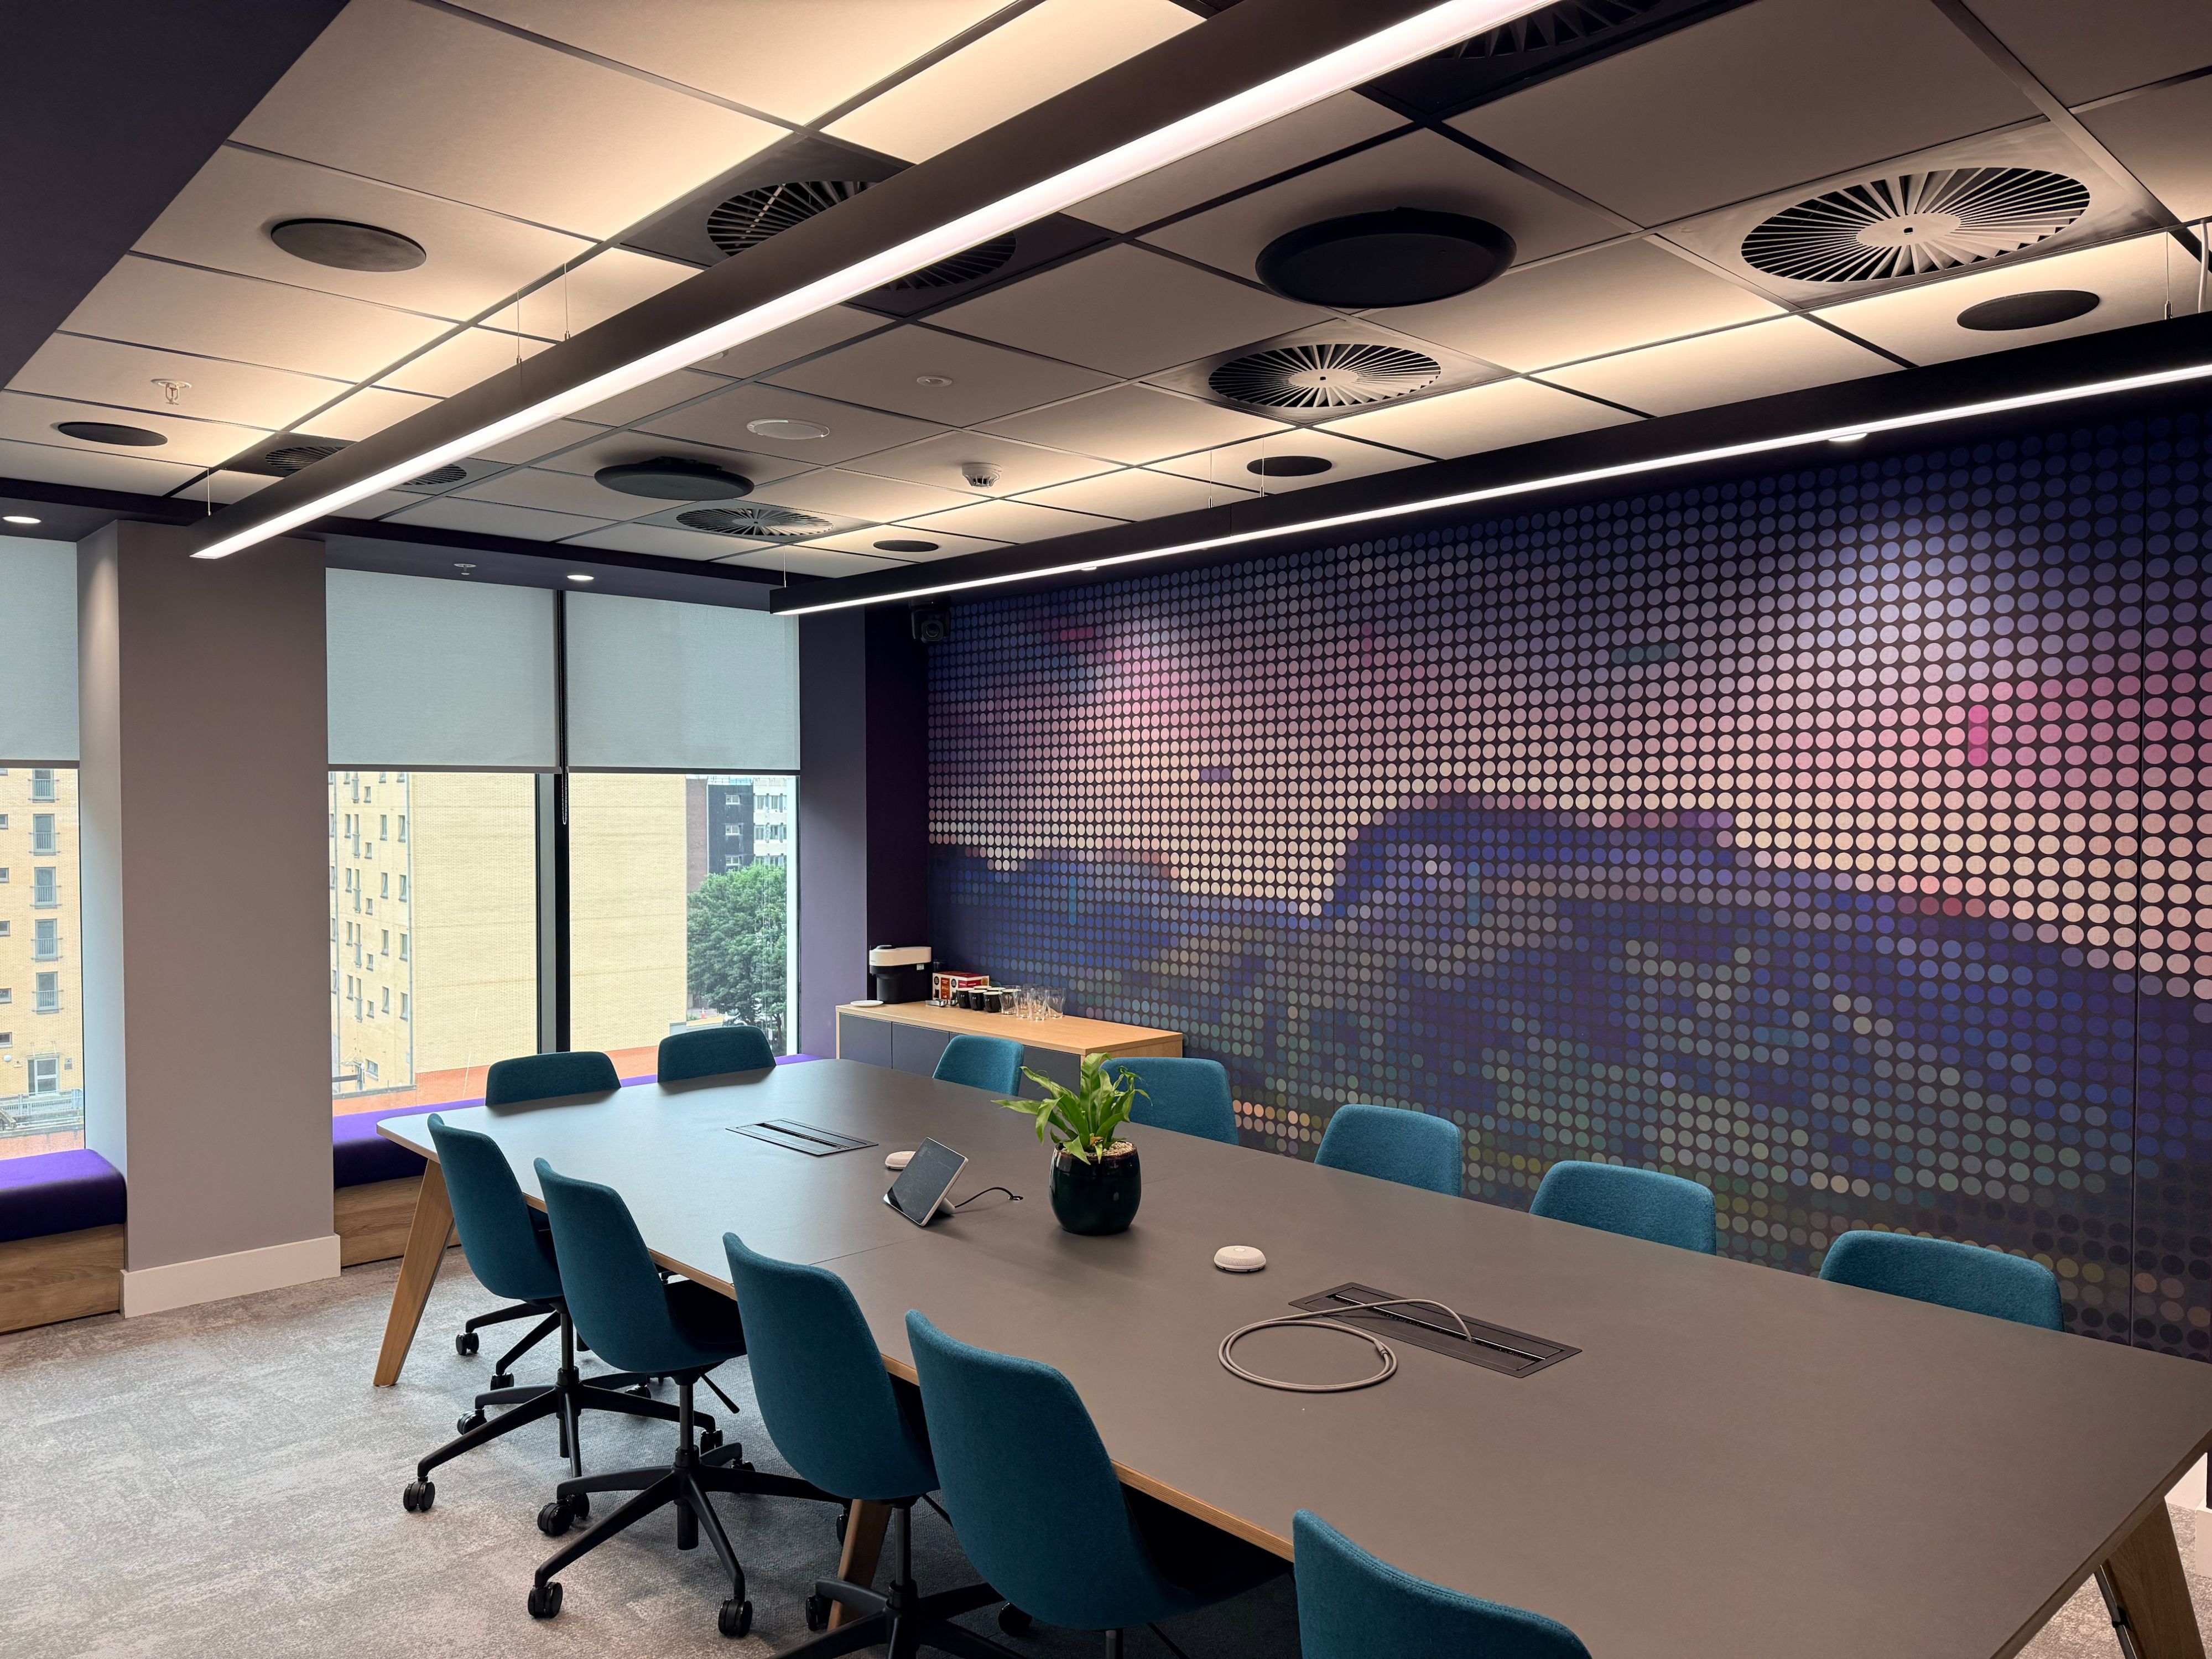 “The new office looks absolutely amazing! So much thought and effort have gone into creating such a brilliant space, and I’m really excited to see it come to life and have everyone enjoying it!” - Katt Sharpe, Workplace Coordinator

Prompts
Click prompts to add them under the company line, click again to take one out, then copy the result into your AI chat. Shared by Asian Century Stocks and Uncovered Thai Stocks. Thank you.
Softcat plc (ticker SCT), listed in United Kingdom.
Copied
ETFs Holding Softcat plc
Exchange-traded funds whose newest published daily portfolio holds one of the company's listings, largest weight first.
| ETF | Weight in ETF | Shares | Market value | As of |
|---|---|---|---|---|
| AVDS | 0.13% | 22,173 | $ 478.271K | Nov 16, 2026 |
| DFIS | 0.09% | 230,508 | $ 5.169M | Nov 12, 2026 |
| AVDV | 0.06% | 544,504 | $ 11.745M | Nov 16, 2026 |
| DFSI | 0.05% | 25,883 | $ 580.409K | Nov 12, 2026 |
| DXIV | 0.03% | 3,247 | $ 72.812K | Nov 12, 2026 |
| DFIC | 0.03% | 206,276 | $ 4.626M | Nov 12, 2026 |
| AVDE | 0.03% | 239,374 | $ 5.163M | Nov 16, 2026 |
| AVSD | 0.03% | 5,850 | $ 126.184K | Nov 16, 2026 |
| DFAX | 0.02% | 98,659 | $ 2.212M | Nov 12, 2026 |
| DFAI | 0.02% | 138,781 | $ 3.112M | Nov 12, 2026 |
| AVIV | 0.01% | 8,613 | $ 185.782K | Nov 16, 2026 |